ron plain april 22, 2015. u.s. retail pork prices, 2000-2015 source: usda/ers
TRANSCRIPT

Ron Plain
April 22, 2015

U.S. Retail Pork Prices, 2000-2015
200
250
300
350
400
450Ja
n 0
0
Jan
01
Jan
02
Jan
03
Jan
04
Jan
05
Jan
06
Jan
07
Jan
08
Jan
09
Jan
10
Jan
11
Jan
12
Jan
13
Jan
14
Jan
15
Cents Per Pound
Source: USDA/ERS

Cost of Slaughter Hog Production, 2000-2015
35
40
45
50
55
60
65
70
75
8020
00
2001
2002
2003
2004
2005
2006
2007
2008
2009
2010
2011
2012
2013
2014
2015
2016
Marketing Month
$ Per Live Cwt
Actual Forecast
Source: Iowa State University & University of Missouri

U.S. Hog Imports from Canada
0
100,000
200,000
300,000
400,000
500,000
600,000
700,000
800,00019
97
1998
1999
2000
2001
2002
2003
2004
2005
2006
2007
2008
2009
2010
2011
2012
2013
2014
2015
Head per mo.
Slaughter Hogs Feeders Pigs
Source: USDA/ERS

U.S. Pork Imports & Exports as % of U.S. Pork Production, 2006-2015
Monthly Carcass Weight Equivalent
0
5
10
15
20
25
30
Ja
n 0
6A
PR
JU
LO
CT
Ja
n 0
7A
PR
JU
LO
CT
Ja
n 0
8A
PR
JU
LO
CT
Ja
n 0
9A
pr
Ju
lO
ct
Ja
n 1
0A
pr
Ju
lO
ct
Ja
n 1
1A
pr
Ju
lO
ct
Ja
n 1
2A
pr
Ju
lO
ct
Ja
n 1
3A
pr
Ju
lO
ct
Ja
n 1
4A
pr
Ju
lO
ct
20
15
% of Production
Imports Exports
Source: USDA/ERS

New PEDV & PDCoV Cases by WeekNAHLN Reports
0
50
100
150
200
250
300
350
4-1
5 5
-06
5-2
7 6
-16
7-0
7 7
-28
8-1
8 9
-08
9-2
9 1
0-20
11-
10 1
2-01
12-
22 0
1-12
02-
02 0
2-23
03-
16 0
4-06
04-
27 0
5-18
06-
08 0
6-29
07-
20 0
8-10
08-
31 0
9-21
10-
12 1
1-02
11-
23 1
2-14
01/
04 0
1/25
02/
15 0
3/08
2013-2015 Week Ending
New Cases
PDCoV
PEDV
Source: AASV & NAHLN
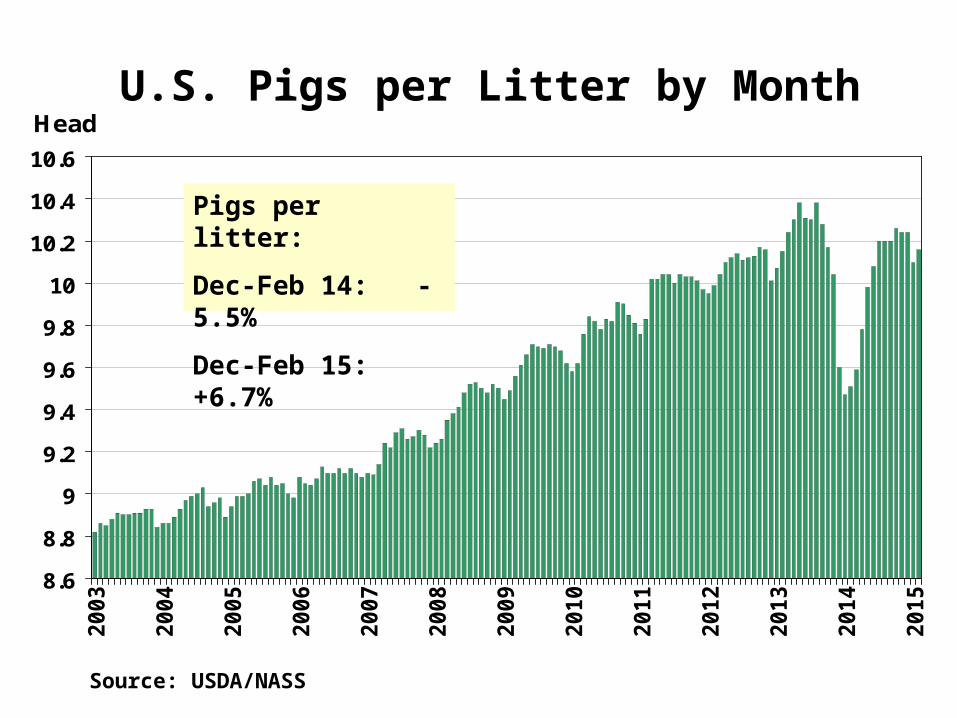
U.S. Pigs per Litter by Month
8.6
8.8
9
9.2
9.4
9.6
9.8
10
10.2
10.4
10.6
20
03
20
04
20
05
20
06
20
07
20
08
20
09
20
10
20
11
20
12
20
13
20
14
20
15
Head
Pigs per litter:
Dec-Feb 14: - 5.5%
Dec-Feb 15: +6.7%
Source: USDA/NASS

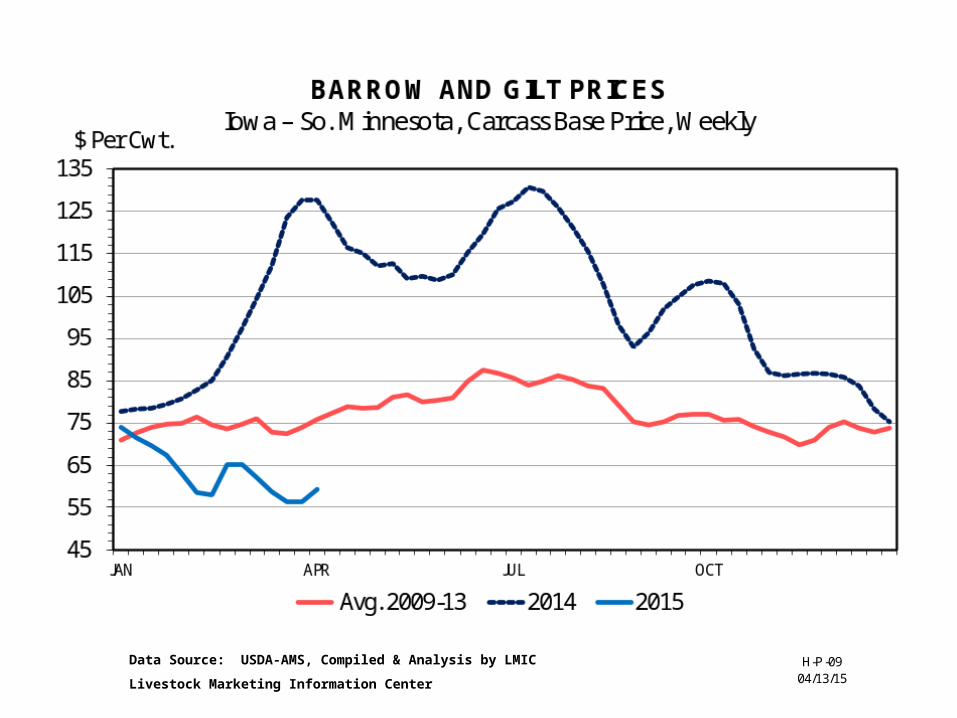
Barrow & Gilt Live WeightsIowa-Minnesota Weekly Average
265
270
275
280
285
290
Pounds
2013
2014
2015
record
2014 average was 284.4 lbs, up 8.5 lbs from 2013
Source: USDA/AMS

H-S-0504/17/15
Data Source: USDA-AMS & USDA-NASS
Livestock Marketing Information Center
2014 hog slt - 4.6%2015 YTD slt + 6.8%

March Hog InventoryAll Hogs & Pigs 107.2 Kept for Breeding 102.2 Kept for Marketing 107.7 Under 50 lbs 109.4 50-119 lbs. 106.6 120-179 lbs. 106.0 180 lbs. and over 108.9 Jun-Aug Farrowings 103.5 Sep-Nov Farrowings 103.3 Dec-Feb Farrowings 102.4 Mar-May Farrowing Intentions 102.1 Jun-Aug Farrowing Intentions 97.9
Source: USDA - NASS

Sows Farrowed by Quarter - U.S.
-6
-4
-2
0
2
4
6
8
DJ
F9
9
DJ
F0
0
DJ
F0
1
DJ
F0
2
DJ
F0
3
DJ
F0
4
DJ
F0
5
DJ
F0
6
DJ
F0
7
DJ
F0
8
DJ
F0
9
DJ
F1
0
DJ
F1
1
DJ
F1
2
DJ
F1
3
DJ
F1
4
DJ
F1
5
% change from yr. ago
Source: USDA/NASS
H-P-0904/13/15
Data Source: USDA-AMS, Compiled & Analysis by LMIC
Livestock Marketing Information Center
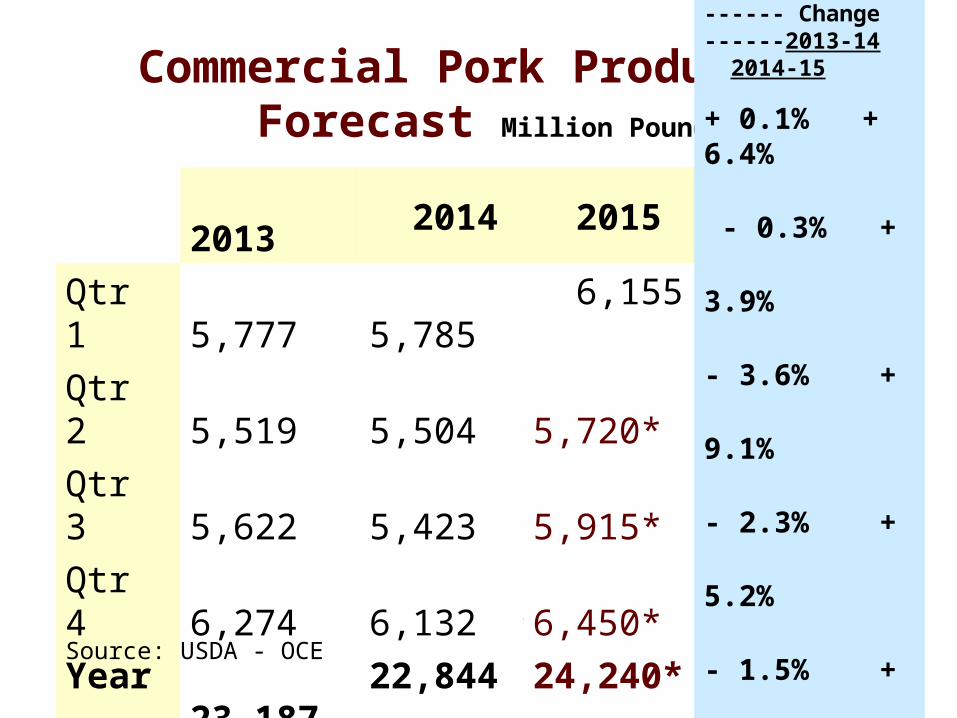
Commercial Pork Production Forecast Million Pounds
*Forecast
2013 2014 2015
Qtr 1 5,777 5,785 6,155
Qtr 2 5,519 5,504 5,720*
Qtr 3 5,622 5,423 5,915*
Qtr 4 6,274 6,132 6,450*
Year 23,187 22,844 24,240*
------ Change ------2013-14 2014-15
+ 0.1% + 6.4%
- 0.3% + 3.9%
- 3.6% + 9.1%
- 2.3% + 5.2%
- 1.5% + 6.1%
Source: USDA - OCE

Iowa-Minn. Hog Price ForecastNegotiated Base Price Per Carcass Hundredweight
2012 2013 2014 2015
Qtr 1 $84.78 $80.17 $ 95.15 $64.10
Qtr 2 $85.45 $89.33 $115.67 $68-72*
Qtr 3 $83.15 $95.37 $111.79 $68-72*
Qtr 4 $79.93 $82.36 $ 88.65 $62-66*
Year $83.36 $86.87 $102.83 $66-70*
*Forecast price – prior day purchased

Net Slaughter Hog Price,Monthly Average 2002-2015
30
50
70
90
110
130
150
Jan
02
Jan
03
Jan
04
Jan
05
Jan
06
Jan
07
Jan
08
Jan
09
Jan
10
Jan
11
Jan
12
Jan
13
Jan
14
Jan
15
Jan
16
Dollars per cwt.
Cash Futures

Iowa Farrow to Finish Profits, 2006-2015Iowa State University Calculations
-60
-40
-20
0
20
40
60
80
100
20
06
20
07
20
08
20
09
20
10
20
11
20
12
20
13
20
14
20
15
20
16
$ Per Head
Actual Forecast
Forecast Source: Ron Plain, University of Missouri