ross river flood study - city of townsville
TRANSCRIPT
OWNSVILLE QLD 4810
103 WALKER STREET, TOWNSVILLE QLD 4810 ▪ PO BOX 1268, TOWNSVILLE QLD 4817
ROSS RIVER FLOOD STUDY BASE-LINE FLOODING ASSESSMENT Volume 1 JANUARY 2013
ROSS RIVER FLOOD STUDY BASELINE FLOODING ASSESSMENT
ABN >> 44 741 992 072 A
Quality Information Prepared for: Information Prepared by: Wesley Bailey Document TOWNSVILLE CITY COUNCIL
DW ID s:\infrastructure planning\stormwater-flooding\projects\townsville flood constraints map\reports\rossriver\rossriver-baseline.doc
Date 04/01/2013
Revision History
Revision Revision Date Details
Authorised
Name/Position Signature
A 19/04/2011 Draft for Revision Wesley Bailey
B 21/06/2012 Final Report Wesley Bailey
C 04/01/2013 Amended Final Report Graham Anderson
Townsville City Council ABN 44 741 992 072 103 Walker Street Townsville QLD 4810 PO BOX 1268 Townsville QLD 4810 Telephone: 4727 9000 Facsimile: 4727 9050 Email: [email protected] © TOWNSVILLE CITY COUNCIL 2010 This document is and shall remain the property of TOWNSVILLE CITY COUNCIL. The document may only be used for the purposes for which it was commissioned and in accordance with the Terms of Engagement for the Commission. Unauthorised use of this document in any form whatsoever is prohibited.

ROSS RIVER FLOOD STUDY BASELINE FLOODING ASSESSMENT
ABN >> 44 741 992 072
B
Table of Contents
Executive Summary..................................................................................................... i
Glossary ..................................................................................................................... iv
1.0 Introduction .....................................................................................................1
1.1 Overview .......................................................................................................1 1.2 Study Area ....................................................................................................1 1.3 Scope of Works .............................................................................................4 1.4 Study Approach.............................................................................................4
2.0 Available Data..................................................................................................5
2.1 Historical Rainfall Records.............................................................................5 2.2 Stream Gauging Records ..............................................................................9 2.3 Topographic Data..........................................................................................9 2.4 Cadastral Data ............................................................................................ 11 2.5 Structure Design Drawings.......................................................................... 11 2.6 Previous Engineering Reports ..................................................................... 11
3.0 Hydrological Assessment............................................................................. 14
3.1 Catchment Overview ................................................................................... 14 3.2 Hydrological Modelling Software ................................................................. 14 3.3 Catchment Delineation ................................................................................ 15 3.4 Sub-Catchment Parameters ........................................................................ 17 3.5 Dam Storage and Discharge Relationships ................................................. 23 3.6 Model Verification........................................................................................ 24 3.7 Design Rainfall ............................................................................................ 37 3.8 Rainfall Loss Values.................................................................................... 38 3.9 Initial Drawdown .......................................................................................... 38 3.10 Design Flood Flows..................................................................................... 40
4.0 Hydraulic Assessment.................................................................................. 41
4.1 Floodplain Overview.................................................................................... 41 4.2 MIKE FLOOD .............................................................................................. 41 4.3 Model Setup ................................................................................................ 42 4.4 Weir Rating Curve Review........................................................................... 46 4.5 Structure Verification ................................................................................... 48 4.6 Model Calibration ........................................................................................ 49 4.7 Design Flood Assessment ........................................................................... 55
5.0 Baseline Flooding Summary ........................................................................ 57
5.1 Flooding Results.......................................................................................... 57 5.2 Hydraulic Grade Line................................................................................... 61 5.3 Flow Distributions ........................................................................................ 65 5.4 Floodplain Hazard ....................................................................................... 68 5.5 Floodplain Planning Considerations ............................................................ 73 5.6 Emergency Management Considerations .................................................... 77 5.7 Tailwater Conditions.................................................................................... 81
6.0 Impact of Climate Change on Flooding ....................................................... 84
ROSS RIVER FLOOD STUDY BASELINE FLOODING ASSESSMENT
ABN >> 44 741 992 072
C
6.1 Sea Level Rise ............................................................................................ 84 6.2 Sea Level Rise and Extreme Rainfall Intensities.......................................... 87
7.0 Summary and Conclusions .......................................................................... 91
7.1 Floodplain Hydraulic Mechanisms ............................................................... 92 7.2 Inundation of Residential Properties ............................................................ 92 7.3 Floodplain Hazard ....................................................................................... 93 7.4 Floodplain Planning..................................................................................... 93 7.5 Emergency Management ............................................................................ 93 7.6 Impact of Higher Tides and Sea Level Rise................................................. 94 7.7 Impact of Climate Change ........................................................................... 94
8.0 References..................................................................................................... 95
Appendix A – Ross River Downstream Sub-Catchments ....................................... A
Appendix B – Flood Maps ......................................................................................... B
Appendix C – Long Sections .................................................................................... C
ROSS RIVER FLOOD STUDY BASELINE FLOODING ASSESSMENT
ABN >> 44 741 992 072
i
Executive Summary
The Ross River Flood Study – Baseline Flooding Assessment has been undertaken as part of Townsville City Council’s City Wide Flood Constraints Project. The study builds on previous hydrologic and hydraulic analysis projects for Ross River and incorporates the latest aerial survey topographic data as well as recent underwater survey to form up to date hydrologic and hydraulic flood models for Ross River. In finalising this report, a review of the gate operations for Ross River Dam has been undertaken to provide improved downstream flood immunity. The results of this study inform subsequent stages of the City Wide Flood Constraints Project, while the hydraulic model developed provides an efficient representation of flows within lower Ross River, capable of being run quickly to inform dam outflow management, provided expertise and resources are available. The study examines catchment flows from the entire Ross River catchment – both upstream and downstream of the dam. The hydraulics of the floodplain downstream of the dam have been analysed using a hydraulic model. Separate hydrological models have been developed for the catchments upstream and downstream of the dam. A RORB hydrological model has been used to represent the catchment upstream of the dam and has been calibrated to the December 2010, January 2009, February 2007 and January 1998 floods. Downstream of the dam, an XP-RAFTS model has been developed that has been verified to hand calculations. A MIKE FLOOD, coupled 2D/1D model has been used to represent the hydraulics of the river channel and floodplain downstream of the dam. The MIKE FLOOD model was calibrated to the December 2010, January 2009 and February 2007 floods. Design flood assessment has reviewed the 2, 5, 10, 20, 50, 100, 200, 500, 1000 and 2000 Year Average Recurrence Interval (ARI) floods, in addition to the Probable Maximum Flood (PMF). In developing and calibrating the MIKE FLOOD model, it was identified that the previous rating curves for Black and Aplins Weir developed from hydraulic modelling as part of the Ross River Hydraulic Study (Maunsell McIntyre, 2001), under estimated flow for given water levels. Revised rating curves have been proposed for these weirs as part of this study. Results of the flood modelling have been used to assess a range of issues including:
• floodplain hydraulic mechanisms;
• approximate numbers of residential properties impacted by Ross River flooding;
• overflows from the main river channel for given frequency floods;
• hazard zones within the floodplain;
• floodplain planning considerations;
• emergency management including flood warning and prediction, road closures and flood immunity of key emergency management sites;
• impacts on flooding of climate change A summary of the results of the base-line flooding assessment are provided in Table EX-1 based on the revised gate operations for Ross River Dam. Presently within Townsville the DFE is the 50 Year ARI flood, while the state Planning Policy recommends a flood risk equivalent to the 100 Year ARI flood is achieved. The 50 Year ARI flood was reviewed and compared to the 100 Year ARI flood. The

ROSS RIVER FLOOD STUDY BASELINE FLOODING ASSESSMENT
ABN >> 44 741 992 072
ii
comparison identified that prior to the review of the Ross River Dam gate operations there was a significant increase in the extents of inundation for the 100 Year ARI flood, which would impact the number of residential properties potentially inundated. This significant increase in the flood risk was the main driver for reviewing the gate operations of Ross River Dam. The revised flood model results indcated that there was no longer the disparity between the 50 and 100 Year ARI flood risks. From the review of the flooding mechanisms it was determined that there is an overbank flow across the former DPI land in Oonoonba, that initiates in the 20 Year ARI. By the 100 Year ARI, this overbank flow accounts for 15% of the total flow in the river at this location, with the percentage increasing with increased magnitude in river flows. A review of water depths above ground levels at Key Sites for emergency management has identified:
• a total of 30 key sites may be inundated in the Ross River PMF;
• no key response centres (Police, Fire, Ambulance,) are inundated in the 500 Year ARI.
The Ross River flood model developed for the project has been used to undertake an assessment of the changes to downstream flooding as a result of changes to the Ross River Dam gate operations. The change in dam gate operations has resulted in reductions in dam outflows for smaller events up to the 200 Year ARI, with some increases in dam outflows for events greater than 500 Year ARI. The increase in flows is greatest for the 1000 Year ARI and is progressively less for the larger flood events. For the 100 Year ARI, the change in gate operations has reduced the number of residential properties potentially impacted from 960 down to approximately 90. An assessment for the potential for climate change to impact on flooding has been undertaken. To account for climate change conditions in 2100, the model was updated to:
• include the sea level rise of 0.88 m on the Mean High Water Springs level to give a resulting average sea level of 2.134 m AHD; and
• increase rainfall intensities by 15% in accordance with Increasing Queensland’s resilience to inland flooding in a changing climate (DERM, 2010)
The results of the modelling indicate that the 50 Year ARI flood under a climate change scenario would cause overflows into residential areas of Railway Estate that previously did not occur until the existing 100 Year ARI flood. For the 100 Year ARI there are additional overflows through Fairfield Waters and increases in the number of residential lots inundated in Railway Estate, South Townsville, Oonoonba, and Fairfield Waters.
ROSS RIVER FLOOD STUDY BASELINE FLOODING ASSESSMENT
ABN >> 44 741 992 072
iii
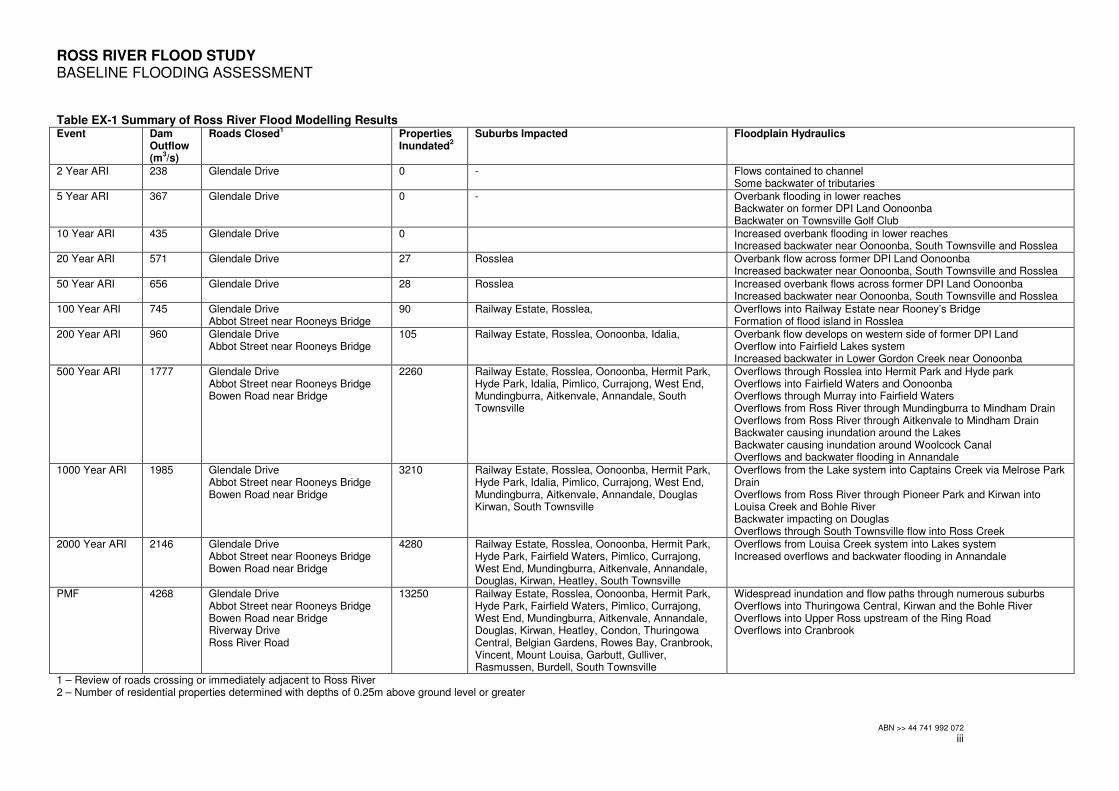
Table EX-1 Summary of Ross River Flood Modelling Results Event Dam
Outflow (m
3/s)
Roads Closed1 Properties
Inundated2
Suburbs Impacted Floodplain Hydraulics
2 Year ARI 238 Glendale Drive 0 - Flows contained to channel Some backwater of tributaries
5 Year ARI 367 Glendale Drive 0 - Overbank flooding in lower reaches Backwater on former DPI Land Oonoonba Backwater on Townsville Golf Club
10 Year ARI 435 Glendale Drive 0 Increased overbank flooding in lower reaches Increased backwater near Oonoonba, South Townsville and Rosslea
20 Year ARI 571 Glendale Drive 27 Rosslea Overbank flow across former DPI Land Oonoonba Increased backwater near Oonoonba, South Townsville and Rosslea
50 Year ARI 656 Glendale Drive 28 Rosslea Increased overbank flows across former DPI Land Oonoonba Increased backwater near Oonoonba, South Townsville and Rosslea
100 Year ARI 745 Glendale Drive Abbot Street near Rooneys Bridge
90 Railway Estate, Rosslea, Overflows into Railway Estate near Rooney’s Bridge Formation of flood island in Rosslea
200 Year ARI 960 Glendale Drive Abbot Street near Rooneys Bridge
105 Railway Estate, Rosslea, Oonoonba, Idalia, Overbank flow develops on western side of former DPI Land Overflow into Fairfield Lakes system Increased backwater in Lower Gordon Creek near Oonoonba
500 Year ARI 1777 Glendale Drive Abbot Street near Rooneys Bridge Bowen Road near Bridge
2260 Railway Estate, Rosslea, Oonoonba, Hermit Park, Hyde Park, Idalia, Pimlico, Currajong, West End, Mundingburra, Aitkenvale, Annandale, South Townsville
Overflows through Rosslea into Hermit Park and Hyde park Overflows into Fairfield Waters and Oonoonba Overflows through Murray into Fairfield Waters Overflows from Ross River through Mundingburra to Mindham Drain Overflows from Ross River through Aitkenvale to Mindham Drain Backwater causing inundation around the Lakes Backwater causing inundation around Woolcock Canal Overflows and backwater flooding in Annandale
1000 Year ARI 1985 Glendale Drive Abbot Street near Rooneys Bridge Bowen Road near Bridge
3210 Railway Estate, Rosslea, Oonoonba, Hermit Park, Hyde Park, Idalia, Pimlico, Currajong, West End, Mundingburra, Aitkenvale, Annandale, Douglas Kirwan, South Townsville
Overflows from the Lake system into Captains Creek via Melrose Park Drain Overflows from Ross River through Pioneer Park and Kirwan into Louisa Creek and Bohle River Backwater impacting on Douglas Overflows through South Townsville flow into Ross Creek
2000 Year ARI 2146 Glendale Drive Abbot Street near Rooneys Bridge Bowen Road near Bridge
4280 Railway Estate, Rosslea, Oonoonba, Hermit Park, Hyde Park, Fairfield Waters, Pimlico, Currajong, West End, Mundingburra, Aitkenvale, Annandale, Douglas, Kirwan, Heatley, South Townsville
Overflows from Louisa Creek system into Lakes system Increased overflows and backwater flooding in Annandale
PMF 4268 Glendale Drive Abbot Street near Rooneys Bridge Bowen Road near Bridge Riverway Drive Ross River Road
13250 Railway Estate, Rosslea, Oonoonba, Hermit Park, Hyde Park, Fairfield Waters, Pimlico, Currajong, West End, Mundingburra, Aitkenvale, Annandale, Douglas, Kirwan, Heatley, Condon, Thuringowa Central, Belgian Gardens, Rowes Bay, Cranbrook, Vincent, Mount Louisa, Garbutt, Gulliver, Rasmussen, Burdell, South Townsville
Widespread inundation and flow paths through numerous suburbs Overflows into Thuringowa Central, Kirwan and the Bohle River Overflows into Upper Ross upstream of the Ring Road Overflows into Cranbrook
1 – Review of roads crossing or immediately adjacent to Ross River 2 – Number of residential properties determined with depths of 0.25m above ground level or greater
ROSS RIVER FLOOD STUDY BASELINE FLOODING ASSESSMENT
ABN >> 44 741 992 072
iv
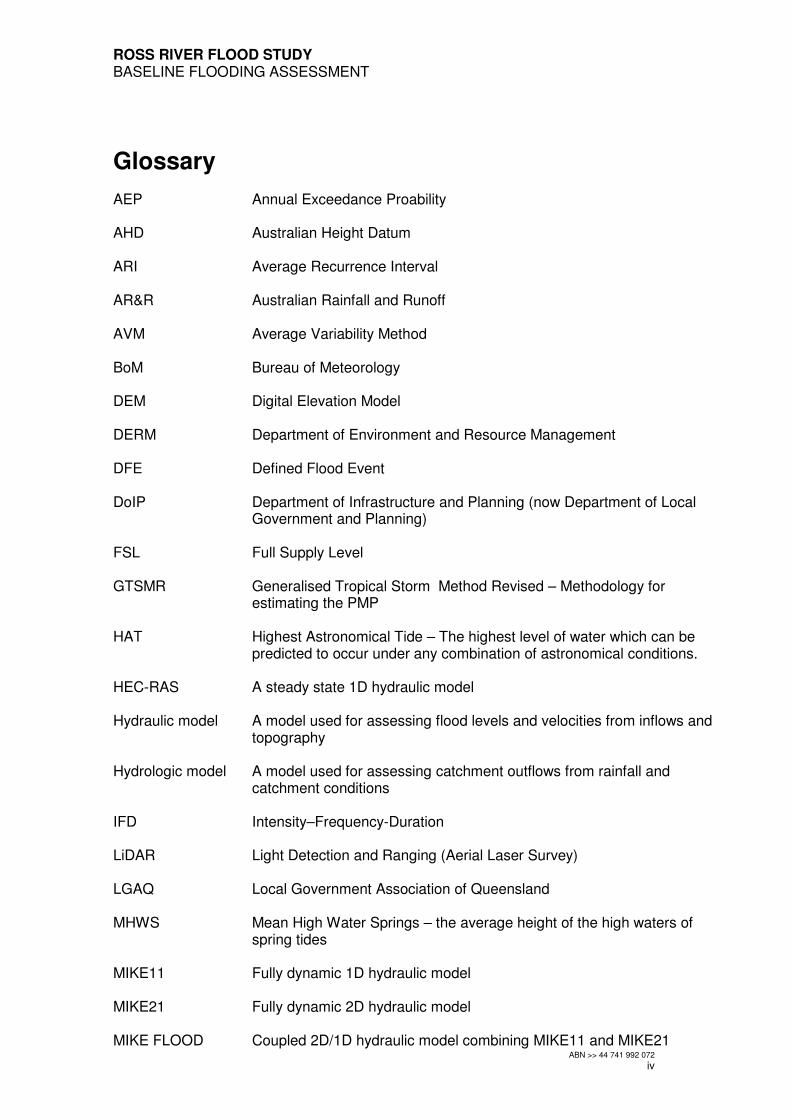
Glossary
AEP Annual Exceedance Proability AHD Australian Height Datum ARI Average Recurrence Interval AR&R Australian Rainfall and Runoff AVM Average Variability Method BoM Bureau of Meteorology DEM Digital Elevation Model DERM Department of Environment and Resource Management DFE Defined Flood Event DoIP Department of Infrastructure and Planning (now Department of Local
Government and Planning) FSL Full Supply Level GTSMR Generalised Tropical Storm Method Revised – Methodology for
estimating the PMP HAT Highest Astronomical Tide – The highest level of water which can be
predicted to occur under any combination of astronomical conditions. HEC-RAS A steady state 1D hydraulic model Hydraulic model A model used for assessing flood levels and velocities from inflows and
topography Hydrologic model A model used for assessing catchment outflows from rainfall and
catchment conditions IFD Intensity–Frequency-Duration LiDAR Light Detection and Ranging (Aerial Laser Survey) LGAQ Local Government Association of Queensland MHWS Mean High Water Springs – the average height of the high waters of
spring tides MIKE11 Fully dynamic 1D hydraulic model MIKE21 Fully dynamic 2D hydraulic model MIKE FLOOD Coupled 2D/1D hydraulic model combining MIKE11 and MIKE21

ROSS RIVER FLOOD STUDY BASELINE FLOODING ASSESSMENT
ABN >> 44 741 992 072
v
Pluviometer Automated sampling device for measuring rainfall variability in short
time periods PMF Probable Maximum Flood PMP Probable Maximum Precipitation QUDM Queensland Urban Drainage Manual RORB A rural runoff-routing hydrologic model TFHAS Townsville Flood Hazard Assessment Study (Maunsell, 2005) RRHS Ross River Hydraulic Study (Maunsell, 2001) XP-RAFTS An urban and rural runoff-routing hydrologic model

ROSS RIVER FLOOD STUDY BASELINE FLOODING ASSESSMENT
ABN >> 44 741 992 072
1
1.0 Introduction
1.1 Overview
The Ross River Flood Study – Baseline Flooding Assessment has been undertaken as part of Townsville City Council’s City Wide Flood Constraints Project. The project seeks to develop up to date flood models for the city of Townsville at scales suitable for:
• defining flood levels for most urban properties;
• identifying the flood hazard overlay for the planning scheme;
• evaluating future flood mitigation projects; and
• assisting the disaster management process. This study builds on previous hydrologic and hydraulic analysis projects for Ross River and incorporates the latest Light Detection and Ranging (LiDAR) topographic data as well as recent hydrographic survey to form up to date hydrologic and hydraulic flood models for Ross River. Recent revisions of the gate operations for Ross River Dam have been incorporated into the final model. The results of this study inform subsequent stages of the City Wide Flood Constraints Project, while the hydraulic model developed provides an efficient representation of flows within lower Ross River, capable of being run quickly to inform dam outflow management, provided expertise and resources are available.
1.2 Study Area
The Ross River catchment is the largest catchment within the Townsville Local Government Area (LGA). The upper Ross River catchment drains to the Ross River Dam, approximately 19 km south-west of the central business district and 26 km upstream from the river mouth. The upper catchment drains the rural areas of Ross River, Mount Stuart, Brookhill, Mount Elliot, Toonpan, Barringha, Woodstock, Calcium, Granite Vale and Pinnacles. From the Dam the River flows northwards for approximately 10 km before flowing generally northeast for 16 km to Cleveland Bay. Downstream of the dam, three weirs help to create permanent water within the river around the urban areas:
• Black Weir is approximately 11 km downstream of Ross River Dam and 15 km upstream of the mouth, near the suburbs of Kirwan and Douglas;
• Gleesons Weir is approximately 12 km downstream of Ross River Dam and 14 km upstream of the mouth, near the suburbs of Cranbrook and Douglas; and
• Aplins Weir is approximately 16 km downstream of Ross River Dam and 10 km upstream of the mouth, near the suburbs of Mundingburra and Annandale.
The 10 km of Ross River downstream of Aplins Weir is tidal. There are also four existing bridge crossings of the river downstream of Ross River Dam:
ROSS RIVER FLOOD STUDY BASELINE FLOODING ASSESSMENT
ABN >> 44 741 992 072
2
• The Ring Road Bridge approximately 9.5 km downstream of the dam and 16.5 km upstream of the mouth, connecting the suburbs of Condon and Douglas;
• The Nathan Street Bridge approximately 14.5 km downstream of the dam and 11.5 km upstream of the mouth, connecting the suburbs of Cranbrook/Aitkenvale and Douglas/Annandale;
• The Bowen Road Bridge approximately 19 km downstream of the dam and 7 km upstream of the mouth, connecting the suburbs of Rosslea and Annandale/Idalia;
• The Abbot Street Bridge approximately 22.5 km downstream of the dam and 3.5 km upstream of the mouth, connecting the suburbs of Railway Estate and Oonoonba;
In addition to the road bridge at Abbot Street, there is also a pedestrian foot bridge and the North Coast Railway Rail bridge. There also pedestrian foot bridges at Aplins Weir, Blacks Weir and the Ring Road Bridge. At the time of this report the Port Access Road Bridge was partially constructed at the mouth of the River, with some embankment constructed. The Port Access Road embankment that is identified in the 2009 LiDAR is represented within the model. Upon finalisation of the Port Access Road Bridge design and construction, the bridge can be incorporated into the model. A majority of the catchment downstream of the dam is east and south of the river, because the left bank is perched for a majority of the length between the dam and Rosslea. The main sub-catchments downstream of the dam to the east and south of the River are:
• The western slopes of Mount Stuart;
• Douglas and Annandale – the northern slopes of Mount Stuart;
• Gordon Creek – draining Murray, Idalia, Wulguru, Cluden and Oonoonba; and
• Stuart Creek – draining Julago, Brookhill, Oak Valley, Roseneath, Stuart and Cluden.
North of the river, there are some minor urban catchments where surface flows drain to the river including:
• portions of Cranbrook;
• Rosslea and portions of Mundingburra; and
• Railway Estate and South Townsville. There are also some minor areas of Kelso, Kirwan, Cranbrook, Aitkenvale and Mundingburra where pipe networks drain to the River. These network will generally have only 2 Year ARI capacity and are unlikely to contribute significant quantities of flow to the River, particularly during long duration, larger average reccurrence interval (ARI) events. These catchment areas have not been modelled in this study however, should be considered for subsequent stages of the City Wide Flood Constraints project, when looking at localised events (shorter duration events focused on rainfall downstream of the dam). The mouth of Ross River enters Cleveland Bay to the immediate east of the Port of Townsville. The Port of Townsville is presently reclaiming portions of the area downstream of the river mouth for a commercial marine precinct. The study area is shown in Figure 1-1.

THE RING ROAD
BRUCE HIGHWAY
FLIN
DERS
HIG
HWAY
BRUCE HIGHWAY
LEGEND
Hydraulic Model Reaches
Roads
Railways
CatchmentAnnandale/DouglasGordonCkRoss River DSRoss River USStuartCk
FIGURE 1-1
SCALE: @1:200,000
6 03
KilometersA3
TOWNSVILLE CITY COUNCILROSS RIVER FLOOD STUDY
STUDY AREA
© Townsville City Council 2010DIGITAL FILE: DRAWN BY: DATE:
Strategic Planning DepartmentPLANNING AND DEVELOPMENT
mxdWGB
12/04/2011
´
Ross River Dam
Cleveland Bay
ROSS RIVER FLOOD STUDY BASELINE FLOODING ASSESSMENT
ABN >> 44 741 992 072
4
1.3 Scope of Works
The scope of works for this Baseline Flooding Assessment includes:
• review of previous engineering reports and data;
• collation of relevant data including rainfall, stream gauging, construction drawings; topographic survey and hydrographic survey;
• identification of a suitable approach for hydrologic and hydraulic modelling;
• verification of the hydrologic model of upper Ross River;
• development and calibration of Ross River hydraulic model; and
• review and detailing the base-line flooding determined for Ross River.
1.4 Study Approach
This Baseline Flooding Assessment builds on numerous previous projects and provides input to other fine-scale flooding assessments for the City Wide Flood Constraints Project. Hydrologic modelling for this project has been based on upper Ross River RORB model developed in Ross River Dam Upgrades Project – Volume 2: Review of Hydrology and Flooding (SKM, 2003). Other minor sub-catchments downstream of Ross River Dam have been modelled with XP-RAFTS hydrological models, which will be described in detail in future reports as part of the City Wide Flood Constraints Project. These sub-catchments include:
• Ross River Downstream;
• Annandale/Douglas;
• Gordon Creek; and
• Stuart Creek. The hydraulic model of Ross River from the dam to the mouth is based on the models gradually developed and improved on since the Ross River Hydraulic Study (Maunsell, 2001). Main channel flows and overflows will be used from the results of hydraulic for input to finer-scale hydraulic flood models developed in subsequent stages of the City Wide Flood Constraints Project including:
• Ross Creek;
• Annandale/Douglas; and
• Lower Stuart/Ross floodplain. The report has been prepared in two volumes:
• Volume 1 (this Volume) – provides the majority of the report including methodology and discussion of results;
• Volume 2 – provides the flood map results from the study.
ROSS RIVER FLOOD STUDY BASELINE FLOODING ASSESSMENT
ABN >> 44 741 992 072
5
2.0 Available Data
2.1 Historical Rainfall Records
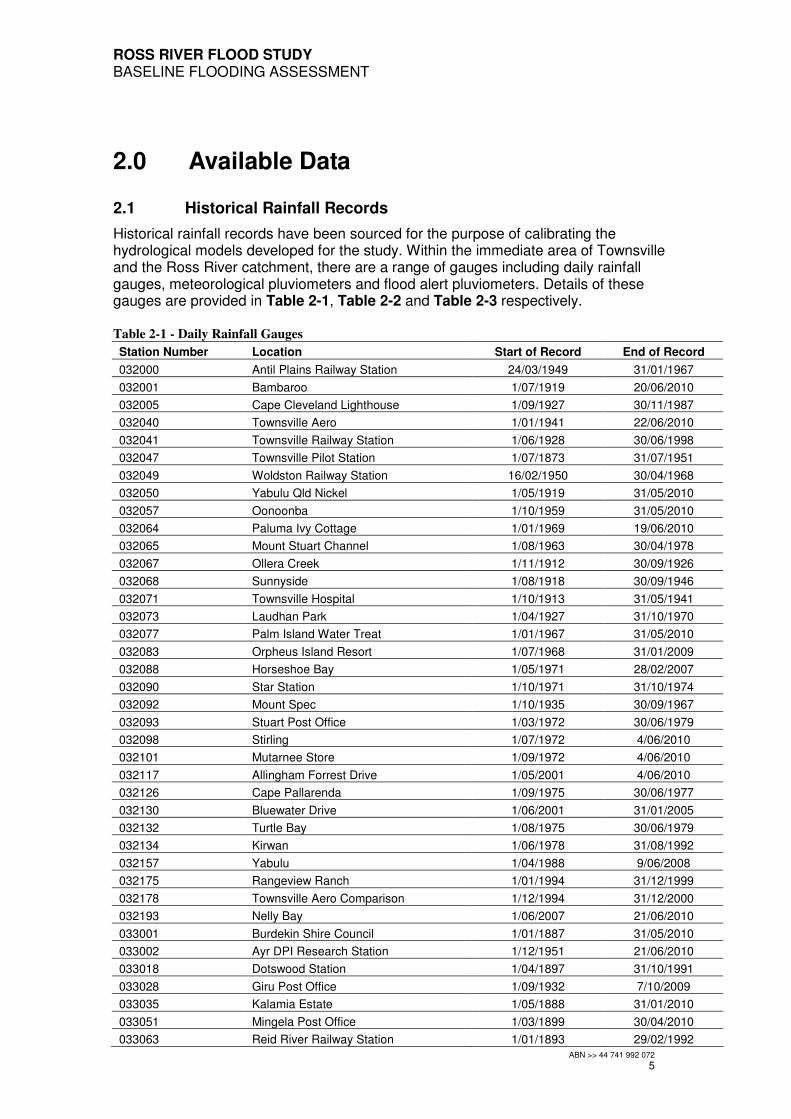
Historical rainfall records have been sourced for the purpose of calibrating the hydrological models developed for the study. Within the immediate area of Townsville and the Ross River catchment, there are a range of gauges including daily rainfall gauges, meteorological pluviometers and flood alert pluviometers. Details of these gauges are provided in Table 2-1, Table 2-2 and Table 2-3 respectively. Table 2-1 - Daily Rainfall Gauges
Station Number Location Start of Record End of Record
032000 Antil Plains Railway Station 24/03/1949 31/01/1967
032001 Bambaroo 1/07/1919 20/06/2010
032005 Cape Cleveland Lighthouse 1/09/1927 30/11/1987
032040 Townsville Aero 1/01/1941 22/06/2010
032041 Townsville Railway Station 1/06/1928 30/06/1998
032047 Townsville Pilot Station 1/07/1873 31/07/1951
032049 Woldston Railway Station 16/02/1950 30/04/1968
032050 Yabulu Qld Nickel 1/05/1919 31/05/2010
032057 Oonoonba 1/10/1959 31/05/2010
032064 Paluma Ivy Cottage 1/01/1969 19/06/2010
032065 Mount Stuart Channel 1/08/1963 30/04/1978
032067 Ollera Creek 1/11/1912 30/09/1926
032068 Sunnyside 1/08/1918 30/09/1946
032071 Townsville Hospital 1/10/1913 31/05/1941
032073 Laudhan Park 1/04/1927 31/10/1970
032077 Palm Island Water Treat 1/01/1967 31/05/2010
032083 Orpheus Island Resort 1/07/1968 31/01/2009
032088 Horseshoe Bay 1/05/1971 28/02/2007
032090 Star Station 1/10/1971 31/10/1974
032092 Mount Spec 1/10/1935 30/09/1967
032093 Stuart Post Office 1/03/1972 30/06/1979
032098 Stirling 1/07/1972 4/06/2010
032101 Mutarnee Store 1/09/1972 4/06/2010
032117 Allingham Forrest Drive 1/05/2001 4/06/2010
032126 Cape Pallarenda 1/09/1975 30/06/1977
032130 Bluewater Drive 1/06/2001 31/01/2005
032132 Turtle Bay 1/08/1975 30/06/1979
032134 Kirwan 1/06/1978 31/08/1992
032157 Yabulu 1/04/1988 9/06/2008
032175 Rangeview Ranch 1/01/1994 31/12/1999
032178 Townsville Aero Comparison 1/12/1994 31/12/2000
032193 Nelly Bay 1/06/2007 21/06/2010
033001 Burdekin Shire Council 1/01/1887 31/05/2010
033002 Ayr DPI Research Station 1/12/1951 21/06/2010
033018 Dotswood Station 1/04/1897 31/10/1991
033028 Giru Post Office 1/09/1932 7/10/2009
033035 Kalamia Estate 1/05/1888 31/01/2010
033051 Mingela Post Office 1/03/1899 30/04/2010
033063 Reid River Railway Station 1/01/1893 29/02/1992
ROSS RIVER FLOOD STUDY BASELINE FLOODING ASSESSMENT
ABN >> 44 741 992 072
6
Station Number Location Start of Record End of Record
033069 Shirbourne Park 1/07/1918 31/12/2007
033073 Woodhouse 1/07/1892 31/05/2010
033074 Woodstock Post Office 1/03/1899 31/01/1975
033113 Wyreema 1/01/1918 31/10/1943
033118 Haughton Valley 1/01/1894 30/04/1920
033120 Poopoonbah Iwsc 1/01/1918 30/04/1948
033122 Clare 1/01/1895 4/06/2010
033123 Fanning River Station 1/08/1889 31/03/1987
033126 Cape Bowling Green 1/08/1896 30/04/1920
033139 Paynes Lagoon Station 1/01/1969 24/02/2004
033151 Majors Creek 1/01/1934 31/05/2010
033159 Springvale Station 1/02/1972 31/08/1975
033207 Flora Valley 1/04/1994 31/10/2007
033209 Leichardt 1/09/1973 31/12/1974
033215 Pioneer Estate 1/01/1909 31/10/1914
033217 Burwen-Mineham Siding 1/05/1915 28/02/1922
033226 Lansdown CSIRO 1/08/1964 30/01/2006
033234 Table Top Station 1/01/1962 30/09/1973
033244 Herveys Range 1/04/1934 30/04/1939
033249 Hustons Farm 1/10/1994 28/02/1997
033279 Clare TM 1/11/1999 30/11/1999
033280 Powerline TM 30/11/2000 22/06/2010
033286 Clare Alert 30/11/2000 22/06/2010
033288 Inkerman Bridge Alert 3/01/2002 22/06/2010
033295 Alva Beach 27/03/1997 22/06/2010
033298 Dotswood 16/02/1996 19/05/2005
033307 Woolshed 7/07/1998 22/06/2010
033319 Giru North 1/01/2000 4/06/2010
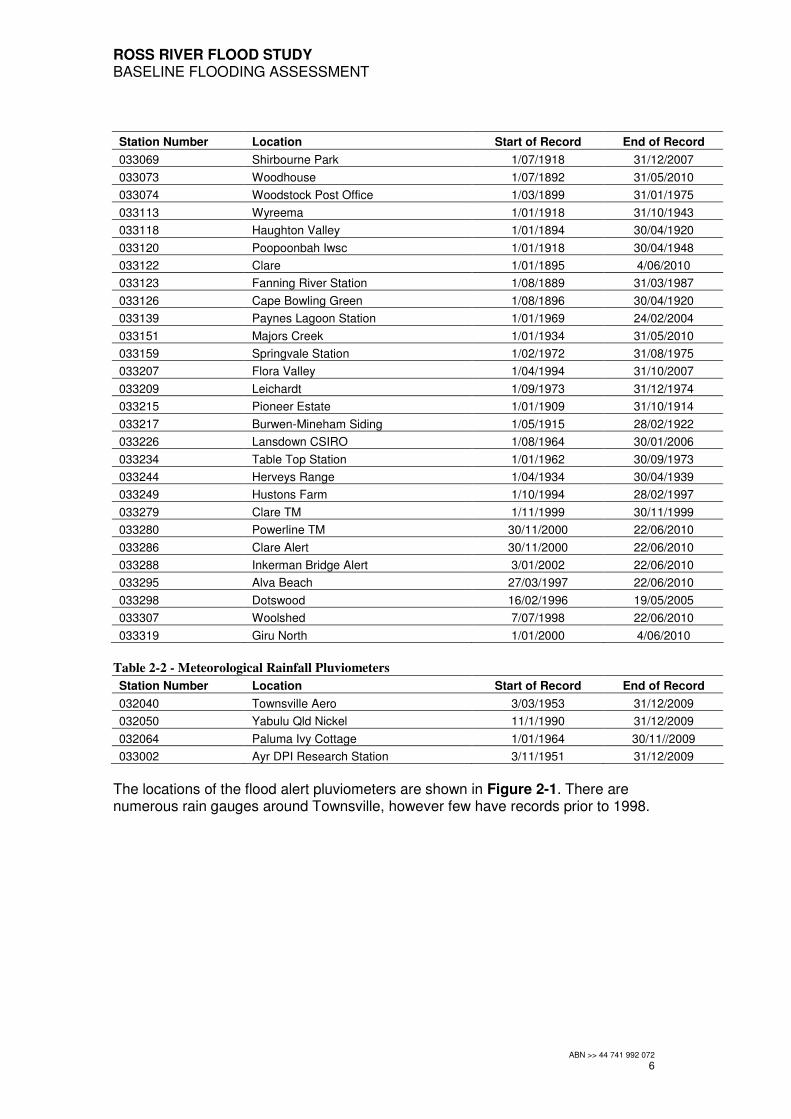
Table 2-2 - Meteorological Rainfall Pluviometers
Station Number Location Start of Record End of Record
032040 Townsville Aero 3/03/1953 31/12/2009
032050 Yabulu Qld Nickel 11/1/1990 31/12/2009
032064 Paluma Ivy Cottage 1/01/1964 30/11//2009
033002 Ayr DPI Research Station 3/11/1951 31/12/2009
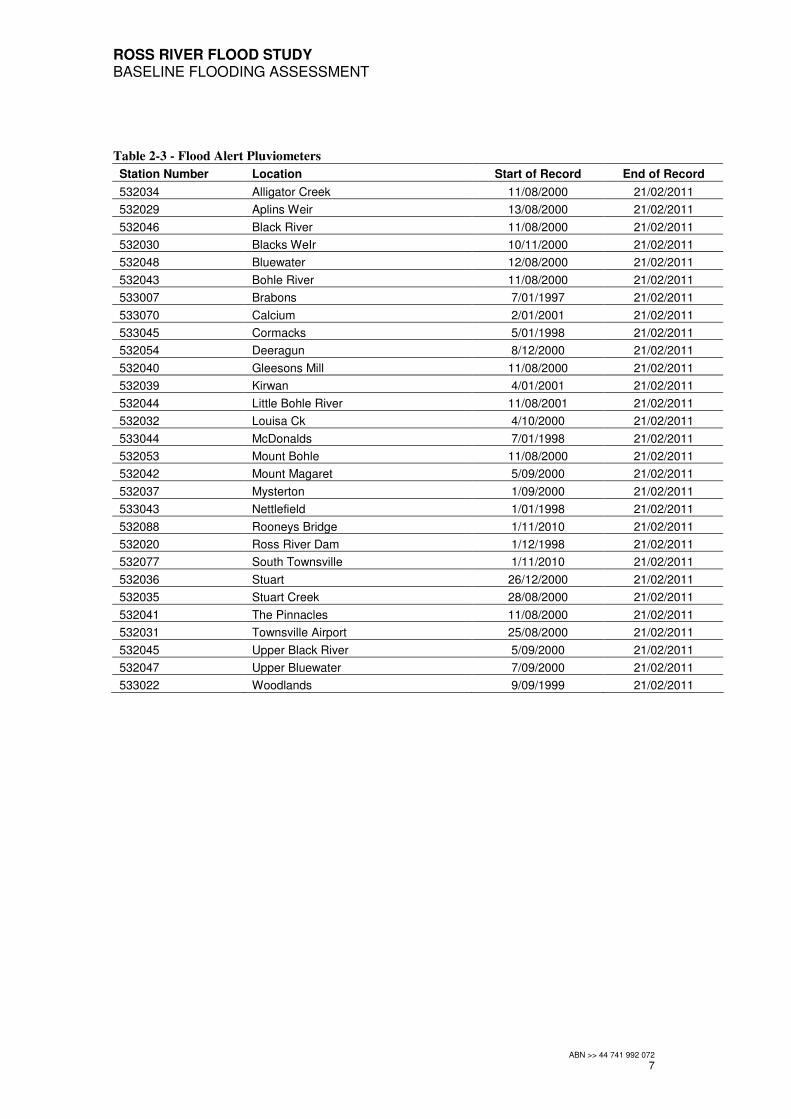
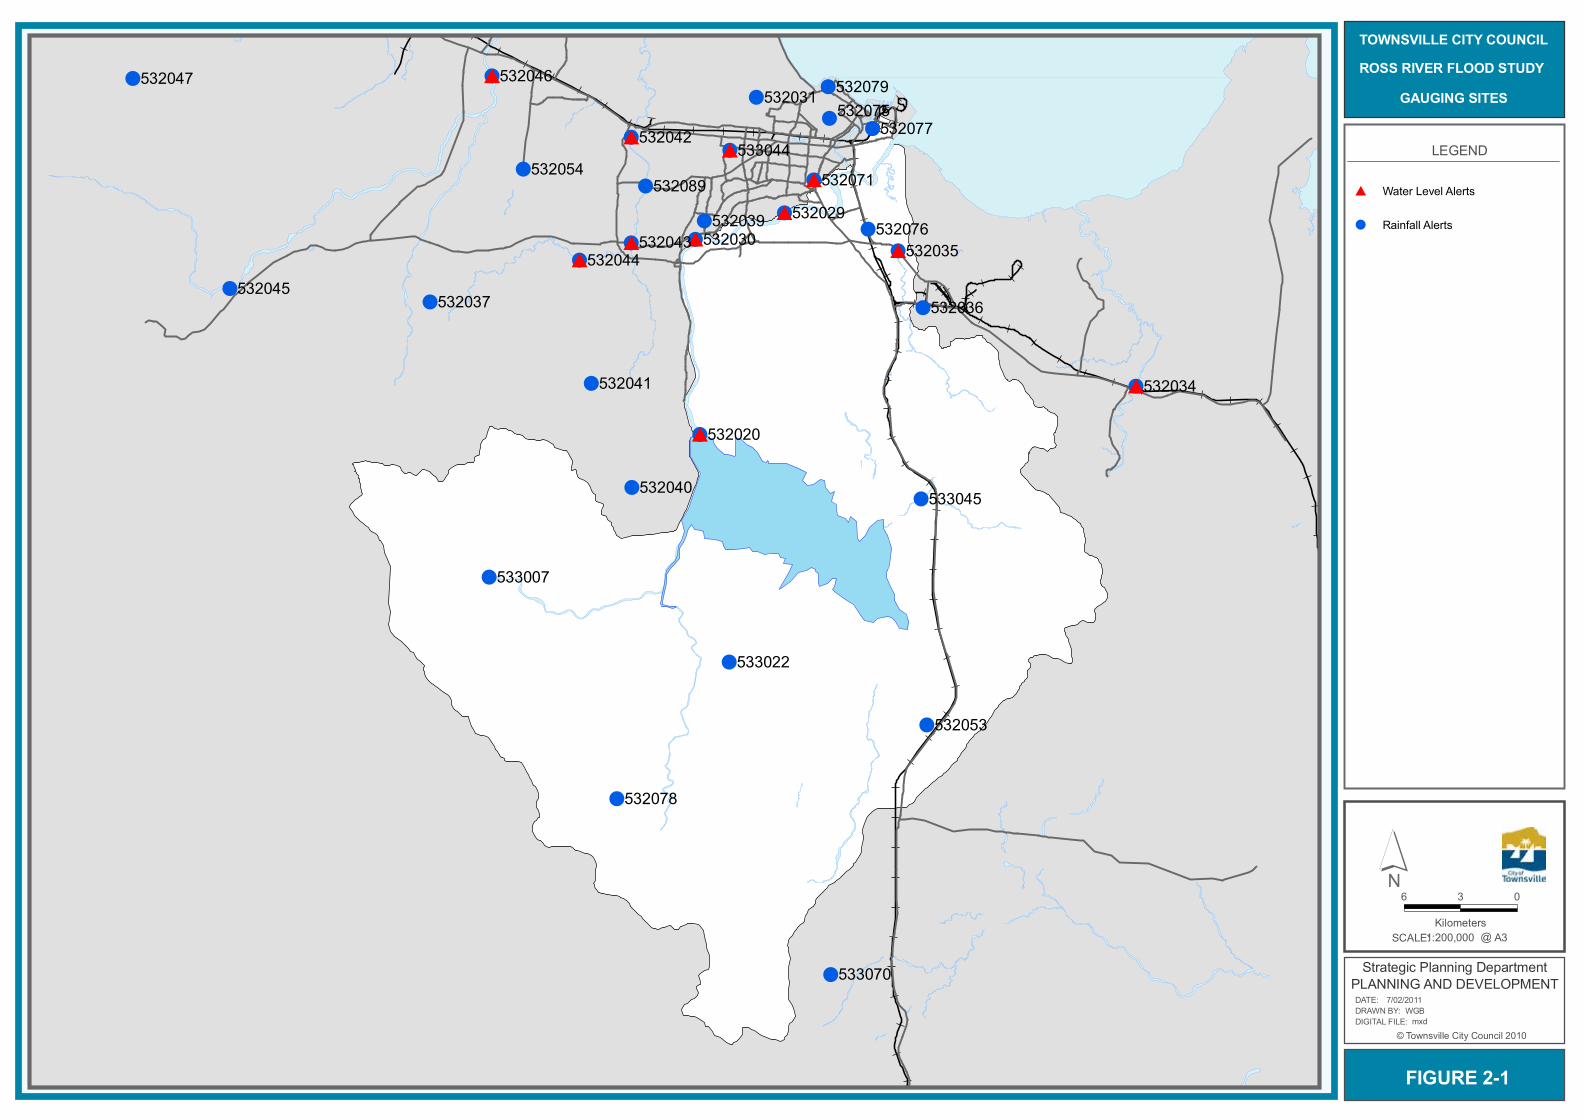
The locations of the flood alert pluviometers are shown in Figure 2-1. There are numerous rain gauges around Townsville, however few have records prior to 1998.
ROSS RIVER FLOOD STUDY BASELINE FLOODING ASSESSMENT
ABN >> 44 741 992 072
7
Table 2-3 - Flood Alert Pluviometers
Station Number Location Start of Record End of Record
532034 Alligator Creek 11/08/2000 21/02/2011
532029 Aplins Weir 13/08/2000 21/02/2011
532046 Black River 11/08/2000 21/02/2011
532030 Blacks WeIr 10/11/2000 21/02/2011
532048 Bluewater 12/08/2000 21/02/2011
532043 Bohle River 11/08/2000 21/02/2011
533007 Brabons 7/01/1997 21/02/2011
533070 Calcium 2/01/2001 21/02/2011
533045 Cormacks 5/01/1998 21/02/2011
532054 Deeragun 8/12/2000 21/02/2011
532040 Gleesons Mill 11/08/2000 21/02/2011
532039 Kirwan 4/01/2001 21/02/2011
532044 Little Bohle River 11/08/2001 21/02/2011
532032 Louisa Ck 4/10/2000 21/02/2011
533044 McDonalds 7/01/1998 21/02/2011
532053 Mount Bohle 11/08/2000 21/02/2011
532042 Mount Magaret 5/09/2000 21/02/2011
532037 Mysterton 1/09/2000 21/02/2011
533043 Nettlefield 1/01/1998 21/02/2011
532088 Rooneys Bridge 1/11/2010 21/02/2011
532020 Ross River Dam 1/12/1998 21/02/2011
532077 South Townsville 1/11/2010 21/02/2011
532036 Stuart 26/12/2000 21/02/2011
532035 Stuart Creek 28/08/2000 21/02/2011
532041 The Pinnacles 11/08/2000 21/02/2011
532031 Townsville Airport 25/08/2000 21/02/2011
532045 Upper Black River 5/09/2000 21/02/2011
532047 Upper Bluewater 7/09/2000 21/02/2011
533022 Woodlands 9/09/1999 21/02/2011
!
!
!
!
!
!
!!
!
!
!
!
!
!
!
!
!
!
!!! !
!
!
!!
!
!
!
!
!
#
#
##
#
##
#
#
#
#
532089
532076
532077
532079
532034
532075532031
533044532071
532029532039532030 532035
532036
533045
532053
533022
533070
532078
533007
532020
532040
532041
532044532043
532042532054
532037
532046
532045
532047
LEGEND
# Water Level Alerts
! Rainfall Alerts
FIGURE 2-1
SCALE: @1:200,000
6 03
KilometersA3
TOWNSVILLE CITY COUNCILROSS RIVER FLOOD STUDY
GAUGING SITES
© Townsville City Council 2010DIGITAL FILE: DRAWN BY: DATE:
Strategic Planning DepartmentPLANNING AND DEVELOPMENT
mxdWGB
7/02/2011
´

ROSS RIVER FLOOD STUDY BASELINE FLOODING ASSESSMENT
ABN >> 44 741 992 072
9
2.2 Stream Gauging Records
Stream gauging records for Ross River have been used for the purpose of calibrating the hydrologic and hydraulic models. Stream gauging on the Ross River has been undertaken from the early 1900s onwards, however there have been numerous changes that impact on the continuity of stream records, including:
• construction of the Ross River Dam (Circa 1974.);
• construction of a new-spillway configuration for Ross River Dam (Circa. 2005);
• cessation of gauging sites; and
• changes to management of gauging sites. Details of the stream gauging are provided in Table 2-4. The locations of these gauges are shown in Figure 2-1. Table 2-4 - Ross River Stream Gauging Station Number Location Agency Start of Record End of Record
118104A Ross River Dam HW DERM 1/10/1974 21/2/2011
118102A Black Weir DERM 11/10/1936 07/11/1973 532030 Black Weir BoM 7/9/2000 21/2/2011 118101A Gleesons Weir DERM 01/10/1915 31/5/1961
118103A Aplins Weir DERM 1/2/1944 30/4/1961 532029 Aplins Weir BoM 8/2/2001 21/2/2011
532088 Rooneys Bridge BoM 1/11/2010 21/2/2011 532033 Townsville Harbour DERM 11/3/1975 21/2/2011
2.3 Topographic Data
Topographic data has been used from numerous sources to ensure appropriate representation of ground relief. The main datasets and sources are:
• Townsville City Council LiDAR obtained from a joint government agency project, with capture around September/October 2009;
• Hydrographic survey of the freshwater reaches of Ross River obtained as part of the Ross River Hydraulic Study, 2001; and
• Hydrographic survey of the lower estuarine reaches of Ross River obtained from Port of Townsville and AquaMap, 2010.
Broad-scale contours over the study area digitised from 1:100,000 series topographic maps have also been used. Figure 2-2 shows the extent of the topographic datasets.
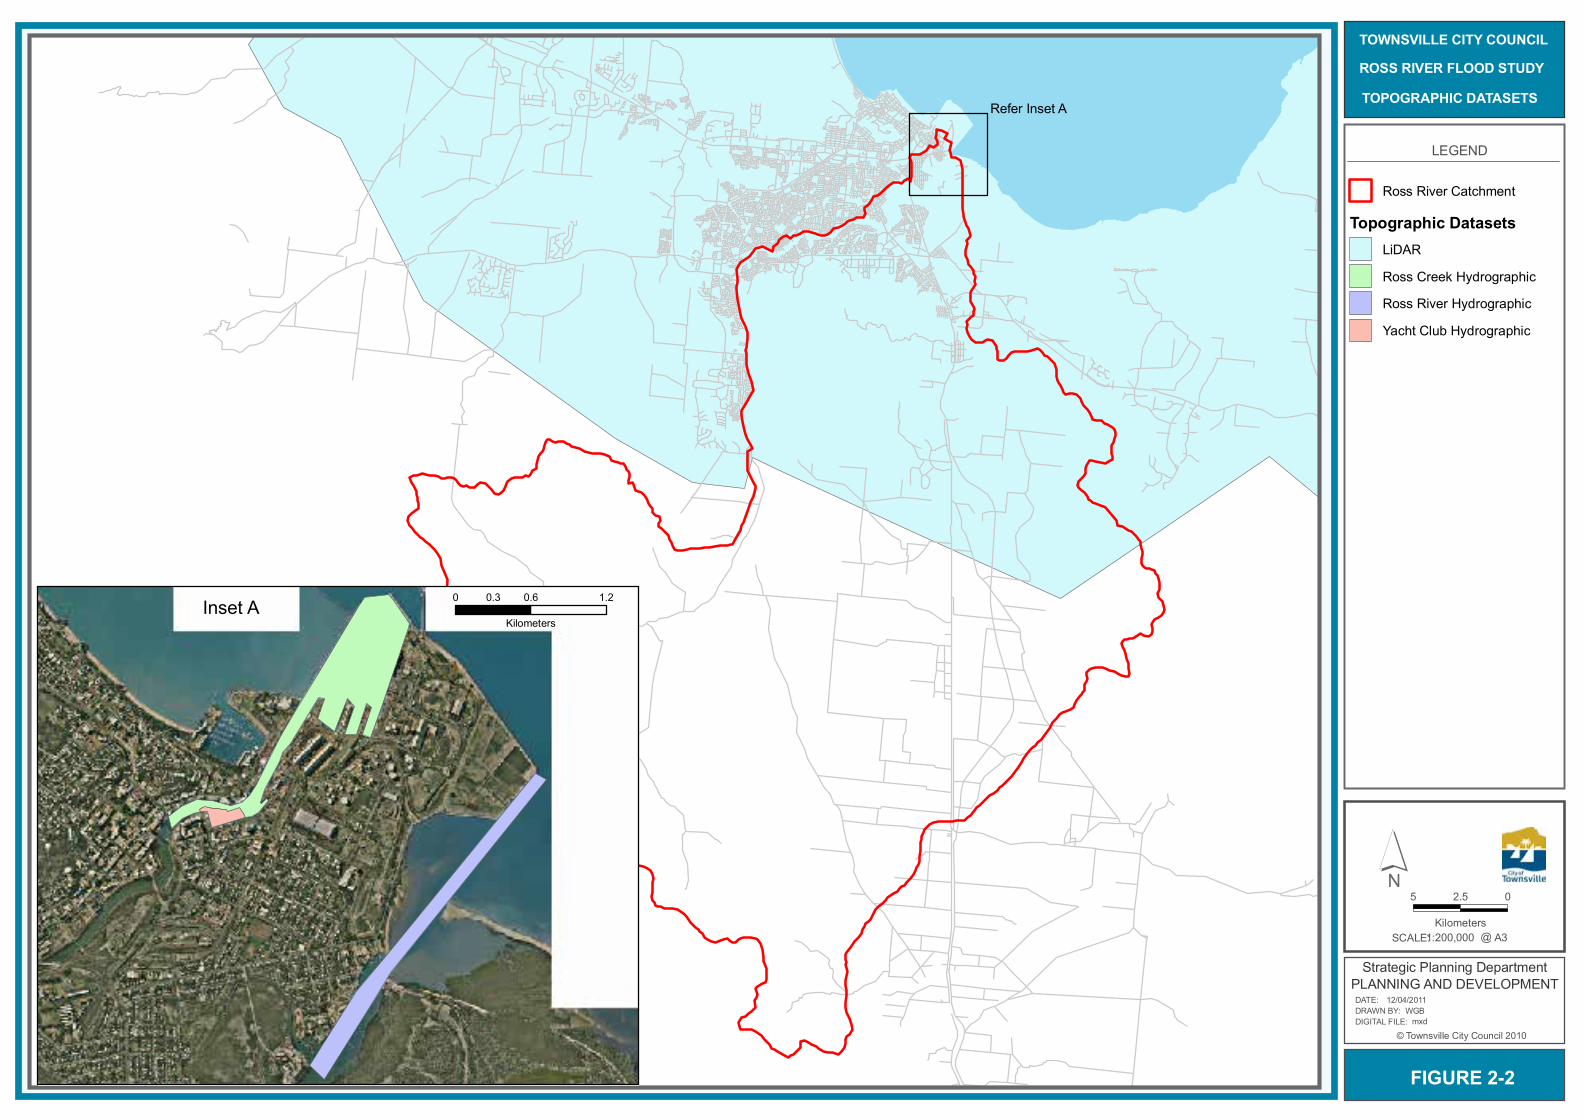
LEGEND
Ross River Catchment
Topographic DatasetsLiDARRoss Creek HydrographicRoss River HydrographicYacht Club Hydrographic
FIGURE 2-2
SCALE: @1:200,000
5 02.5
KilometersA3
TOWNSVILLE CITY COUNCILROSS RIVER FLOOD STUDYTOPOGRAPHIC DATASETS
© Townsville City Council 2010DIGITAL FILE: DRAWN BY: DATE:
Strategic Planning DepartmentPLANNING AND DEVELOPMENT
mxdWGB
12/04/2011
´
0 0.6 1.20.3
KilometersInset A
Refer Inset A
ROSS RIVER FLOOD STUDY BASELINE FLOODING ASSESSMENT
ABN >> 44 741 992 072
11
2.4 Cadastral Data
Cadastral data from the study areas has been used for evaluating catchment and floodplain parameters as part of the hydrological and hydraulic modelling. The Cadastral information was used as at 30th September 2010.
2.5 Structure Design Drawings
Drawings have been sourced for the bridge structures crossing Ross River, to provide details for the hydraulic modelling. Where design drawings have not been available, site observations and survey have been used to determine geometrical parameters for the bridges. Design drawings of the Townsville Port Access Road bridge across the mouth of Ross River have been used, given the bridge is partially constructed.
2.6 Previous Engineering Reports
Ross River Dam – Design Report The Ross River Dam Design Report was completed by Queensland Water Resources Commission in 1990. The report identified the concepts for dam upgrades that were constructed later in 2005 to 2007. The report was used to source information on the dam prior to construction of the upgrades. Ross River Hydraulic Study The Ross River Hydraulic Study was completed by Maunsell McIntyre for NQ Water in 2001. A one-dimensional MIKE-11 hydraulic model was developed to represent flooding downstream of the Ross River Dam for various flow rates. The study did not undertake any hydrological modelling quantify runoff either to Ross River Dam or downstream of Ross River Dam. The model developed within the Ross River Hydraulic Study was used as the basis for the Townsville Flood Hazard Assessment Study. Cross-sections for areas below the river water were taken from both these studies for the purpose of developing the MIKE FLOOD hydraulic for the present study. Results of the Ross River Hydraulic Study were also used for comparison of results. Townsville Flood Hazard Assessment Study Townsville City Council commissioned Maunsell to undertake the Townsville Flood Hazard Assessment Study as part of the Natural Disaster Risk Management Studies Program. The Study was completed in 2005 and involved 3 phases:
• Phase 1 – Data Acquisition;
• Phase 2 – Flood Hazard Assessment; and
• Phase 3 – Vulnerability Assessment and Risk Analysis. The flood modelling was completed for Phase 2 of the report. The hydrological assessment focused on the catchment downstream of Ross River Dam and did not account for flows over the Ross River Dam spillway. The hydraulic assessment developed a MIKE11 model for flood events up to the 20 Year ARI, while a MIKE21 model was developed for the flood events greater than and including the 50 Year ARI.
ROSS RIVER FLOOD STUDY BASELINE FLOODING ASSESSMENT
ABN >> 44 741 992 072
12
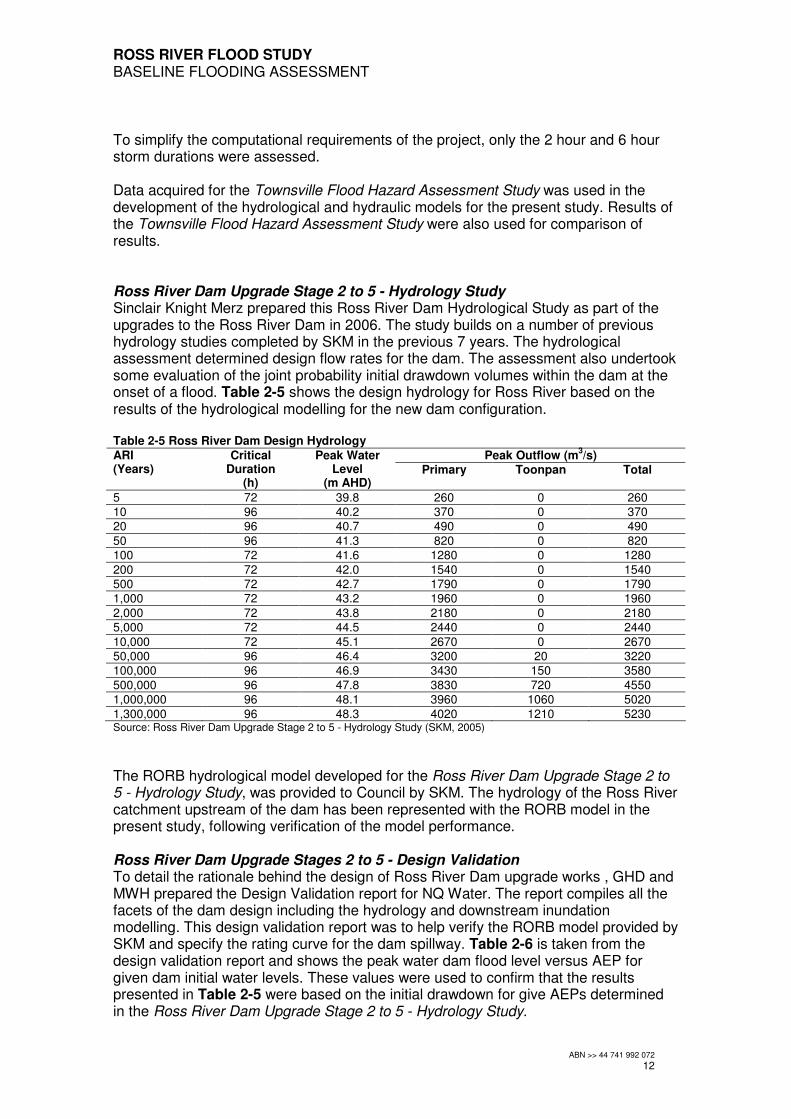
To simplify the computational requirements of the project, only the 2 hour and 6 hour storm durations were assessed. Data acquired for the Townsville Flood Hazard Assessment Study was used in the development of the hydrological and hydraulic models for the present study. Results of the Townsville Flood Hazard Assessment Study were also used for comparison of results. Ross River Dam Upgrade Stage 2 to 5 - Hydrology Study Sinclair Knight Merz prepared this Ross River Dam Hydrological Study as part of the upgrades to the Ross River Dam in 2006. The study builds on a number of previous hydrology studies completed by SKM in the previous 7 years. The hydrological assessment determined design flow rates for the dam. The assessment also undertook some evaluation of the joint probability initial drawdown volumes within the dam at the onset of a flood. Table 2-5 shows the design hydrology for Ross River based on the results of the hydrological modelling for the new dam configuration. Table 2-5 Ross River Dam Design Hydrology
Peak Outflow (m3/s) ARI
(Years) Critical
Duration (h)
Peak Water Level
(m AHD) Primary Toonpan Total
5 72 39.8 260 0 260 10 96 40.2 370 0 370 20 96 40.7 490 0 490
50 96 41.3 820 0 820 100 72 41.6 1280 0 1280
200 72 42.0 1540 0 1540 500 72 42.7 1790 0 1790 1,000 72 43.2 1960 0 1960
2,000 72 43.8 2180 0 2180 5,000 72 44.5 2440 0 2440
10,000 72 45.1 2670 0 2670 50,000 96 46.4 3200 20 3220 100,000 96 46.9 3430 150 3580
500,000 96 47.8 3830 720 4550 1,000,000 96 48.1 3960 1060 5020
1,300,000 96 48.3 4020 1210 5230 Source: Ross River Dam Upgrade Stage 2 to 5 - Hydrology Study (SKM, 2005)
The RORB hydrological model developed for the Ross River Dam Upgrade Stage 2 to 5 - Hydrology Study, was provided to Council by SKM. The hydrology of the Ross River catchment upstream of the dam has been represented with the RORB model in the present study, following verification of the model performance. Ross River Dam Upgrade Stages 2 to 5 - Design Validation To detail the rationale behind the design of Ross River Dam upgrade works , GHD and MWH prepared the Design Validation report for NQ Water. The report compiles all the facets of the dam design including the hydrology and downstream inundation modelling. This design validation report was to help verify the RORB model provided by SKM and specify the rating curve for the dam spillway. Table 2-6 is taken from the design validation report and shows the peak water dam flood level versus AEP for given dam initial water levels. These values were used to confirm that the results presented in Table 2-5 were based on the initial drawdown for give AEPs determined in the Ross River Dam Upgrade Stage 2 to 5 - Hydrology Study.

ROSS RIVER FLOOD STUDY BASELINE FLOODING ASSESSMENT
ABN >> 44 741 992 072
13
Table 2-6 Ross River Dam Peak Water Levels
Initial Reservoir Level (m AHD) ARI (Years) 25 m 30 m 32 m 34.656 m 37 m 38.55 m
5 36.1 37.3 38.1 38.8 39.6 40.3
10 38.5 38.7 38.8 39.3 40.0 40.6
20 39.3 39.4 39.5 39.9 40.5 40.6
50 40.0 40.1 40.3 40.6 41.1 41.5
100 40.7 40.7 40.9 41.2 41.5 41.7
200 41.4 41.4 41.5 41.6 41.8 42.1
500 41.8 41.9 42.0 42.2 42.4 42.7
1,000 42.4 42.4 42.5 42.7 42.9 43.3
2,000 43.0 43.0 43.0 43.2 43.5 43.8
5,000 43.8 43.8 43.8 44.0 44.2 44.5
10,000 44.4 44.5 44.4 44.6 44.8 45.1
50,000 45.8 45.9 45.9 46.1 46.2 46.4
100,000 46.3 46.4 46.4 46.6 46.7 46.9
500,000 47.4 47.4 47.5 47.5 47.6 47.8
1,000,000 47.8 47.8 47.8 47.9 48.0 48.1
1,300,000 47.9 47.9 47.9 48.0 48.1 48.3 Source: Ross River Dam Upgrade Stages 2 to 5 - Design Validation,(GHD & MWH 2005)
Ross River Dam Downstream Modelling – Verification to February 2007 Event As part the design of the dam upgrade project, Maunsell AECOM undertook downstream flood plain modelling of the Ross River Dam for GHD/MWH. A two-dimensional MIKE 21 model was developed for the purposes of quantifying extents of inundation due to both spillway flows and dam breach flows. The Ross River Dam Downstream Modelling – verification to February 2007 Event was the first report specifically referring to the MIKE21 model. Following the initial development of model, the MIKE21 model was verified to the February 2007 flow event shortly after the completion of the dam upgrade works. The MIKE21 model has been used as a basis for the MIKE FLOOD hydraulic model developed for the present study. The observed data collected during the verification report has also been used for this present study.

ROSS RIVER FLOOD STUDY BASELINE FLOODING ASSESSMENT
ABN >> 44 741 992 072
14
3.0 Hydrological Assessment
3.1 Catchment Overview
A majority of the Ross River catchment is upstream of Ross River Dam, with approximately 760 km2 draining to the dam. Downstream of the dam a further 145 km2 drains to Ross River through the tributaries of Stuart Creek, Gordon Creek, Annandale Drains and University Creek. The upper catchment is bound by Mount Elliot Range in the east, Mount Stuart in the north, Pinnacles Range in the north-west and Herveys Range in the west to south-west. Mountainous areas alternate with areas of relatively flat land. Land use in the upper catchment is predominantly rural. Given the dam is Townsville City’s potable water supply; there is unlikely to be significant urbanisation of upper catchment in the foreseeable future. Downstream of dam the river snakes through the City of Townsville, before discharging to Cleveland Bay. The western slopes of Mount Stuart drain directly to Ross River through local watercourses. The area of these western slopes is largely undeveloped land controlled by the department of defence. The exception is towards of the north of these western slopes, where portions of Douglas drain through local water courses to Ross River upstream of Black Weir. The northern slopes of Mount Stuart drain to Ross River through drainage paths within the suburbs of Douglas and Annandale including University. North of the foothills of Mount Stuart, the catchment is fully urbanised made-up of largely residential areas, with some commercial and parkland. The north-eastern slopes of Mount Stuart drain to Ross River through Gordon Creek. Much of the lower reaches of Gordon Creek are urbanised with residential areas, commercial areas and the Murray sporting complex. There are however also areas of the inter-tidal area in the lower reaches that are undeveloped that could potentially be developed as part of the Townsville State Development Area. Stuart Creek catchment drains the eastern and south-eastern slopes of Mount Stuart along with the north-western slopes of Mount Elliot, to Ross River. The middle reaches of the Stuart Creek catchment are developed with primarily industrial development and some residential areas. In the upper catchment, the proposed Rocky Springs development will create a significant residential area. In the lower reaches there are areas that could potentially be developed as part of the Townsville State Development Area.
3.2 Hydrological Modelling Software
RORB RORB is a general runoff and streamflow routing program used to calculate flood hydrographs from rainfall and other channel inputs developed by Monash University in conjunction with Sinclair Knight Merz. The program provides an event-type modelling procedure. It subtracts losses from rainfall to produce rainfall-excess and routes this
ROSS RIVER FLOOD STUDY BASELINE FLOODING ASSESSMENT
ABN >> 44 741 992 072
15
through catchment storage to produce runoff hydrographs at any location. It can also be used to design retarding basins and to route floods through channel networks. RORB has been used to simulate the hydrological response of the Ross River catchment upstream of the Ross River Dam. RORB is best suited to representing predominantly rural catchments. XP-RAFTS The hydrologic modelling software XP-RAFTS calculates catchment flows from rainfall based on Laurenson’s non-linear routing method. The model is able to predict flows for catchments containing both urban and rural land uses accounting for surface roughness, catchment slope, soil infiltration and depression storage losses. It is well suited to the study area due to the need for detailed sub-catchment definition and representation of both rural and urban areas combined. XP-RAFTS has been used to simulate the hydrological response of the major sub-catchments downstream of the dam including:
• Ross River local watercourse catchments (Ross River Downstream);
• Annandale and Douglas areas;
• Gordon Creek; and
• Stuart Creek. Details of the Ross River Downstream hydrological modelling are provided in this report. Details of the hydrological modelling of the other major sub-catchments will be provided in subsequent reports as part of the City Wide flood constraint project.
3.3 Catchment Delineation
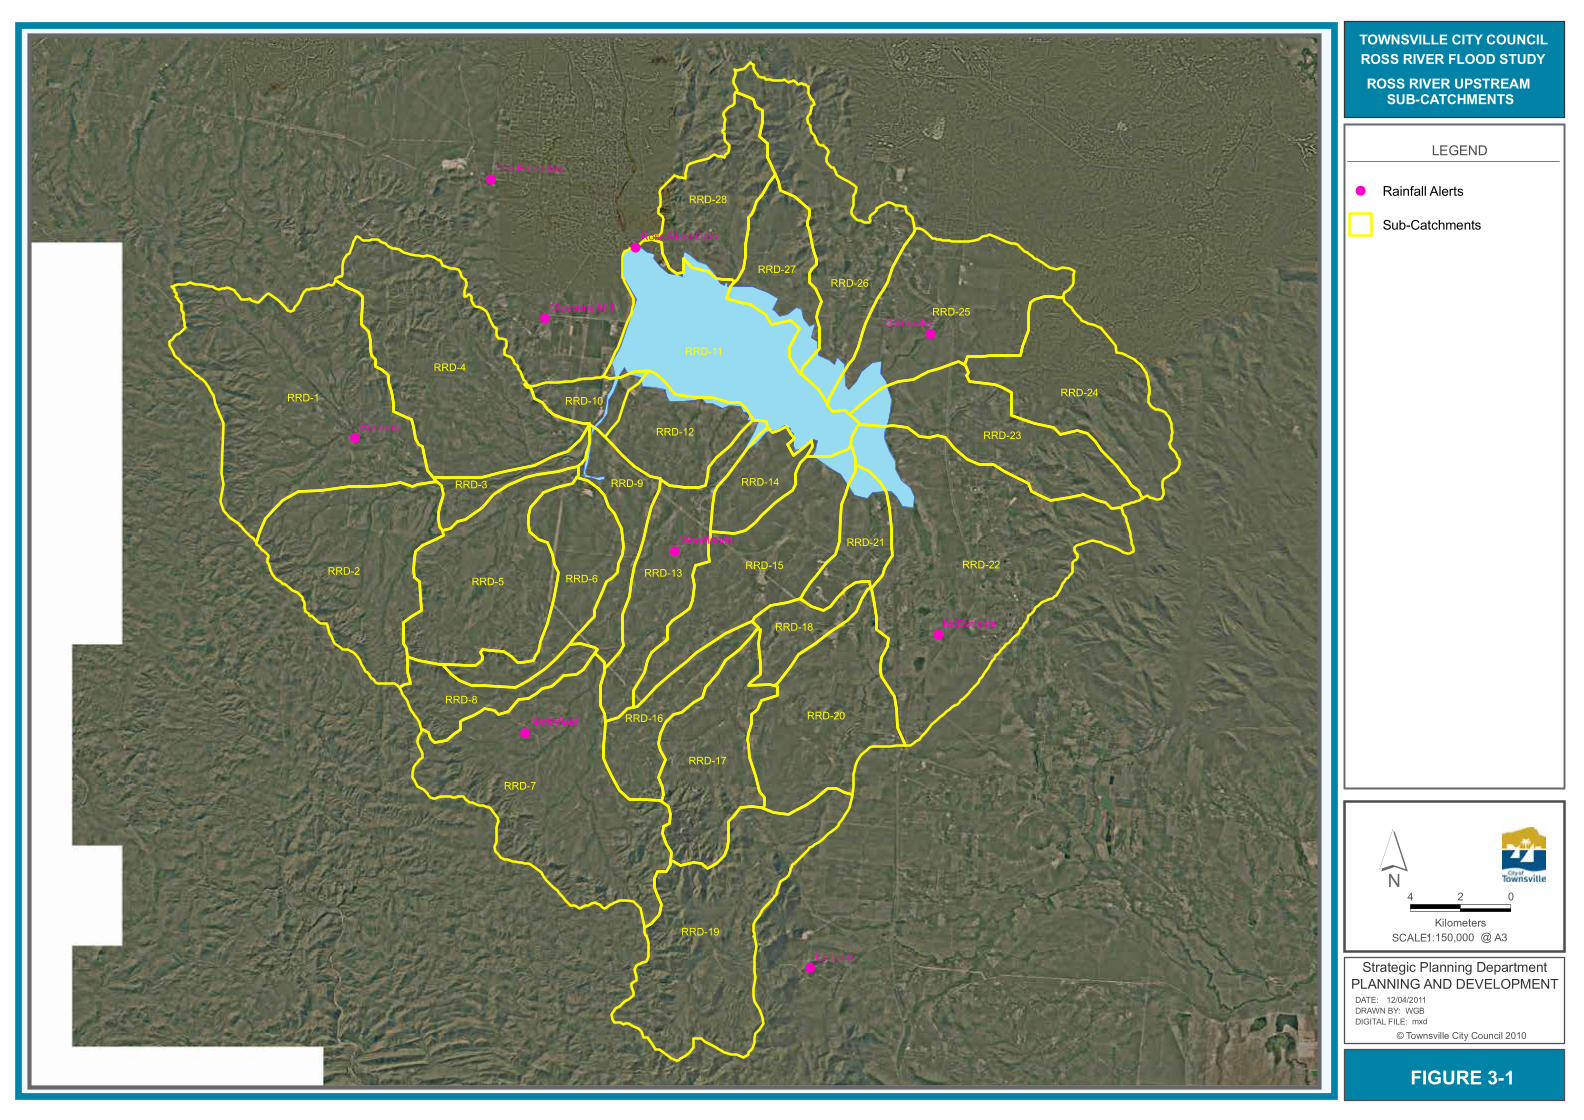
Ross River Upstream As previously identified the RORB model of Ross River Upstream was sourced from the work undertaken by SKM as part of the Ross River Dam Upgrade. The catchment delineation for the RORB model was reviewed in light of the new LiDAR and aerial photography available for this study. Figure 3-1 shows the sub-catchment delineation of Ross River Upstream adopted for this study. The review largely confirmed the sub-catchment delineation previously determined for the RORB mode development, with a few minor changes to internal sub-catchment boundaries and external catchment boundaries. The total catchment area determined from the new review was 757 km2 compared to 761 km2 from the previous study. The level of detail in the sub-catchment delineation was retained from the previous study. There was no need to provide fine detail sub-catchment inflows into the hydraulic model as all flows from the Ross River Upstream catchment are routed through Ross River Dam, before being applied to the hydraulic model.
!
!
!
!
!
!
!
!
!
RRD-1
RRD-22
RRD-7
RRD-4
RRD-19
RRD-2
RRD-11
RRD-5
RRD-25
RRD-20
RRD-26
RRD-24
RRD-15
RRD-23
RRD-17
RRD-6 RRD-13
RRD-28
RRD-12
RRD-27
RRD-9
RRD-16RRD-8
RRD-21
RRD-14
RRD-18
RRD-3
RRD-10
Calcium
Brabons
Cormacks
McDonalds
Woodlands
Nettlefield
Gleesons Mill
The Pinnacles
Ross River Dam
LEGEND
! Rainfall Alerts
Sub-Catchments
FIGURE 3-1
SCALE: @1:150,000
4 02
KilometersA3
TOWNSVILLE CITY COUNCILROSS RIVER FLOOD STUDYROSS RIVER UPSTREAM
SUB-CATCHMENTS
© Townsville City Council 2010DIGITAL FILE: DRAWN BY: DATE:
Strategic Planning DepartmentPLANNING AND DEVELOPMENT
mxdWGB
12/04/2011
´
ROSS RIVER FLOOD STUDY BASELINE FLOODING ASSESSMENT
ABN >> 44 741 992 072
17
Ross River Downstream The catchment downstream of Ross River Dam was delineated with sufficient detail to provide flows at appropriate locations for fine-scale hydraulic models, which will be developed in future stages of the City Wide Flood Constraints Project. The main areas within the Ross River Downstream catchment are:
• the western slopes of Mount Stuart upstream of the Ring Road;
• portions of Cranbrook;
• Rosslea and portions of Mundingburra;
• the northern undeveloped portion of Oonoonba; and
• portions of Railway Estate and South Townsville. Appendix A shows the sub-catchment delineation of Ross River Downstream adopted for this study. The catchment delineation is based on the 2009 LiDAR, aerial photograph, stormwater infrastructure GIS layers and cadastral boundaries. As discussed previously, minor system flows within Kelso, Kirwan, Cranbrook, Aitkenvale and Mundingburra have not been considered in this study.
3.4 Sub-Catchment Parameters
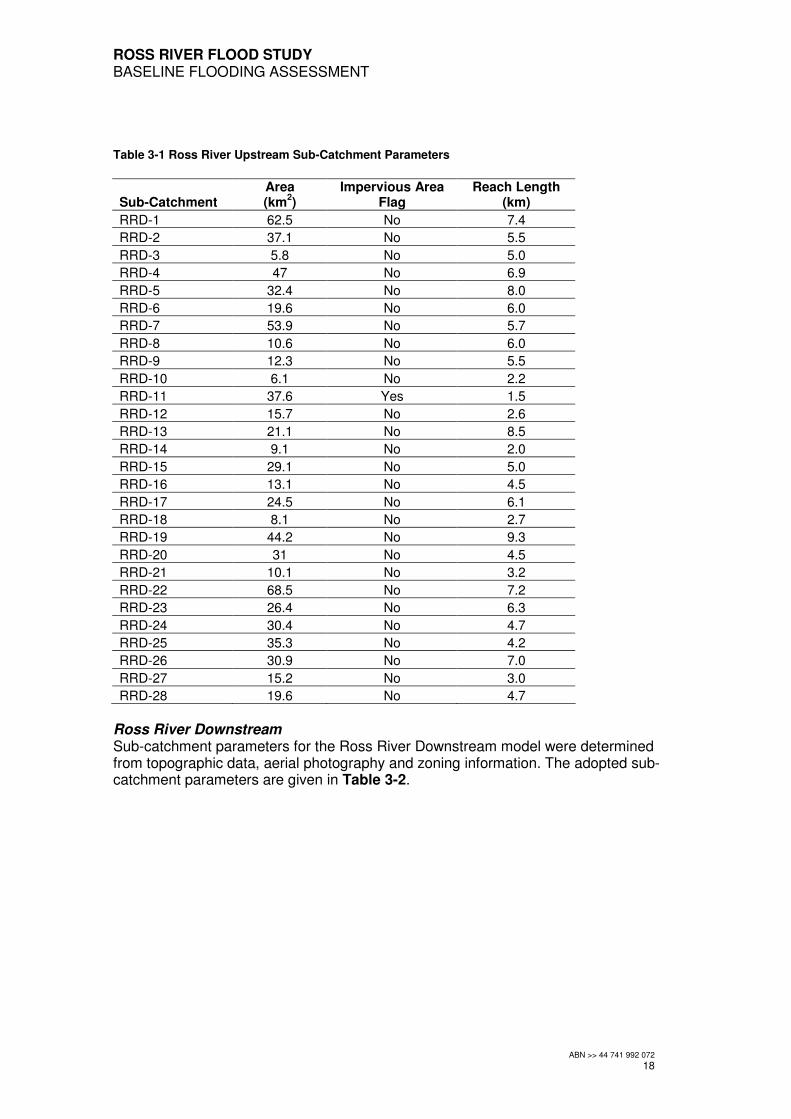
Ross River Upstream Sub-catchment parameters for the Ross River Upstream model were confirmed from topographic data and aerial photography. The adopted sub-catchment parameters are given in Table 3-1.
ROSS RIVER FLOOD STUDY BASELINE FLOODING ASSESSMENT
ABN >> 44 741 992 072
18
Table 3-1 Ross River Upstream Sub-Catchment Parameters
Sub-Catchment Area (km
2)
Impervious Area Flag
Reach Length (km)
RRD-1 62.5 No 7.4
RRD-2 37.1 No 5.5
RRD-3 5.8 No 5.0
RRD-4 47 No 6.9
RRD-5 32.4 No 8.0
RRD-6 19.6 No 6.0
RRD-7 53.9 No 5.7
RRD-8 10.6 No 6.0
RRD-9 12.3 No 5.5
RRD-10 6.1 No 2.2
RRD-11 37.6 Yes 1.5
RRD-12 15.7 No 2.6
RRD-13 21.1 No 8.5
RRD-14 9.1 No 2.0
RRD-15 29.1 No 5.0
RRD-16 13.1 No 4.5
RRD-17 24.5 No 6.1
RRD-18 8.1 No 2.7
RRD-19 44.2 No 9.3
RRD-20 31 No 4.5
RRD-21 10.1 No 3.2
RRD-22 68.5 No 7.2
RRD-23 26.4 No 6.3
RRD-24 30.4 No 4.7
RRD-25 35.3 No 4.2
RRD-26 30.9 No 7.0
RRD-27 15.2 No 3.0
RRD-28 19.6 No 4.7
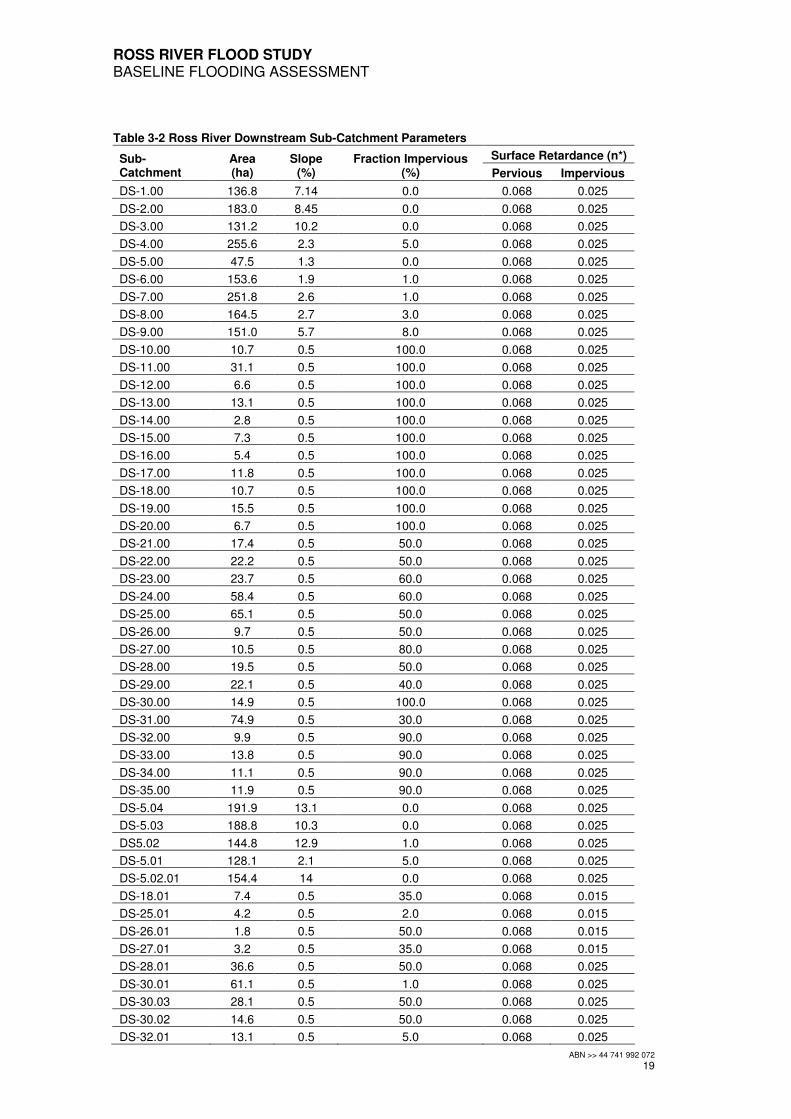
Ross River Downstream Sub-catchment parameters for the Ross River Downstream model were determined from topographic data, aerial photography and zoning information. The adopted sub-catchment parameters are given in Table 3-2.
ROSS RIVER FLOOD STUDY BASELINE FLOODING ASSESSMENT
ABN >> 44 741 992 072
19
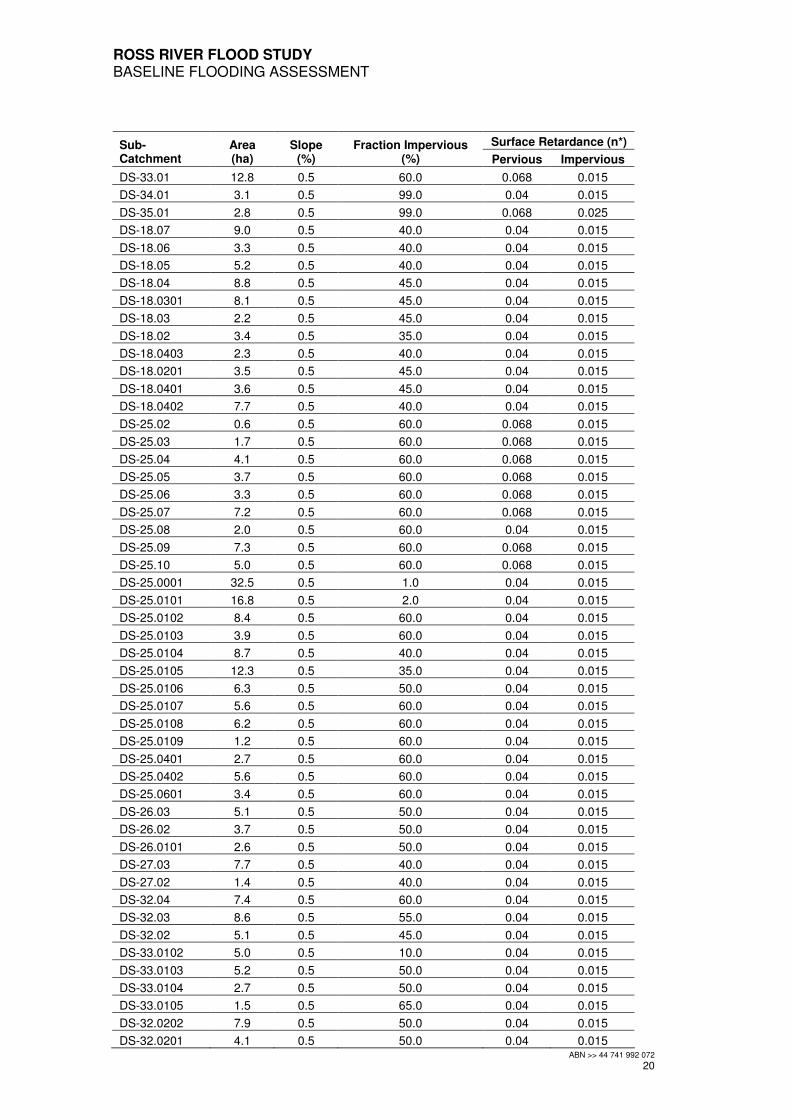
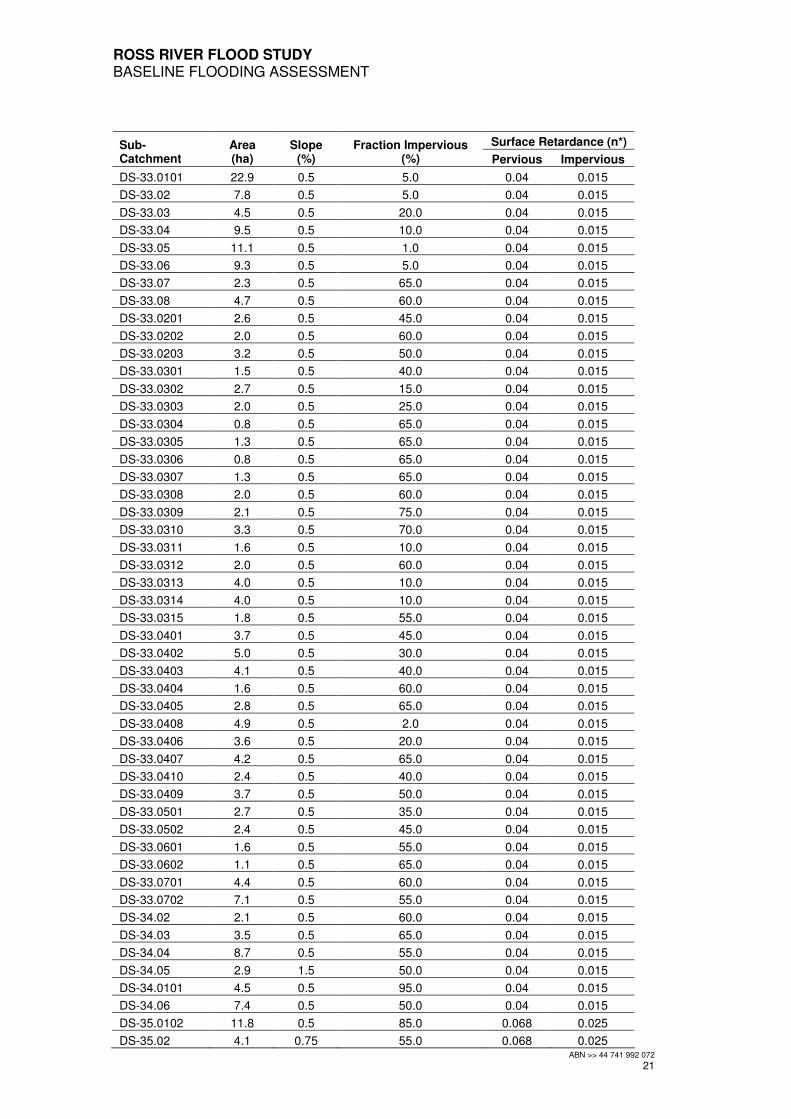
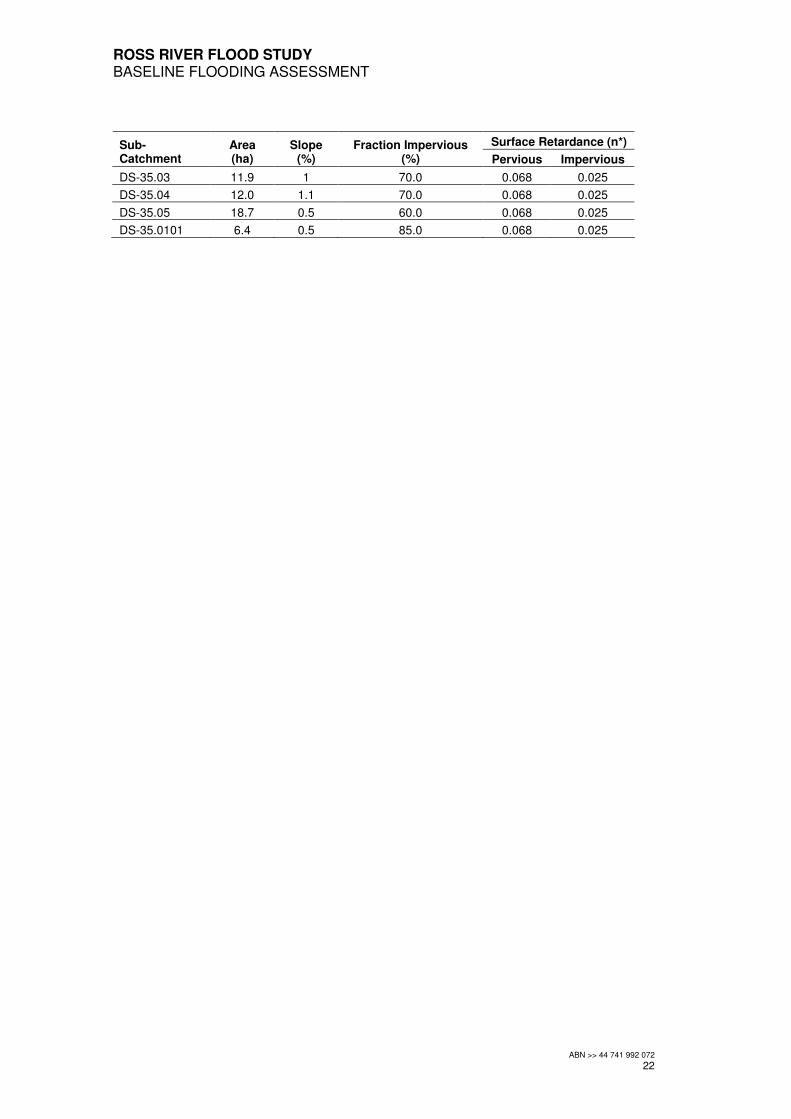
Table 3-2 Ross River Downstream Sub-Catchment Parameters
Surface Retardance (n*) Sub-Catchment
Area (ha)
Slope (%)
Fraction Impervious (%) Pervious Impervious
DS-1.00 136.8 7.14 0.0 0.068 0.025
DS-2.00 183.0 8.45 0.0 0.068 0.025
DS-3.00 131.2 10.2 0.0 0.068 0.025
DS-4.00 255.6 2.3 5.0 0.068 0.025
DS-5.00 47.5 1.3 0.0 0.068 0.025
DS-6.00 153.6 1.9 1.0 0.068 0.025
DS-7.00 251.8 2.6 1.0 0.068 0.025
DS-8.00 164.5 2.7 3.0 0.068 0.025
DS-9.00 151.0 5.7 8.0 0.068 0.025
DS-10.00 10.7 0.5 100.0 0.068 0.025
DS-11.00 31.1 0.5 100.0 0.068 0.025
DS-12.00 6.6 0.5 100.0 0.068 0.025
DS-13.00 13.1 0.5 100.0 0.068 0.025
DS-14.00 2.8 0.5 100.0 0.068 0.025
DS-15.00 7.3 0.5 100.0 0.068 0.025
DS-16.00 5.4 0.5 100.0 0.068 0.025
DS-17.00 11.8 0.5 100.0 0.068 0.025
DS-18.00 10.7 0.5 100.0 0.068 0.025
DS-19.00 15.5 0.5 100.0 0.068 0.025
DS-20.00 6.7 0.5 100.0 0.068 0.025
DS-21.00 17.4 0.5 50.0 0.068 0.025
DS-22.00 22.2 0.5 50.0 0.068 0.025
DS-23.00 23.7 0.5 60.0 0.068 0.025
DS-24.00 58.4 0.5 60.0 0.068 0.025
DS-25.00 65.1 0.5 50.0 0.068 0.025
DS-26.00 9.7 0.5 50.0 0.068 0.025
DS-27.00 10.5 0.5 80.0 0.068 0.025
DS-28.00 19.5 0.5 50.0 0.068 0.025
DS-29.00 22.1 0.5 40.0 0.068 0.025
DS-30.00 14.9 0.5 100.0 0.068 0.025
DS-31.00 74.9 0.5 30.0 0.068 0.025
DS-32.00 9.9 0.5 90.0 0.068 0.025
DS-33.00 13.8 0.5 90.0 0.068 0.025
DS-34.00 11.1 0.5 90.0 0.068 0.025
DS-35.00 11.9 0.5 90.0 0.068 0.025
DS-5.04 191.9 13.1 0.0 0.068 0.025
DS-5.03 188.8 10.3 0.0 0.068 0.025
DS5.02 144.8 12.9 1.0 0.068 0.025
DS-5.01 128.1 2.1 5.0 0.068 0.025
DS-5.02.01 154.4 14 0.0 0.068 0.025
DS-18.01 7.4 0.5 35.0 0.068 0.015
DS-25.01 4.2 0.5 2.0 0.068 0.015
DS-26.01 1.8 0.5 50.0 0.068 0.015
DS-27.01 3.2 0.5 35.0 0.068 0.015
DS-28.01 36.6 0.5 50.0 0.068 0.025
DS-30.01 61.1 0.5 1.0 0.068 0.025
DS-30.03 28.1 0.5 50.0 0.068 0.025
DS-30.02 14.6 0.5 50.0 0.068 0.025
DS-32.01 13.1 0.5 5.0 0.068 0.025
ROSS RIVER FLOOD STUDY BASELINE FLOODING ASSESSMENT
ABN >> 44 741 992 072
20
Surface Retardance (n*) Sub-Catchment
Area (ha)
Slope (%)
Fraction Impervious (%) Pervious Impervious
DS-33.01 12.8 0.5 60.0 0.068 0.015
DS-34.01 3.1 0.5 99.0 0.04 0.015
DS-35.01 2.8 0.5 99.0 0.068 0.025
DS-18.07 9.0 0.5 40.0 0.04 0.015
DS-18.06 3.3 0.5 40.0 0.04 0.015
DS-18.05 5.2 0.5 40.0 0.04 0.015
DS-18.04 8.8 0.5 45.0 0.04 0.015
DS-18.0301 8.1 0.5 45.0 0.04 0.015
DS-18.03 2.2 0.5 45.0 0.04 0.015
DS-18.02 3.4 0.5 35.0 0.04 0.015
DS-18.0403 2.3 0.5 40.0 0.04 0.015
DS-18.0201 3.5 0.5 45.0 0.04 0.015
DS-18.0401 3.6 0.5 45.0 0.04 0.015
DS-18.0402 7.7 0.5 40.0 0.04 0.015
DS-25.02 0.6 0.5 60.0 0.068 0.015
DS-25.03 1.7 0.5 60.0 0.068 0.015
DS-25.04 4.1 0.5 60.0 0.068 0.015
DS-25.05 3.7 0.5 60.0 0.068 0.015
DS-25.06 3.3 0.5 60.0 0.068 0.015
DS-25.07 7.2 0.5 60.0 0.068 0.015
DS-25.08 2.0 0.5 60.0 0.04 0.015
DS-25.09 7.3 0.5 60.0 0.068 0.015
DS-25.10 5.0 0.5 60.0 0.068 0.015
DS-25.0001 32.5 0.5 1.0 0.04 0.015
DS-25.0101 16.8 0.5 2.0 0.04 0.015
DS-25.0102 8.4 0.5 60.0 0.04 0.015
DS-25.0103 3.9 0.5 60.0 0.04 0.015
DS-25.0104 8.7 0.5 40.0 0.04 0.015
DS-25.0105 12.3 0.5 35.0 0.04 0.015
DS-25.0106 6.3 0.5 50.0 0.04 0.015
DS-25.0107 5.6 0.5 60.0 0.04 0.015
DS-25.0108 6.2 0.5 60.0 0.04 0.015
DS-25.0109 1.2 0.5 60.0 0.04 0.015
DS-25.0401 2.7 0.5 60.0 0.04 0.015
DS-25.0402 5.6 0.5 60.0 0.04 0.015
DS-25.0601 3.4 0.5 60.0 0.04 0.015
DS-26.03 5.1 0.5 50.0 0.04 0.015
DS-26.02 3.7 0.5 50.0 0.04 0.015
DS-26.0101 2.6 0.5 50.0 0.04 0.015
DS-27.03 7.7 0.5 40.0 0.04 0.015
DS-27.02 1.4 0.5 40.0 0.04 0.015
DS-32.04 7.4 0.5 60.0 0.04 0.015
DS-32.03 8.6 0.5 55.0 0.04 0.015
DS-32.02 5.1 0.5 45.0 0.04 0.015
DS-33.0102 5.0 0.5 10.0 0.04 0.015
DS-33.0103 5.2 0.5 50.0 0.04 0.015
DS-33.0104 2.7 0.5 50.0 0.04 0.015
DS-33.0105 1.5 0.5 65.0 0.04 0.015
DS-32.0202 7.9 0.5 50.0 0.04 0.015
DS-32.0201 4.1 0.5 50.0 0.04 0.015
ROSS RIVER FLOOD STUDY BASELINE FLOODING ASSESSMENT
ABN >> 44 741 992 072
21
Surface Retardance (n*) Sub-Catchment
Area (ha)
Slope (%)
Fraction Impervious (%) Pervious Impervious
DS-33.0101 22.9 0.5 5.0 0.04 0.015
DS-33.02 7.8 0.5 5.0 0.04 0.015
DS-33.03 4.5 0.5 20.0 0.04 0.015
DS-33.04 9.5 0.5 10.0 0.04 0.015
DS-33.05 11.1 0.5 1.0 0.04 0.015
DS-33.06 9.3 0.5 5.0 0.04 0.015
DS-33.07 2.3 0.5 65.0 0.04 0.015
DS-33.08 4.7 0.5 60.0 0.04 0.015
DS-33.0201 2.6 0.5 45.0 0.04 0.015
DS-33.0202 2.0 0.5 60.0 0.04 0.015
DS-33.0203 3.2 0.5 50.0 0.04 0.015
DS-33.0301 1.5 0.5 40.0 0.04 0.015
DS-33.0302 2.7 0.5 15.0 0.04 0.015
DS-33.0303 2.0 0.5 25.0 0.04 0.015
DS-33.0304 0.8 0.5 65.0 0.04 0.015
DS-33.0305 1.3 0.5 65.0 0.04 0.015
DS-33.0306 0.8 0.5 65.0 0.04 0.015
DS-33.0307 1.3 0.5 65.0 0.04 0.015
DS-33.0308 2.0 0.5 60.0 0.04 0.015
DS-33.0309 2.1 0.5 75.0 0.04 0.015
DS-33.0310 3.3 0.5 70.0 0.04 0.015
DS-33.0311 1.6 0.5 10.0 0.04 0.015
DS-33.0312 2.0 0.5 60.0 0.04 0.015
DS-33.0313 4.0 0.5 10.0 0.04 0.015
DS-33.0314 4.0 0.5 10.0 0.04 0.015
DS-33.0315 1.8 0.5 55.0 0.04 0.015
DS-33.0401 3.7 0.5 45.0 0.04 0.015
DS-33.0402 5.0 0.5 30.0 0.04 0.015
DS-33.0403 4.1 0.5 40.0 0.04 0.015
DS-33.0404 1.6 0.5 60.0 0.04 0.015
DS-33.0405 2.8 0.5 65.0 0.04 0.015
DS-33.0408 4.9 0.5 2.0 0.04 0.015
DS-33.0406 3.6 0.5 20.0 0.04 0.015
DS-33.0407 4.2 0.5 65.0 0.04 0.015
DS-33.0410 2.4 0.5 40.0 0.04 0.015
DS-33.0409 3.7 0.5 50.0 0.04 0.015
DS-33.0501 2.7 0.5 35.0 0.04 0.015
DS-33.0502 2.4 0.5 45.0 0.04 0.015
DS-33.0601 1.6 0.5 55.0 0.04 0.015
DS-33.0602 1.1 0.5 65.0 0.04 0.015
DS-33.0701 4.4 0.5 60.0 0.04 0.015
DS-33.0702 7.1 0.5 55.0 0.04 0.015
DS-34.02 2.1 0.5 60.0 0.04 0.015
DS-34.03 3.5 0.5 65.0 0.04 0.015
DS-34.04 8.7 0.5 55.0 0.04 0.015
DS-34.05 2.9 1.5 50.0 0.04 0.015
DS-34.0101 4.5 0.5 95.0 0.04 0.015
DS-34.06 7.4 0.5 50.0 0.04 0.015
DS-35.0102 11.8 0.5 85.0 0.068 0.025
DS-35.02 4.1 0.75 55.0 0.068 0.025
ROSS RIVER FLOOD STUDY BASELINE FLOODING ASSESSMENT
ABN >> 44 741 992 072
22
Surface Retardance (n*) Sub-Catchment
Area (ha)
Slope (%)
Fraction Impervious (%) Pervious Impervious
DS-35.03 11.9 1 70.0 0.068 0.025
DS-35.04 12.0 1.1 70.0 0.068 0.025
DS-35.05 18.7 0.5 60.0 0.068 0.025
DS-35.0101 6.4 0.5 85.0 0.068 0.025

ROSS RIVER FLOOD STUDY BASELINE FLOODING ASSESSMENT
ABN >> 44 741 992 072
23
3.5 Dam Storage and Discharge Relationships
Subsequent to the completion of Ross River Dam Upgrade Stage 2 to 5 – Hydrology Study (SKM, 2005), a survey of the dam storage capacity was completed. The stage-storage and storage-discharge relationships in the RORB model were amended to incorporate the new survey. The stage-storage relationship is shown in Figure 3-2. Figure 3-2 Ross River Dam Stage Storage Relationship
Stage Storage Comparison
15
20
25
30
35
40
45
50
55
0 500000000 1000000000 1500000000 2000000000 2500000000
Storage (m3)
Le
ve
l (m
AH
D)
Previous Stage Storage Surveyed Stage Storage
The storage-discharge relationship was also updated to reflect the new survey of the dam storage capacity in addition to the revised Ross River Dam gate operations. The storage-discharge relationships are provided in Figure 3-3.

ROSS RIVER FLOOD STUDY BASELINE FLOODING ASSESSMENT
ABN >> 44 741 992 072
24
Figure 3-3 Ross River Dam Storage-Discharge Relationship (3 Gates)
Discharge Storage Relationship
0
500
1000
1500
2000
2500
3000
3500
200000000 300000000 400000000 500000000 600000000 700000000 800000000 900000000 1000000000
Storage Volume (m3)
Dis
ch
arg
e (
m3/s
)
Previous Relationship New Survey Original Operations New Survey Revised Operations
3.6 Model Verification
To verify the performance of the hydrological models, their ability to replicate flow conditions was benchmarked. For the Ross River Upstream model, the model was calibrated to recorded flows at the Ross River Dam spillway. For the Ross River Downstream model, peak flow rates determined from the model were compared to results of Rational Method calculations. Details of both model verifications are provided below. There has been no comparison to flood frequency assessment, as there is an insufficient period of stream gauging record since the construction of the new dam spillway. The revision to gate operations will also split the water level/flow recorded dataset for any future consideration of flood frequency. Ross River Upstream - December 2010 Event The 2010 and 2011 wet season for Townsville, was quite prolonged with some periods of moderate intensity resulting in numerous flow events over the Ross River Dam spillway. The flow event around the 27th of December produced the highest peak flow during the season of approximately 317 m3/s between 03:00 and 15:00 on 27/12/2010. The rainfall generating this event occurred between 0:00 23/12/2010 and 0:00 28/12/2010 with recorded rainfall totals in the catchment between 234 mm and 325 mm. The summary of recorded rainfall depths for the event is provided in Table 3-3.
ROSS RIVER FLOOD STUDY BASELINE FLOODING ASSESSMENT
ABN >> 44 741 992 072
25
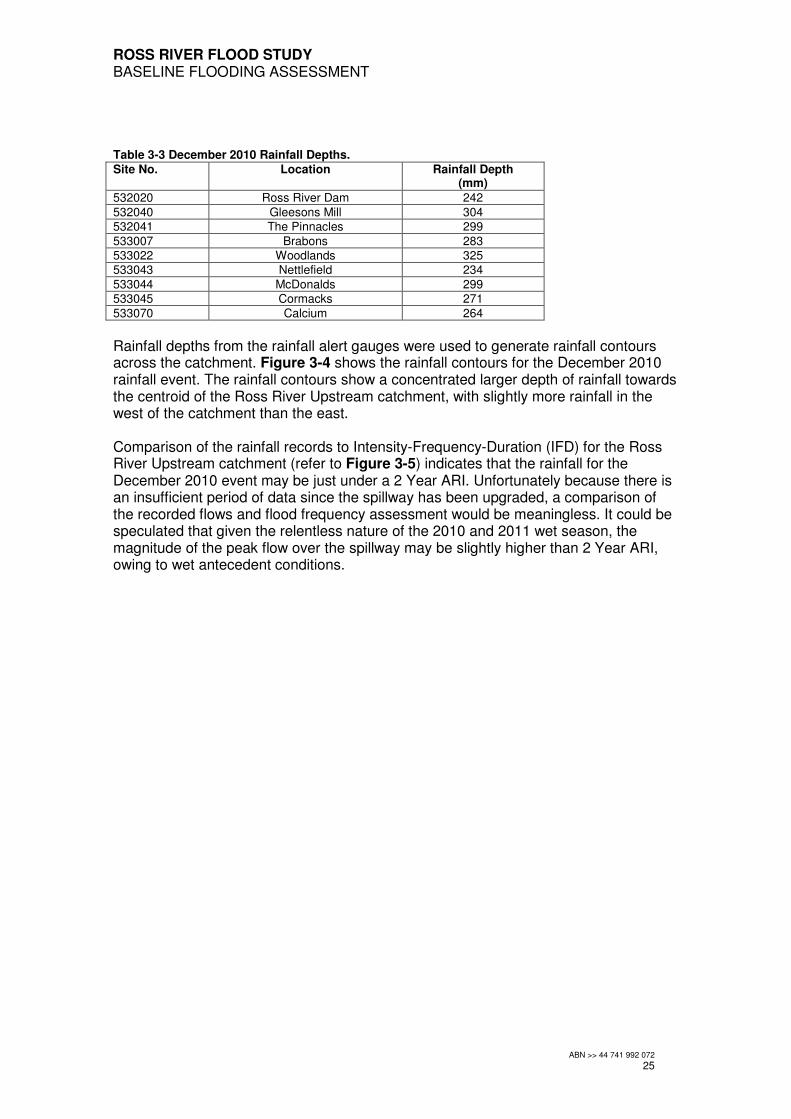
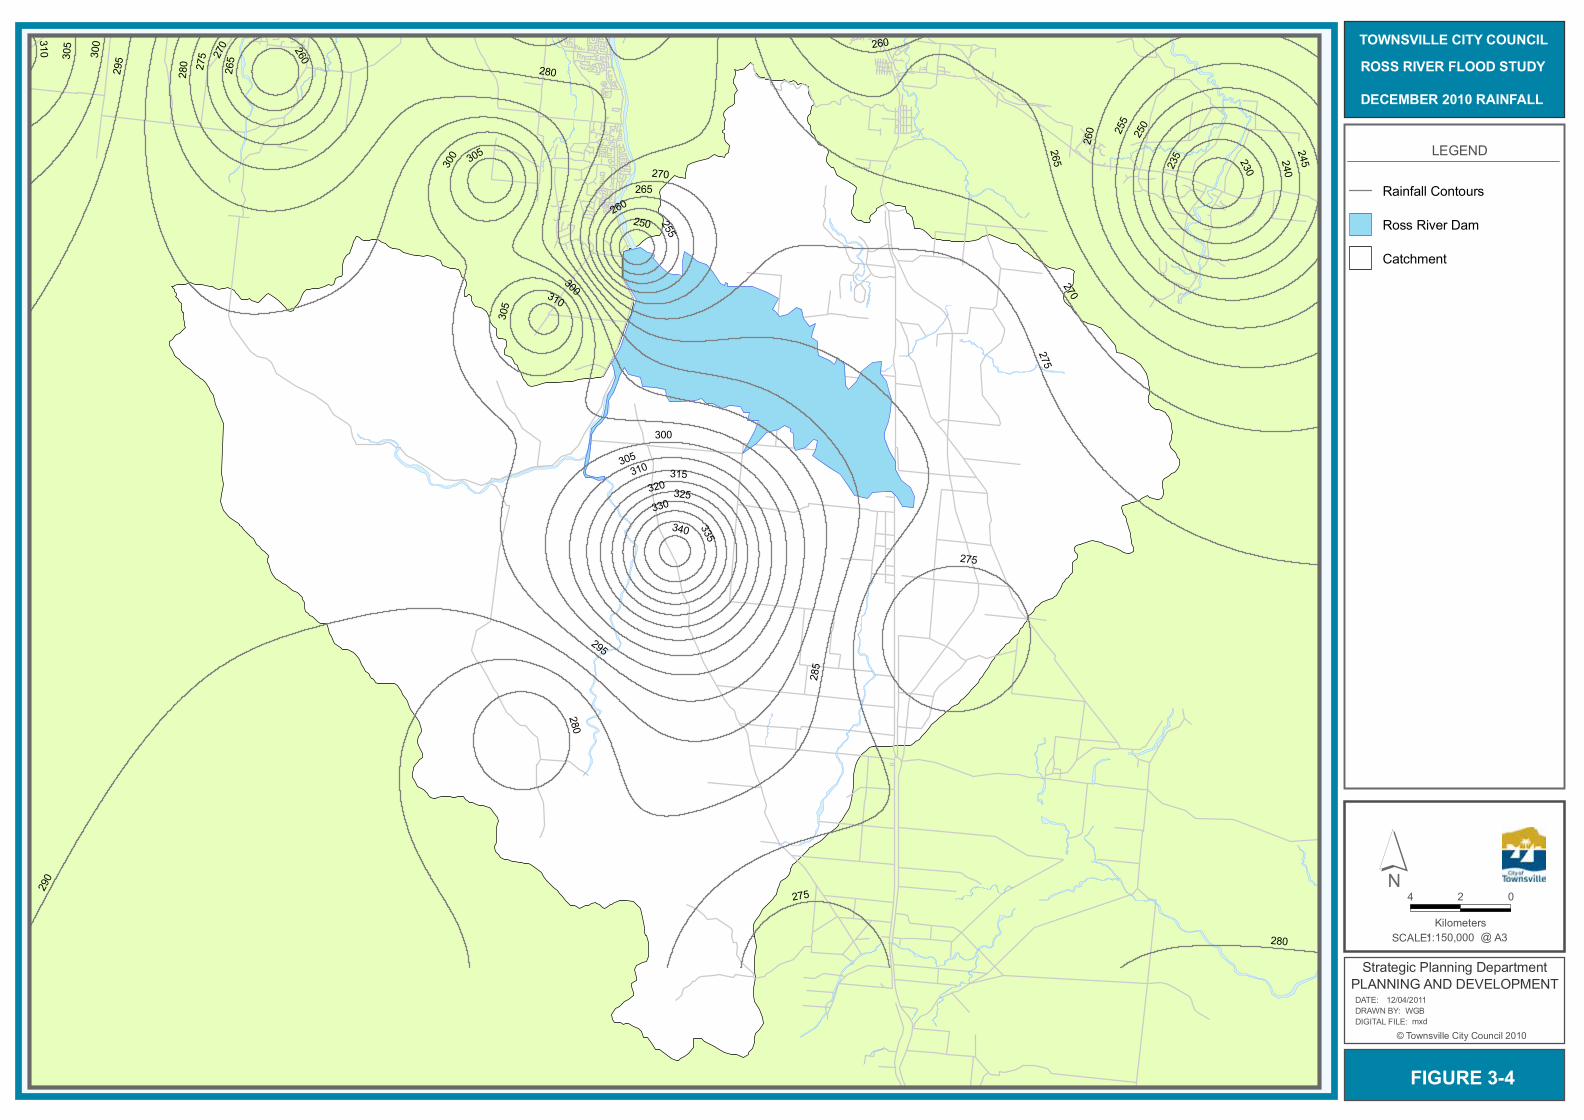
Table 3-3 December 2010 Rainfall Depths.
Site No. Location Rainfall Depth (mm)
532020 Ross River Dam 242
532040 Gleesons Mill 304 532041 The Pinnacles 299
533007 Brabons 283 533022 Woodlands 325 533043 Nettlefield 234
533044 McDonalds 299 533045 Cormacks 271
533070 Calcium 264
Rainfall depths from the rainfall alert gauges were used to generate rainfall contours across the catchment. Figure 3-4 shows the rainfall contours for the December 2010 rainfall event. The rainfall contours show a concentrated larger depth of rainfall towards the centroid of the Ross River Upstream catchment, with slightly more rainfall in the west of the catchment than the east. Comparison of the rainfall records to Intensity-Frequency-Duration (IFD) for the Ross River Upstream catchment (refer to Figure 3-5) indicates that the rainfall for the December 2010 event may be just under a 2 Year ARI. Unfortunately because there is an insufficient period of data since the spillway has been upgraded, a comparison of the recorded flows and flood frequency assessment would be meaningless. It could be speculated that given the relentless nature of the 2010 and 2011 wet season, the magnitude of the peak flow over the spillway may be slightly higher than 2 Year ARI, owing to wet antecedent conditions.
285
280
290
275270
265
295
260
300
255
305
250
310
245
315320
240
325
235
330
335
230
340
310
280
26527
0
280
26026
5
305
310
280
260
300
275
300 305270
275
300
295
260
255
275
305
250
LEGEND
Rainfall Contours
Ross River Dam
Catchment
FIGURE 3-4
SCALE: @1:150,000
4 02
KilometersA3
TOWNSVILLE CITY COUNCILROSS RIVER FLOOD STUDYDECEMBER 2010 RAINFALL
© Townsville City Council 2010DIGITAL FILE: DRAWN BY: DATE:
Strategic Planning DepartmentPLANNING AND DEVELOPMENT
mxdWGB
12/04/2011
´
ROSS RIVER FLOOD STUDY BASELINE FLOODING ASSESSMENT
ABN >> 44 741 992 072
27
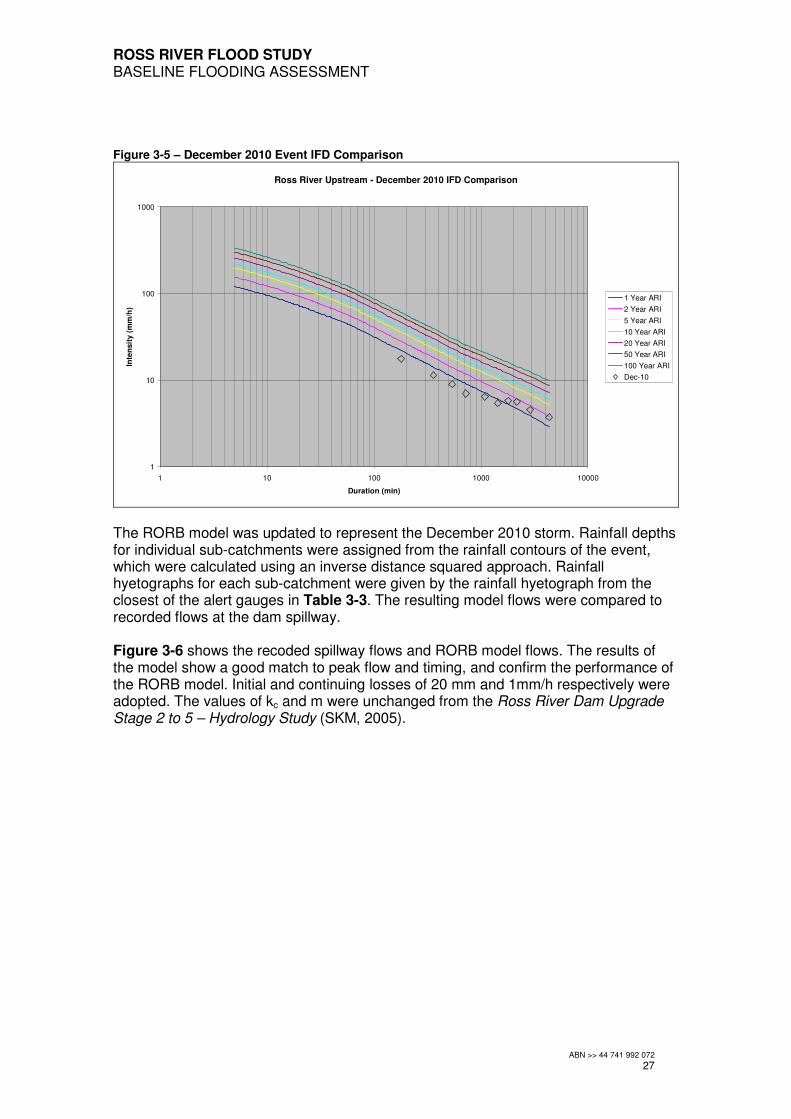
Figure 3-5 – December 2010 Event IFD Comparison
Ross River Upstream - December 2010 IFD Comparison
1
10
100
1000
1 10 100 1000 10000
Duration (min)
Inte
nsit
y (
mm
/h)
1 Year ARI
2 Year ARI
5 Year ARI
10 Year ARI
20 Year ARI
50 Year ARI
100 Year ARI
Dec-10
The RORB model was updated to represent the December 2010 storm. Rainfall depths for individual sub-catchments were assigned from the rainfall contours of the event, which were calculated using an inverse distance squared approach. Rainfall hyetographs for each sub-catchment were given by the rainfall hyetograph from the closest of the alert gauges in Table 3-3. The resulting model flows were compared to recorded flows at the dam spillway. Figure 3-6 shows the recoded spillway flows and RORB model flows. The results of the model show a good match to peak flow and timing, and confirm the performance of the RORB model. Initial and continuing losses of 20 mm and 1mm/h respectively were adopted. The values of kc and m were unchanged from the Ross River Dam Upgrade Stage 2 to 5 – Hydrology Study (SKM, 2005).

ROSS RIVER FLOOD STUDY BASELINE FLOODING ASSESSMENT
ABN >> 44 741 992 072
28
Figure 3-6 Calibration Flows, Ross River Dam – December 2010
Ross River Dam - December 2010
0
50
100
150
200
250
300
350
23/12/2010 0:00
24/12/2010 0:00
25/12/2010 0:00
26/12/2010 0:00
27/12/2010 0:00
28/12/2010 0:00
29/12/2010 0:00
30/12/2010 0:00
31/12/2010 0:00
Date Time
Flo
w (
m3/s
)
Recorded
Modelled
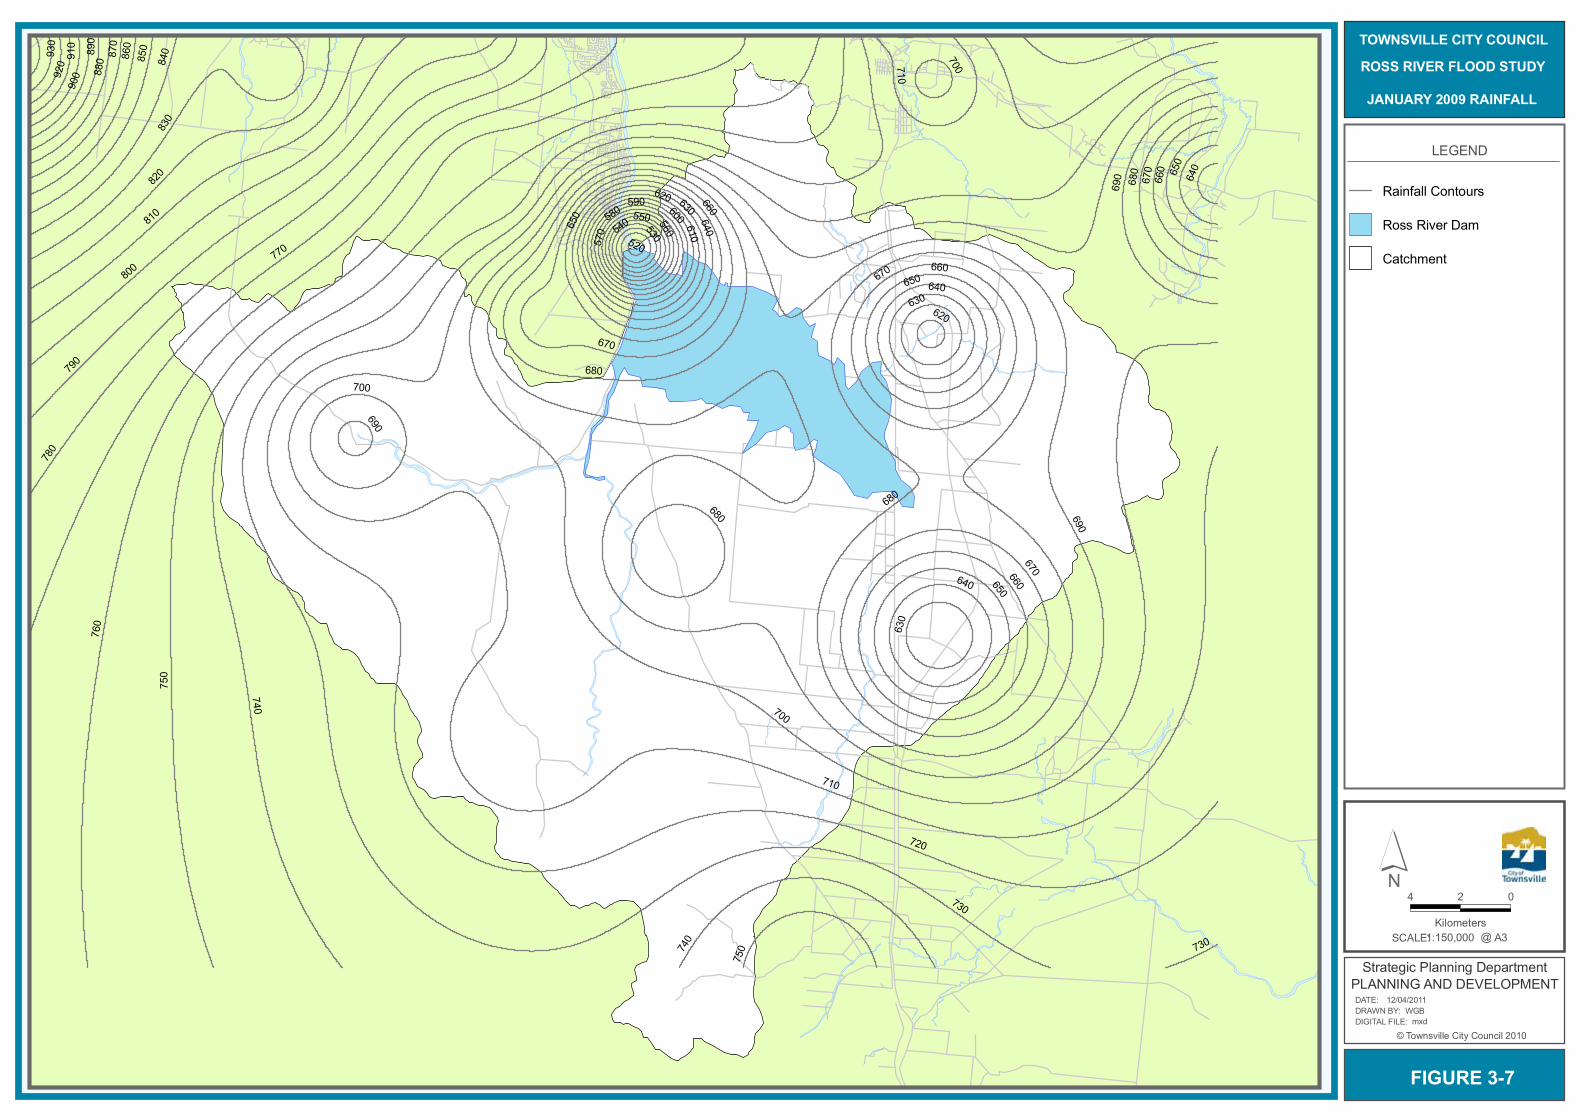
Ross River Upstream - January 2009 In late January / early February 2009 a period of sustained wet between caused high-flows within Ross River. Flows above 200 m3/s were recorded between the 2nd and 14th of February with peaks of approximately 500 m3/s on the 4th, 370 m3/s on the 8th and 220 m3/s between the 11th and 13th. The rainfall generating this event occurred between 9:00 29/01/2009 and 0:00 13/02/2009 with recorded rainfall totals in the catchment between 516 mm and 757 mm. The summary of recorded rainfall depths for the event is provided in Table 3-4. Table 3-4 January 2009 Rainfall Depths. Site No. Location Rainfall Depth
(mm)
532020 Ross River Dam 516 532040 Gleesons Mill 664 532041 The Pinnacles 740
533007 Brabons 688 533022 Woodlands 671
533043 Nettlefield 701 533044 McDonalds 621 533045 Cormacks 617
533070 Calcium 757
Rainfall depths from the rainfall alert gauges were used to generate rainfall contours across the catchment. Figure 3-7 shows the rainfall contours for the January 2009 rainfall event. The rainfall contours show that there is generally more rainfall in the west of the catchment than in the east.
750
760
740
730
710
720
770
700
690
780790
680
800
810
820830
840850
670
860
660
870
880
650
890
640
630
900
620
910
610600
920
590580
930
570
560
550540 530520
620
690
630
640
680 640
680
730
660
710
750
700
670
660
660650 640
690
680
650
670
670
740
700
650
630
LEGEND
Rainfall Contours
Ross River Dam
Catchment
FIGURE 3-7
SCALE: @1:150,000
4 02
KilometersA3
TOWNSVILLE CITY COUNCILROSS RIVER FLOOD STUDYJANUARY 2009 RAINFALL
© Townsville City Council 2010DIGITAL FILE: DRAWN BY: DATE:
Strategic Planning DepartmentPLANNING AND DEVELOPMENT
mxdWGB
12/04/2011
´

ROSS RIVER FLOOD STUDY BASELINE FLOODING ASSESSMENT
ABN >> 44 741 992 072
30
Comparison of the rainfall records to Intensity-Frequency-Duration (IFD) for the Ross River Upstream catchment (refer to Figure 3-8) indicates that the rainfall for the January 2009 event may be just under a 5 Year ARI. Unfortunately because there is an insufficient period of data since the spillway has been upgraded, a comparison of the recorded flows and flood frequency assessment would be meaningless. Figure 3-8 January 2009 IFD Comparison
Ross River Upstream - January 2009 IFD Comparison
1
10
100
1000
1 10 100 1000 10000
Duration (min)
Inte
ns
ity
(m
m/h
)
1 Year ARI
2 Year ARI
5 Year ARI
10 Year ARI
20 Year ARI
50 Year ARI
100 Year ARI
Jan-09
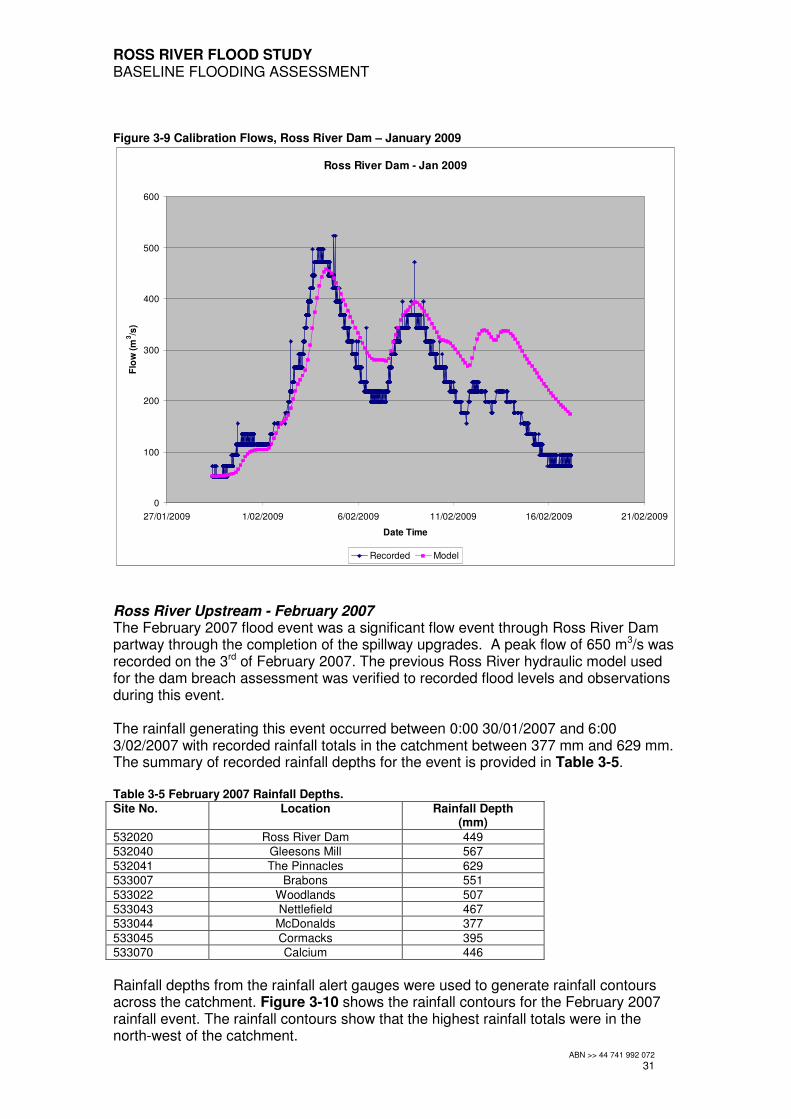
The RORB model was updated to represent the January 2009 Rainfall. Rainfall depths for individual sub-catchments were assigned from the rainfall contours of the event, which were calculated using an inverse distance squared approach. Rainfall hyetographs for each sub-catchment were given by the rainfall hyetograph from the closest of the alert gauges in Table 3-4. The resulting model flows were compared to recorded flows at the dam spillway. Figure 3-9 shows the recoded spillway flows and RORB model flows. The results of the model show a good match to the first two peaks and timing. The model over-predicts the final peaks of the event, however, the timing is well matched. With such a long duration event, any event based hydrological model will have trouble in replicating peaks towards the end of the event. There is potential for evaporation to dry out some of the surface depression storages, which are assumed to fill through applying initial losses. For event based hydrological models, the initial loss is applied only at the start of the event. Initial and continuing losses of 20 mm and 0.75mm/h respectively were adopted. The values of kc and m were unchanged from the Ross River Dam Upgrade Stage 2 to 5 – Hydrology Study (SKM, 2005). The results indicate that the model still has a good match to initial peaks, volume and timing despite not being able to match the later peaks of the event. Being unable to match these later peaks will not affect the models ability to be applied to design rainfall events as design storms will be under 7 days in duration.
ROSS RIVER FLOOD STUDY BASELINE FLOODING ASSESSMENT
ABN >> 44 741 992 072
31
Figure 3-9 Calibration Flows, Ross River Dam – January 2009
Ross River Dam - Jan 2009
0
100
200
300
400
500
600
27/01/2009 1/02/2009 6/02/2009 11/02/2009 16/02/2009 21/02/2009
Date Time
Flo
w (
m3/s
)
Recorded Model
Ross River Upstream - February 2007 The February 2007 flood event was a significant flow event through Ross River Dam partway through the completion of the spillway upgrades. A peak flow of 650 m3/s was recorded on the 3rd of February 2007. The previous Ross River hydraulic model used for the dam breach assessment was verified to recorded flood levels and observations during this event. The rainfall generating this event occurred between 0:00 30/01/2007 and 6:00 3/02/2007 with recorded rainfall totals in the catchment between 377 mm and 629 mm. The summary of recorded rainfall depths for the event is provided in Table 3-5. Table 3-5 February 2007 Rainfall Depths. Site No. Location Rainfall Depth
(mm)
532020 Ross River Dam 449 532040 Gleesons Mill 567
532041 The Pinnacles 629 533007 Brabons 551
533022 Woodlands 507 533043 Nettlefield 467 533044 McDonalds 377
533045 Cormacks 395 533070 Calcium 446
Rainfall depths from the rainfall alert gauges were used to generate rainfall contours across the catchment. Figure 3-10 shows the rainfall contours for the February 2007 rainfall event. The rainfall contours show that the highest rainfall totals were in the north-west of the catchment.

535
530
525 520
515
540
510
545
505 500
550
495490
485
470
475
480
555
560
465
46056
557
0 455
575 580
585
450
44544
0
435
590
430425
595
420
600
415
605
620
410
625
610
405
615
400
500
460
560
520
560
495
525
470
570
530
570
46052
0530
425625
565
465
475
455
490
540
455
475
535
440
455
600
525
590
565
480
620
590575
575
435
600
550
450
550
595
515
550 605
595
480485
535
510
545
585
545
490
465
540
450
555
465
430
505
500
485
475
460
445
495
495
470
480
580
510
450
420
LEGEND
Rainfall Contours
Ross River Dam
Catchment
FIGURE 3-10
SCALE: @1:150,000
4 02
KilometersA3
TOWNSVILLE CITY COUNCILROSS RIVER FLOOD STUDYFEBRUARY 2007 RAINFALL
© Townsville City Council 2010DIGITAL FILE: DRAWN BY: DATE:
Strategic Planning DepartmentPLANNING AND DEVELOPMENT
mxdWGB
12/04/2011
´
ROSS RIVER FLOOD STUDY BASELINE FLOODING ASSESSMENT
ABN >> 44 741 992 072
33
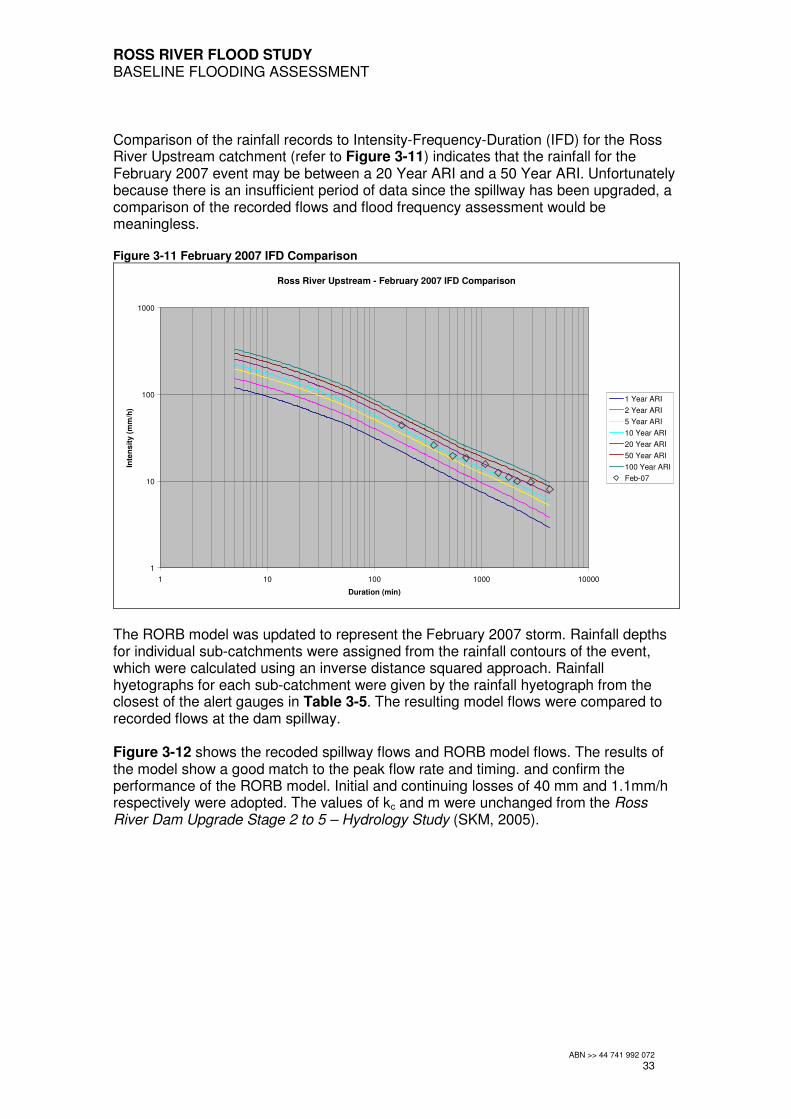
Comparison of the rainfall records to Intensity-Frequency-Duration (IFD) for the Ross River Upstream catchment (refer to Figure 3-11) indicates that the rainfall for the February 2007 event may be between a 20 Year ARI and a 50 Year ARI. Unfortunately because there is an insufficient period of data since the spillway has been upgraded, a comparison of the recorded flows and flood frequency assessment would be meaningless. Figure 3-11 February 2007 IFD Comparison
Ross River Upstream - February 2007 IFD Comparison
1
10
100
1000
1 10 100 1000 10000
Duration (min)
Inte
ns
ity
(m
m/h
)
1 Year ARI
2 Year ARI
5 Year ARI
10 Year ARI
20 Year ARI
50 Year ARI
100 Year ARI
Feb-07
The RORB model was updated to represent the February 2007 storm. Rainfall depths for individual sub-catchments were assigned from the rainfall contours of the event, which were calculated using an inverse distance squared approach. Rainfall hyetographs for each sub-catchment were given by the rainfall hyetograph from the closest of the alert gauges in Table 3-5. The resulting model flows were compared to recorded flows at the dam spillway. Figure 3-12 shows the recoded spillway flows and RORB model flows. The results of the model show a good match to the peak flow rate and timing. and confirm the performance of the RORB model. Initial and continuing losses of 40 mm and 1.1mm/h respectively were adopted. The values of kc and m were unchanged from the Ross River Dam Upgrade Stage 2 to 5 – Hydrology Study (SKM, 2005).

ROSS RIVER FLOOD STUDY BASELINE FLOODING ASSESSMENT
ABN >> 44 741 992 072
34
Figure 3-12 Calibration Flows, Ross River Dam – February 2007
Ross River Dam - February 2007
0
100
200
300
400
500
600
700
31/01/2007
0:00
1/02/2007
0:00
2/02/2007
0:00
3/02/2007
0:00
4/02/2007
0:00
5/02/2007
0:00
6/02/2007
0:00
7/02/2007
0:00
8/02/2007
0:00
Date Time
Flo
w (
m3/s
)
Recorded Model
Ross River Upstream - January 1998 The January 1998 flood event is the largest flooding event in recent history within Townsville. The flooding was the result of localised rainfall on the catchment downstream of Ross River Dam, rather than flows over the dam. Despite this the flood event has been used to verify the RORB model, given the event’s significance to the community. A peak flow of 270 m3/s was recorded on the 13th of January 1998 well after the flooding rains on the night of the 10th of January. The rainfall generating the flow event in Ross River occurred between 6:00 10/01/1998 and 15:00 12/01/1998 with recorded rainfall totals in the catchment between 284 mm and 710 mm. The summary of recorded rainfall depths for the event is provided in Table 3-6. It should be noted that the rainfall alert network has been expanded since the January 1998 event and there were only 4 rainfall gauges within the catchment for the event. Table 3-6 January 1998 Rainfall Depths. Site No. Location Rainfall Depth
(mm)
533007 Brabons 710 533043 Nettlefield 504 533044 McDonalds 284
533045 Cormacks 492
Rainfall depths from the rainfall alert gauges were used to define rainfall depths for individual sub-catchment using an inverse distance squared method. Rainfall contours for the event were not produced due to the sparseness of the data.
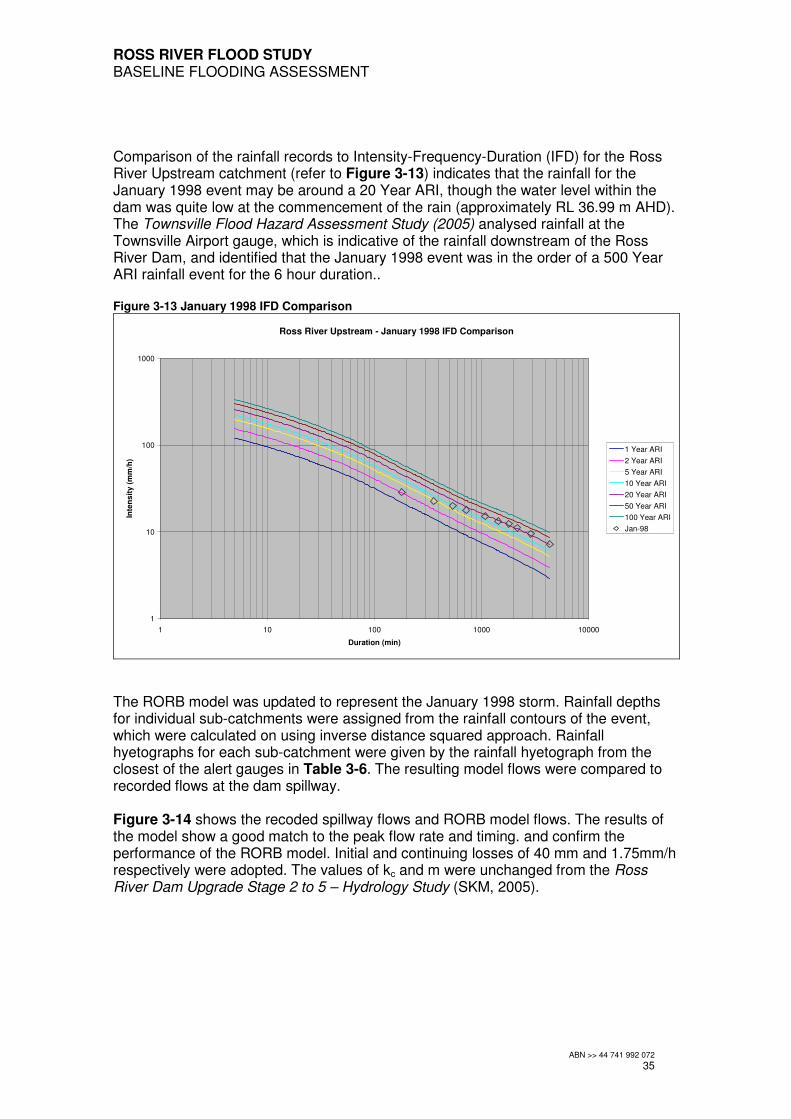
ROSS RIVER FLOOD STUDY BASELINE FLOODING ASSESSMENT
ABN >> 44 741 992 072
35
Comparison of the rainfall records to Intensity-Frequency-Duration (IFD) for the Ross River Upstream catchment (refer to Figure 3-13) indicates that the rainfall for the January 1998 event may be around a 20 Year ARI, though the water level within the dam was quite low at the commencement of the rain (approximately RL 36.99 m AHD). The Townsville Flood Hazard Assessment Study (2005) analysed rainfall at the Townsville Airport gauge, which is indicative of the rainfall downstream of the Ross River Dam, and identified that the January 1998 event was in the order of a 500 Year ARI rainfall event for the 6 hour duration.. Figure 3-13 January 1998 IFD Comparison
Ross River Upstream - January 1998 IFD Comparison
1
10
100
1000
1 10 100 1000 10000
Duration (min)
Inte
ns
ity
(m
m/h
)
1 Year ARI
2 Year ARI
5 Year ARI
10 Year ARI
20 Year ARI
50 Year ARI
100 Year ARI
Jan-98
The RORB model was updated to represent the January 1998 storm. Rainfall depths for individual sub-catchments were assigned from the rainfall contours of the event, which were calculated on using inverse distance squared approach. Rainfall hyetographs for each sub-catchment were given by the rainfall hyetograph from the closest of the alert gauges in Table 3-6. The resulting model flows were compared to recorded flows at the dam spillway. Figure 3-14 shows the recoded spillway flows and RORB model flows. The results of the model show a good match to the peak flow rate and timing. and confirm the performance of the RORB model. Initial and continuing losses of 40 mm and 1.75mm/h respectively were adopted. The values of kc and m were unchanged from the Ross River Dam Upgrade Stage 2 to 5 – Hydrology Study (SKM, 2005).
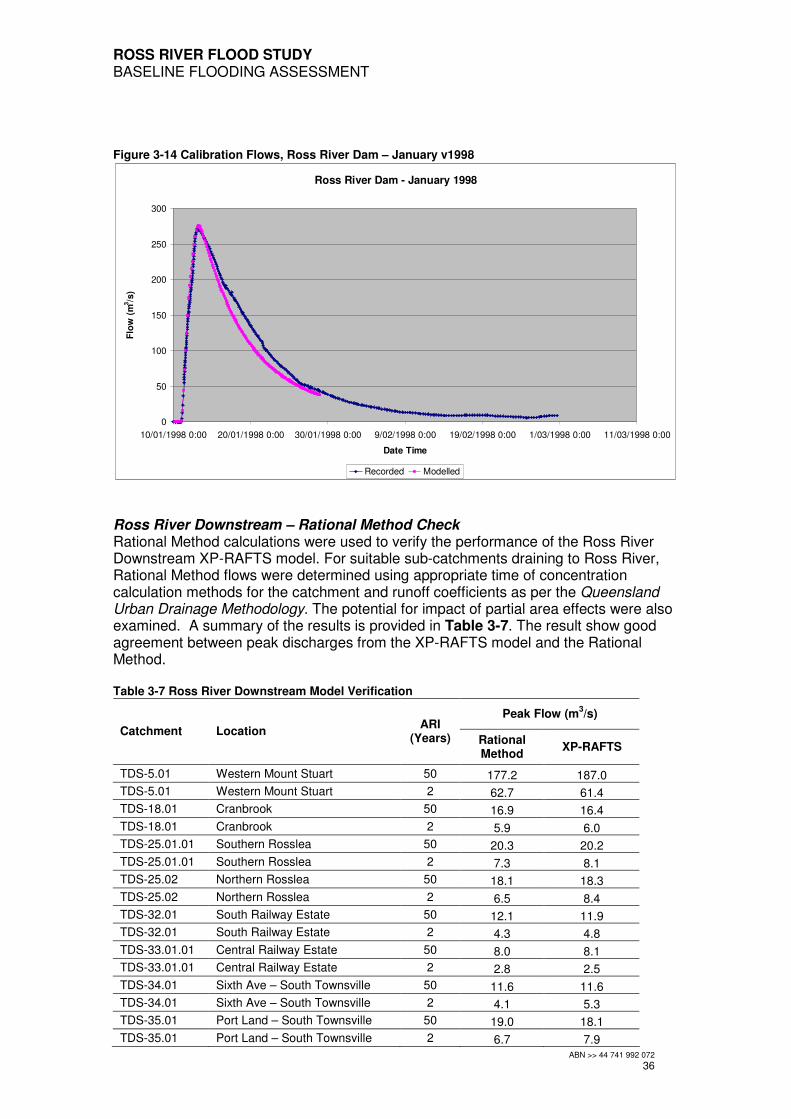
ROSS RIVER FLOOD STUDY BASELINE FLOODING ASSESSMENT
ABN >> 44 741 992 072
36
Figure 3-14 Calibration Flows, Ross River Dam – January v1998
Ross River Dam - January 1998
0
50
100
150
200
250
300
10/01/1998 0:00 20/01/1998 0:00 30/01/1998 0:00 9/02/1998 0:00 19/02/1998 0:00 1/03/1998 0:00 11/03/1998 0:00
Date Time
Flo
w (
m3/s
)
Recorded Modelled
Ross River Downstream – Rational Method Check Rational Method calculations were used to verify the performance of the Ross River Downstream XP-RAFTS model. For suitable sub-catchments draining to Ross River, Rational Method flows were determined using appropriate time of concentration calculation methods for the catchment and runoff coefficients as per the Queensland Urban Drainage Methodology. The potential for impact of partial area effects were also examined. A summary of the results is provided in Table 3-7. The result show good agreement between peak discharges from the XP-RAFTS model and the Rational Method. Table 3-7 Ross River Downstream Model Verification
Peak Flow (m3/s)
Catchment Location ARI
(Years) Rational Method
XP-RAFTS
TDS-5.01 Western Mount Stuart 50 177.2 187.0
TDS-5.01 Western Mount Stuart 2 62.7 61.4
TDS-18.01 Cranbrook 50 16.9 16.4
TDS-18.01 Cranbrook 2 5.9 6.0
TDS-25.01.01 Southern Rosslea 50 20.3 20.2
TDS-25.01.01 Southern Rosslea 2 7.3 8.1
TDS-25.02 Northern Rosslea 50 18.1 18.3
TDS-25.02 Northern Rosslea 2 6.5 8.4
TDS-32.01 South Railway Estate 50 12.1 11.9
TDS-32.01 South Railway Estate 2 4.3 4.8
TDS-33.01.01 Central Railway Estate 50 8.0 8.1
TDS-33.01.01 Central Railway Estate 2 2.8 2.5
TDS-34.01 Sixth Ave – South Townsville 50 11.6 11.6
TDS-34.01 Sixth Ave – South Townsville 2 4.1 5.3
TDS-35.01 Port Land – South Townsville 50 19.0 18.1
TDS-35.01 Port Land – South Townsville 2 6.7 7.9
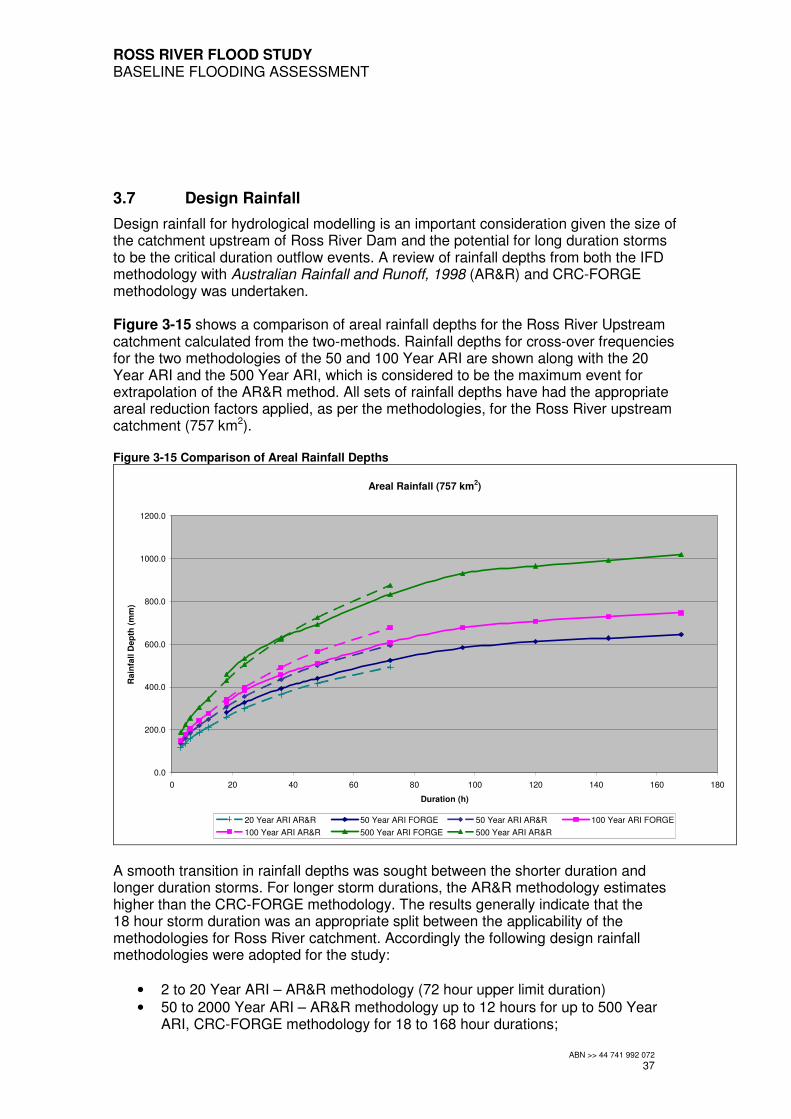
ROSS RIVER FLOOD STUDY BASELINE FLOODING ASSESSMENT
ABN >> 44 741 992 072
37
3.7 Design Rainfall
Design rainfall for hydrological modelling is an important consideration given the size of the catchment upstream of Ross River Dam and the potential for long duration storms to be the critical duration outflow events. A review of rainfall depths from both the IFD methodology with Australian Rainfall and Runoff, 1998 (AR&R) and CRC-FORGE methodology was undertaken. Figure 3-15 shows a comparison of areal rainfall depths for the Ross River Upstream catchment calculated from the two-methods. Rainfall depths for cross-over frequencies for the two methodologies of the 50 and 100 Year ARI are shown along with the 20 Year ARI and the 500 Year ARI, which is considered to be the maximum event for extrapolation of the AR&R method. All sets of rainfall depths have had the appropriate areal reduction factors applied, as per the methodologies, for the Ross River upstream catchment (757 km2). Figure 3-15 Comparison of Areal Rainfall Depths
Areal Rainfall (757 km2)
0.0
200.0
400.0
600.0
800.0
1000.0
1200.0
0 20 40 60 80 100 120 140 160 180
Duration (h)
Rain
fall D
ep
th (
mm
)
20 Year ARI AR&R 50 Year ARI FORGE 50 Year ARI AR&R 100 Year ARI FORGE
100 Year ARI AR&R 500 Year ARI FORGE 500 Year ARI AR&R
A smooth transition in rainfall depths was sought between the shorter duration and longer duration storms. For longer storm durations, the AR&R methodology estimates higher than the CRC-FORGE methodology. The results generally indicate that the 18 hour storm duration was an appropriate split between the applicability of the methodologies for Ross River catchment. Accordingly the following design rainfall methodologies were adopted for the study:
• 2 to 20 Year ARI – AR&R methodology (72 hour upper limit duration)
• 50 to 2000 Year ARI – AR&R methodology up to 12 hours for up to 500 Year ARI, CRC-FORGE methodology for 18 to 168 hour durations;

ROSS RIVER FLOOD STUDY BASELINE FLOODING ASSESSMENT
ABN >> 44 741 992 072
38
• Probable Maximum Precipitation – Generalised Tropical Storm Method Revised (GTSMR) for 24 hour to 120 hour durations.
Where the AR&R methodology for rainfall intensity is used, temporal patterns were based on those in AR&R for Zone 3. For the CRC-FORGE design storms, the temporal patterns were based on the resulting temporal pattern from application of the Average Variability Method (AVM) from the top 10 temporal patterns presented in the GTSMR handbook. Temporal patterns for the PMP design storms were based on the worst temporal pattern from the top 10 temporal patterns presented in the GTSMR handbook
3.8 Rainfall Loss Values
Rainfall loss values for the design events were assigned based on results of the calibration and verification. A summary of the loss values determined from the calibration events for the Ross River Upstream catchment are in Table 3-8. Table 3-8 Ross River Upstream Calibration Event Rainfall Losses Event Initial Loss Continuing Loss
January 1998 40 mm 1.75 mm/h February 2007 40 mm 1.1 mm/h January 2009 20 mm 0.75 mm/h
December 2010 20 mm 1 mm/h
Rainfall losses from verification of the Ross River Downstream model were determined as provided in Table 3-9. Table 3-9 Ross River Downstream Verification Rainfall Losses Surface Type Initial Loss Continuing Loss
Impervious 1 mm 0 mm/h Pervious 10 mm to 40 mm 0.5 mm/h to 4 mm/h
On the basis of these results the following rainfall losses were adopted for design events:
• Ross River Upstream – 40 mm IL and 1 mm CL
• Ross River Downstream: o Impervious – 1 mm IL and 0 mm CL; o Pervious – 25 mm IL and 2.5 mm CL.
3.9 Initial Drawdown
The initial drawdown volume acting on the flood volume to fill Ross River Dam prior to spillway outflows, was examined as part of Ross River Dam Upgrades Stages 2 to 5 – Hydrology Study (SKM 2005). The study identified the correlation between inflow frequency and drawdown volume. Figure 3-16 shows the determined relationships between event magnitude and drawdown. Separate relationships for initial drawdown exceedence were provided for:
• Under 10 Year ARI;
• 10 to 50 Year ARI;
• 50 to 100 Year ARI; and
• 100 to 500 Year ARI.
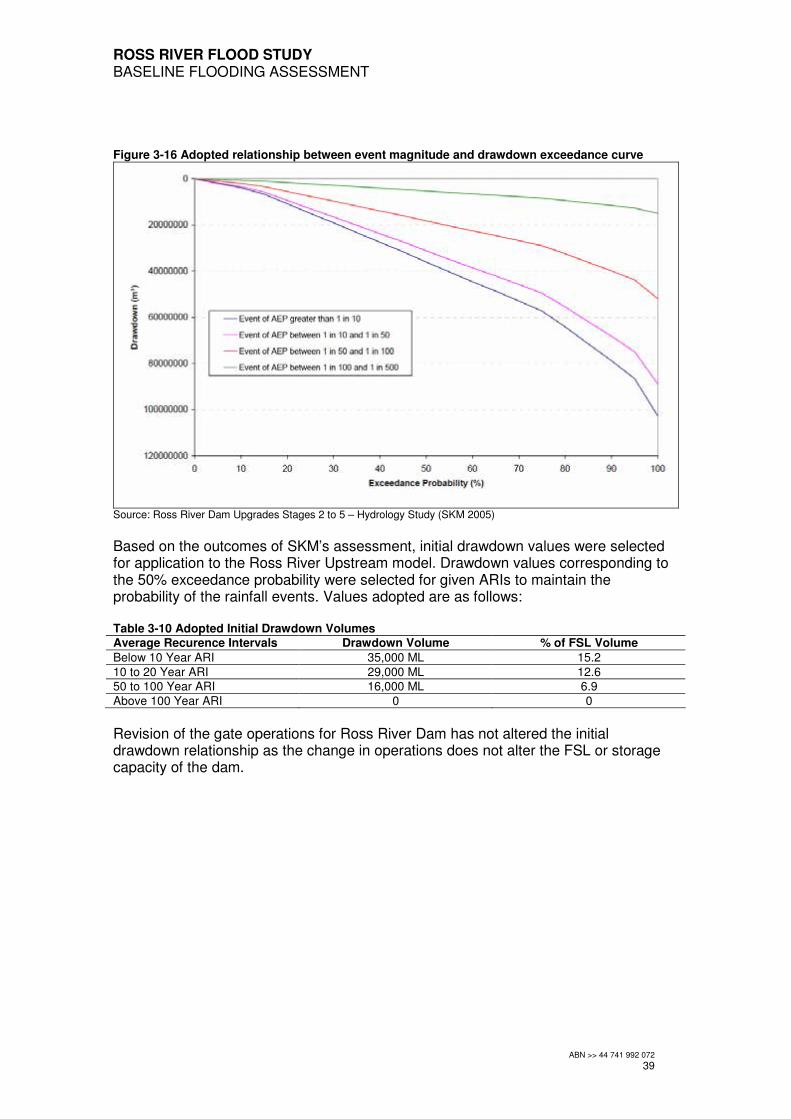
ROSS RIVER FLOOD STUDY BASELINE FLOODING ASSESSMENT
ABN >> 44 741 992 072
39
Figure 3-16 Adopted relationship between event magnitude and drawdown exceedance curve
Source: Ross River Dam Upgrades Stages 2 to 5 – Hydrology Study (SKM 2005)
Based on the outcomes of SKM’s assessment, initial drawdown values were selected for application to the Ross River Upstream model. Drawdown values corresponding to the 50% exceedance probability were selected for given ARIs to maintain the probability of the rainfall events. Values adopted are as follows: Table 3-10 Adopted Initial Drawdown Volumes Average Recurence Intervals Drawdown Volume % of FSL Volume
Below 10 Year ARI 35,000 ML 15.2
10 to 20 Year ARI 29,000 ML 12.6 50 to 100 Year ARI 16,000 ML 6.9
Above 100 Year ARI 0 0
Revision of the gate operations for Ross River Dam has not altered the initial drawdown relationship as the change in operations does not alter the FSL or storage capacity of the dam.
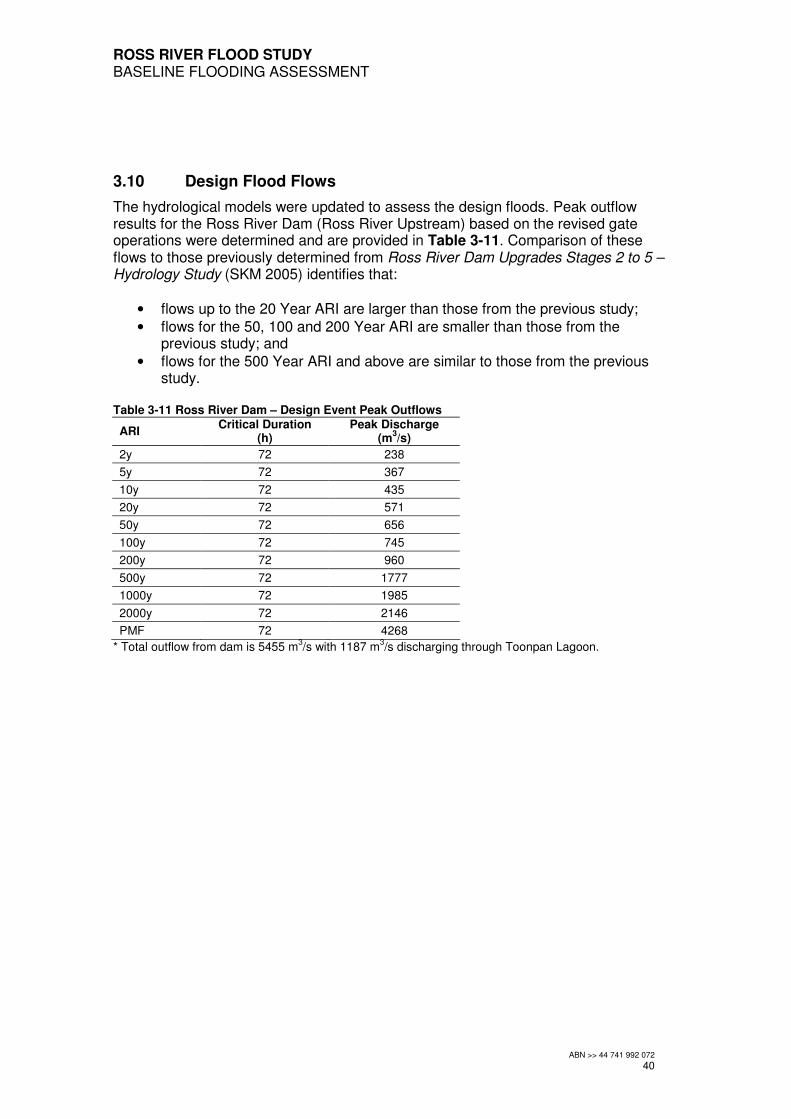
ROSS RIVER FLOOD STUDY BASELINE FLOODING ASSESSMENT
ABN >> 44 741 992 072
40
3.10 Design Flood Flows
The hydrological models were updated to assess the design floods. Peak outflow results for the Ross River Dam (Ross River Upstream) based on the revised gate operations were determined and are provided in Table 3-11. Comparison of these flows to those previously determined from Ross River Dam Upgrades Stages 2 to 5 – Hydrology Study (SKM 2005) identifies that:
• flows up to the 20 Year ARI are larger than those from the previous study;
• flows for the 50, 100 and 200 Year ARI are smaller than those from the previous study; and
• flows for the 500 Year ARI and above are similar to those from the previous study.
Table 3-11 Ross River Dam – Design Event Peak Outflows
ARI Critical Duration
(h) Peak Discharge
(m3/s)
2y 72 238
5y 72 367
10y 72 435
20y 72 571
50y 72 656
100y 72 745
200y 72 960
500y 72 1777
1000y 72 1985
2000y 72 2146
PMF 72 4268
* Total outflow from dam is 5455 m3/s with 1187 m
3/s discharging through Toonpan Lagoon.
ROSS RIVER FLOOD STUDY BASELINE FLOODING ASSESSMENT
ABN >> 44 741 992 072
41
4.0 Hydraulic Assessment
4.1 Floodplain Overview
Much of the City of Townsville is built on the Ross River Floodplain. The Ross River Dam was built in the 1970’s as a water supply and to provide flood mitigation to Townsville. Downstream of the dam, overflows from the river have significant potential to inundate urban areas, however, the construction of the dam has reduced the frequency of these overflow events. Through the suburbs of Kelso, Rasmussen and Condon, the western bank of the Ross River is perched, while the eastern overbank is characterised by steep gullies draining the foothills of western Mount Stuart. Any overflows from the river channel in these suburbs would head westward and into the Bohle River. In the suburb of Thuringowa Central, the river changes course, heading north-eastwards. The (north-) western bank continues to be perched with any overflows heading north towards Louisa Creek and Bohle River. The eastern overbank continues to be steeper areas at the foothills of Mount Stuart containing the suburb of Douglas. Through Cranbrook, Aitkenvale and Mundingburra the northern bank of the river is still perched with overflows heading north-eastwards towards Ross Creek. On the southern bank, areas of Annandale are flatter than upstream in Douglas with more potential for overflows from the River south-eastwards towards the suburbs of Murray and Idalia, then on to Gordon Creek. Downstream of Bowen Road, overflows to the north through Rosslea, can flow through Hermit Park. Overflows to the south can flow through Murray and Idalia then on to Gordon Creek. From adjacent to bicentennial park, the southern overbank area is very flat and intertidal, with significant areas of floodplain storage. There is also the potential for overflows to north through Railway Estate and South Townsville.
4.2 MIKE FLOOD
MIKE FLOOD is a dynamically linked 1D and 2D hydraulic modelling package, which couples the 1D river hydraulics model, MIKE11 with the 2D surface water model, MIKE21. MIKE FLOOD can be used to simulate:
• coincident river and storm surge flooding in coastal areas;
• the detailed flooding patterns on floodplains in terms of flow velocities and water levels;
• water exchange between channels, canals and adjacent floodplains, ponds, reservoirs, etc; and
• flood waves in channels and on flood plains associated with a dam failure. MIKE FLOOD dynamically couples the 2D surface water model, MIKE21, with the 1D river hydraulics model, MIKE11. The MIKE21 2D model has been used to adequately represent the complex two dimensional hydraulics of the Bohle floodplain. The 1D component of MIKE FLOOD (MIKE11) was required to provide a more accurate
ROSS RIVER FLOOD STUDY BASELINE FLOODING ASSESSMENT
ABN >> 44 741 992 072
42
representation of the hydraulics of structures (such as culverts and bridges). MIKE FLOOD has been used for the hydraulic model of Ross River.
4.3 Model Setup
The MIKE FLOOD model developed for the Study is based on a 30 m topographic grid covering an area of 19.65 km by 22.05 km. The model set-up is shown in Figure 4-1. The topographic grid is based on the LiDAR obtained in 2009 for a majority of the floodplain. Within the estuary reaches of the river, recent hydrographic survey obtained from Port of Townsville and AquaMap has been used to specify the underwater areas of the grid. In the upper freshwater reaches, underwater survey obtained as part of the Townsville Flood Hazard Assessment Study and Ross River Hydraulic Study has been used to specify the underwater areas of the grid. Boundary conditions of the model are specified as either upstream inflows or downstream water levels. The base-line flooding assessment has used downstream water levels set to a fixed level of the Mean High Water Springs (MHWS) tide. A sensitivity assessment has also evaluated the impact of increase to Highest Astronomical Tide (HAT) as a tailwater condition as well as the potential impact of sea level rise. The key boundaries for the model are:
• Ross River Dam outflows (inflow to the model);
• Cleveland Bay Ocean Boundary 1;
• Cleveland Bay Ocean Boundary 2;
• Bohle River Estuary Outflow Boundary; and
• Louisa Creek Estuary Outflow Boundary. In applying the flows for the PMF it was identified from the Ross River Dam Upgrade Stages 2 to 5 Hydrology that the water level in the dam was 48.3 m AHD. Review of the embankment levels indicates that this is very close to the level of the embankment and there may be potential for this magnitude flood to overtop the embankment. To simplify the assessment, the full Ross River outflow component of the PMF was applied to the Ross River Dam outflow boundary representing the spillway. If dam water levels did overtop the embankment, then a dam breach could occur. A dam breach assessment has previously been completed as part of the Ross River Dam Design Validation Report, including consideration of populations at risk and evacuation warning times. A dam breach assessment is beyond on the scope of this study. Source points representing sub-catchment inflows are applied to the model as shown in Figure 4-1. Sub-catchments represented by these source-points include:
• Ross River Downstream;
• Douglas/Annandale;
• Gordon Creek; and
• Stuart Creek.
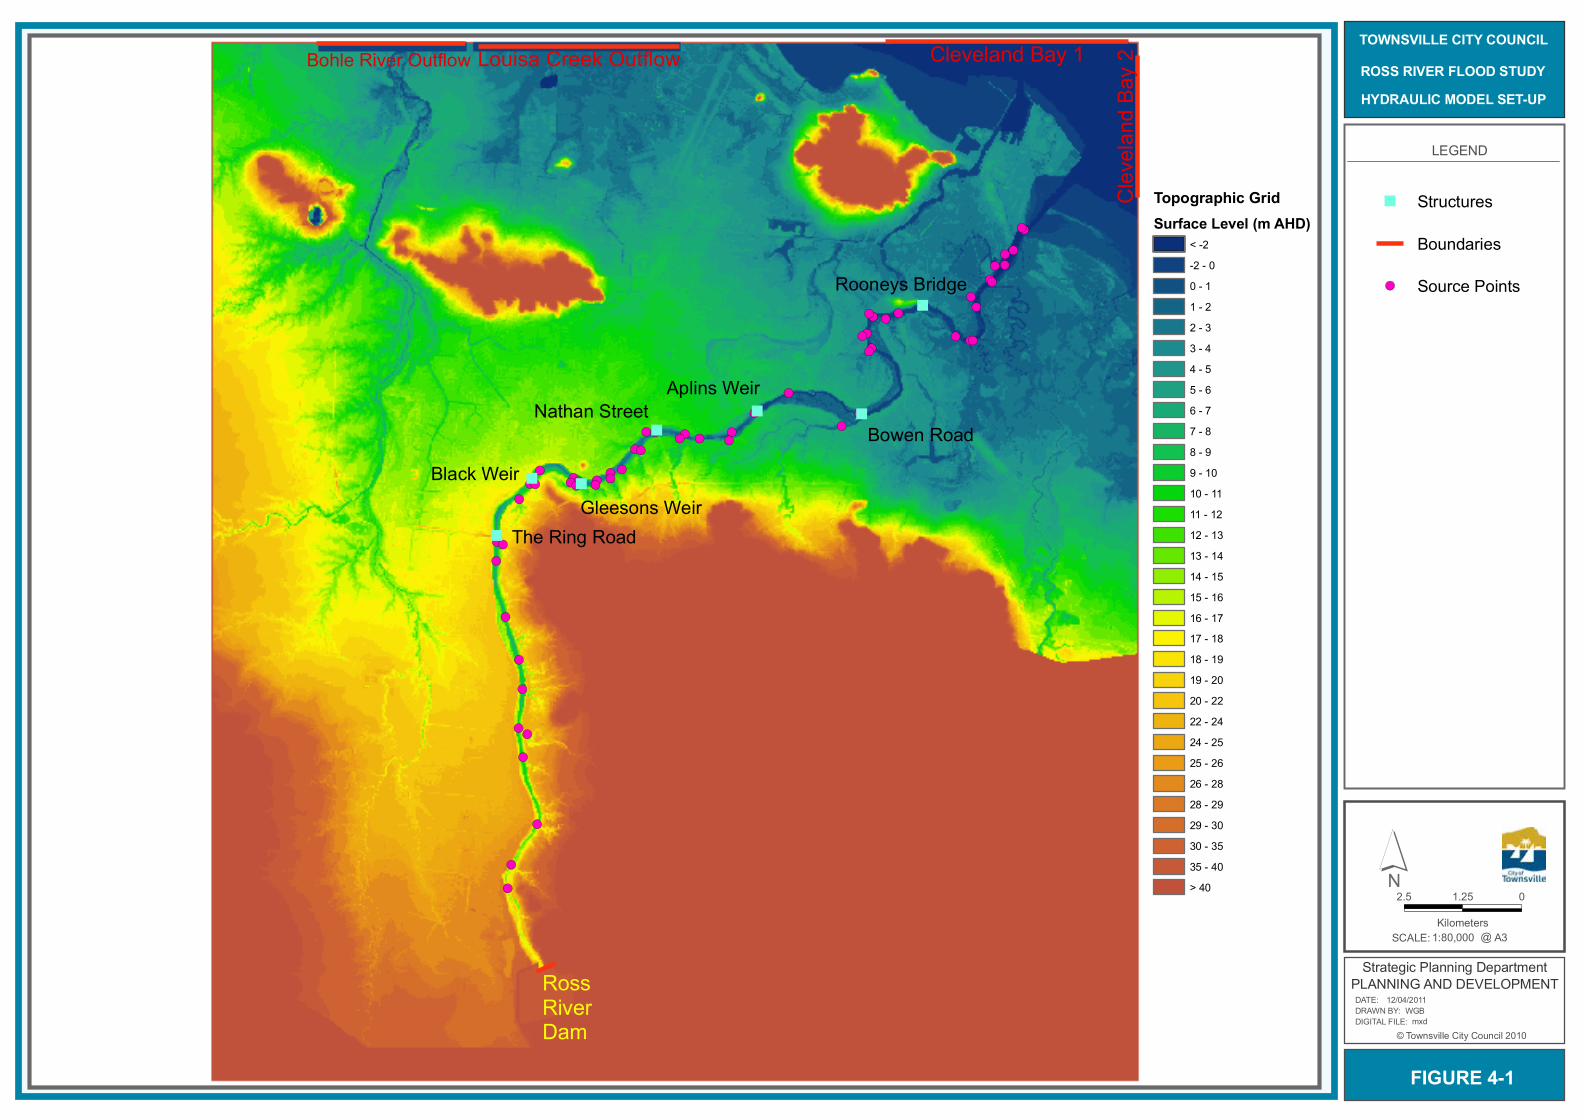
!(!(!( !(
!(
!(
!(!( !( !(!(
!(
!(
!(
!(!(
!(!(
!(!( !(!(
!(
!(!(
!(
!(
!(
!(!(
!(!(
!(!(
!(!( !(!(!(
!(!( !(
!(
!(
!(
!(!(
!(
!(
!(
!(
!(
!(
!(!(
!(
!(
!(
!(
!(
"
""
"
""
"
Cleveland Bay 1Louisa Creek Outflow
Cleve
land B
ay 2
LEGEND
" Structures
Boundaries
!( Source Points
FIGURE 4-1
SCALE: @1:80,000
2.5 01.25
KilometersA3
TOWNSVILLE CITY COUNCILROSS RIVER FLOOD STUDYHYDRAULIC MODEL SET-UP
© Townsville City Council 2010DIGITAL FILE: DRAWN BY: DATE:
Strategic Planning DepartmentPLANNING AND DEVELOPMENT
mxdWGB
12/04/2011
´
Bohle River Outflow
Ross River Dam
Topographic GridSurface Level (m AHD)
< -2-2 - 00 - 11 - 22 - 33 - 44 - 55 - 66 - 77 - 88 - 99 - 1010 - 1111 - 1212 - 1313 - 1414 - 1515 - 1616 - 1717 - 1818 - 1919 - 2020 - 2222 - 2424 - 2525 - 2626 - 2828 - 2929 - 3030 - 3535 - 40> 40
The Ring Road
Black WeirGleesons Weir
Nathan StreetAplins Weir
Bowen Road
Rooneys Bridge
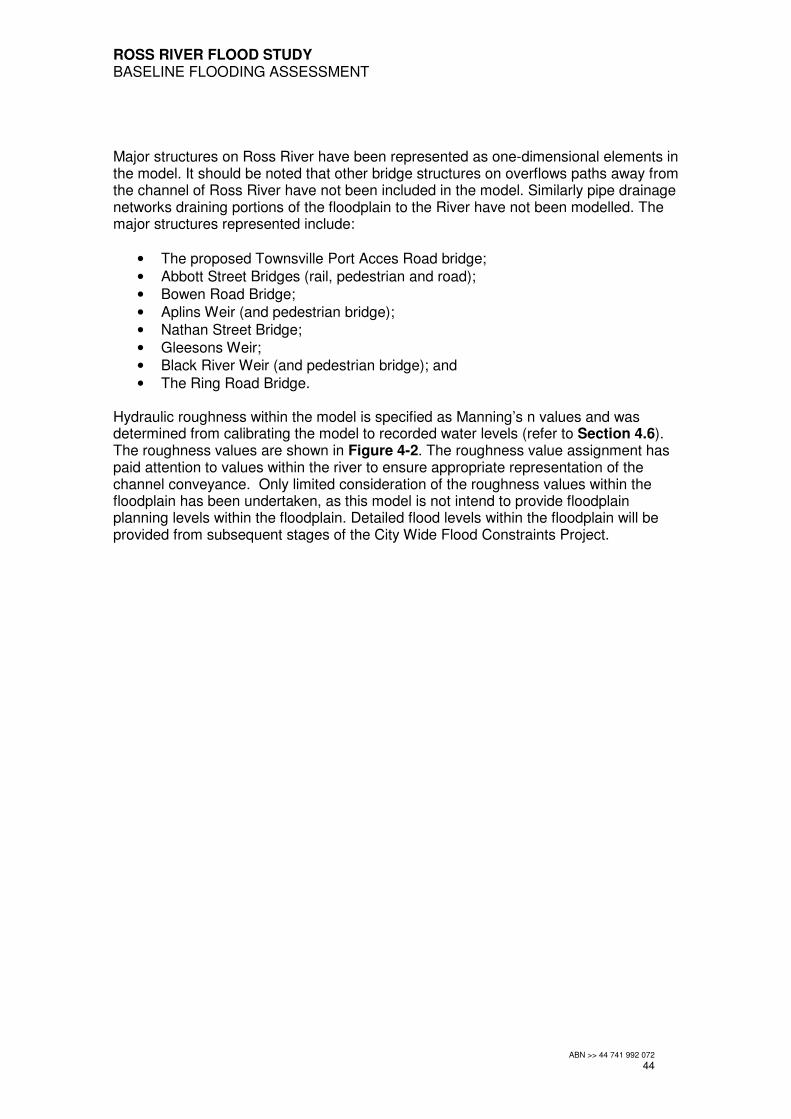
ROSS RIVER FLOOD STUDY BASELINE FLOODING ASSESSMENT
ABN >> 44 741 992 072
44
Major structures on Ross River have been represented as one-dimensional elements in the model. It should be noted that other bridge structures on overflows paths away from the channel of Ross River have not been included in the model. Similarly pipe drainage networks draining portions of the floodplain to the River have not been modelled. The major structures represented include:
• The proposed Townsville Port Acces Road bridge;
• Abbott Street Bridges (rail, pedestrian and road);
• Bowen Road Bridge;
• Aplins Weir (and pedestrian bridge);
• Nathan Street Bridge;
• Gleesons Weir;
• Black River Weir (and pedestrian bridge); and
• The Ring Road Bridge. Hydraulic roughness within the model is specified as Manning’s n values and was determined from calibrating the model to recorded water levels (refer to Section 4.6). The roughness values are shown in Figure 4-2. The roughness value assignment has paid attention to values within the river to ensure appropriate representation of the channel conveyance. Only limited consideration of the roughness values within the floodplain has been undertaken, as this model is not intend to provide floodplain planning levels within the floodplain. Detailed flood levels within the floodplain will be provided from subsequent stages of the City Wide Flood Constraints Project.
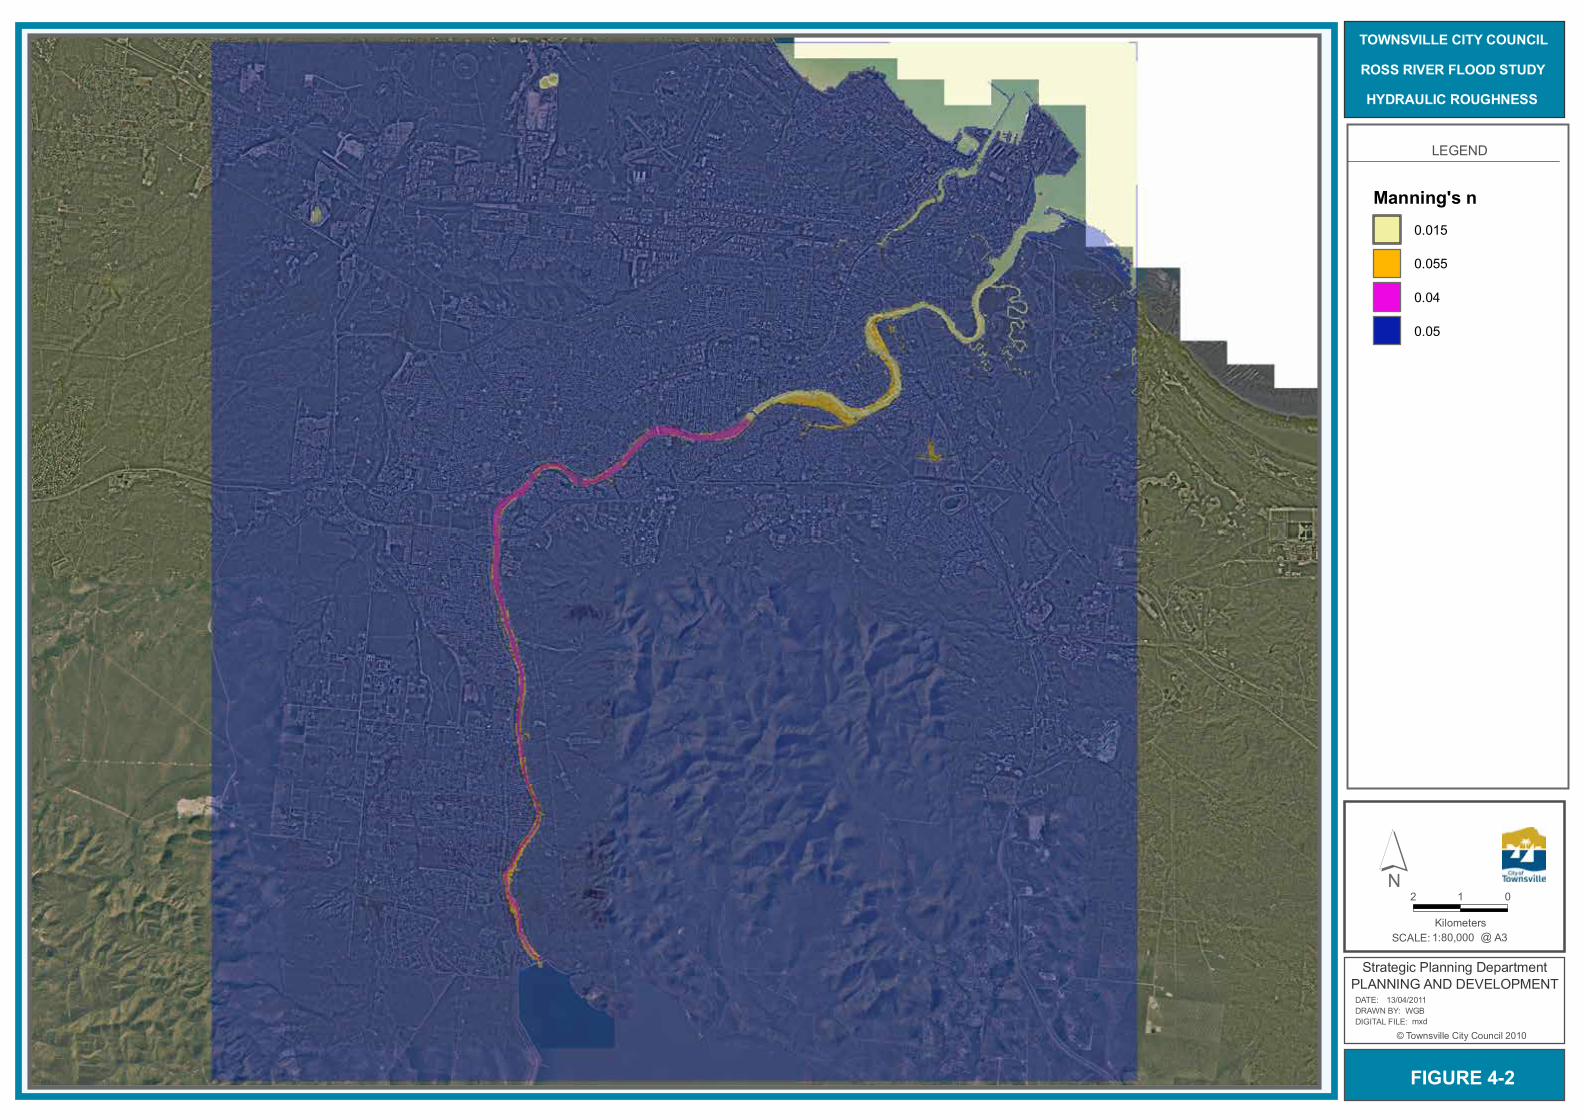
LEGEND
Manning's n0.015
0.055
0.04
0.05
FIGURE 4-2
SCALE: @1:80,000
2 01
KilometersA3
TOWNSVILLE CITY COUNCILROSS RIVER FLOOD STUDYHYDRAULIC ROUGHNESS
© Townsville City Council 2010DIGITAL FILE: DRAWN BY: DATE:
Strategic Planning DepartmentPLANNING AND DEVELOPMENT
mxdWGB
13/04/2011
´

ROSS RIVER FLOOD STUDY BASELINE FLOODING ASSESSMENT
ABN >> 44 741 992 072
46
4.4 Weir Rating Curve Review
The weir rating curves that have been adopted for Aplins, Gleesons and Black Weir are based on results of modelling completed for the Ross River Hydraulic Study. Initial review of the flows determined from these rating curves for the recorded flood events used for calibration, identified a tendency for the rating curves to under predict the flows at the weirs. Table 4-1 shows the peak discharges measured at the Ross River Dam compared to those based on measured water levels and the previous rating curves at Black and Aplins Weirs. Table 4-1 Calibration event peak discharges at weirs based on previous rating curves
RRD Black Weir Aplins Weir
Flow Event
Peak Flow (m
3/s)
Peak Flow (m
3/s)
Initial water level above weir
(m) Peak Flow
(m3/s)
Initial water level above weir
(m)
Feb-07 650 470 -0.3 378 -0.05
Jan-09 497 550 0.45 418 0.35
Dec-10 317 428 0.45 N/A N/A
The flows for February 2007 suggest significant attenuation from Ross River Dam to Black Weir (28%) and Aplins Weir (42%). Although the initial water levels at the weirs are below the FSL, this extent of attenuation still seems excessive. The flows for January 2009 are not straightforward, as the flow at Black Weir is larger than that at Ross River dam while the flow at Aplins Weir is smaller. The attenuation suggested at Aplins Weir is 16% which is less than the February 2007 event. Initial water levels at both weirs were above FSL, potentially accounting for the reduced attenuation compared to the February 2007 event. The attenuation of 16% at Aplins Weir still appears excessive. It is difficult to deduce any meaningful conclusions for the December 2010 event as the water level gauge at Aplins failed during the event. In light of the review of flows, an assessment of the rating curves adopted for Black and Aplins Weirs was undertaken. It was proposed to update the rating curves to allow for increased flows for given water levels. The rating curve for Gleesons Weir was not altered as there is no recorded flood level information for the weir. Black Weir In addition to the rating curve developed by the Ross River Hydraulic Study, there was also previously a measured rating curve determined by the Department of Natural Resources (now Department of Environment and Resource Management – DERM), when they managed the stream gauging at the site. Figure 4-3 shows the following rating curves for Black Weir:
• the rating curve previously determined by DERM;
• the rating curve determined from the Ross River Hydraulic Study; and
• the rating curve proposed from this study. The previous rating curve from DERM suggests much higher flows for given water levels than the rating curve from the Ross River Hydraulic Study, however the rating curve does not extend sufficiently high to allow calculation of flows for the less frequent design events. The rating curve proposed from this study is generally between the
ROSS RIVER FLOOD STUDY BASELINE FLOODING ASSESSMENT
ABN >> 44 741 992 072
47
previous two rating curves and provides good calibration for the hydraulic model (refer to Section 4.6). Figure 4-3 Rating Curves for Black Weir
13.80
14.30
14.80
15.30
15.80
16.30
16.80
17.30
17.80
18.30
0.0 500.0 1000.0 1500.0 2000.0 2500.0 3000.0 3500.0 4000.0
Discharge (m3/s)
Wate
r Level (m
AH
D)
RRHS
DERM
Proposed
The rating curve was developed from a standard Weir formula and based on the geometry of the weir, with the following parameters:
• Weir Level – 13.805 m AHD;
• Weir Width – 200 m;
• Weir Coefficient – 2 (same as RRHS); and
• Exponent – 1.5. Aplins Weir The only rating curve that could be sourced for Aplins Weir was that from the Ross River Hydraulic Study. Figure 4-4 shows this previous rating curve and the rating proposed from this study. The rating curve proposed from this study calculates higher flows for given water levels and provides good calibration for the hydraulic model (refer to Section 4.6). The rating curve was developed from a standard Weir formula and based on the geometry of the weir, with the following parameters:
• Weir Level – 6.39 m AHD;
• Weir Width – 144 m;
• Weir Coefficient – 2.18; and
• Exponent – 1.7.

ROSS RIVER FLOOD STUDY BASELINE FLOODING ASSESSMENT
ABN >> 44 741 992 072
48
Figure 4-4 Rating Curves for Aplins Weir
6.30
6.80
7.30
7.80
8.30
8.80
9.30
9.80
10.30
10.80
11.30
0.0 500.0 1000.0 1500.0 2000.0 2500.0 3000.0 3500.0 4000.0
Discharge (m3/s)
Wate
r L
evel (m
AH
D)
RRHS
Proposed
4.5 Structure Verification
Head-losses across structures are critical for ensuring accurate prediction of flood levels within a flood model. To verify the head-losses across the structures, HEC-RAS models were set-up for key bridge structures to verify the calculated head-loss. HEC-RAS is considered to have better representation of the bridge hydraulics as it uses Bradley’s Method and considers steady state conditions providing a simpler numerical solution. Comparisons between the MIKE FLOOD model and HEC-RAS results at each of the major structures are provided in Tables 4-2 to 4-5. The results show good agreement between the models and confirm the head-losses represented within the MIKE FLOOD model. Table 4-2 Comparison of Head-losses at Abbot Street Bridges for 520 m
3/s
Water Level (m AHD)
Location MIKE FLOOD HEC-RAS
D/S Road 3.83 3.83
U/S Road 3.91 3.91
U/S Pedestrian 3.96 3.96
U/S Rail 4.04 4.04
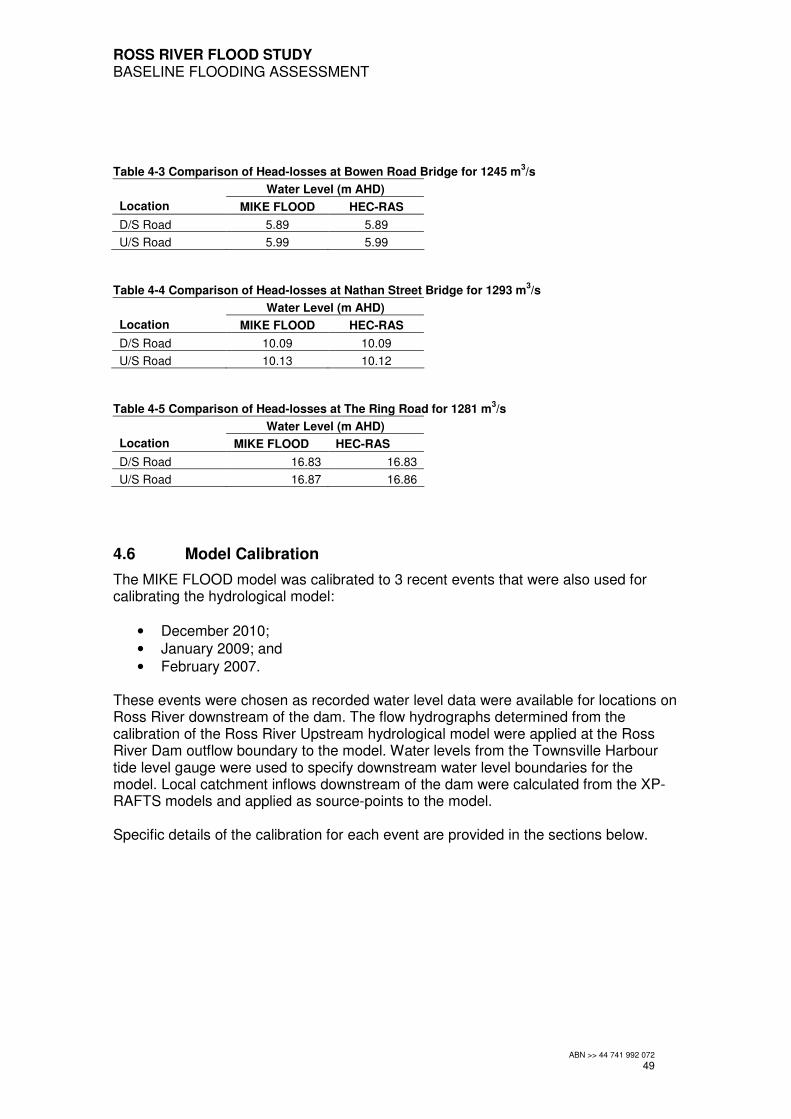
ROSS RIVER FLOOD STUDY BASELINE FLOODING ASSESSMENT
ABN >> 44 741 992 072
49
Table 4-3 Comparison of Head-losses at Bowen Road Bridge for 1245 m
3/s
Water Level (m AHD)
Location MIKE FLOOD HEC-RAS
D/S Road 5.89 5.89
U/S Road 5.99 5.99
Table 4-4 Comparison of Head-losses at Nathan Street Bridge for 1293 m
3/s
Water Level (m AHD)
Location MIKE FLOOD HEC-RAS
D/S Road 10.09 10.09
U/S Road 10.13 10.12
Table 4-5 Comparison of Head-losses at The Ring Road for 1281 m
3/s
Water Level (m AHD)
Location MIKE FLOOD HEC-RAS
D/S Road 16.83 16.83
U/S Road 16.87 16.86
4.6 Model Calibration
The MIKE FLOOD model was calibrated to 3 recent events that were also used for calibrating the hydrological model:
• December 2010;
• January 2009; and
• February 2007. These events were chosen as recorded water level data were available for locations on Ross River downstream of the dam. The flow hydrographs determined from the calibration of the Ross River Upstream hydrological model were applied at the Ross River Dam outflow boundary to the model. Water levels from the Townsville Harbour tide level gauge were used to specify downstream water level boundaries for the model. Local catchment inflows downstream of the dam were calculated from the XP-RAFTS models and applied as source-points to the model. Specific details of the calibration for each event are provided in the sections below.
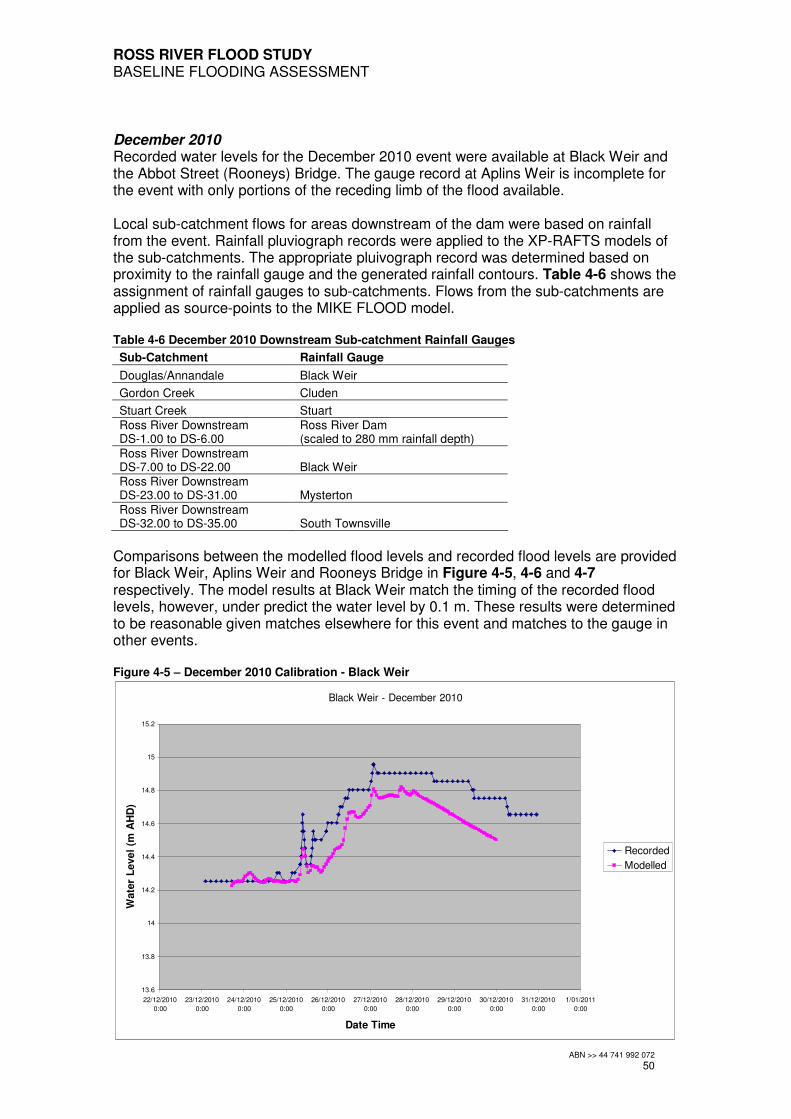
ROSS RIVER FLOOD STUDY BASELINE FLOODING ASSESSMENT
ABN >> 44 741 992 072
50
December 2010 Recorded water levels for the December 2010 event were available at Black Weir and the Abbot Street (Rooneys) Bridge. The gauge record at Aplins Weir is incomplete for the event with only portions of the receding limb of the flood available. Local sub-catchment flows for areas downstream of the dam were based on rainfall from the event. Rainfall pluviograph records were applied to the XP-RAFTS models of the sub-catchments. The appropriate pluivograph record was determined based on proximity to the rainfall gauge and the generated rainfall contours. Table 4-6 shows the assignment of rainfall gauges to sub-catchments. Flows from the sub-catchments are applied as source-points to the MIKE FLOOD model. Table 4-6 December 2010 Downstream Sub-catchment Rainfall Gauges
Sub-Catchment Rainfall Gauge
Douglas/Annandale Black Weir
Gordon Creek Cluden
Stuart Creek Stuart
Ross River Downstream DS-1.00 to DS-6.00
Ross River Dam (scaled to 280 mm rainfall depth)
Ross River Downstream DS-7.00 to DS-22.00 Black Weir Ross River Downstream DS-23.00 to DS-31.00 Mysterton
Ross River Downstream DS-32.00 to DS-35.00 South Townsville
Comparisons between the modelled flood levels and recorded flood levels are provided for Black Weir, Aplins Weir and Rooneys Bridge in Figure 4-5, 4-6 and 4-7 respectively. The model results at Black Weir match the timing of the recorded flood levels, however, under predict the water level by 0.1 m. These results were determined to be reasonable given matches elsewhere for this event and matches to the gauge in other events. Figure 4-5 – December 2010 Calibration - Black Weir
Black Weir - December 2010
13.6
13.8
14
14.2
14.4
14.6
14.8
15
15.2
22/12/2010
0:00
23/12/2010
0:00
24/12/2010
0:00
25/12/2010
0:00
26/12/2010
0:00
27/12/2010
0:00
28/12/2010
0:00
29/12/2010
0:00
30/12/2010
0:00
31/12/2010
0:00
1/01/2011
0:00
Date Time
Wate
r L
eve
l (m
AH
D)
Recorded
Modelled
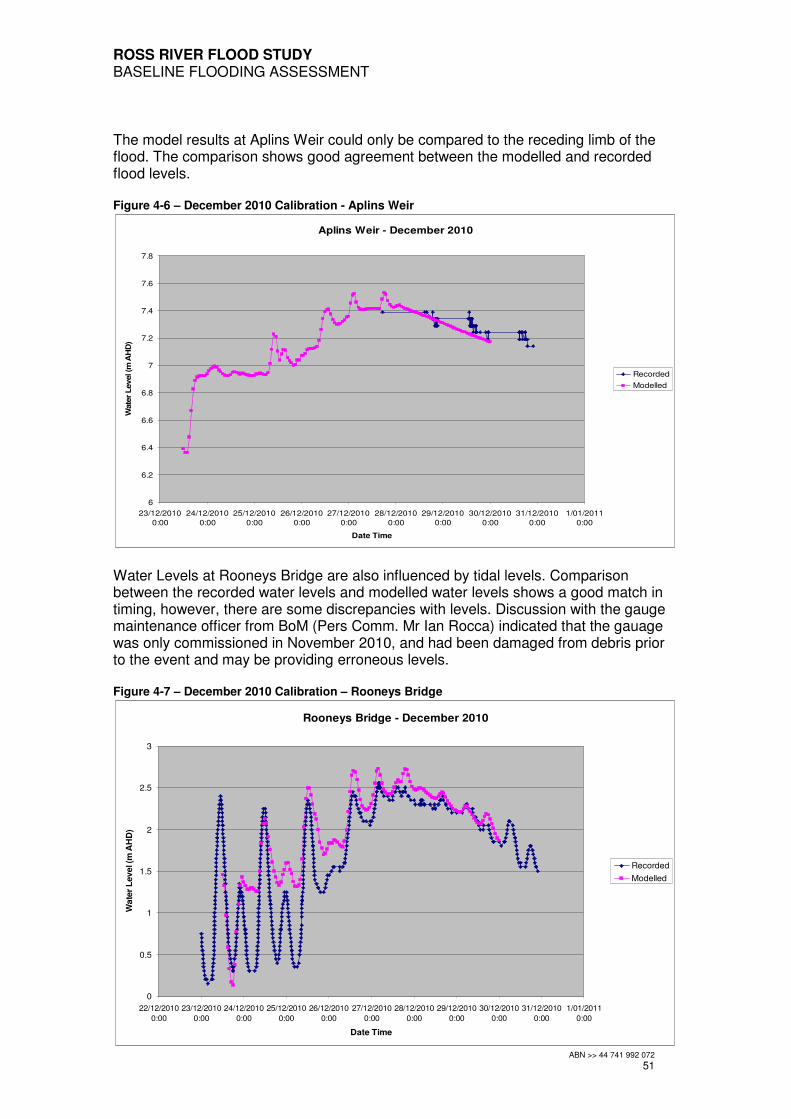
ROSS RIVER FLOOD STUDY BASELINE FLOODING ASSESSMENT
ABN >> 44 741 992 072
51
The model results at Aplins Weir could only be compared to the receding limb of the flood. The comparison shows good agreement between the modelled and recorded flood levels. Figure 4-6 – December 2010 Calibration - Aplins Weir
Aplins Weir - December 2010
6
6.2
6.4
6.6
6.8
7
7.2
7.4
7.6
7.8
23/12/2010
0:00
24/12/2010
0:00
25/12/2010
0:00
26/12/2010
0:00
27/12/2010
0:00
28/12/2010
0:00
29/12/2010
0:00
30/12/2010
0:00
31/12/2010
0:00
1/01/2011
0:00
Date Time
Wate
r L
evel (m
AH
D)
Recorded
Modelled
Water Levels at Rooneys Bridge are also influenced by tidal levels. Comparison between the recorded water levels and modelled water levels shows a good match in timing, however, there are some discrepancies with levels. Discussion with the gauge maintenance officer from BoM (Pers Comm. Mr Ian Rocca) indicated that the gauage was only commissioned in November 2010, and had been damaged from debris prior to the event and may be providing erroneous levels. Figure 4-7 – December 2010 Calibration – Rooneys Bridge
Rooneys Bridge - December 2010
0
0.5
1
1.5
2
2.5
3
22/12/2010
0:00
23/12/2010
0:00
24/12/2010
0:00
25/12/2010
0:00
26/12/2010
0:00
27/12/2010
0:00
28/12/2010
0:00
29/12/2010
0:00
30/12/2010
0:00
31/12/2010
0:00
1/01/2011
0:00
Date Time
Wate
r L
evel (m
AH
D)
Recorded
Modelled
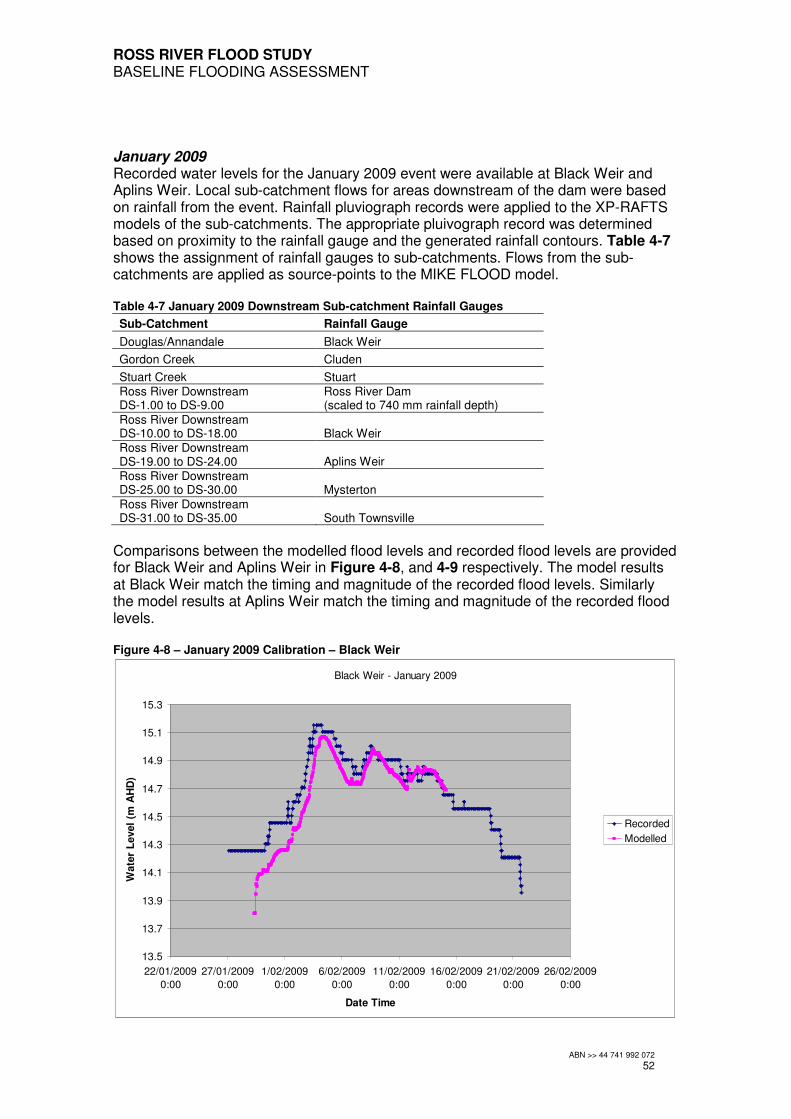
ROSS RIVER FLOOD STUDY BASELINE FLOODING ASSESSMENT
ABN >> 44 741 992 072
52
January 2009 Recorded water levels for the January 2009 event were available at Black Weir and Aplins Weir. Local sub-catchment flows for areas downstream of the dam were based on rainfall from the event. Rainfall pluviograph records were applied to the XP-RAFTS models of the sub-catchments. The appropriate pluivograph record was determined based on proximity to the rainfall gauge and the generated rainfall contours. Table 4-7 shows the assignment of rainfall gauges to sub-catchments. Flows from the sub-catchments are applied as source-points to the MIKE FLOOD model. Table 4-7 January 2009 Downstream Sub-catchment Rainfall Gauges
Sub-Catchment Rainfall Gauge
Douglas/Annandale Black Weir
Gordon Creek Cluden
Stuart Creek Stuart Ross River Downstream DS-1.00 to DS-9.00
Ross River Dam (scaled to 740 mm rainfall depth)
Ross River Downstream DS-10.00 to DS-18.00 Black Weir Ross River Downstream DS-19.00 to DS-24.00 Aplins Weir
Ross River Downstream DS-25.00 to DS-30.00 Mysterton
Ross River Downstream DS-31.00 to DS-35.00 South Townsville
Comparisons between the modelled flood levels and recorded flood levels are provided for Black Weir and Aplins Weir in Figure 4-8, and 4-9 respectively. The model results at Black Weir match the timing and magnitude of the recorded flood levels. Similarly the model results at Aplins Weir match the timing and magnitude of the recorded flood levels. Figure 4-8 – January 2009 Calibration – Black Weir
Black Weir - January 2009
13.5
13.7
13.9
14.1
14.3
14.5
14.7
14.9
15.1
15.3
22/01/2009
0:00
27/01/2009
0:00
1/02/2009
0:00
6/02/2009
0:00
11/02/2009
0:00
16/02/2009
0:00
21/02/2009
0:00
26/02/2009
0:00
Date Time
Wate
r L
evel
(m A
HD
)
Recorded
Modelled

ROSS RIVER FLOOD STUDY BASELINE FLOODING ASSESSMENT
ABN >> 44 741 992 072
53
Figure 4-9 – January 2009 Calibration – Aplins Weir
Aplins Weir - January 2009
6
6.2
6.4
6.6
6.8
7
7.2
7.4
7.6
7.8
8
22/01/2009
0:00
27/01/2009
0:00
1/02/2009
0:00
6/02/2009
0:00
11/02/2009
0:00
16/02/2009
0:00
21/02/2009
0:00
26/02/2009
0:00
Date Time
Wa
ter
Le
ve
l (m
AH
D)
Recorded
Modelled
February 2007 Recorded water levels for the February 2007 event were available at Black Weir and Aplins Weir. In addition to the water level records through the alert system, manual water level measurements were also taken at Black and Aplins Weir as part of the Ross River Dam Downstream Modelling – Verification to February 2007 Event. Local sub-catchment flows for areas downstream of the dam were based on rainfall from the event. Rainfall pluviograph records were applied to the XP-RAFTS models of the sub-catchments. The appropriate pluivograph record was determined based on proximity to the rainfall gauge and the generated rainfall contours. Table 4-8 shows the assignment of rainfall gauges to sub-catchments. Flows from the sub-catchments are applied as source-points to the MIKE FLOOD model. Table 4-8 February 2007 Downstream Sub-catchment Rainfall Gauges
Sub-Catchment Rainfall Gauge
Douglas/Annandale Black Weir (scaled to 500 mm rainfall depth)
Gordon Creek Stuart Creek (scaled to 460 mm rainfall depth)
Stuart Creek Stuart
Ross River Downstream DS-1.00 to DS-4.00 Ross River Dam
Ross River Downstream DS-4.00 to DS-18.00 Black Weir Ross River Downstream DS-19.00 to DS-27.00 Aplins Weir
Ross River Downstream DS-28.00 to DS-35.00
Aplins Weir (scaled to 490 mm rainfall depth)
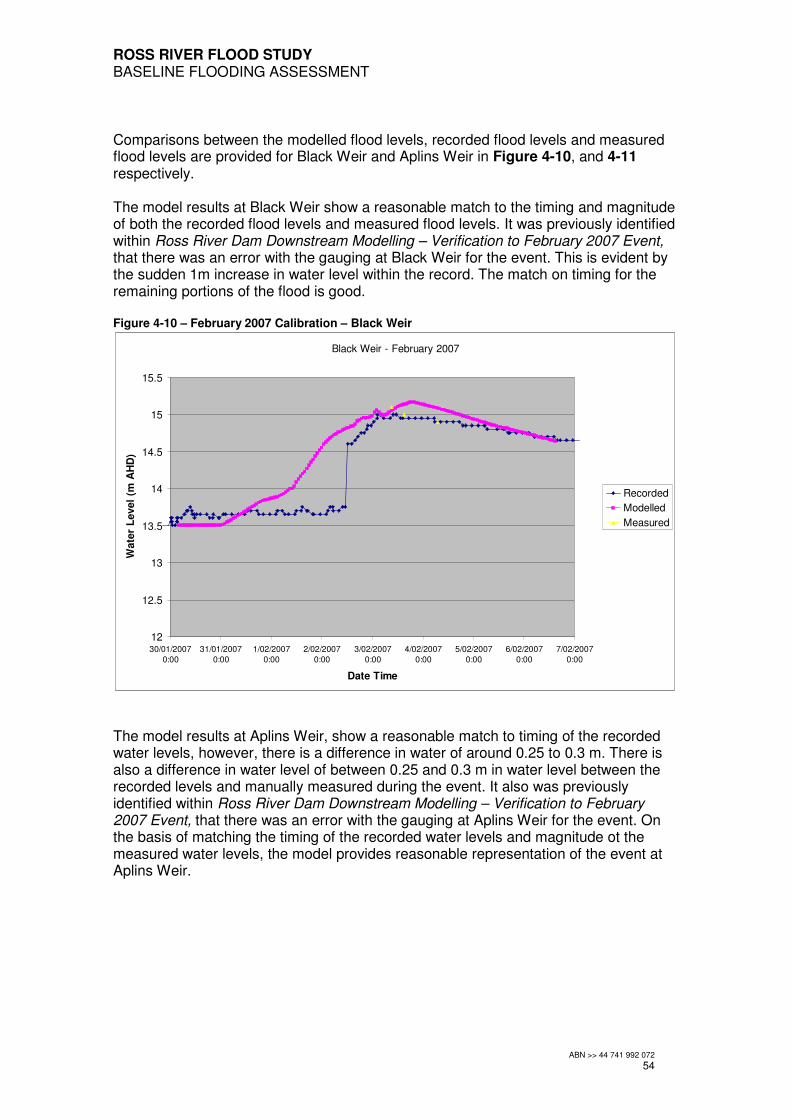
ROSS RIVER FLOOD STUDY BASELINE FLOODING ASSESSMENT
ABN >> 44 741 992 072
54
Comparisons between the modelled flood levels, recorded flood levels and measured flood levels are provided for Black Weir and Aplins Weir in Figure 4-10, and 4-11 respectively. The model results at Black Weir show a reasonable match to the timing and magnitude of both the recorded flood levels and measured flood levels. It was previously identified within Ross River Dam Downstream Modelling – Verification to February 2007 Event, that there was an error with the gauging at Black Weir for the event. This is evident by the sudden 1m increase in water level within the record. The match on timing for the remaining portions of the flood is good. Figure 4-10 – February 2007 Calibration – Black Weir
Black Weir - February 2007
12
12.5
13
13.5
14
14.5
15
15.5
30/01/2007
0:00
31/01/2007
0:00
1/02/2007
0:00
2/02/2007
0:00
3/02/2007
0:00
4/02/2007
0:00
5/02/2007
0:00
6/02/2007
0:00
7/02/2007
0:00
Date Time
Wate
r L
evel
(m A
HD
)
Recorded
Modelled
Measured
The model results at Aplins Weir, show a reasonable match to timing of the recorded water levels, however, there is a difference in water of around 0.25 to 0.3 m. There is also a difference in water level of between 0.25 and 0.3 m in water level between the recorded levels and manually measured during the event. It also was previously identified within Ross River Dam Downstream Modelling – Verification to February 2007 Event, that there was an error with the gauging at Aplins Weir for the event. On the basis of matching the timing of the recorded water levels and magnitude ot the measured water levels, the model provides reasonable representation of the event at Aplins Weir.
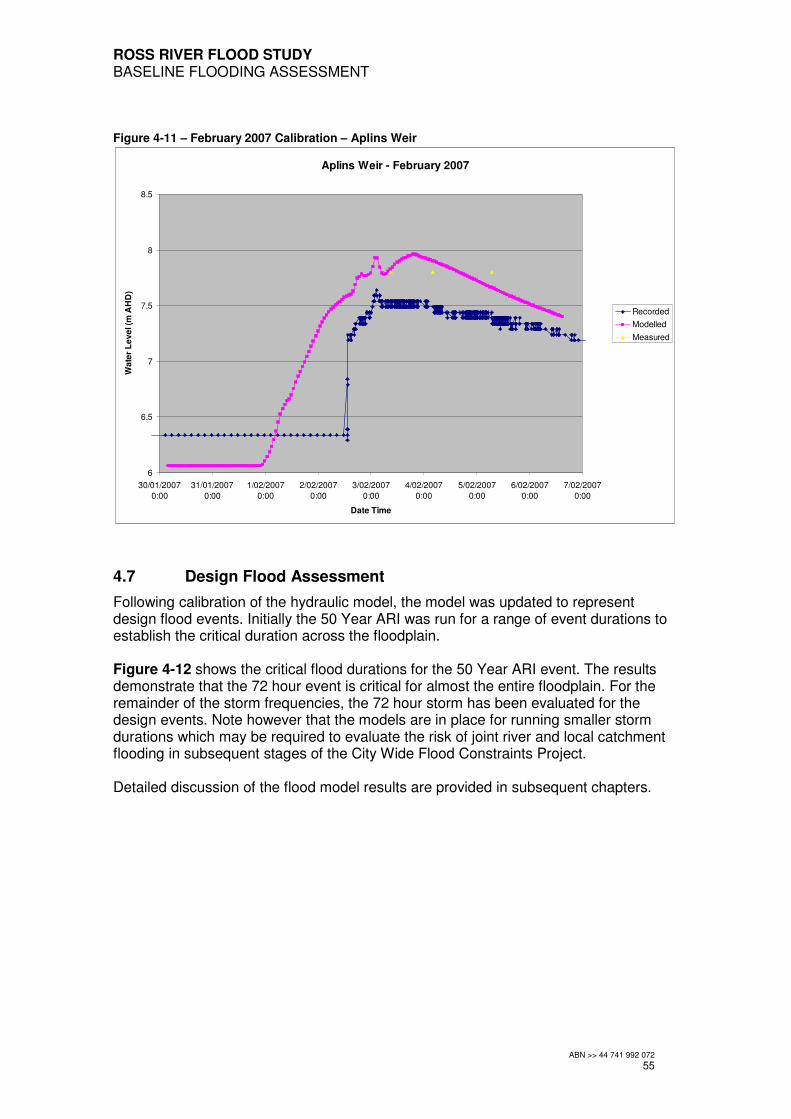
ROSS RIVER FLOOD STUDY BASELINE FLOODING ASSESSMENT
ABN >> 44 741 992 072
55
Figure 4-11 – February 2007 Calibration – Aplins Weir
Aplins Weir - February 2007
6
6.5
7
7.5
8
8.5
30/01/2007
0:00
31/01/2007
0:00
1/02/2007
0:00
2/02/2007
0:00
3/02/2007
0:00
4/02/2007
0:00
5/02/2007
0:00
6/02/2007
0:00
7/02/2007
0:00
Date Time
Wa
ter
Le
ve
l (m
AH
D)
Recorded
Modelled
Measured
4.7 Design Flood Assessment
Following calibration of the hydraulic model, the model was updated to represent design flood events. Initially the 50 Year ARI was run for a range of event durations to establish the critical duration across the floodplain. Figure 4-12 shows the critical flood durations for the 50 Year ARI event. The results demonstrate that the 72 hour event is critical for almost the entire floodplain. For the remainder of the storm frequencies, the 72 hour storm has been evaluated for the design events. Note however that the models are in place for running smaller storm durations which may be required to evaluate the risk of joint river and local catchment flooding in subsequent stages of the City Wide Flood Constraints Project. Detailed discussion of the flood model results are provided in subsequent chapters.

STUART
MOUNT STUART
KELSO
GUMLOW
BROOKHILL
MURRAY
KIRWAN
JULAGO
SHAW
DOUGLAS
ROSENEATH
OAK VALLEY
CLUDEN
MOUNT LOUISA
CONDON
ANNANDALE
GARBUTT
IDALIABOHLE PLAINS
RASMUSSEN
COSGROVE
PINNACLES
WULGURU
AITKENVALE
CRANBROOK
RAILWAY ESTATE
WEST END
HEATLEYOONOONBA
GULLIVER
CURRAJONG
ROSSLEAMUNDINGBURRA
HERMIT PARKVINCENT
HYDE PARK
SOUTH TOWNSVILLE
PIMLICO
THURINGOWA CENTRAL
ROSS RIVER
MYSTERTON
BOHLETOWNSVILLE CITY
MOUNT ST JOHNBURDELL
LEGEND
Critical Duration (h)2436487296120144168
FIGURE 4-12
SCALE: @1:60,000
2 01
KilometersA3
TOWNSVILLE CITY COUNCILROSS RIVER FLOOD STUDY50 Y ARI CRITICAL DURATION
© Townsville City Council 2010DIGITAL FILE: DRAWN BY: DATE:
Strategic Planning DepartmentPLANNING AND DEVELOPMENT
mxdWGB
13/04/2011
´
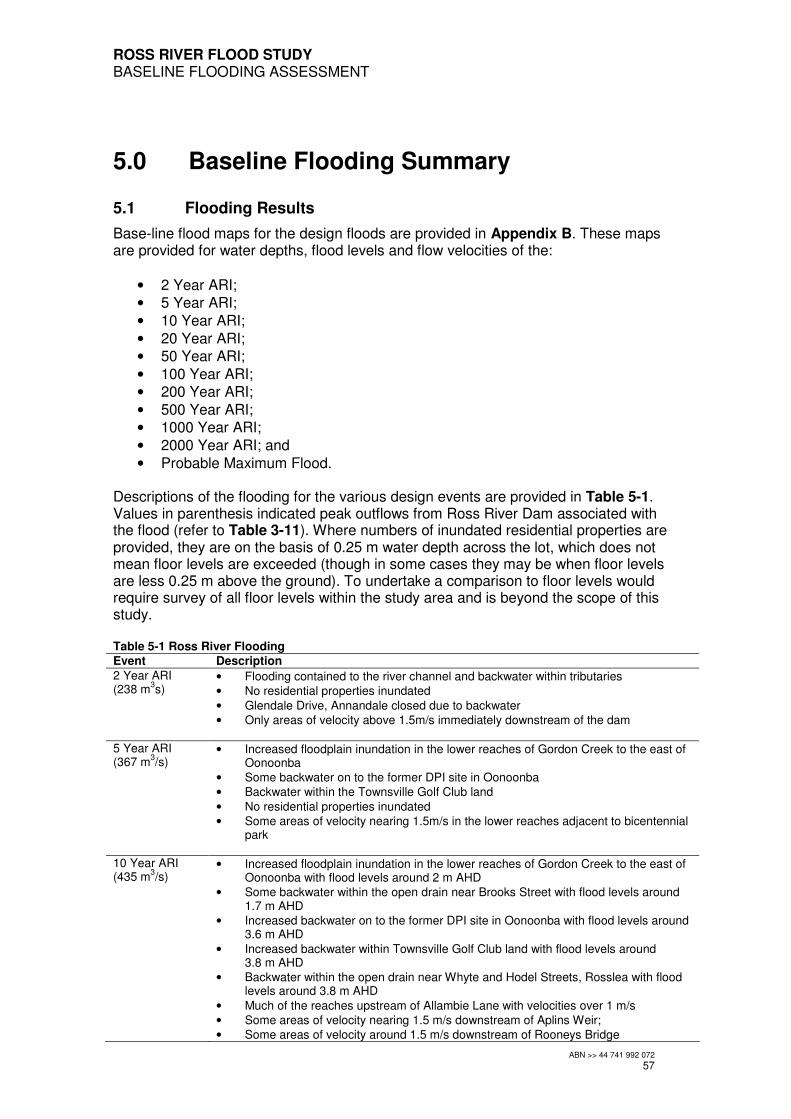
ROSS RIVER FLOOD STUDY BASELINE FLOODING ASSESSMENT
ABN >> 44 741 992 072
57
5.0 Baseline Flooding Summary
5.1 Flooding Results
Base-line flood maps for the design floods are provided in Appendix B. These maps are provided for water depths, flood levels and flow velocities of the:
• 2 Year ARI;
• 5 Year ARI;
• 10 Year ARI;
• 20 Year ARI;
• 50 Year ARI;
• 100 Year ARI;
• 200 Year ARI;
• 500 Year ARI;
• 1000 Year ARI;
• 2000 Year ARI; and
• Probable Maximum Flood. Descriptions of the flooding for the various design events are provided in Table 5-1. Values in parenthesis indicated peak outflows from Ross River Dam associated with the flood (refer to Table 3-11). Where numbers of inundated residential properties are provided, they are on the basis of 0.25 m water depth across the lot, which does not mean floor levels are exceeded (though in some cases they may be when floor levels are less 0.25 m above the ground). To undertake a comparison to floor levels would require survey of all floor levels within the study area and is beyond the scope of this study. Table 5-1 Ross River Flooding
Event Description
2 Year ARI (238 m
3s)
• Flooding contained to the river channel and backwater within tributaries
• No residential properties inundated
• Glendale Drive, Annandale closed due to backwater
• Only areas of velocity above 1.5m/s immediately downstream of the dam
5 Year ARI (367 m
3/s)
• Increased floodplain inundation in the lower reaches of Gordon Creek to the east of Oonoonba
• Some backwater on to the former DPI site in Oonoonba
• Backwater within the Townsville Golf Club land
• No residential properties inundated
• Some areas of velocity nearing 1.5m/s in the lower reaches adjacent to bicentennial park
10 Year ARI (435 m
3/s)
• Increased floodplain inundation in the lower reaches of Gordon Creek to the east of Oonoonba with flood levels around 2 m AHD
• Some backwater within the open drain near Brooks Street with flood levels around 1.7 m AHD
• Increased backwater on to the former DPI site in Oonoonba with flood levels around 3.6 m AHD
• Increased backwater within Townsville Golf Club land with flood levels around 3.8 m AHD
• Backwater within the open drain near Whyte and Hodel Streets, Rosslea with flood levels around 3.8 m AHD
• Much of the reaches upstream of Allambie Lane with velocities over 1 m/s
• Some areas of velocity nearing 1.5 m/s downstream of Aplins Weir;
• Some areas of velocity around 1.5 m/s downstream of Rooneys Bridge

ROSS RIVER FLOOD STUDY BASELINE FLOODING ASSESSMENT
ABN >> 44 741 992 072
58
Event Description
20 Year ARI (571 m
3/s)
• Increased floodplain inundation in the lower reaches of Gordon Creek to the east of Oonoonba with flood levels around 2.3 m AHD
• Some backwater within the open drain near Brooks Street with flood levels around 1.9 m AHD
• Formation of an overbank flow near Rooneys Bridge across the former DPI site in Oonoonba to the floodplain downstream of Abbot Street (Abbot Street not overtopped)
• Increased backwater on to the former DPI site in Oonoonba with flood levels around 3.9 m AHD
• Increased backwater within Townsville Golf Club land with flood levels around 4.2 m AHD, including inundation of up to 5 residential properties adjacent the Hodel Street Drain in Rosslea
• Inundation of up to 24 residential properties in the vicinity of Sherriff Street and Goldring Street in Rosslea
• Inundation of up to 4 residential properties in Whyte Street, Rosslea
• Areas of velocity over 1 m/s between Gleesons Weir and Nathan Street Bridge.
50 Year ARI (656 m
3/s)
• Floodplain inundation in the lower reaches of Gordon Creek encroaching into the east of Oonoonba with flood levels around 2.4 m AHD
• Increase in overbank flow near Rooneys Bridge across the former DPI site in Oonoonba to the floodplain downstream of Abbot Street (Abbot Street overtopped)
• Increased backwater on to the former DPI site in Oonoonba with flood levels around 4.0 m AHD
• Increased backwater within Townsville Golf Club land with flood levels around 4.3 m AHD.
• Areas of inundation near the Hodel Street Drain with up to 5 residential properties inundated
• Ares of inundation around Sherriff/Goldring Street with up to 25 residential properties inundated
• Inundation of up to 5 residential properties in Whyte Street, Rosslea
100 Year ARI (745 m
3/s)
• Increased backwater in Goondi Creek around South Townsville/Railway Estate with flood levels around 1.9 m AHD
• Floodplain inundation in the lower reaches of Gordon Creek encroaching into the east of Oonoonba with flood levels around 2.6 m AHD
• Overflows from Ross River into Railway Estate from upstream of Rooneys Bridge and along Eleventh Avenue with up to 42 residential properties inundated
• Increase in overbank flow near Rooneys Bridge across the former DPI site in Oonoonba to the floodplain downstream of Abbot Street
• Increased backwater flooding in the former DPI site in Oonoonba becomes with flood levels around 4.2 m AHD
• Increased backwater within Townsville Golf Club land with flood levels around 4.5 m AHD, inundating up to 61 residential properties within Rosslea
• Velocities for overbank flow near Rooneys Bridge across the former DPI site in Oonoonba of up to 0.6 m/s
200 Year ARI (960 m
3/s)
• Increased backwater in Goondi Creek around South Townsville/Railway Estate with flood levels around 2.1 m AHD
• Floodplain inundation in the lower reaches of Gordon Creek encroaching into the east of Oonoonba with flood levels around 2.7 m AHD
• Increased overflows from Ross River into Railway Estate from upstream of Rooneys Bridge and along Eleventh Avenue with up to 64 residential properties inundated
• Increase in overbank flow near Rooneys Bridge across the former DPI site in Oonoonba to the floodplain downstream of Abbot Street (Abbot Street overtopped) with velocities up to 0.8 m/s.
• Increased backwater within Townsville Golf Club land with flood levels around 4.8 m AHD, inundating up to 90 residential properties within Rosslea
• The are of backwater on the former DPI site becomes an overbank flow with flood levels ranging from 4.7 m AHD to 4.4 m AHD and velocities up to 0.6 m/s
• Overflow from Ross River into the Fairfield Lakes system with minimal impact on residential properties.
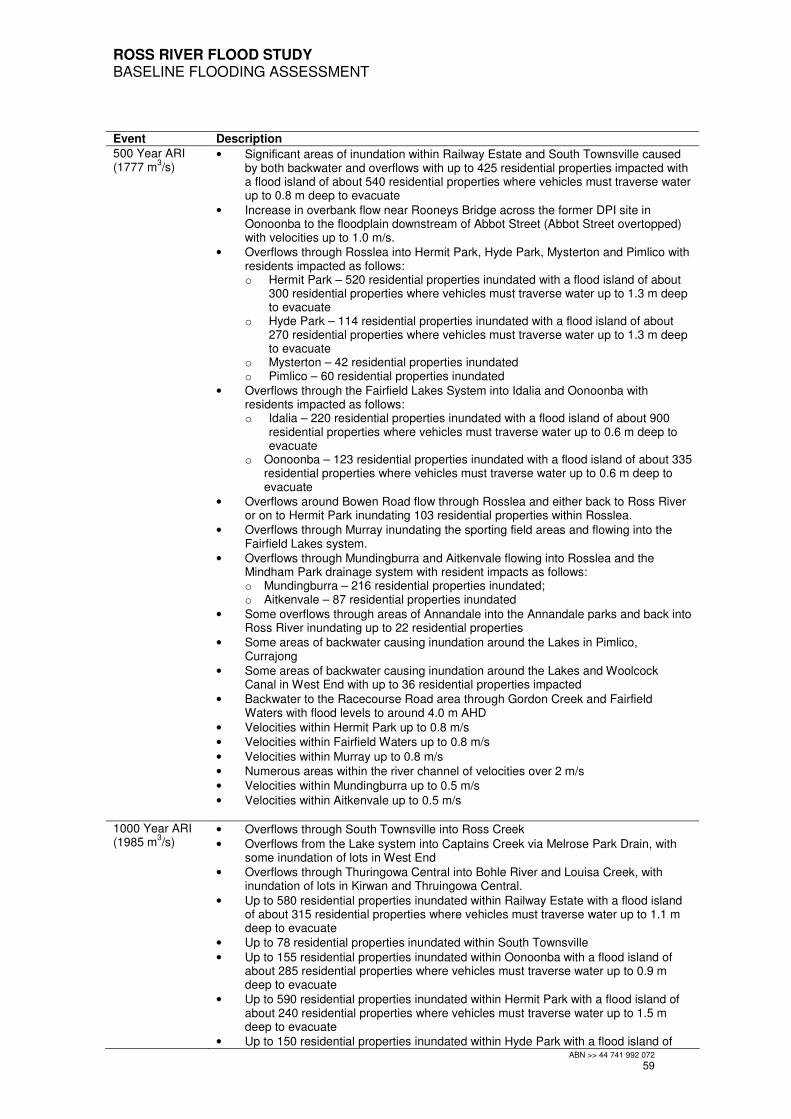
ROSS RIVER FLOOD STUDY BASELINE FLOODING ASSESSMENT
ABN >> 44 741 992 072
59
Event Description
500 Year ARI (1777 m
3/s)
• Significant areas of inundation within Railway Estate and South Townsville caused by both backwater and overflows with up to 425 residential properties impacted with a flood island of about 540 residential properties where vehicles must traverse water up to 0.8 m deep to evacuate
• Increase in overbank flow near Rooneys Bridge across the former DPI site in Oonoonba to the floodplain downstream of Abbot Street (Abbot Street overtopped) with velocities up to 1.0 m/s.
• Overflows through Rosslea into Hermit Park, Hyde Park, Mysterton and Pimlico with residents impacted as follows: o Hermit Park – 520 residential properties inundated with a flood island of about
300 residential properties where vehicles must traverse water up to 1.3 m deep to evacuate
o Hyde Park – 114 residential properties inundated with a flood island of about 270 residential properties where vehicles must traverse water up to 1.3 m deep to evacuate
o Mysterton – 42 residential properties inundated o Pimlico – 60 residential properties inundated
• Overflows through the Fairfield Lakes System into Idalia and Oonoonba with residents impacted as follows: o Idalia – 220 residential properties inundated with a flood island of about 900
residential properties where vehicles must traverse water up to 0.6 m deep to evacuate
o Oonoonba – 123 residential properties inundated with a flood island of about 335 residential properties where vehicles must traverse water up to 0.6 m deep to evacuate
• Overflows around Bowen Road flow through Rosslea and either back to Ross River or on to Hermit Park inundating 103 residential properties within Rosslea.
• Overflows through Murray inundating the sporting field areas and flowing into the Fairfield Lakes system.
• Overflows through Mundingburra and Aitkenvale flowing into Rosslea and the Mindham Park drainage system with resident impacts as follows: o Mundingburra – 216 residential properties inundated; o Aitkenvale – 87 residential properties inundated
• Some overflows through areas of Annandale into the Annandale parks and back into Ross River inundating up to 22 residential properties
• Some areas of backwater causing inundation around the Lakes in Pimlico, Currajong
• Some areas of backwater causing inundation around the Lakes and Woolcock Canal in West End with up to 36 residential properties impacted
• Backwater to the Racecourse Road area through Gordon Creek and Fairfield Waters with flood levels to around 4.0 m AHD
• Velocities within Hermit Park up to 0.8 m/s
• Velocities within Fairfield Waters up to 0.8 m/s
• Velocities within Murray up to 0.8 m/s
• Numerous areas within the river channel of velocities over 2 m/s
• Velocities within Mundingburra up to 0.5 m/s
• Velocities within Aitkenvale up to 0.5 m/s
1000 Year ARI (1985 m
3/s)
• Overflows through South Townsville into Ross Creek
• Overflows from the Lake system into Captains Creek via Melrose Park Drain, with some inundation of lots in West End
• Overflows through Thuringowa Central into Bohle River and Louisa Creek, with inundation of lots in Kirwan and Thruingowa Central.
• Up to 580 residential properties inundated within Railway Estate with a flood island of about 315 residential properties where vehicles must traverse water up to 1.1 m deep to evacuate
• Up to 78 residential properties inundated within South Townsville
• Up to 155 residential properties inundated within Oonoonba with a flood island of about 285 residential properties where vehicles must traverse water up to 0.9 m deep to evacuate
• Up to 590 residential properties inundated within Hermit Park with a flood island of about 240 residential properties where vehicles must traverse water up to 1.5 m deep to evacuate
• Up to 150 residential properties inundated within Hyde Park with a flood island of
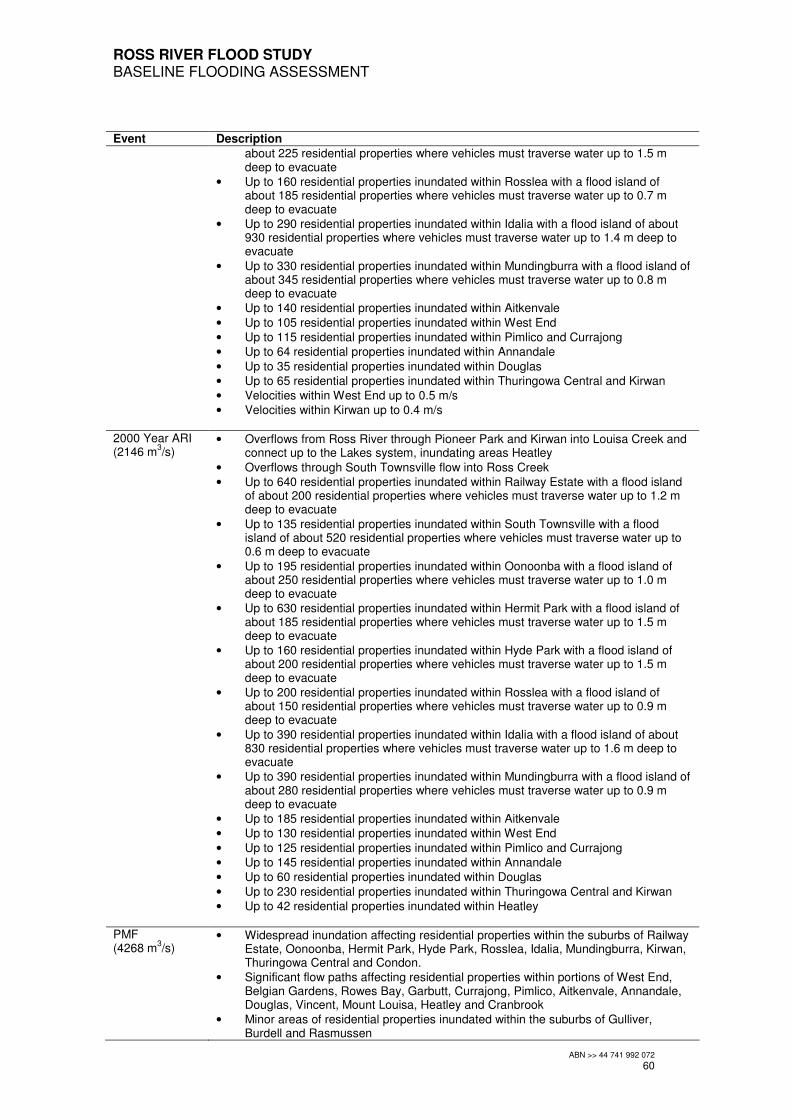
ROSS RIVER FLOOD STUDY BASELINE FLOODING ASSESSMENT
ABN >> 44 741 992 072
60
Event Description
about 225 residential properties where vehicles must traverse water up to 1.5 m deep to evacuate
• Up to 160 residential properties inundated within Rosslea with a flood island of about 185 residential properties where vehicles must traverse water up to 0.7 m deep to evacuate
• Up to 290 residential properties inundated within Idalia with a flood island of about 930 residential properties where vehicles must traverse water up to 1.4 m deep to evacuate
• Up to 330 residential properties inundated within Mundingburra with a flood island of about 345 residential properties where vehicles must traverse water up to 0.8 m deep to evacuate
• Up to 140 residential properties inundated within Aitkenvale
• Up to 105 residential properties inundated within West End
• Up to 115 residential properties inundated within Pimlico and Currajong
• Up to 64 residential properties inundated within Annandale
• Up to 35 residential properties inundated within Douglas
• Up to 65 residential properties inundated within Thuringowa Central and Kirwan
• Velocities within West End up to 0.5 m/s
• Velocities within Kirwan up to 0.4 m/s
2000 Year ARI (2146 m
3/s)
• Overflows from Ross River through Pioneer Park and Kirwan into Louisa Creek and connect up to the Lakes system, inundating areas Heatley
• Overflows through South Townsville flow into Ross Creek
• Up to 640 residential properties inundated within Railway Estate with a flood island of about 200 residential properties where vehicles must traverse water up to 1.2 m deep to evacuate
• Up to 135 residential properties inundated within South Townsville with a flood island of about 520 residential properties where vehicles must traverse water up to 0.6 m deep to evacuate
• Up to 195 residential properties inundated within Oonoonba with a flood island of about 250 residential properties where vehicles must traverse water up to 1.0 m deep to evacuate
• Up to 630 residential properties inundated within Hermit Park with a flood island of about 185 residential properties where vehicles must traverse water up to 1.5 m deep to evacuate
• Up to 160 residential properties inundated within Hyde Park with a flood island of about 200 residential properties where vehicles must traverse water up to 1.5 m deep to evacuate
• Up to 200 residential properties inundated within Rosslea with a flood island of about 150 residential properties where vehicles must traverse water up to 0.9 m deep to evacuate
• Up to 390 residential properties inundated within Idalia with a flood island of about 830 residential properties where vehicles must traverse water up to 1.6 m deep to evacuate
• Up to 390 residential properties inundated within Mundingburra with a flood island of about 280 residential properties where vehicles must traverse water up to 0.9 m deep to evacuate
• Up to 185 residential properties inundated within Aitkenvale
• Up to 130 residential properties inundated within West End
• Up to 125 residential properties inundated within Pimlico and Currajong
• Up to 145 residential properties inundated within Annandale
• Up to 60 residential properties inundated within Douglas
• Up to 230 residential properties inundated within Thuringowa Central and Kirwan
• Up to 42 residential properties inundated within Heatley
PMF (4268 m
3/s)
• Widespread inundation affecting residential properties within the suburbs of Railway Estate, Oonoonba, Hermit Park, Hyde Park, Rosslea, Idalia, Mundingburra, Kirwan, Thuringowa Central and Condon.
• Significant flow paths affecting residential properties within portions of West End, Belgian Gardens, Rowes Bay, Garbutt, Currajong, Pimlico, Aitkenvale, Annandale, Douglas, Vincent, Mount Louisa, Heatley and Cranbrook
• Minor areas of residential properties inundated within the suburbs of Gulliver, Burdell and Rasmussen
ROSS RIVER FLOOD STUDY BASELINE FLOODING ASSESSMENT
ABN >> 44 741 992 072
61
Event Description
• Up to 14900 residential properties inundated across the city.
5.2 Hydraulic Grade Line
Results of the flood modelling have been used to derive hydraulic grade lines for the Ross River Channel. Long-sections showing these hydraulic grade lines are provided in Appendix C. Tabulated values of the flood levels along the river are provided in Table 5-2. Locations of the chainages are provided in Figure 5-1.
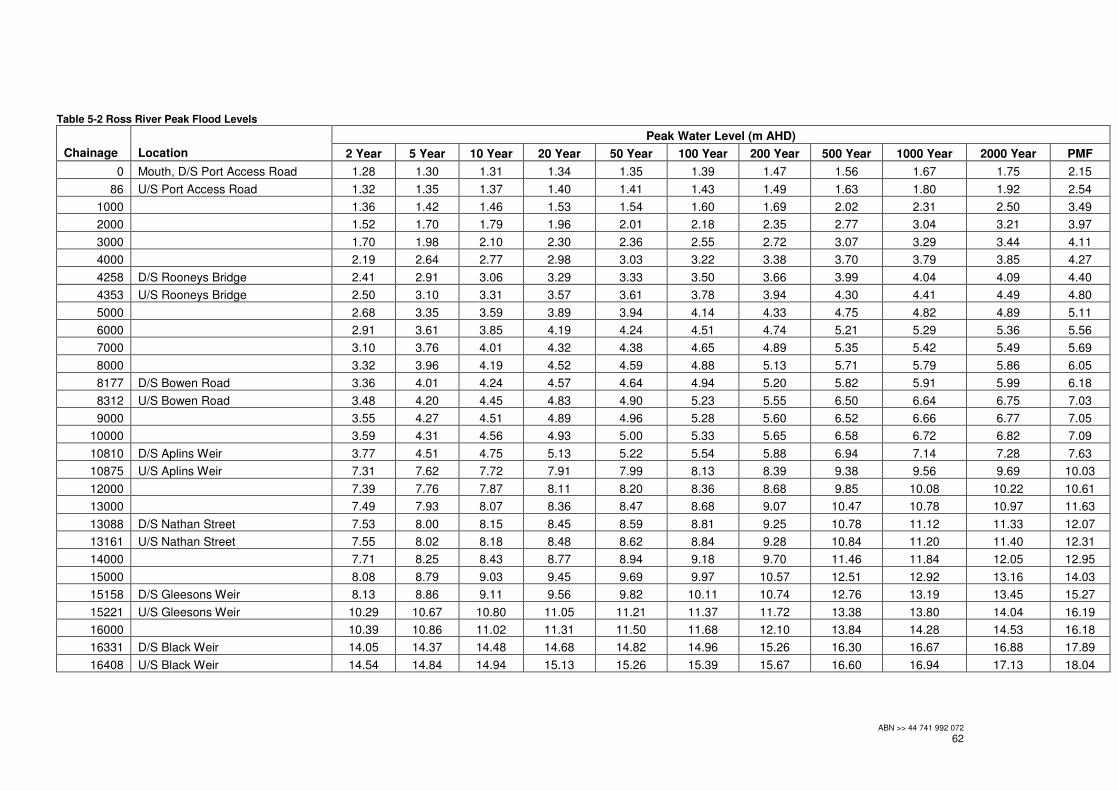
ABN >> 44 741 992 072
62
Table 5-2 Ross River Peak Flood Levels
Peak Water Level (m AHD)
Chainage Location 2 Year 5 Year 10 Year 20 Year 50 Year 100 Year 200 Year 500 Year 1000 Year 2000 Year PMF
0 Mouth, D/S Port Access Road 1.28 1.30 1.31 1.34 1.35 1.39 1.47 1.56 1.67 1.75 2.15
86 U/S Port Access Road 1.32 1.35 1.37 1.40 1.41 1.43 1.49 1.63 1.80 1.92 2.54
1000 1.36 1.42 1.46 1.53 1.54 1.60 1.69 2.02 2.31 2.50 3.49
2000 1.52 1.70 1.79 1.96 2.01 2.18 2.35 2.77 3.04 3.21 3.97
3000 1.70 1.98 2.10 2.30 2.36 2.55 2.72 3.07 3.29 3.44 4.11
4000 2.19 2.64 2.77 2.98 3.03 3.22 3.38 3.70 3.79 3.85 4.27
4258 D/S Rooneys Bridge 2.41 2.91 3.06 3.29 3.33 3.50 3.66 3.99 4.04 4.09 4.40
4353 U/S Rooneys Bridge 2.50 3.10 3.31 3.57 3.61 3.78 3.94 4.30 4.41 4.49 4.80
5000 2.68 3.35 3.59 3.89 3.94 4.14 4.33 4.75 4.82 4.89 5.11
6000 2.91 3.61 3.85 4.19 4.24 4.51 4.74 5.21 5.29 5.36 5.56
7000 3.10 3.76 4.01 4.32 4.38 4.65 4.89 5.35 5.42 5.49 5.69
8000 3.32 3.96 4.19 4.52 4.59 4.88 5.13 5.71 5.79 5.86 6.05
8177 D/S Bowen Road 3.36 4.01 4.24 4.57 4.64 4.94 5.20 5.82 5.91 5.99 6.18
8312 U/S Bowen Road 3.48 4.20 4.45 4.83 4.90 5.23 5.55 6.50 6.64 6.75 7.03
9000 3.55 4.27 4.51 4.89 4.96 5.28 5.60 6.52 6.66 6.77 7.05
10000 3.59 4.31 4.56 4.93 5.00 5.33 5.65 6.58 6.72 6.82 7.09
10810 D/S Aplins Weir 3.77 4.51 4.75 5.13 5.22 5.54 5.88 6.94 7.14 7.28 7.63
10875 U/S Aplins Weir 7.31 7.62 7.72 7.91 7.99 8.13 8.39 9.38 9.56 9.69 10.03
12000 7.39 7.76 7.87 8.11 8.20 8.36 8.68 9.85 10.08 10.22 10.61
13000 7.49 7.93 8.07 8.36 8.47 8.68 9.07 10.47 10.78 10.97 11.63
13088 D/S Nathan Street 7.53 8.00 8.15 8.45 8.59 8.81 9.25 10.78 11.12 11.33 12.07
13161 U/S Nathan Street 7.55 8.02 8.18 8.48 8.62 8.84 9.28 10.84 11.20 11.40 12.31
14000 7.71 8.25 8.43 8.77 8.94 9.18 9.70 11.46 11.84 12.05 12.95
15000 8.08 8.79 9.03 9.45 9.69 9.97 10.57 12.51 12.92 13.16 14.03
15158 D/S Gleesons Weir 8.13 8.86 9.11 9.56 9.82 10.11 10.74 12.76 13.19 13.45 15.27
15221 U/S Gleesons Weir 10.29 10.67 10.80 11.05 11.21 11.37 11.72 13.38 13.80 14.04 16.19
16000 10.39 10.86 11.02 11.31 11.50 11.68 12.10 13.84 14.28 14.53 16.18
16331 D/S Black Weir 14.05 14.37 14.48 14.68 14.82 14.96 15.26 16.30 16.67 16.88 17.89
16408 U/S Black Weir 14.54 14.84 14.94 15.13 15.26 15.39 15.67 16.60 16.94 17.13 18.04
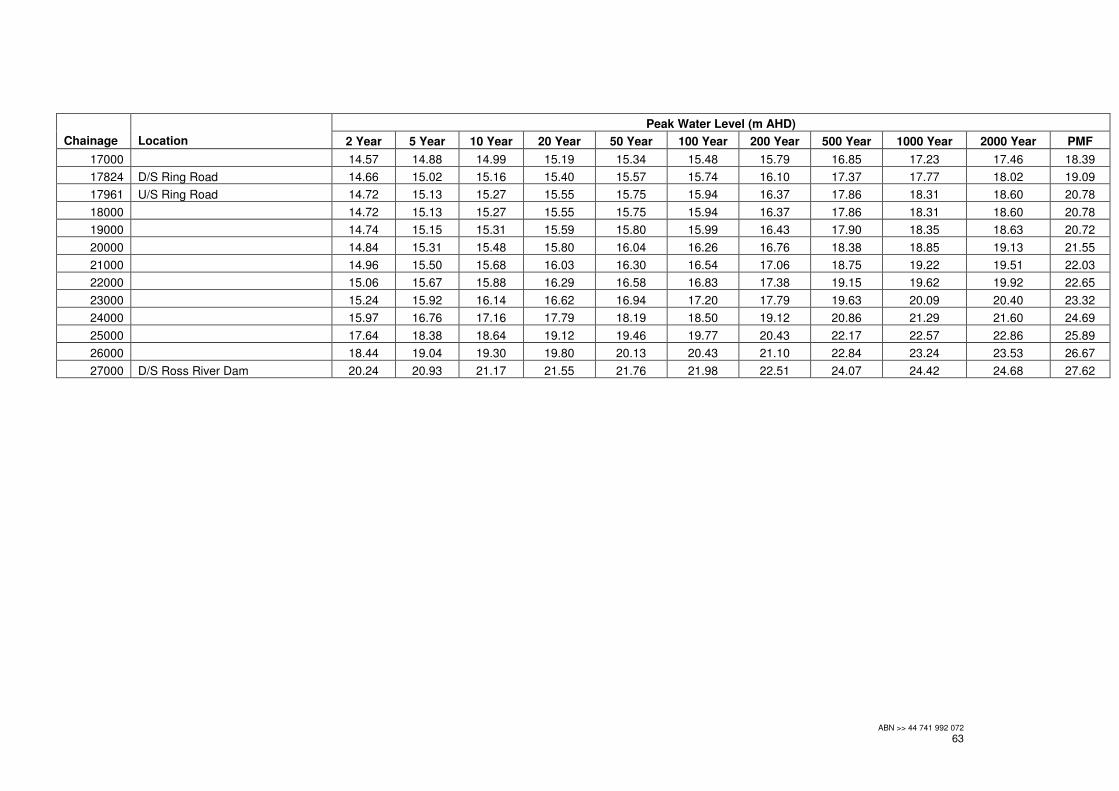
ABN >> 44 741 992 072
63
Peak Water Level (m AHD)
Chainage Location 2 Year 5 Year 10 Year 20 Year 50 Year 100 Year 200 Year 500 Year 1000 Year 2000 Year PMF
17000 14.57 14.88 14.99 15.19 15.34 15.48 15.79 16.85 17.23 17.46 18.39
17824 D/S Ring Road 14.66 15.02 15.16 15.40 15.57 15.74 16.10 17.37 17.77 18.02 19.09
17961 U/S Ring Road 14.72 15.13 15.27 15.55 15.75 15.94 16.37 17.86 18.31 18.60 20.78
18000 14.72 15.13 15.27 15.55 15.75 15.94 16.37 17.86 18.31 18.60 20.78
19000 14.74 15.15 15.31 15.59 15.80 15.99 16.43 17.90 18.35 18.63 20.72
20000 14.84 15.31 15.48 15.80 16.04 16.26 16.76 18.38 18.85 19.13 21.55
21000 14.96 15.50 15.68 16.03 16.30 16.54 17.06 18.75 19.22 19.51 22.03
22000 15.06 15.67 15.88 16.29 16.58 16.83 17.38 19.15 19.62 19.92 22.65
23000 15.24 15.92 16.14 16.62 16.94 17.20 17.79 19.63 20.09 20.40 23.32
24000 15.97 16.76 17.16 17.79 18.19 18.50 19.12 20.86 21.29 21.60 24.69
25000 17.64 18.38 18.64 19.12 19.46 19.77 20.43 22.17 22.57 22.86 25.89
26000 18.44 19.04 19.30 19.80 20.13 20.43 21.10 22.84 23.24 23.53 26.67
27000 D/S Ross River Dam 20.24 20.93 21.17 21.55 21.76 21.98 22.51 24.07 24.42 24.68 27.62
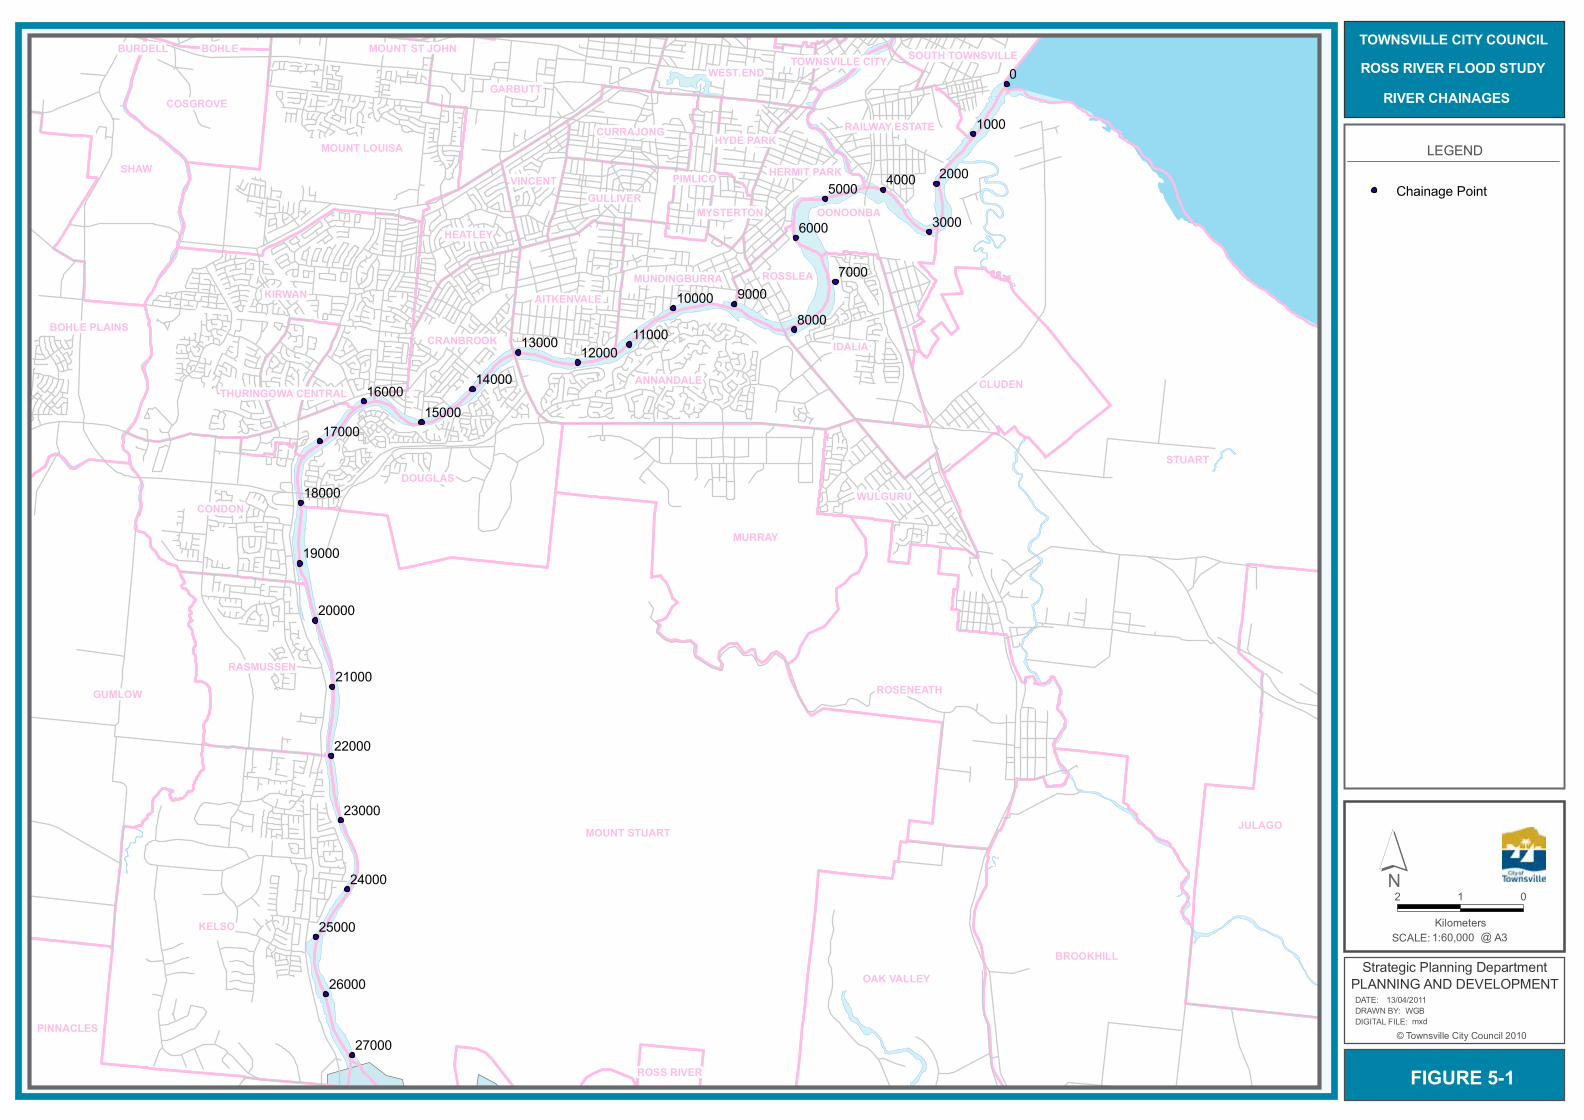
0
90008000
7000
6000
5000 4000
3000
2000
1000
26000
25000
24000
23000
22000
21000
20000
19000
27000
18000
17000
1600015000
14000
13000 1200011000
10000
STUART
MOUNT STUART
KELSO
GUMLOW
BROOKHILL
KIRWAN
MURRAY
JULAGO
SHAW
DOUGLAS
ROSENEATH
OAK VALLEY
CLUDEN
MOUNT LOUISA
CONDON
ANNANDALE
GARBUTT
IDALIABOHLE PLAINS
RASMUSSEN
COSGROVE
PINNACLES
WULGURU
AITKENVALE
CRANBROOK
RAILWAY ESTATE
WEST END
HEATLEYOONOONBA
GULLIVER
CURRAJONG
ROSSLEAMUNDINGBURRA
HERMIT PARKVINCENT
SOUTH TOWNSVILLE
PIMLICO
HYDE PARK
THURINGOWA CENTRAL
ROSS RIVER
MYSTERTON
BOHLETOWNSVILLE CITY
MOUNT ST JOHNBURDELL
LEGEND
Chainage Point
FIGURE 5-1
SCALE: @1:60,000
2 01
KilometersA3
TOWNSVILLE CITY COUNCILROSS RIVER FLOOD STUDY
RIVER CHAINAGES
© Townsville City Council 2010DIGITAL FILE: DRAWN BY: DATE:
Strategic Planning DepartmentPLANNING AND DEVELOPMENT
mxdWGB
13/04/2011
´

ABN >> 44 741 992 072
65
5.3 Flow Distributions
The main purpose of this flood study was to identify the flows within and overflowing from Ross River to apply for future stages of the City Wide Flood Constraints project. For all the design flood events modelled, the flows within the river channel and floodplain at key locations have been evaluated. Figure 5-2 shows the locations where flows have been determined from the model results. The flow values determined are provided in Table 5-3.
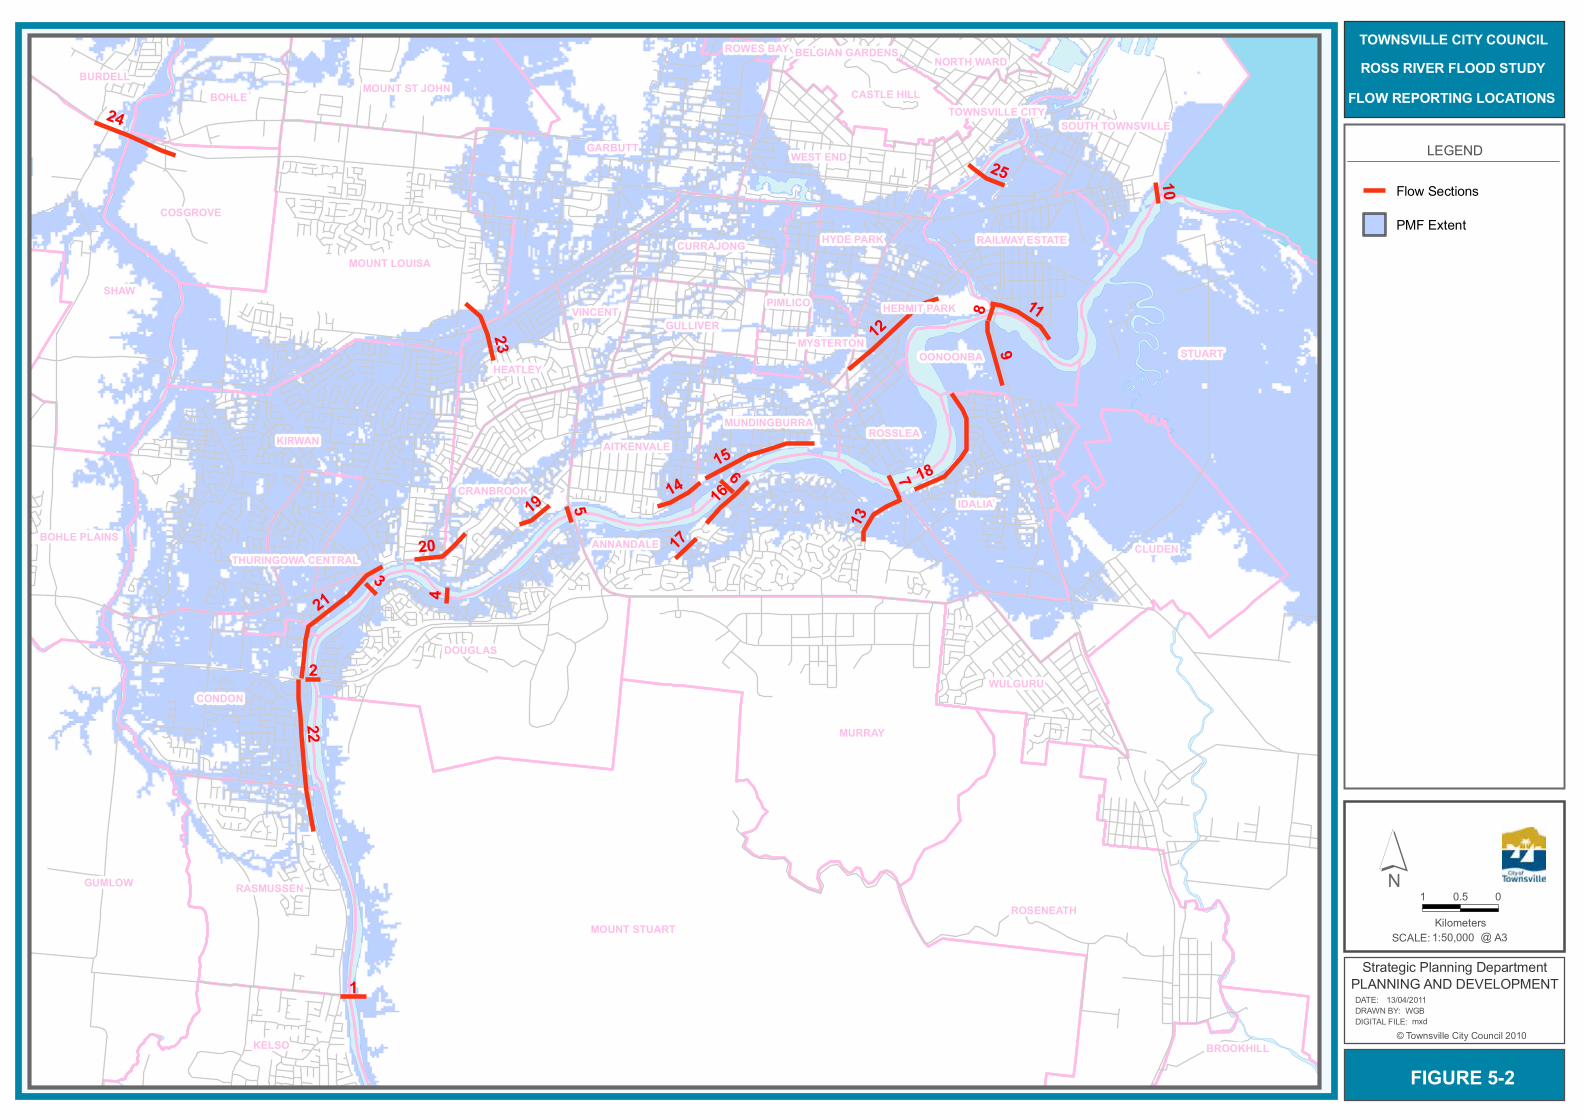
22
219
15
12
18
24
11
23
16
20
13
7
1
14
25
619 5
8
4
3
2
17
10
STUART
MOUNT STUART
KIRWAN
MURRAY
GUMLOW
SHAW
GARBUTT
DOUGLAS
ROSENEATH
CLUDEN
MOUNT LOUISA
CONDON
ANNANDALE
IDALIA
KELSO
RASMUSSEN
BOHLE
COSGROVE
WEST END
WULGURU
AITKENVALE
CRANBROOK
RAILWAY ESTATE
MOUNT ST JOHN
BOHLE PLAINS
SOUTH TOWNSVILLE
HEATLEYOONOONBA
BURDELL
GULLIVER
CURRAJONG
BROOKHILL
ROSSLEAMUNDINGBURRA
HERMIT PARK
CASTLE HILL
VINCENT
HYDE PARK
NORTH WARD
PIMLICO
TOWNSVILLE CITY
THURINGOWA CENTRAL
MYSTERTON
ROWES BAY BELGIAN GARDENS
LEGEND
Flow Sections
PMF Extent
FIGURE 5-2
SCALE: @1:50,000
1 00.5
KilometersA3
TOWNSVILLE CITY COUNCILROSS RIVER FLOOD STUDY
FLOW REPORTING LOCATIONS
© Townsville City Council 2010DIGITAL FILE: DRAWN BY: DATE:
Strategic Planning DepartmentPLANNING AND DEVELOPMENT
mxdWGB
13/04/2011
´
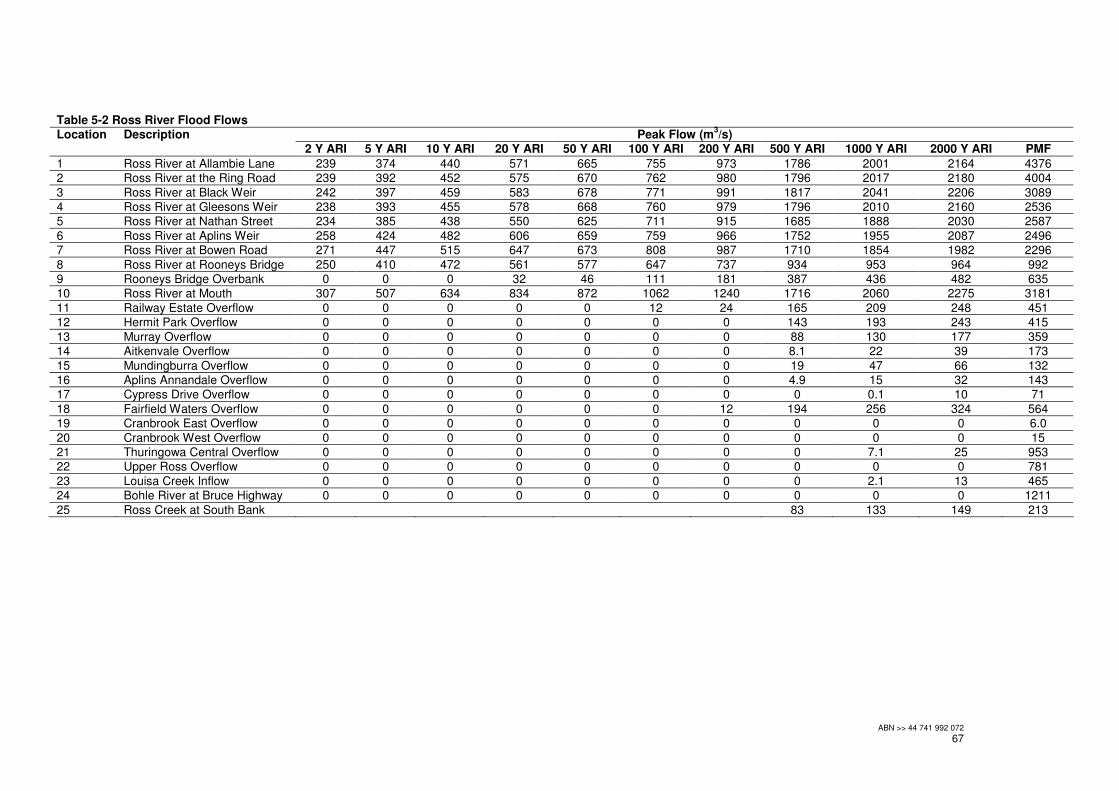
ABN >> 44 741 992 072
67
Table 5-2 Ross River Flood Flows Peak Flow (m
3/s) Location Description
2 Y ARI 5 Y ARI 10 Y ARI 20 Y ARI 50 Y ARI 100 Y ARI 200 Y ARI 500 Y ARI 1000 Y ARI 2000 Y ARI PMF
1 Ross River at Allambie Lane 239 374 440 571 665 755 973 1786 2001 2164 4376 2 Ross River at the Ring Road 239 392 452 575 670 762 980 1796 2017 2180 4004
3 Ross River at Black Weir 242 397 459 583 678 771 991 1817 2041 2206 3089 4 Ross River at Gleesons Weir 238 393 455 578 668 760 979 1796 2010 2160 2536 5 Ross River at Nathan Street 234 385 438 550 625 711 915 1685 1888 2030 2587
6 Ross River at Aplins Weir 258 424 482 606 659 759 966 1752 1955 2087 2496
7 Ross River at Bowen Road 271 447 515 647 673 808 987 1710 1854 1982 2296
8 Ross River at Rooneys Bridge 250 410 472 561 577 647 737 934 953 964 992 9 Rooneys Bridge Overbank 0 0 0 32 46 111 181 387 436 482 635
10 Ross River at Mouth 307 507 634 834 872 1062 1240 1716 2060 2275 3181
11 Railway Estate Overflow 0 0 0 0 0 12 24 165 209 248 451 12 Hermit Park Overflow 0 0 0 0 0 0 0 143 193 243 415
13 Murray Overflow 0 0 0 0 0 0 0 88 130 177 359
14 Aitkenvale Overflow 0 0 0 0 0 0 0 8.1 22 39 173
15 Mundingburra Overflow 0 0 0 0 0 0 0 19 47 66 132
16 Aplins Annandale Overflow 0 0 0 0 0 0 0 4.9 15 32 143 17 Cypress Drive Overflow 0 0 0 0 0 0 0 0 0.1 10 71
18 Fairfield Waters Overflow 0 0 0 0 0 0 12 194 256 324 564 19 Cranbrook East Overflow 0 0 0 0 0 0 0 0 0 0 6.0
20 Cranbrook West Overflow 0 0 0 0 0 0 0 0 0 0 15 21 Thuringowa Central Overflow 0 0 0 0 0 0 0 0 7.1 25 953 22 Upper Ross Overflow 0 0 0 0 0 0 0 0 0 0 781
23 Louisa Creek Inflow 0 0 0 0 0 0 0 0 2.1 13 465 24 Bohle River at Bruce Highway 0 0 0 0 0 0 0 0 0 0 1211
25 Ross Creek at South Bank 83 133 149 213

ABN >> 44 741 992 072
68
5.4 Floodplain Hazard
The safety of people and potential for damage to property is dependent on both the depth of inundation and the velocity of the flood waters. Floodwaters that flow deep and swift are obviously more hazardous than those areas where flows are shallow and slow. The degree of hazard varies across the floodplain in response to:
• flood severity;
• floodwater depth and velocity;
• rate of rise of floodwater;
• duration of flooding;
• evacuation capacity;
• population at risk;
• land-use;
• flood awareness; and
• warning time. To assist with floodplain management it is necessary to determine the hazard and ensure land uses are suitably aligned. Floodplain Management in Australia: Best practices and principles (CSIRO, 2000) identifies four degrees of hazard:
• Low – no significant evacuation problems; children and elderly could wade to safety with little difficulty; maximum flood depths and velocities along evacuation routes are low; evacuation distances are short; evacuation is possible by sedan-type motor vehicle; There is ample time for flood forecasting, flood warning and evacuation; evacuation routes remain trafficable for at least twice as long as the time required for evacuation.
• Medium – Fit adults can wade to safety, but children and the elderly may difficulty; evacuation routes are longer; maximum flood depths and velocities are greater; evacuation by sedan type motor vehicle is possible in the early stages of flooding, after which 4WD vehicles or trucks are required; evacuation routes remain trafficable for at least 1.5 times as long as the necessary evacuation time.
• High – fit adults have difficulty wading to safety; wading evacuation routes are longer again; maximum flood depths and velocities are greater (up 1.0 m and 1.5 m/s respectively); motor vehicle evacuation is possible only by 4WD vehicles or trucks in the early stages of flooding; boats and helicopters may be required; evacuation routes remain trafficable only up to the minimum evacuation time.
• Extreme – boats or helicopters are required for evacuation; wading is not an option because of the rate of rise and/or the depth and velocity of the floodwaters; maximum flood depths and velocities are over 1.0 m and 1.5 m/s respectively.
Prior to detailed assessment of floodplain hazard based on all the factors influencing hazard, preliminary assessment is often undertaken based on flood depth and velocity. Figure 5-3 provides the basis for defining hazard as a function of depth and velocity as
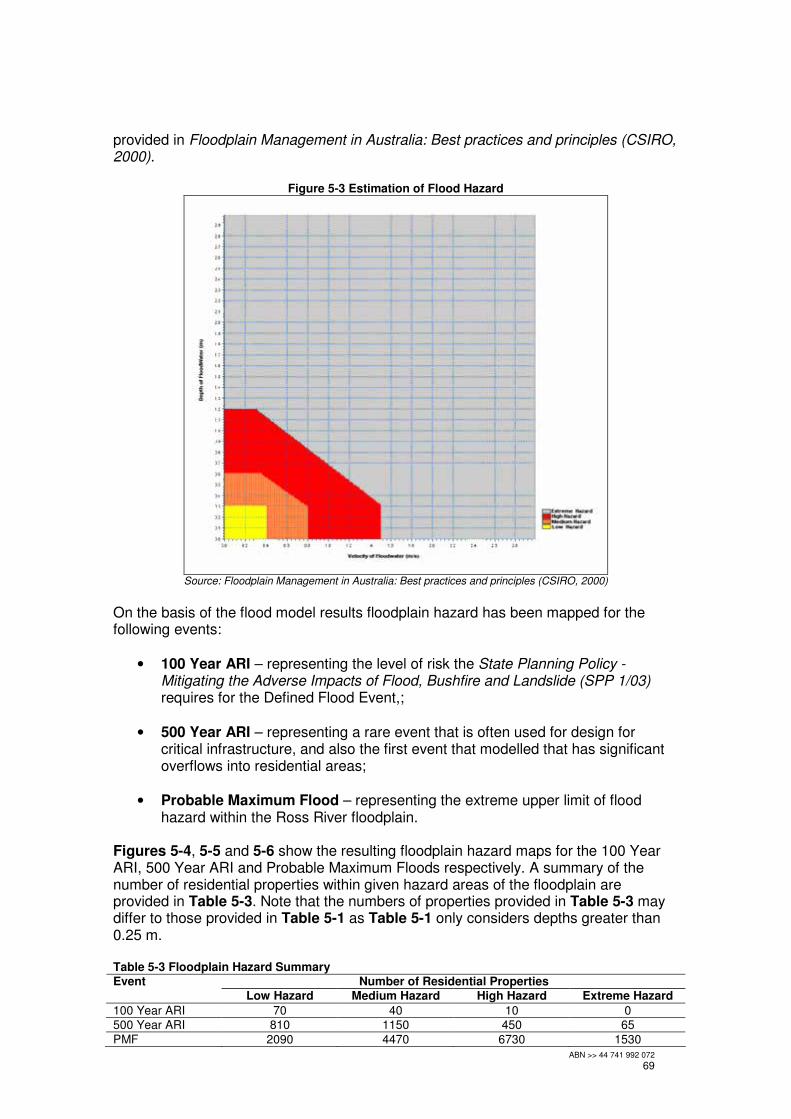
ABN >> 44 741 992 072
69
provided in Floodplain Management in Australia: Best practices and principles (CSIRO, 2000).
Figure 5-3 Estimation of Flood Hazard
Source: Floodplain Management in Australia: Best practices and principles (CSIRO, 2000)
On the basis of the flood model results floodplain hazard has been mapped for the following events:
• 100 Year ARI – representing the level of risk the State Planning Policy - Mitigating the Adverse Impacts of Flood, Bushfire and Landslide (SPP 1/03) requires for the Defined Flood Event,;
• 500 Year ARI – representing a rare event that is often used for design for critical infrastructure, and also the first event that modelled that has significant overflows into residential areas;
• Probable Maximum Flood – representing the extreme upper limit of flood hazard within the Ross River floodplain.
Figures 5-4, 5-5 and 5-6 show the resulting floodplain hazard maps for the 100 Year ARI, 500 Year ARI and Probable Maximum Floods respectively. A summary of the number of residential properties within given hazard areas of the floodplain are provided in Table 5-3. Note that the numbers of properties provided in Table 5-3 may differ to those provided in Table 5-1 as Table 5-1 only considers depths greater than 0.25 m. Table 5-3 Floodplain Hazard Summary
Number of Residential Properties Event Low Hazard Medium Hazard High Hazard Extreme Hazard
100 Year ARI 70 40 10 0 500 Year ARI 810 1150 450 65
PMF 2090 4470 6730 1530

STUART
CLUDEN
IDALIA
ANNANDALE
RAILWAY ESTATE
WEST END
MURRAY
OONOONBA
ROSSLEA
HERMIT PARKPIMLICO
MUNDINGBURRA
SOUTH TOWNSVILLE
HYDE PARKCURRAJONG
WULGURU
GULLIVER
MYSTERTON
TOWNSVILLE CITYGARBUTT
CASTLE HILL
LEGEND
Floodplain HazardLow HazardMedium HazardHigh HazardExtreme Hazard
FIGURE 5-4
SCALE: @1:25,000
0.35 00.175
KilometersA3
TOWNSVILLE CITY COUNCILROSS RIVER FLOOD STUDY
FLOODPLAIN HAZARD100 Y ARI
© Townsville City Council 2012DIGITAL FILE: DRAWN BY: DATE:
Strategic Planning DepartmentPLANNING AND DEVELOPMENT
mxdWGB
12/06/2012
´

STUART
CLUDEN
IDALIA
ANNANDALE
WEST END
MURRAY
RAILWAY ESTATE
OONOONBA
GARBUTT
CURRAJONG
ROSSLEAMUNDINGBURRA
HERMIT PARK
GULLIVER
PIMLICO
AITKENVALE
SOUTH TOWNSVILLE
HYDE PARK
MYSTERTON
TOWNSVILLE CITY
WULGURU
CASTLE HILL
LEGEND
Floodplain Hazard
Low HazardMedium HazardHigh HazardExtreme Hazard
FIGURE 5-5
SCALE: @1:25,000
0.35 00.175
KilometersA3
TOWNSVILLE CITY COUNCILROSS RIVER FLOOD STUDY
FLOODPLAIN HAZARD500 Y ARI
© Townsville City Council 2012DIGITAL FILE: DRAWN BY: DATE:
Strategic Planning DepartmentPLANNING AND DEVELOPMENT
mxdWGB
12/06/2012
´

STUART
MOUNT STUART
GUMLOW
KIRWAN
MURRAY
SHAW
GARBUTT
KELSO
DOUGLAS
ROSENEATH
BOHLE
CLUDEN
BOHLE PLAINS
BURDELL
MOUNT LOUISA
CONDON
ANNANDALE
BROOKHILL
IDALIA
JULAGO
RASMUSSEN
MOUNT ST JOHN
COSGROVE
WEST END
WULGURU
SOUTH TOWNSVILLE
AITKENVALE
CRANBROOK
RAILWAY ESTATE
HEATLEY
OONOONBA
NORTH WARD
ROWES BAY
CASTLE HILL
GULLIVER
CURRAJONG
ROSSLEA
TOWN COMMON
MUNDINGBURRA
HERMIT PARK
OAK VALLEY
VINCENTPIMLICO
TOWNSVILLE CITY
HYDE PARK
THURINGOWA CENTRAL
DEERAGUN
BELGIAN GARDENS
MYSTERTON
PINNACLES
MOUNT LOW
LEGEND
Floodplain Hazard
Low HazardMedium HazardHigh HazardExtreme Hazard
FIGURE 5-6
SCALE: @1:60,000
0.75 00.375
KilometersA3
TOWNSVILLE CITY COUNCILROSS RIVER FLOOD STUDY
FLOODPLAIN HAZARDPMF
© Townsville City Council 2012DIGITAL FILE: DRAWN BY: DATE:
Strategic Planning DepartmentPLANNING AND DEVELOPMENT
mxdWGB
12/06/2012
´
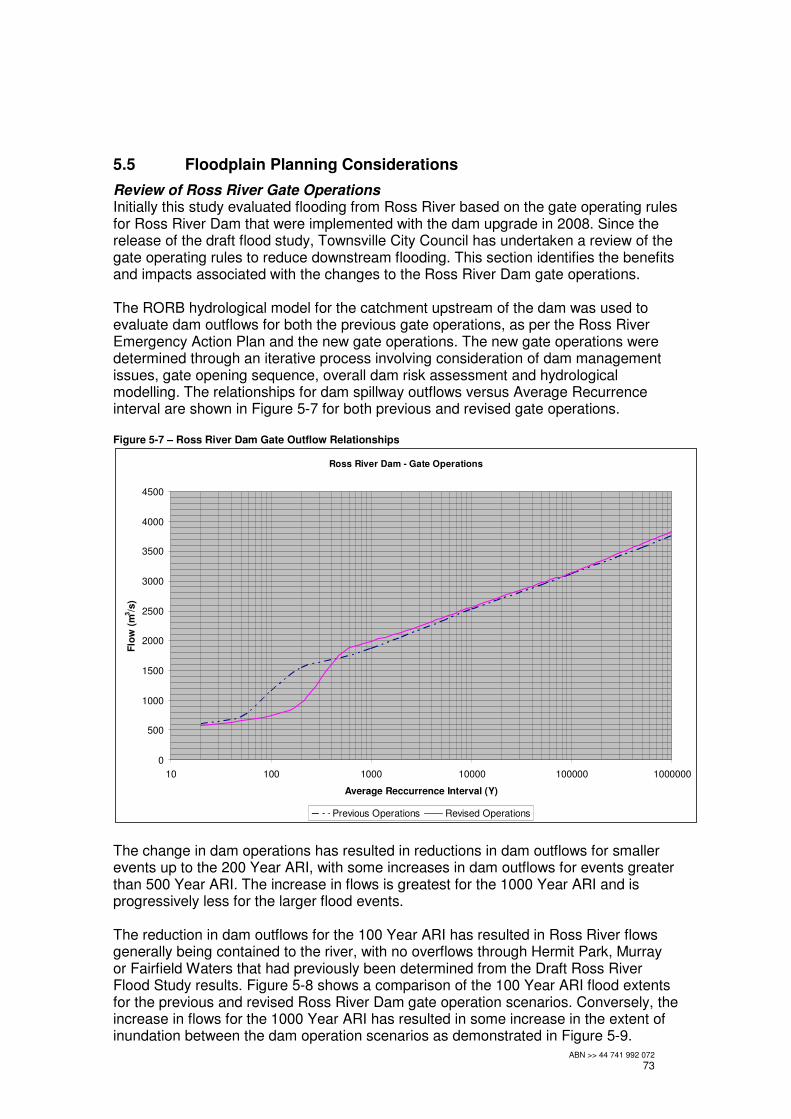
ABN >> 44 741 992 072
73
5.5 Floodplain Planning Considerations
Review of Ross River Gate Operations Initially this study evaluated flooding from Ross River based on the gate operating rules for Ross River Dam that were implemented with the dam upgrade in 2008. Since the release of the draft flood study, Townsville City Council has undertaken a review of the gate operating rules to reduce downstream flooding. This section identifies the benefits and impacts associated with the changes to the Ross River Dam gate operations. The RORB hydrological model for the catchment upstream of the dam was used to evaluate dam outflows for both the previous gate operations, as per the Ross River Emergency Action Plan and the new gate operations. The new gate operations were determined through an iterative process involving consideration of dam management issues, gate opening sequence, overall dam risk assessment and hydrological modelling. The relationships for dam spillway outflows versus Average Recurrence interval are shown in Figure 5-7 for both previous and revised gate operations. Figure 5-7 – Ross River Dam Gate Outflow Relationships
Ross River Dam - Gate Operations
0
500
1000
1500
2000
2500
3000
3500
4000
4500
10 100 1000 10000 100000 1000000
Average Reccurrence Interval (Y)
Flo
w (
m3/s
)
Previous Operations Revised Operations
The change in dam operations has resulted in reductions in dam outflows for smaller events up to the 200 Year ARI, with some increases in dam outflows for events greater than 500 Year ARI. The increase in flows is greatest for the 1000 Year ARI and is progressively less for the larger flood events. The reduction in dam outflows for the 100 Year ARI has resulted in Ross River flows generally being contained to the river, with no overflows through Hermit Park, Murray or Fairfield Waters that had previously been determined from the Draft Ross River Flood Study results. Figure 5-8 shows a comparison of the 100 Year ARI flood extents for the previous and revised Ross River Dam gate operation scenarios. Conversely, the increase in flows for the 1000 Year ARI has resulted in some increase in the extent of inundation between the dam operation scenarios as demonstrated in Figure 5-9.

STUART
CLUDEN
IDALIA
ANNANDALE
WEST END
RAILWAY ESTATE
OONOONBA
MURRAY
ROSSLEAMUNDINGBURRA
HERMIT PARKPIMLICO
SOUTH TOWNSVILLE
CURRAJONGHYDE PARK
GARBUTT
GULLIVER
MYSTERTON
TOWNSVILLE CITY
CASTLE HILL
WULGURU
AITKENVALE
LEGEND
Previous Operations
Revised Operations
FIGURE 5-8
SCALE: @1:25,000
0.25 00.125
KilometersA3
TOWNSVILLE CITY COUNCILROSS RIVER FLOOD STUDY
CHANGE IN GATE OPERATIONS100 YEAR ARI
© Townsville City Council 2012DIGITAL FILE: DRAWN BY: DATE:
Strategic Planning DepartmentPLANNING AND DEVELOPMENT
mxdWGB
13/06/2012
´

STUART
KIRWAN
MURRAY
MOUNT STUART
GARBUTT
DOUGLAS
SHAW
BOHLE
CLUDEN
GUMLOW
MOUNT LOUISA
ROSENEATH
CONDON
ANNANDALE
IDALIA
BURDELL
RASMUSSEN
MOUNT ST JOHN
COSGROVE
WEST END
WULGURU
SOUTH TOWNSVILLE
AITKENVALE
CRANBROOK
RAILWAY ESTATE
HEATLEY
OONOONBA
NORTH WARD
ROWES BAY
CASTLE HILL
GULLIVER
CURRAJONG
BOHLE PLAINS
ROSSLEAMUNDINGBURRA
HERMIT PARKVINCENT
TOWN COMMON
PIMLICO
TOWNSVILLE CITY
HYDE PARK
THURINGOWA CENTRAL
BELGIAN GARDENS
MYSTERTON
BROOKHILL
MOUNT LOW
LEGEND
Previous Operations
Revised Operations
FIGURE 5-9
SCALE: @1:50,000
0.6 00.3
KilometersA3
TOWNSVILLE CITY COUNCILROSS RIVER FLOOD STUDY
CHANGE IN GATE OPERATIONS1000 YEAR ARI
© Townsville City Council 2012DIGITAL FILE: DRAWN BY: DATE:
Strategic Planning DepartmentPLANNING AND DEVELOPMENT
mxdWGB
13/06/2012
´

ABN >> 44 741 992 072
76
Table 5-4 shows a comparison of the gate operations based on the number of downstream residential properties impacted. Because of containing overflows from Ross River in the 100 Year ARI flood, there is a reduction of 930 impacted properties. It is considered that this reduction in flood impacted properties at this relatively frequent flood offsets the increase of 530 impacted properties in the 1000 Year ARI. Table 5-4 Comparison of Impacted Properties for Revised Gate Operations
Number of Impacted Properties Design Flood
Previous Operations Revised Operations
2 Year ARI 0 0
5 Year ARI 0 0
10 Year ARI 0 0
20 Year ARI 27 27
50 Year ARI 85 28
100 Year ARI 960 90
200 Year ARI 1475 105
500 Year ARI 2150 2260
1000 Year ARI 2680 3210
2000 Year ARI 3645 4280
PMF 12890 13250
Existing Defined Flood Event Presently with Townsville City Council the 50 Year ARI is the Defined Flood Event (DFE). The modelling results show that for the DFE, riverine flooding from Ross River inundates existing residential properties within the suburbs of Railway Estate and Rosslea. The Townsville Golf Course is presently reviewing the potential for developing portions of the golf course as residential lots. There is significant inundation within the Golf Course area as a result of backwater from the river. The 50 Year ARI flood levels in the area are in the order of 4.3 m AHD. Any residential development here will need to ensure lots are above 4.3 m AHD and if filling is required to achieve these levels then compensatory floodplain storage will be needed. The former Department of Primary Industries (DPI) site, is also being investigated for residential development. In the 50 Year ARI flood event there is an area of backwater along an existing gully (A) and a significant overbank floodway in the eastern portion of the site (B) – refer to Figure 5-10. Filling within the floodway has potential to significantly impact on flood levels within Railway Estate and Rosslea, which are already impacted in the 50 Year ARI flood. Any residential development here will need to provide compensatory storage and provide appropriate works for conveying the flows through the eastern portion of the site, in conjunction with the appropriate cross drainage for any upgrade to Abbot Street.
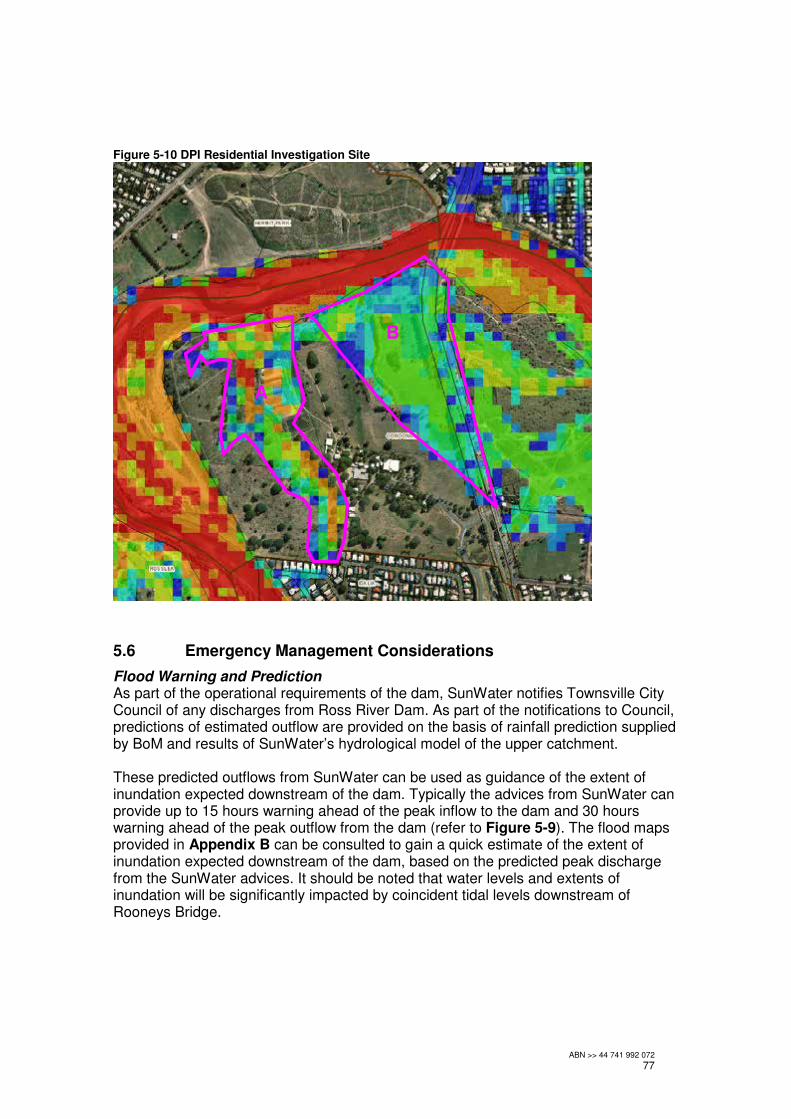
ABN >> 44 741 992 072
77
Figure 5-10 DPI Residential Investigation Site
5.6 Emergency Management Considerations
Flood Warning and Prediction As part of the operational requirements of the dam, SunWater notifies Townsville City Council of any discharges from Ross River Dam. As part of the notifications to Council, predictions of estimated outflow are provided on the basis of rainfall prediction supplied by BoM and results of SunWater’s hydrological model of the upper catchment. These predicted outflows from SunWater can be used as guidance of the extent of inundation expected downstream of the dam. Typically the advices from SunWater can provide up to 15 hours warning ahead of the peak inflow to the dam and 30 hours warning ahead of the peak outflow from the dam (refer to Figure 5-9). The flood maps provided in Appendix B can be consulted to gain a quick estimate of the extent of inundation expected downstream of the dam, based on the predicted peak discharge from the SunWater advices. It should be noted that water levels and extents of inundation will be significantly impacted by coincident tidal levels downstream of Rooneys Bridge.
A
B
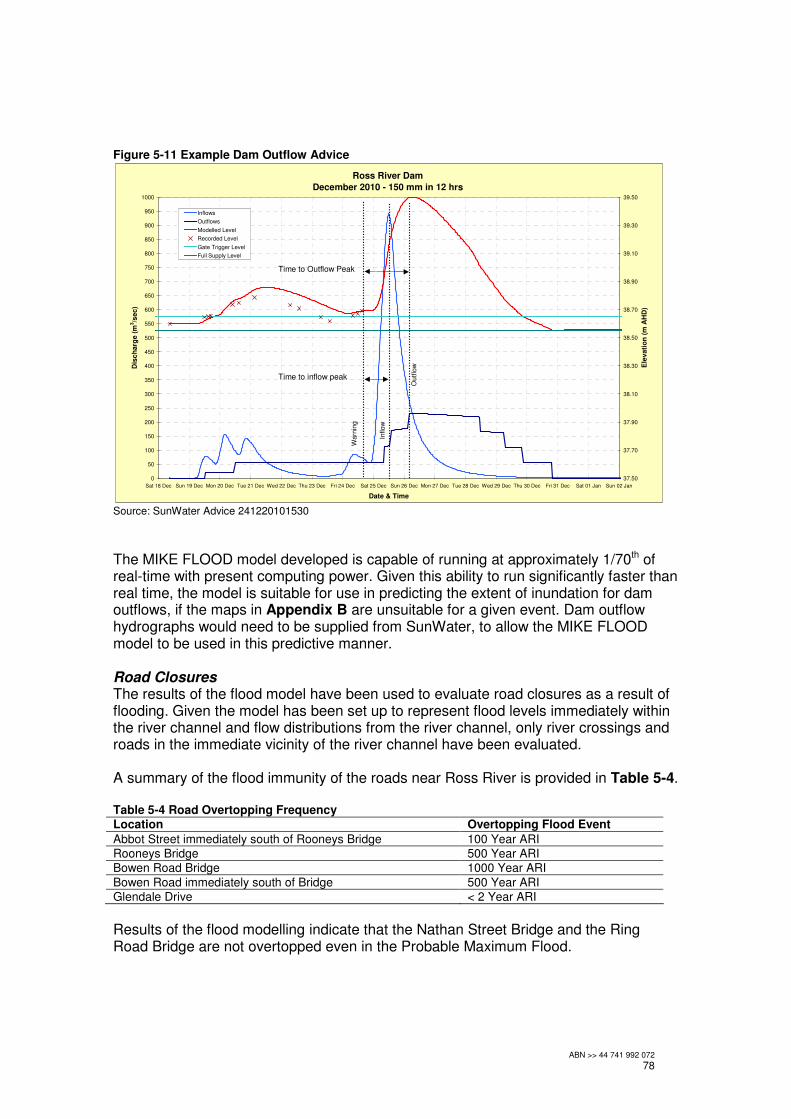
ABN >> 44 741 992 072
78
Figure 5-11 Example Dam Outflow Advice
Ross River Dam
December 2010 - 150 mm in 12 hrs
0
50
100
150
200
250
300
350
400
450
500
550
600
650
700
750
800
850
900
950
1000
Sat 18 Dec Sun 19 Dec Mon 20 Dec Tue 21 Dec Wed 22 Dec Thu 23 Dec Fri 24 Dec Sat 25 Dec Sun 26 Dec Mon 27 Dec Tue 28 Dec Wed 29 Dec Thu 30 Dec Fri 31 Dec Sat 01 Jan Sun 02 Jan
Date & Time
Dis
ch
arg
e (
m3/s
ec)
37.50
37.70
37.90
38.10
38.30
38.50
38.70
38.90
39.10
39.30
39.50
Ele
vati
on
(m
AH
D)
Inflows
Outflows
Modelled Level
Recorded Level
Gate Trigger Level
Full Supply Level
Source: SunWater Advice 241220101530
The MIKE FLOOD model developed is capable of running at approximately 1/70th of real-time with present computing power. Given this ability to run significantly faster than real time, the model is suitable for use in predicting the extent of inundation for dam outflows, if the maps in Appendix B are unsuitable for a given event. Dam outflow hydrographs would need to be supplied from SunWater, to allow the MIKE FLOOD model to be used in this predictive manner. Road Closures The results of the flood model have been used to evaluate road closures as a result of flooding. Given the model has been set up to represent flood levels immediately within the river channel and flow distributions from the river channel, only river crossings and roads in the immediate vicinity of the river channel have been evaluated. A summary of the flood immunity of the roads near Ross River is provided in Table 5-4. Table 5-4 Road Overtopping Frequency
Location Overtopping Flood Event
Abbot Street immediately south of Rooneys Bridge 100 Year ARI Rooneys Bridge 500 Year ARI Bowen Road Bridge 1000 Year ARI
Bowen Road immediately south of Bridge 500 Year ARI Glendale Drive < 2 Year ARI
Results of the flood modelling indicate that the Nathan Street Bridge and the Ring Road Bridge are not overtopped even in the Probable Maximum Flood.
Time to inflow peak
Time to Outflow Peak
Warn
ing
Inflow
Outf
low
ABN >> 44 741 992 072
79
Emergency Management Facilities Flood immunity of emergency management facilities is critical to their function during a flood. The results of the flood modelling have been used to review the flood immunity key sites including community recovery centres; evacuation centres, police, fire, ambulance, aged care and Council facilities. Table 5-5 shows a list of the key sites for emergency management that are potentially affected by flooding from Ross River. It should be noted that the flood depths presented are representative depths above the ground levels and are not necessarily indicative of inundation of buildings. Also these flood levels are based on Ross River flooding alone and do not include local catchment flows which may contribute to higher flood levels. The results indicate a total of 30 emergency management facilities that are impacted in the PMF. It should be noted that key response facilities such, fire, ambulance and, police are not impacted in under the 500 Year ARI flood. Some council parks depots are impacted by the 500 Year ARI flood.
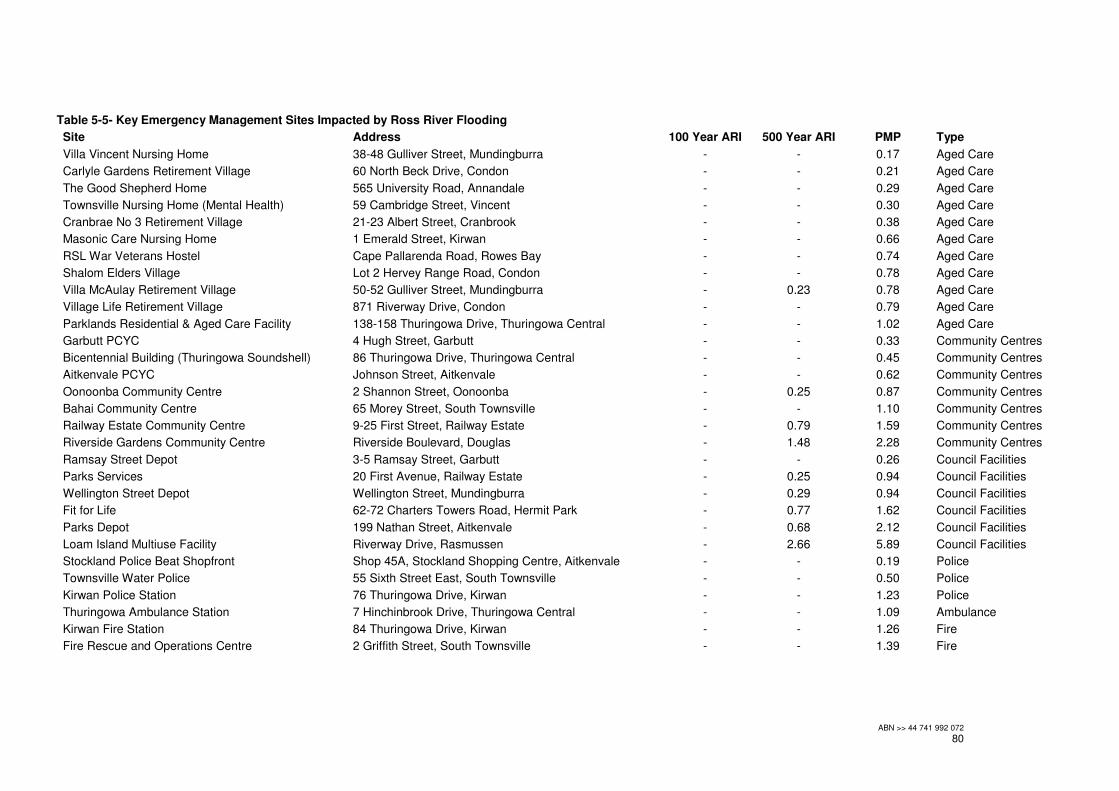
ABN >> 44 741 992 072
80
Table 5-5- Key Emergency Management Sites Impacted by Ross River Flooding
Site Address 100 Year ARI 500 Year ARI PMP Type
Villa Vincent Nursing Home 38-48 Gulliver Street, Mundingburra - - 0.17 Aged Care
Carlyle Gardens Retirement Village 60 North Beck Drive, Condon - - 0.21 Aged Care
The Good Shepherd Home 565 University Road, Annandale - - 0.29 Aged Care
Townsville Nursing Home (Mental Health) 59 Cambridge Street, Vincent - - 0.30 Aged Care
Cranbrae No 3 Retirement Village 21-23 Albert Street, Cranbrook - - 0.38 Aged Care
Masonic Care Nursing Home 1 Emerald Street, Kirwan - - 0.66 Aged Care
RSL War Veterans Hostel Cape Pallarenda Road, Rowes Bay - - 0.74 Aged Care
Shalom Elders Village Lot 2 Hervey Range Road, Condon - - 0.78 Aged Care
Villa McAulay Retirement Village 50-52 Gulliver Street, Mundingburra - 0.23 0.78 Aged Care
Village Life Retirement Village 871 Riverway Drive, Condon - - 0.79 Aged Care
Parklands Residential & Aged Care Facility 138-158 Thuringowa Drive, Thuringowa Central - - 1.02 Aged Care
Garbutt PCYC 4 Hugh Street, Garbutt - - 0.33 Community Centres
Bicentennial Building (Thuringowa Soundshell) 86 Thuringowa Drive, Thuringowa Central - - 0.45 Community Centres
Aitkenvale PCYC Johnson Street, Aitkenvale - - 0.62 Community Centres
Oonoonba Community Centre 2 Shannon Street, Oonoonba - 0.25 0.87 Community Centres
Bahai Community Centre 65 Morey Street, South Townsville - - 1.10 Community Centres
Railway Estate Community Centre 9-25 First Street, Railway Estate - 0.79 1.59 Community Centres
Riverside Gardens Community Centre Riverside Boulevard, Douglas - 1.48 2.28 Community Centres
Ramsay Street Depot 3-5 Ramsay Street, Garbutt - - 0.26 Council Facilities
Parks Services 20 First Avenue, Railway Estate - 0.25 0.94 Council Facilities
Wellington Street Depot Wellington Street, Mundingburra - 0.29 0.94 Council Facilities
Fit for Life 62-72 Charters Towers Road, Hermit Park - 0.77 1.62 Council Facilities
Parks Depot 199 Nathan Street, Aitkenvale - 0.68 2.12 Council Facilities
Loam Island Multiuse Facility Riverway Drive, Rasmussen - 2.66 5.89 Council Facilities
Stockland Police Beat Shopfront Shop 45A, Stockland Shopping Centre, Aitkenvale - - 0.19 Police
Townsville Water Police 55 Sixth Street East, South Townsville - - 0.50 Police
Kirwan Police Station 76 Thuringowa Drive, Kirwan - - 1.23 Police
Thuringowa Ambulance Station 7 Hinchinbrook Drive, Thuringowa Central - - 1.09 Ambulance
Kirwan Fire Station 84 Thuringowa Drive, Kirwan - - 1.26 Fire
Fire Rescue and Operations Centre 2 Griffith Street, South Townsville - - 1.39 Fire

ABN >> 44 741 992 072
81
5.7 Tailwater Conditions
As indicated in Section 4.3, the MIKE FLOOD hydraulic model has represented design floods with a fixed tailwater condition at the MHWS tidal level (1.254 m AHD). This is considered somewhat conservative as most storm duration evaluated were 72 hours or greater and there would be several semi-diurnal tidal cycles over this period. There has also been an evaluation of adopting the Highest Astronomical Tide (HAT) level (2.25 m AHD) as the tailwater condition for the model. The 50 Year ARI and 100 Year ARI floods were both run with a tailwater condition equal to HAT. It should be noted that combining HAT with a design flood of a given frequency does not maintain the exceedance probability of the flood. Accordingly HAT in combination with a 50 Year ARI flood, should have a lower frequency (higher ARI). This issue of joint probability with respect to flooding and coastal processes is the subject of review of the forthcoming revision of Australian Rainfall and Runoff, due in 2014. Figure 5-12 and 5-13 show changes in flood levels for the 50 and 100 Year ARI floods as a result of the HAT tailwater condition. For the 50 Year ARI, the results show increases in flood levels from Aplins Weir downstream, with the greatest increase in levels downstream of the Rooneys Bridge. The increase in tailwater level does not inundate any additional properties within Railway Estate, South Townsville and Oonoonba. For the 100 Year ARI, the results show increases in flood levels from Aplins Weir downstream, with increases over 100 mm downstream of Rooneys Bridge. The increase in tailwater level results in increases in flood levels of up to 500 mm in the northern part of Railway Estate adjacent to Goondi Creek.. The increases in flood level results in an additional 77 lots inundated within Railway Estate, South Townsville and Oonoonba.
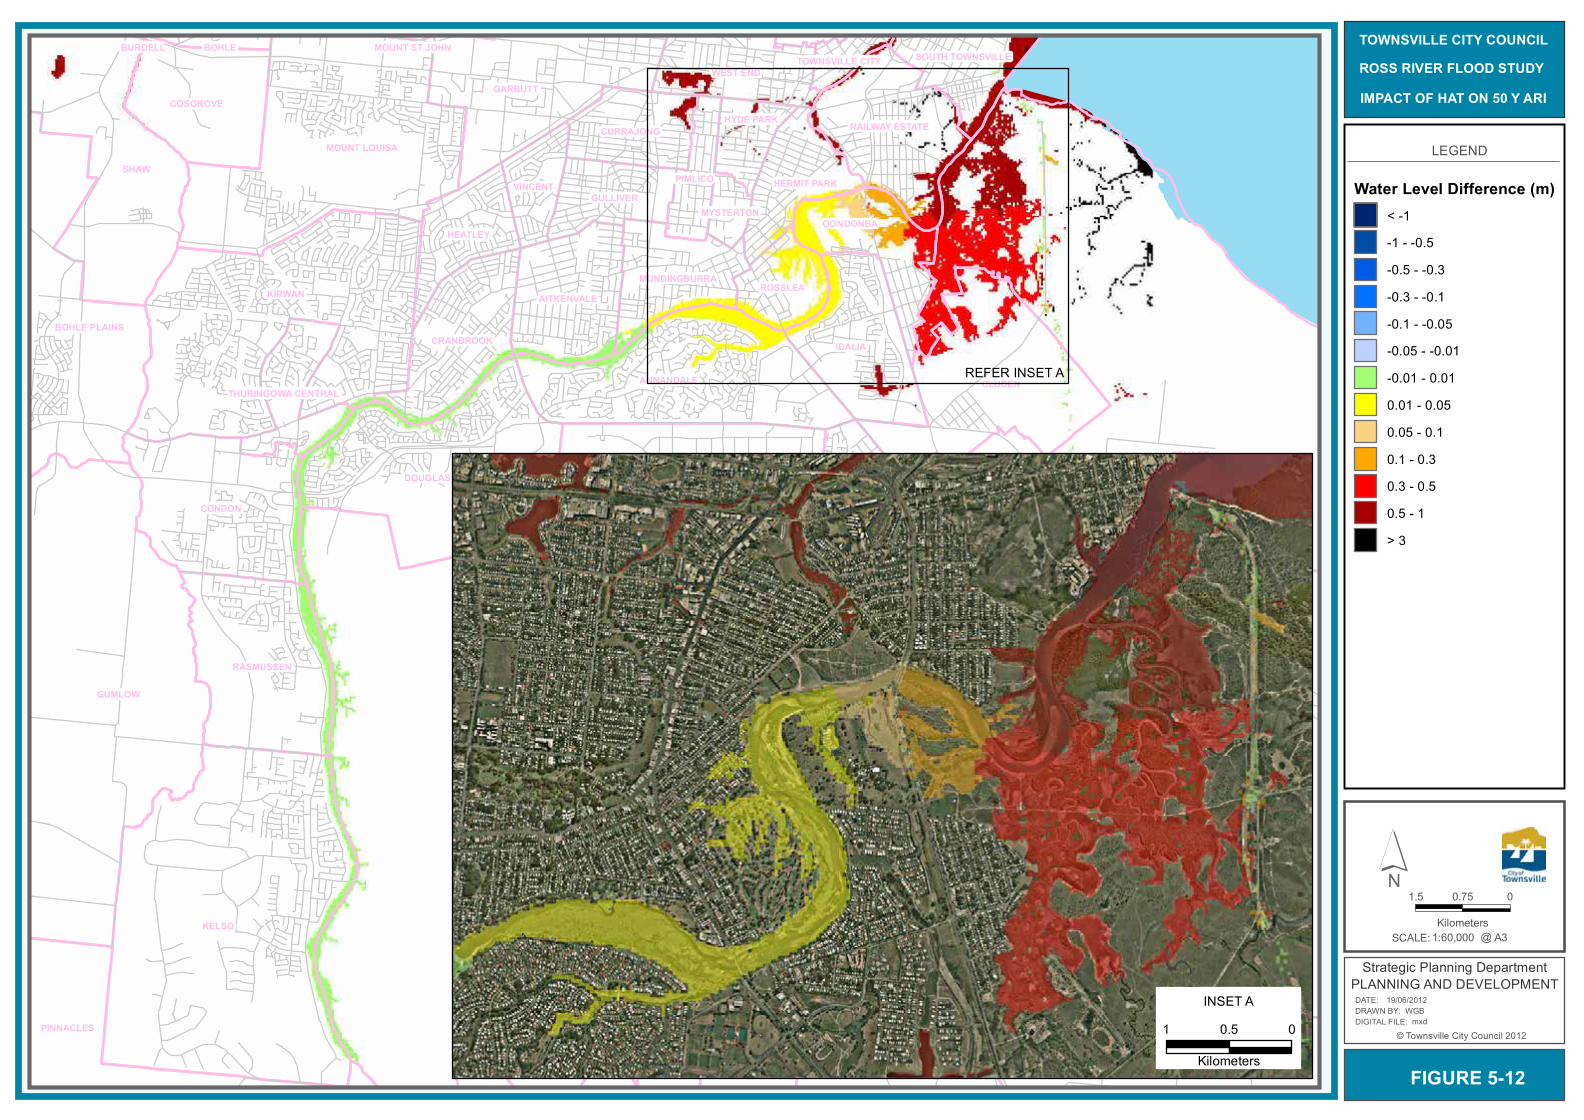
STUART
MOUNT STUART
KELSO
GUMLOW
BROOKHILL
MURRAY
KIRWAN
JULAGO
SHAW
DOUGLAS
ROSENEATH
OAK VALLEY
CLUDEN
MOUNT LOUISA
CONDON
ANNANDALE
GARBUTT
IDALIABOHLE PLAINS
RASMUSSEN
COSGROVE
PINNACLES
WULGURU
AITKENVALE
CRANBROOK
RAILWAY ESTATE
WEST END
HEATLEYOONOONBA
GULLIVER
CURRAJONG
ROSSLEAMUNDINGBURRA
HERMIT PARKVINCENT
HYDE PARK
SOUTH TOWNSVILLE
PIMLICO
THURINGOWA CENTRAL
ROSS RIVER
MYSTERTON
BOHLETOWNSVILLE CITY
MOUNT ST JOHNBURDELL
LEGEND
Water Level Difference (m)< -1-1 - -0.5-0.5 - -0.3-0.3 - -0.1-0.1 - -0.05-0.05 - -0.01-0.01 - 0.010.01 - 0.050.05 - 0.10.1 - 0.30.3 - 0.50.5 - 1> 3
FIGURE 5-12
SCALE: @1:60,000
1.5 00.75
KilometersA3
TOWNSVILLE CITY COUNCILROSS RIVER FLOOD STUDYIMPACT OF HAT ON 50 Y ARI
© Townsville City Council 2012DIGITAL FILE: DRAWN BY: DATE:
Strategic Planning DepartmentPLANNING AND DEVELOPMENT
mxdWGB
19/06/2012
´
INSET A1 00.5
Kilometers
REFER INSET A
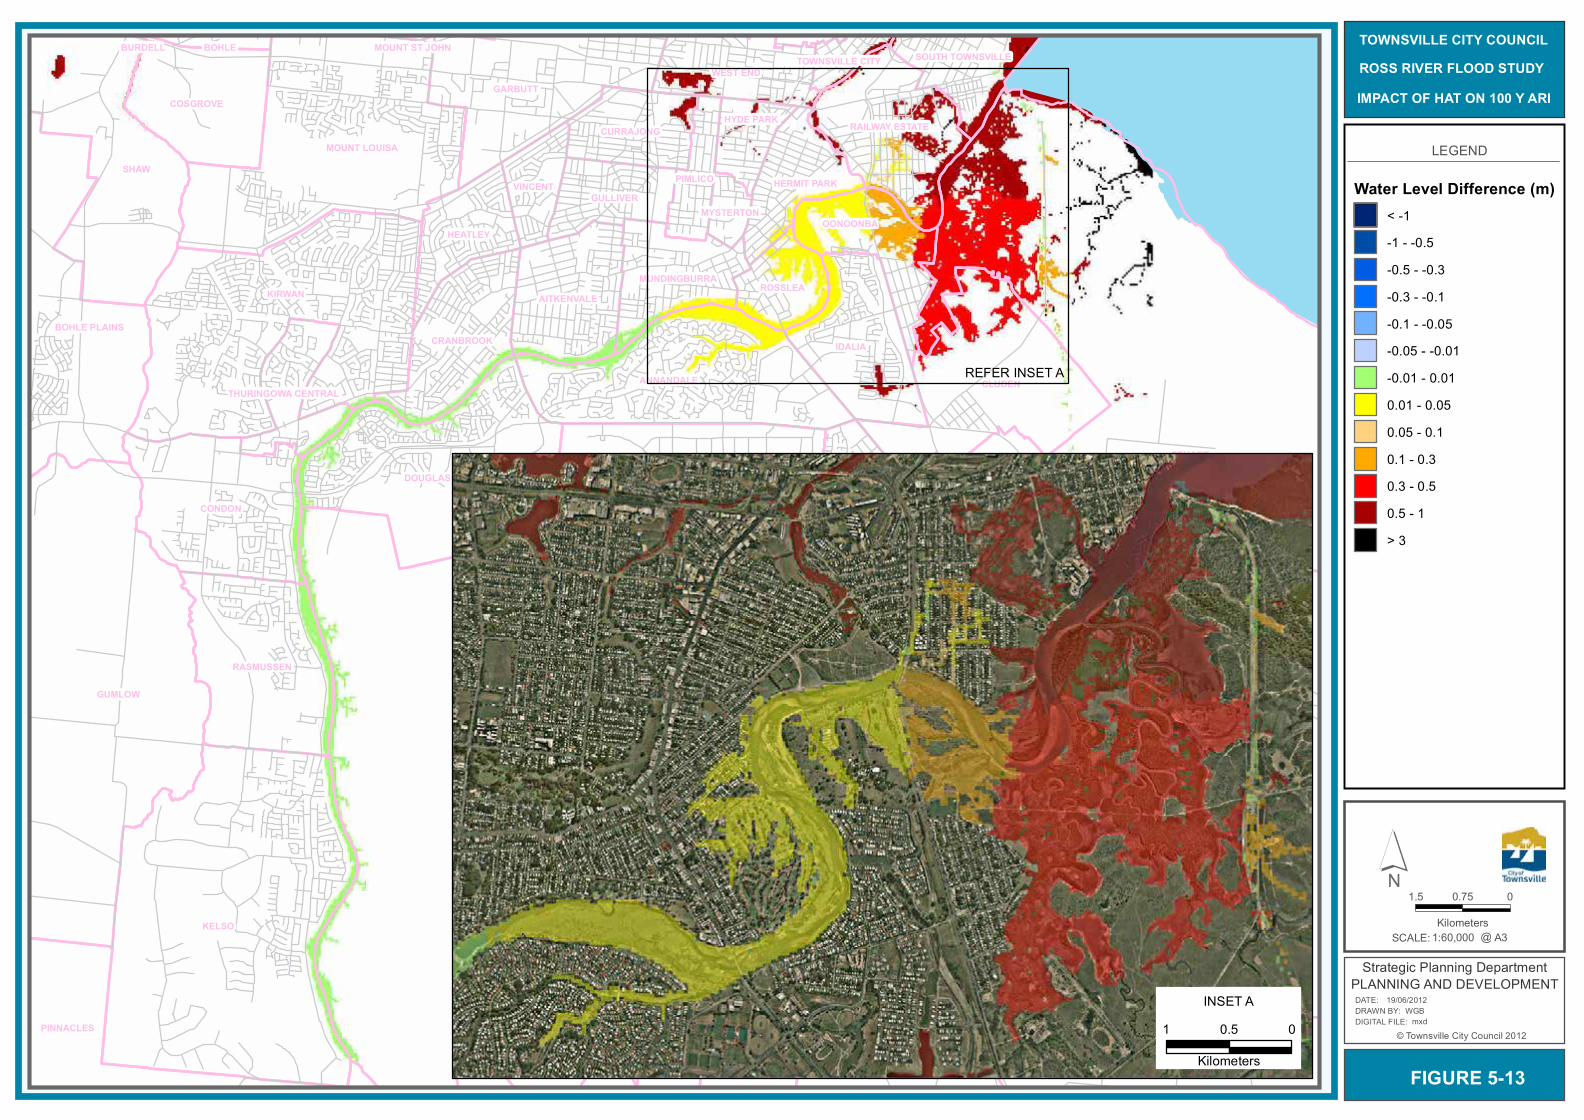
STUART
MOUNT STUART
KELSO
GUMLOW
BROOKHILL
MURRAY
KIRWAN
JULAGO
SHAW
DOUGLAS
ROSENEATH
OAK VALLEY
CLUDEN
MOUNT LOUISA
CONDON
ANNANDALE
GARBUTT
IDALIABOHLE PLAINS
RASMUSSEN
COSGROVE
PINNACLES
WULGURU
AITKENVALE
CRANBROOK
RAILWAY ESTATE
WEST END
HEATLEYOONOONBA
GULLIVER
CURRAJONG
ROSSLEAMUNDINGBURRA
HERMIT PARKVINCENT
HYDE PARK
SOUTH TOWNSVILLE
PIMLICO
THURINGOWA CENTRAL
ROSS RIVER
MYSTERTON
BOHLETOWNSVILLE CITY
MOUNT ST JOHNBURDELL
LEGEND
Water Level Difference (m)< -1-1 - -0.5-0.5 - -0.3-0.3 - -0.1-0.1 - -0.05-0.05 - -0.01-0.01 - 0.010.01 - 0.050.05 - 0.10.1 - 0.30.3 - 0.50.5 - 1> 3
FIGURE 5-13
SCALE: @1:60,000
1.5 00.75
KilometersA3
TOWNSVILLE CITY COUNCILROSS RIVER FLOOD STUDYIMPACT OF HAT ON 100 Y ARI
© Townsville City Council 2012DIGITAL FILE: DRAWN BY: DATE:
Strategic Planning DepartmentPLANNING AND DEVELOPMENT
mxdWGB
19/06/2012
´
INSET A1 00.5
Kilometers
REFER INSET A

ABN >> 44 741 992 072
84
6.0 Impact of Climate Change on Flooding
An evaluation of the potential impact on flooding of climate change has been undertaken. The two primary mechanisms where climate change could impact on Ross River flooding are sea level rise and changes in extreme rainfall intensities. Accordingly two scenarios have been assessed for evaluating the impacts of climate change on flooding:
• the impact of sea-level rise alone; and
• the impact of sea-level rise and changes in extreme rainfall intensities. While there is considerable consensus on the likelihood of sea-level rise resulting from climate change, the impacts on extreme rainfall is more contentious. The former Queensland Department of Environment and Resource Management (DERM) has released some interim guidance on the changes in extreme rainfall. Details of the two climate change scenarios are provided below.
6.1 Sea Level Rise
To assess the potential impact of sea-level rise on Ross River flooding, the tailwater level of MIKE FLOOD model was updated to include the sea level rise value. The sea-level rise specified within the Queensland Coastal Plan of 0.88 m to allow for conditions in 2100 was adopted. This value is consistent with advice from the IPCC Fourth Assessment Report: Climate Change (2007) and within the range of projections within Climate Change Projections for the Townsville Region (Hennessy et al, 2008). Both the 50 Year ARI and 100 Year ARI floods were evaluated with the sea level rise Tailwater condition. The 0.88 m sea level rise was applied to the Mean High Water Springs (MHWS) tide level resulting in a tailwater condition of 2.134 m AHD. Figures 6-1 and 6-2 show the changes in flood levels for the 50 Year ARI and 100 Year ARI floods respectively. For the 50 Year ARI, the results show increases in flood levels of greater than 90 mm downstream of Rooneys Bridge and up to 500 mm adjacent to South Townsville. Upstream of Rooneys Bridge, increases of up to 50 mm are washed by the western end of Bicentennial Park. The increase in tailwater level has no significant change in inundation for residential areas within Railway Estate and South Townsville. For the 100 Year ARI, the results show increases in flood levels of greater than 50 mm downstream of Rooneys Bridge. The overflow into Railway Estate is still the only overflow as a result of the increased tailwater level. The increase in tailwater level results an additional 35 residential properties inundated within Railway Estate and South Townsville.

STUART
MOUNT STUART
KELSO
GUMLOW
BROOKHILL
MURRAY
KIRWAN
JULAGO
SHAW
DOUGLAS
ROSENEATH
OAK VALLEY
CLUDEN
MOUNT LOUISA
CONDON
ANNANDALE
GARBUTT
IDALIABOHLE PLAINS
RASMUSSEN
COSGROVE
PINNACLES
WULGURU
AITKENVALE
CRANBROOK
RAILWAY ESTATE
WEST END
HEATLEYOONOONBA
GULLIVER
CURRAJONG
ROSSLEAMUNDINGBURRA
HERMIT PARKVINCENT
HYDE PARK
SOUTH TOWNSVILLE
PIMLICO
THURINGOWA CENTRAL
ROSS RIVER
MYSTERTON
BOHLETOWNSVILLE CITY
MOUNT ST JOHNBURDELL
LEGEND
Water Level Difference (m)< -1-1 - -0.5-0.5 - -0.3-0.3 - -0.1-0.1 - -0.05-0.05 - -0.01-0.01 - 0.010.01 - 0.050.05 - 0.10.1 - 0.30.3 - 0.50.5 - 1> 3
FIGURE 6-1
SCALE: @1:60,000
2 01
KilometersA3
TOWNSVILLE CITY COUNCILROSS RIVER FLOOD STUDYIMPACT OF SEA LEVEL RISE
TO 2100 ON 50 Y ARI
© Townsville City Council 2012DIGITAL FILE: DRAWN BY: DATE:
Strategic Planning DepartmentPLANNING AND DEVELOPMENT
mxdWGB
19/06/2012
´
INSET A1 00.5
Kilometers
REFER INSET A
0.88 m Sea Level Rise
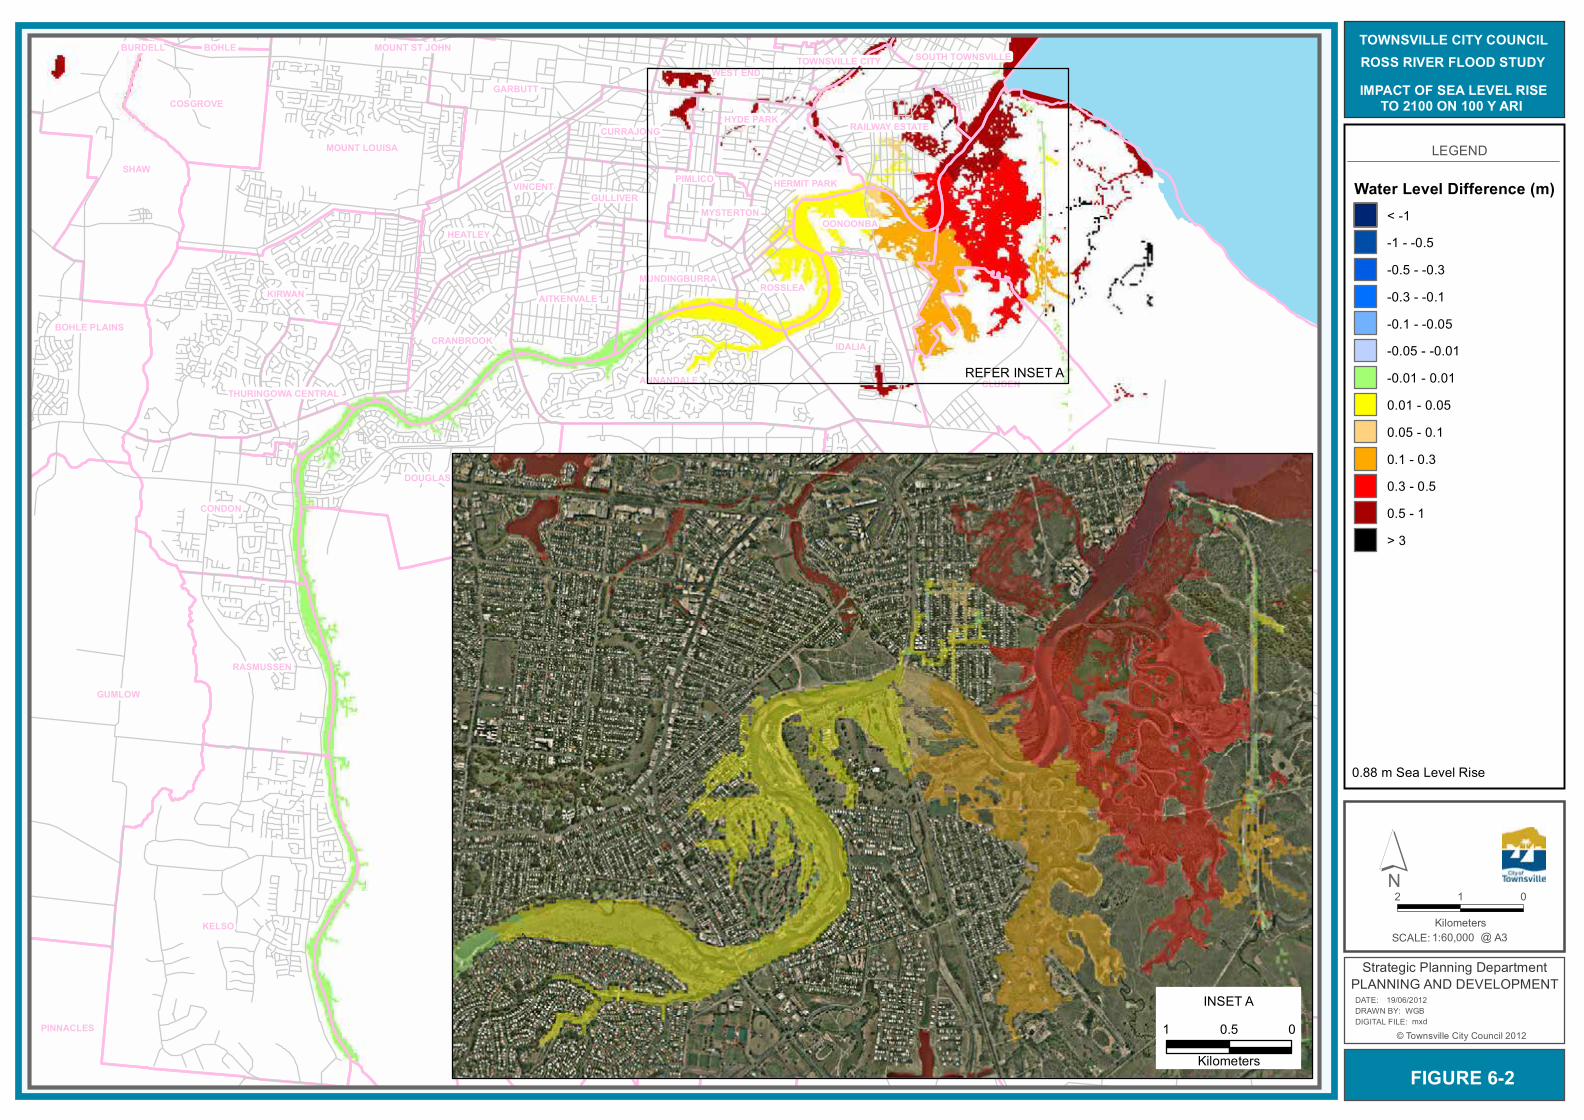
STUART
MOUNT STUART
KELSO
GUMLOW
BROOKHILL
MURRAY
KIRWAN
JULAGO
SHAW
DOUGLAS
ROSENEATH
OAK VALLEY
CLUDEN
MOUNT LOUISA
CONDON
ANNANDALE
GARBUTT
IDALIABOHLE PLAINS
RASMUSSEN
COSGROVE
PINNACLES
WULGURU
AITKENVALE
CRANBROOK
RAILWAY ESTATE
WEST END
HEATLEYOONOONBA
GULLIVER
CURRAJONG
ROSSLEAMUNDINGBURRA
HERMIT PARKVINCENT
HYDE PARK
SOUTH TOWNSVILLE
PIMLICO
THURINGOWA CENTRAL
ROSS RIVER
MYSTERTON
BOHLETOWNSVILLE CITY
MOUNT ST JOHNBURDELL
LEGEND
Water Level Difference (m)< -1-1 - -0.5-0.5 - -0.3-0.3 - -0.1-0.1 - -0.05-0.05 - -0.01-0.01 - 0.010.01 - 0.050.05 - 0.10.1 - 0.30.3 - 0.50.5 - 1> 3
FIGURE 6-2
SCALE: @1:60,000
2 01
KilometersA3
TOWNSVILLE CITY COUNCILROSS RIVER FLOOD STUDYIMPACT OF SEA LEVEL RISE
TO 2100 ON 100 Y ARI
© Townsville City Council 2012DIGITAL FILE: DRAWN BY: DATE:
Strategic Planning DepartmentPLANNING AND DEVELOPMENT
mxdWGB
19/06/2012
´
INSET A1 00.5
Kilometers
REFER INSET A
0.88 m Sea Level Rise
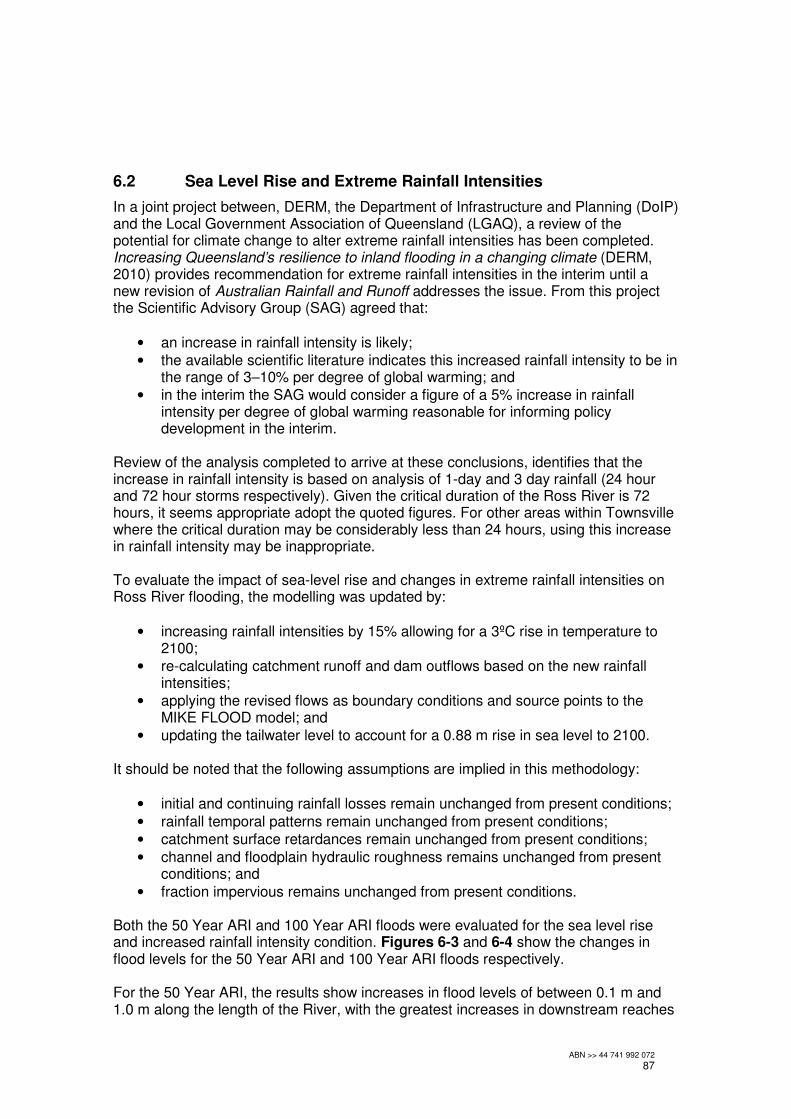
ABN >> 44 741 992 072
87
6.2 Sea Level Rise and Extreme Rainfall Intensities
In a joint project between, DERM, the Department of Infrastructure and Planning (DoIP) and the Local Government Association of Queensland (LGAQ), a review of the potential for climate change to alter extreme rainfall intensities has been completed. Increasing Queensland’s resilience to inland flooding in a changing climate (DERM, 2010) provides recommendation for extreme rainfall intensities in the interim until a new revision of Australian Rainfall and Runoff addresses the issue. From this project the Scientific Advisory Group (SAG) agreed that:
• an increase in rainfall intensity is likely;
• the available scientific literature indicates this increased rainfall intensity to be in the range of 3–10% per degree of global warming; and
• in the interim the SAG would consider a figure of a 5% increase in rainfall intensity per degree of global warming reasonable for informing policy development in the interim.
Review of the analysis completed to arrive at these conclusions, identifies that the increase in rainfall intensity is based on analysis of 1-day and 3 day rainfall (24 hour and 72 hour storms respectively). Given the critical duration of the Ross River is 72 hours, it seems appropriate adopt the quoted figures. For other areas within Townsville where the critical duration may be considerably less than 24 hours, using this increase in rainfall intensity may be inappropriate. To evaluate the impact of sea-level rise and changes in extreme rainfall intensities on Ross River flooding, the modelling was updated by:
• increasing rainfall intensities by 15% allowing for a 3ºC rise in temperature to 2100;
• re-calculating catchment runoff and dam outflows based on the new rainfall intensities;
• applying the revised flows as boundary conditions and source points to the MIKE FLOOD model; and
• updating the tailwater level to account for a 0.88 m rise in sea level to 2100. It should be noted that the following assumptions are implied in this methodology:
• initial and continuing rainfall losses remain unchanged from present conditions;
• rainfall temporal patterns remain unchanged from present conditions;
• catchment surface retardances remain unchanged from present conditions;
• channel and floodplain hydraulic roughness remains unchanged from present conditions; and
• fraction impervious remains unchanged from present conditions. Both the 50 Year ARI and 100 Year ARI floods were evaluated for the sea level rise and increased rainfall intensity condition. Figures 6-3 and 6-4 show the changes in flood levels for the 50 Year ARI and 100 Year ARI floods respectively. For the 50 Year ARI, the results show increases in flood levels of between 0.1 m and 1.0 m along the length of the River, with the greatest increases in downstream reaches
ABN >> 44 741 992 072
88
of the river around the mouth. Additionally the increase in flow causes Railway Estate overflow which do not occur in the existing 50 Year ARI. The increase in tailwater level and rainfall intensities for the 50 Year ARI flood, results an additional 122 residential properties inundated within Railway Estate and South Townsville. For the 100 Year ARI, the results show increases in flood levels of between 0.3 m and 0.5 m upstream of the Nathan Street bridge. Between the Nathan Street bridge and Rooneys bridge flood levels range from 0.3 m to 0.01 m. Downstream of Rooneys Bridge flood levels are up to 0.8 m higher adjacent to South Townsville. An additional overflow from Ross River though the Fairfield Waters lakes system has formed. The increase in tailwater level and rainfall intensities for the 100 Year ARI flood, results an additional 123 residential properties inundated within Railway Estate, South Townsville, Oonoonba, Hermit Park, and Fairfield Waters.
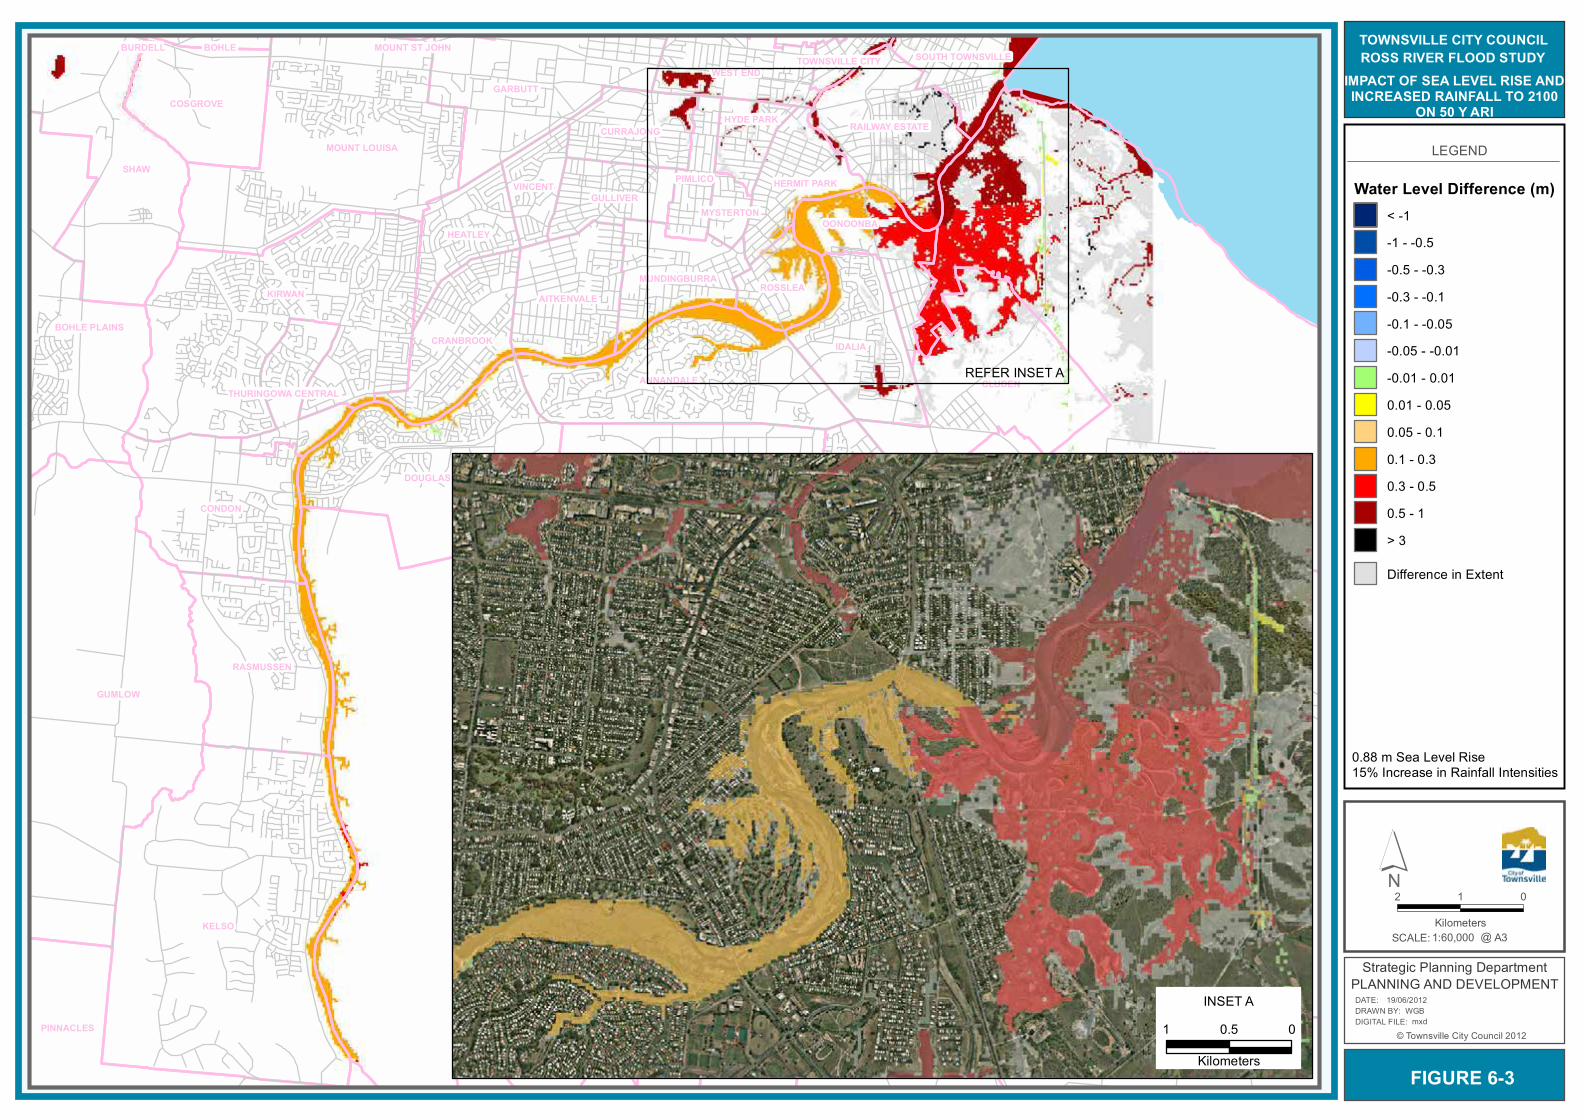
STUART
MOUNT STUART
KELSO
GUMLOW
BROOKHILL
MURRAY
KIRWAN
JULAGO
SHAW
DOUGLAS
ROSENEATH
OAK VALLEY
CLUDEN
MOUNT LOUISA
CONDON
ANNANDALE
GARBUTT
IDALIABOHLE PLAINS
RASMUSSEN
COSGROVE
PINNACLES
WULGURU
AITKENVALE
CRANBROOK
RAILWAY ESTATE
WEST END
HEATLEYOONOONBA
GULLIVER
CURRAJONG
ROSSLEAMUNDINGBURRA
HERMIT PARKVINCENT
HYDE PARK
SOUTH TOWNSVILLE
PIMLICO
THURINGOWA CENTRAL
ROSS RIVER
MYSTERTON
BOHLETOWNSVILLE CITY
MOUNT ST JOHNBURDELL
LEGEND
Water Level Difference (m)< -1-1 - -0.5-0.5 - -0.3-0.3 - -0.1-0.1 - -0.05-0.05 - -0.01-0.01 - 0.010.01 - 0.050.05 - 0.10.1 - 0.30.3 - 0.50.5 - 1> 3
Difference in Extent
FIGURE 6-3
SCALE: @1:60,000
2 01
KilometersA3
TOWNSVILLE CITY COUNCILROSS RIVER FLOOD STUDY
IMPACT OF SEA LEVEL RISE AND INCREASED RAINFALL TO 2100
ON 50 Y ARI
© Townsville City Council 2012DIGITAL FILE: DRAWN BY: DATE:
Strategic Planning DepartmentPLANNING AND DEVELOPMENT
mxdWGB
19/06/2012
´
INSET A1 00.5
Kilometers
REFER INSET A
0.88 m Sea Level Rise 15% Increase in Rainfall Intensities

STUART
MOUNT STUART
KELSO
GUMLOW
BROOKHILL
MURRAY
KIRWAN
JULAGO
SHAW
DOUGLAS
ROSENEATH
OAK VALLEY
CLUDEN
MOUNT LOUISA
CONDON
ANNANDALE
GARBUTT
IDALIABOHLE PLAINS
RASMUSSEN
COSGROVE
PINNACLES
WULGURU
AITKENVALE
CRANBROOK
RAILWAY ESTATE
WEST END
HEATLEYOONOONBA
GULLIVER
CURRAJONG
ROSSLEAMUNDINGBURRA
HERMIT PARKVINCENT
HYDE PARK
SOUTH TOWNSVILLE
PIMLICO
THURINGOWA CENTRAL
ROSS RIVER
MYSTERTON
BOHLETOWNSVILLE CITY
MOUNT ST JOHNBURDELL
LEGEND
Water Level Difference (m)< -1-1 - -0.5-0.5 - -0.3-0.3 - -0.1-0.1 - -0.05-0.05 - -0.01-0.01 - 0.010.01 - 0.050.05 - 0.10.1 - 0.30.3 - 0.50.5 - 1> 3
Difference in Extent
FIGURE 6-4
SCALE: @1:60,000
2 01
KilometersA3
TOWNSVILLE CITY COUNCILROSS RIVER FLOOD STUDY
IMPACT OF SEA LEVEL RISE AND INCREASED RAINFALL TO 2100
ON 100 Y ARI
© Townsville City Council 2012DIGITAL FILE: DRAWN BY: DATE:
Strategic Planning DepartmentPLANNING AND DEVELOPMENT
mxdWGB
19/06/2012
´
INSET A1 00.5
Kilometers
REFER INSET A
0.88 m Sea Level Rise 15% Increase in Rainfall Intensities

ABN >> 44 741 992 072
91
7.0 Summary and Conclusions
The Ross River Flood Study – Baseline Flooding Assessment is an initial component of the City Wide Flood Constraints project being completed by Townsville City Council. This study has developed hydrological and hydraulic models for quantifying the flood risk associated with Ross River riverine flooding and will be used to inform finer-scale modelling of the urban areas of Townsville in subsequent stages of the project. The analyses undertaken for the project builds on previous hydrological and hydraulic studies undertaken as part of the Ross River Dam upgrade and Townsville Flood Hazard Assessment Study. The hydrological analysis completed for the project has quantified catchment runoff from all sub-catchments contributing to Ross River downstream of Ross River Dam, including:
• Ross River Upstream of the dam, including the dam storage effects;
• local sub-catchments to the west of Mount Stuart;
• sub-catchments through Douglas and Annandale;
• local sub-catchments within Cranbrook;
• local sub-catchments within Rosslea and Mundingburra;
• Gordon Creek;
• Stuart Creek; and
• local sub-catchments within Railway Estate and South Townsville. Both the hydrologic models and MIKE FLOOD hydraulic model have been calibrated to the December 2010, January 2009 and February 2007 events. The design storm frequencies assessed were the:
• 2 Year ARI;
• 5 Year ARI;
• 10 Year ARI;
• 20 Year ARI;
• 50 Year ARI;
• 100 Year ARI;
• 200 Year ARI;
• 500 Year ARI;
• 1000 Year ARI;
• 2000 Year ARI; and
• Probable Maximum Flood. The modelling has been used to:
• determine floodplain hydraulic mechanisms;
• assess approximate numbers of residential properties impacted by Ross River flooding;
• quantify overflows from the main river channel for given frequency floods;
• categorise hazard zones within the floodplain;
• review floodplain planning considerations including a review of Ross River Dam gate operations;
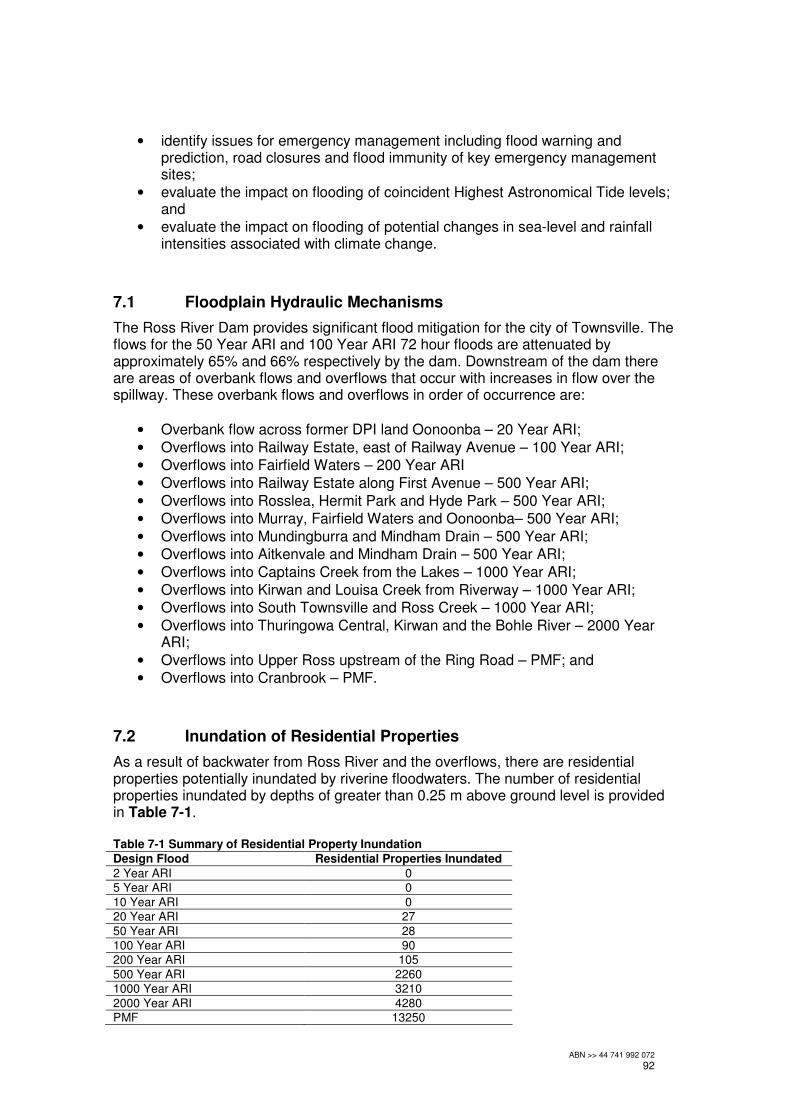
ABN >> 44 741 992 072
92
• identify issues for emergency management including flood warning and prediction, road closures and flood immunity of key emergency management sites;
• evaluate the impact on flooding of coincident Highest Astronomical Tide levels; and
• evaluate the impact on flooding of potential changes in sea-level and rainfall intensities associated with climate change.
7.1 Floodplain Hydraulic Mechanisms
The Ross River Dam provides significant flood mitigation for the city of Townsville. The flows for the 50 Year ARI and 100 Year ARI 72 hour floods are attenuated by approximately 65% and 66% respectively by the dam. Downstream of the dam there are areas of overbank flows and overflows that occur with increases in flow over the spillway. These overbank flows and overflows in order of occurrence are:
• Overbank flow across former DPI land Oonoonba – 20 Year ARI;
• Overflows into Railway Estate, east of Railway Avenue – 100 Year ARI;
• Overflows into Fairfield Waters – 200 Year ARI
• Overflows into Railway Estate along First Avenue – 500 Year ARI;
• Overflows into Rosslea, Hermit Park and Hyde Park – 500 Year ARI;
• Overflows into Murray, Fairfield Waters and Oonoonba– 500 Year ARI;
• Overflows into Mundingburra and Mindham Drain – 500 Year ARI;
• Overflows into Aitkenvale and Mindham Drain – 500 Year ARI;
• Overflows into Captains Creek from the Lakes – 1000 Year ARI;
• Overflows into Kirwan and Louisa Creek from Riverway – 1000 Year ARI;
• Overflows into South Townsville and Ross Creek – 1000 Year ARI;
• Overflows into Thuringowa Central, Kirwan and the Bohle River – 2000 Year ARI;
• Overflows into Upper Ross upstream of the Ring Road – PMF; and
• Overflows into Cranbrook – PMF.
7.2 Inundation of Residential Properties
As a result of backwater from Ross River and the overflows, there are residential properties potentially inundated by riverine floodwaters. The number of residential properties inundated by depths of greater than 0.25 m above ground level is provided in Table 7-1. Table 7-1 Summary of Residential Property Inundation
Design Flood Residential Properties Inundated
2 Year ARI 0 5 Year ARI 0
10 Year ARI 0
20 Year ARI 27
50 Year ARI 28 100 Year ARI 90 200 Year ARI 105
500 Year ARI 2260
1000 Year ARI 3210
2000 Year ARI 4280 PMF 13250
ABN >> 44 741 992 072
93
7.3 Floodplain Hazard
Floodplain hazard has been characterised based on the function of velocity-depth product outlined in Floodplain Management in Australia: Best practices and principles (CSIRO, 2000). The floodplain hazard was evaluated for the 100 Year ARI, 500 Year ARI and PMF events. The hazard mapping indicates that:
• A majority of the residential properties inundated in the 100 Year ARI are characterised by Low and Medium hazard (58% and 33% respectively);
• A majority of the residential properties inundated in the 500 Year ARI are characterised by Low and Medium hazard (32% and 46% respectively);
• A majority of the residential properties inundated in the PMF area characterised as Medium and High hazard (30% and 45% respectively) with almost as many properties in Extreme hazard areas as Low hazard areas.
7.4 Floodplain Planning
The Ross River flood model developed for the project has been used to undertake an assessment of the changes to downstream flooding as a result of changes to the Ross River Dam gate operations. The change in dam gate operations has resulted in reductions in dam outflows for smaller events up to the 200 Year ARI, with some increases in dam outflows for events greater than 500 Year ARI. The increase in flows is greatest for the 1000 Year ARI and is progressively less for the larger flood events. Additionally a review was undertaken of the flooding constraints on two sites with residential development immediately adjacent to the River. The Townsville Golf Course was shown to be an existing backwater / floodplain storage area within the lower reaches of Ross River in the existing Defined Flood Event. The former Department of Primary Industries (DPI) site in Oonoonba contains both an area of backwater along an existing gully and a significant overbank floodway in the existing Defined Flood Event. Retaining these floodplain hydraulic functions within any proposed development will be key to ensuring there are no impacts on flooding of existing residential areas.
7.5 Emergency Management
The results of the flood modelling and the flood model itself provide a useful tool for estimating inundation downstream of Ross River Dam. Given the warning times available and the fast runtimes of the model, the model serves as a tool that can be used for informing dam operations prior to predicted rainfall events. Examination of the flood immunity of road crossings over the Ross River identified that the Nathan Street Bridge and Ring Road Bridge remain open to traffic in all flood events up to the PMF. The Abbot Street Bridge and Bowen Road Bridge are closed in the 100 Year and 1000 Year ARI floods respectively. These flood immunities should be used to identify evacuation strategies. A review of water depths above ground levels at Key Sites for emergency management has identified:
• a total of 30 key sites may be inundated in the PMF;
ABN >> 44 741 992 072
94
• no key response centres (Police, Fire, Ambulance) are inundated in the 500 Year ARI.
7.6 Impact of Higher Tides and Sea Level Rise
A review of the potential for higher sea-levels to impact on flood levels was undertaken using the model. The tailwater level was updated for two scenarios:
• sea level equal to Highest Astronomical Tide (2.25 m AHD); and
• climate change sea level rise to 2100 applied to the Mean High Water Sping level (2.134 m AHD).
The results show that any increase in flood levels associated with the increased sea levels are contained to the reaches downstream of Aplins Weir. The increased flood levels result in additional residential lots potentially inundated in Railway Estate, South Townsville and Oonoonba.
7.7 Impact of Climate Change
A full assessment for the potential for climate change to impact on flooding has been undertaken. To account for climate change conditions in 2100, the model was updated to:
• include the sea level rise of 0.88 m on the Mean High Water Springs level to give a resulting sea level of 2.134 m AHD; and
• increase rainfall intensities by 15% in accordance with Increasing Queensland’s resilience to inland flooding in a changing climate (DERM, 2010)
The results of the modelling indicate that the 50 Year ARI flood would cause overflows into residential areas of Railway Estate that previously did not occur until the existing 100 Year ARI flood. For the 100 Year ARI there are additional overflows through Fairfield Waters and increases in the number of residential lots inundated in Railway Estate, South Townsville, Oonoonba, and Fairfield Waters.
ABN >> 44 741 992 072
95
8.0 References
Bureau of Meteorology, (2003) Guidebook to the Estimation of Probable Maximum Precipitation: Generalised Tropical Storm Method, Report prepared by hydrometeorological advisory service and Re-issued in September 2005 CSIRO, (2000) Floodplain Management in Australia: Best practices and principles, Report 73 for SCARM Department of Environment and Resource Management, Department of Infrastructure and Planning & Local Government Association of Queensland, (2010) Increasing Queensland’s resilience to inland flooding in a changing climate: Final Scientific Advisory Group (SAG) report—Derivation of a rainfall intensity figure to inform an effective interim policy approach to managing inland flooding risks in a changing climate Department of Local Government and Planning & Department of Emergency Services, (2003) State Planning Policy 1/03 – Mitigating Adverse Impacts of Flood Bushfire and Landslide DHI Software, (2009) MIKE FLOOD 1D-2D Modelling User Manual, for MIKE FLOOD 2009 Engineers Australian (1998) Australian Rainfall and Runoff – Volume 1 Engineers Australian (1987) Australian Rainfall and Runoff – Volume 2 Gutteridge, Haskin & Davey, (2005) Ross River Dam Upgrade Stages 2 to 5 - Design Validation Report, Report prepared for NQ Water Hargraves, G., (2000) Final Report Extreme Rainfall Estimation Project - CRCFORGE and (CRC) ARF Techniques, Queensland And Border Locations, Report from Water Assessment Group, Department of Natural Resources. Hennessy, K., Webb, L., Ricketts, J., & Macadam, I., (2008) Climate Change Projections for the Townsville Region, Report prepared by CSIRO for Townsville City Council Intergovernmental Panel on Climate Change, (2007) Fourth Assessment Report: Climate Change 2007 Maunsell, (2005a) Townsville Flood Hazard Assessment Study, Phase 2 – Volume 1, Report prepared for Townsville City Council Maunsell, (2005b) Townsville Flood Hazard Assessment Study, Phase 2 – Volume 2, Report prepared for Townsville City Council Maunsell, (2005c) Townsville Flood Hazard Assessment Study, Phase 3, Report prepared for Townsville City Council Maunsell McIntyre, (2001) Ross River Hydraulic Study – Downstream Flood Assessment Report, Report prepared for NQ Water

ABN >> 44 741 992 072
96
Maunsell, (2007) Ross River Dam Downstream Modelling - Verification to February 2007 Event, Report prepared for NQ Water Sinclair Knight Merz (2005) Ross River Dam Upgrade Stages 2 to 5 Hydrology Study, Report prepared for NQ Water Water Resources Commission (1990) Ross River Dam Design Report – Volume 1 XP-SOFTWARE, (2009) XP-RAFTS Urban & Rural Runoff Routing Software – Reference Manual for XP RAFTS 2009
ABN >> 44 741 992 072
A
Appendix A – Ross River Downstream Sub-Catchments

DS-4.00DS-5.04
DS-5.03
DS-2.00
DS-1.00
DS-3.00
DS-5.01DS-5.02
DS-5.00
DS-6.00
R o s s R i v e r U SR o s s R i v e r U SRIVE
RWAY
DRI
VE
RIVE
RWAY
DRI
VE
RIVERWAY DRIVE
RIVE
RWAY
DRI
VE
LEGEND
CatchmentAnnandale/DouglasGordonCkRoss River USStuartCk
RossRiver DS
FIGURE A
SCALE: @1:20,000
0.6 00.3Kilometers
A3
TOWNSVILLE CITY COUNCILROSS RIVER FLOOD STUDYROSS RIVER DOWNSTREAM
SUB-CATCHMENTS
© Townsville City Council 2010DIGITAL FILE: DRAWN BY: DATE:
Strategic Planning DepartmentPLANNING AND DEVELOPMENT
mxdWGB
12/04/2011
´
b
a
f
ce
g
d
a