royal philips second quarter and semi- annual 2020 results · 2020. 7. 20. · this document and...
TRANSCRIPT

Royal PhilipsSecond quarter and semi-annual 2020 results
July 20, 2020
Forward-looking statements and other important informationThis document and the related oral presentation, including responses to questions following the presentation, contain certain forward-looking statements with respect to the financial condition, results of operations and business of Philips and certain of the plans and objectives of Philips with respect to these items. Examples of forward-looking statements include: statements made about the strategy; estimates of sales growth; future Adjusted EBITA; future restructuring, acquisition-related and other costs; future developments in Philips’ organic business; and the completion of acquisitions and divestments. By their nature, these statements involve risk and uncertainty because they relate to future events and circumstances and there are many factors that could cause actual results and developments to differ materially from those expressed or implied by these statements.
These factors include but are not limited to: changes in industry or market circumstances; economic and political developments; the impact of the coronavirus disease (COVID-19) outbreak; Philips’ increasing focus on health technology; the realization of Philips’ growth ambitions and results in growth geographies; lack of control over certain joint ventures; integration of acquisitions; securing and maintaining Philips’ intellectual property rights and unauthorized use of third-party intellectual property rights; compliance with quality standards, product safety laws and good manufacturing practices; exposure to IT security breaches, IT disruptions, system changes or failures; supply chain management; ability to create new products and solutions; attracting and retaining personnel; financial impacts from Brexit; compliance with regulatory regimes, including data privacy requirements; governmental investigations and legal proceedings with regard to possible anticompetitive market practices and other matters; business conduct rules and regulations; treasury risks and other financial risks; tax risks; costs of defined-benefit pension plans and other post-retirement plans; reliability of internal controls, financial reporting and management process. As a result, Philips’ actual future results may differ materially from the plans, goals and expectations set forth in such forward looking statements. For a discussion of factors that could cause future results to differ from such forward-looking statements, see also the Risk management chapter included in the Annual Report 2019.
Third-party market share dataStatements regarding market share, including those regarding Philips’ competitive position, contained in this document are based on outside sources such as research institutes, industry and dealer panels in combination with management estimates. Where information is not yet available to Philips, those statements may also be based on estimates and projections prepared by outside sources or management. Rankings are based on sales unless otherwise stated.
Use of non-IFRS InformationIn presenting and discussing the Philips Group’s financial position, operating results and cash flows, management uses certain non-IFRS financial measures. These non-IFRS financial measures should not be viewed in isolation as alternatives to the equivalent IFRS measure and should be used in conjunction with the most directly comparable IFRS measures. Non-IFRS financial measures do not have standardized meaning under IFRS and therefore may not be comparable to similar measures presented by other issuers. A reconciliation of these non-IFRS measures to the most directly comparable IFRS measures is contained in this document. Further information on non-IFRS measures can be found in the Annual Report 2019.
Use of fair-value measurementsIn presenting the Philips Group’s financial position, fair values are used for the measurement of various items in accordance with the applicable accounting standards. These fair values are based on market prices, where available, and are obtained from sources that are deemed to be reliable. Readers are cautioned that these values are subject to changes over time and are only valid at the balance sheet date. When quoted prices or observable market data are not readily available, fair values are estimated using appropriate valuation models and unobservable inputs. Such fair value estimates require management to make significant assumptions with respect to future developments, which are inherently uncertain and may therefore deviate from actual developments. Critical assumptions used are disclosed in the Annual Report 2019. In certain cases independent valuations are obtained to support management’s determination of fair values.
All amounts are in millions of euros unless otherwise stated. Due to rounding, amounts may not add up precisely to totals provided. All reported data is unaudited. Financial reporting is in accordance with the accounting policies as stated in the Annual Report 2019.
Important information
2

Content
1. Company overview and strategy
2. Financial outlook
3. Financial performance in the quarter
Appendix
3
4
21
27
32
At Philips, we strive to make the world healthier and more sustainable through innovation.
4

We have transformed into a focused global HealthTech leader
5
15%30%
14%
24%21%
44%
2011 2019
Organic sales growth % and adjusted EBITA as % of sales
4.7%
10.1%
2011 2015 2019
Diagnosis & Treatment
LightingIPO in 2016
Other
TV/LEdivested in 2012 and 2014
Personal Health
Connected Care
…while creating valueTransforming the company…
100% of sales split
2%
4.5%
13.2%
4.5%

Our strategy resonates with customers, addresses their needsSeamlessly connecting care across the health continuum, we will improve outcomes
f
PreventionHealthy living Diagnosis Treatment Home care
6
Lower cost of careImproved patient experience
Improved healthoutcomes
Improved staff satisfaction

We operate in growing, evolving markets
And technology will play a bigger role
Consumer centric
Increasing consumer engagement in their
own health
Consolidation
Increasing horizontal and vertical
consolidation
Post Acute Care
Shifting to lower-cost settings and the
home
Digital
Connectingconsumers, patients and care providers
Precision
Importance of AI, informatics and personalization
Growing population Aging population Rising burden of chronic diseases
The demand for healthcare is growing
Increasing spend in developing markets
7

EUR 1.9 billion for R&D, ~64,500 patents rights, ~39,000 trademarks
More than half of R&D personnel in software and data science
~37% of sales from solutions, growing double-digit
~81,000 employees in over 100 countries
8
Royal PhilipsEUR 19.5 billion sales and Adjusted EBITA of 13.2% in 2019
1 All figures based on Q2 2020 last twelve months (LTM) unless stated otherwise 2 Growth geographies consist of all geographies excluding USA, Canada, Western Europe, Australia, New Zealand, South Korea, Japan and Israel
Other MatureGeographies
10%
Western Europe
22%
North America
36%
Growth Geographies2
32%
Global footprint1 Committed to innovation

Note: Margin refers to Adjusted EBITA margin; Segment Other represents 2% of group sales
Diagnosis & TreatmentFocuses on solutions for precision
diagnosis, disease pathway selection, and image-guided, minimally invasive
treatments
Personal HealthFocuses on healthy living and
preventative care
Connected CareFocuses on patient care solutions,
advanced analytics and patient and workflow optimization inside
and outside the hospital
5% sales growth12.7% margin
3% sales growth13.2% margin
5% sales growth16.1% margin
9
Operating across the health continuumFY 2019
44%of sales
24%of sales
30%of sales

Diagnosis & Treatment Focus areas Products & solutions
• Precision diagnosis
• Treatment selection and planning
• Image-guided minimally invasive therapy
• Diagnostic imaging and ultrasound• Digital and computational pathology• Informatics for Radiology, Oncology, Cardiology• Interventional imaging, navigation and devices• Services (managed services, consultancy, etc.)
Connected Care
• Patient care and workflow management
• Population health management
• Chronic disease management
• Telehealth, patient monitoring and analytics• Hospital and clinical informatics platforms • Emergency care and resuscitation• Sleep, breathing and respiratory care• Managed services
Personal Health
• Healthy living and prevention
• Personal care
• Digital consumer engagement
• Oral care• Mother and child care• Male grooming and beauty • Domestic appliances1
• Services (re-ordering, support, coaching, etc.)
Businesses aligned with customer needs
101 As per announcement of January 28, 2020, Philips will review options for future ownership of its Domestic Appliances business

Male GroomingGlobal Leader
Oral CareGlobal Leader
Mother & Child CareGlobal Leader
Garment CareGlobal LeaderSleep Care
Global Leader
Respiratory Care Global Leader2
Personal Emergency Response
#1 in North America
ICU Telemedicine#1 in North America
Patient Monitoring Global Leader
Over 60% of sales from leadership positions1
Diagnosis & Treatment
1 Leadership position refers to #1 or #2 position in Philips addressable market; 2 Based on non-invasive ventilators for the hospital setting
Personal HealthConnected Care
11
High-end Radiology and Cardiology
Informatics#1 in North America
Diagnostic Imaging Global Top 3
Image-Guided Therapy Devices
Global Leader
Image-Guided Therapy Systems
Global Leader
UltrasoundGlobal Leader

12
Safeguarding health & safety of our employees
Meeting critical customer needs Ensuring business continuity
• Personal hygiene measures and safety protocols
• Working from home protocol
• Safe environment for production, supply, field service, and certain R&D activities
• Personal Protective Equipment (PPE)
• Production volumes ramp-up
• Delivery and installation of critical equipment
• Fair and ethical allocation of scarce equipment and supplies
• Customer services
• Updated clinical guidance
• Business Continuity Management System
• Functional operations and supply chain
• Commercial processes
COVID-19: delivering against our triple duty of care
Central and regional task force teams

Our products, services and solutions can support healthcare providers in the fight against COVID-19
13
• Computed tomography (CT)
• Mobile diagnostic X-ray
• Point-of-care ultrasound
• Advanced informatics
• Central monitoring of ICU patients (Tele-ICU)
• Telehealth programs for remote screening and monitoring
• Tele-pathology
• Interoperability applications
• Vital signs patient monitors
• Invasive and non-invasive hospital
ventilators

Revenue growth
Margin expansion
Increased cash generation
Customer satisfaction
Drivers for continued growth and improved profitability
Win with solutions along the health continuum
• Drive innovative, value-added integrated solutions
• Reinforce with M&A, organic investments and partnerships
• Improve customer experience, quality systems, operational excellence and productivity
• Continue to lead the digital transformation
Better serve customers and improve quality
Boost growth in core business
• Capture geographic growth opportunities
• Pivot to consultative customer partnerships and services business models
Value creation
14

We bring together:
• A holistic view on the needs of consumers, patients and providers
• Deep consumers insights
• Leading clinical andoperational expertise
• Broad portfolio of technologies
Drive innovative, value-added integrated solutionsWe are uniquely positioned to deliver integrated solutions
15
Integrated solutions
Addressing Quadruple
Aim
Systems
Smart devices
Services
AI & software
Example solution areas:
• Precision diagnostics
• Minimally invasive therapies
• Sleep and respiratory care
• Connected care
Solutions deliver approx. 37% of revenues, growing double-digit

Philips Tele-ICU programEmpowering acute care teams by linking remote patient monitoring technology with evidence-based care transformation
1 in 8 adult ICU patients in the US are monitored by Tele-ICU program
Extracting actionable insights from streaming vital signs data and medical records for better patient outcomes
26%Health outcomes
Reduction in mortality1
Cost of care
USD 5,000Saved per ICU patient2
15%Staff satisfaction
Discharged to home faster3 30%
Patient experienceReduction in length of stay3
1 Lilly CM, et al. A Multi-center Study of ICU Telemedicine Reengineering of Adult Critical Care. CHEST. 2014; 145(3): 500-7; 2 Tele-ICU project with University of Massachusetts Memorial Medical Center. NEHI Research Update. November 17, 2008.; 3 Lilly CM, et al. Hospital Mortality, Length of Stay and Preventable Complications Among Critically Ill Patients Before and After Tele-ICU Reengineering of Critical Care Processes. JAMA. June 2011; 305(21) 2175-83
16

Pivot to consultative customer partnerships and services business models
17
Long-term strategic partnerships unlock value for our customers and us
Recent deals
Built on:
• Common goals
• Joint commitment
• Outcome-focused business models
• Continuous improvement
• Collaborative innovation
Leading to:
Deeper C-suite relationships
Delivering success to customers
Increasing share of wallet
Multi-year, recurring revenues
Excellent references

Our sustainability programs address pressing societal issuesFocus on United Nations Sustainable Development Goals, in particular #3, #12 and #131
Access to care
Circular economy
Climate change
3 billion lives improved per year by 2030, including 400 million in underserved healthcare communities
15% circular revenues, zero waste to landfill (2020)100% closed loops for all medical systems (2025)
Carbon-neutral in our operations, 100% renewable electricity (2020)
1 #3 “Ensure healthy lives and promote well-being for all at all ages”, #12 “Ensure sustainable consumption and production patterns”, #13 “Climate Action”
The Compact Committed to the WEF Compact for Responsive and Responsible Leadership
18
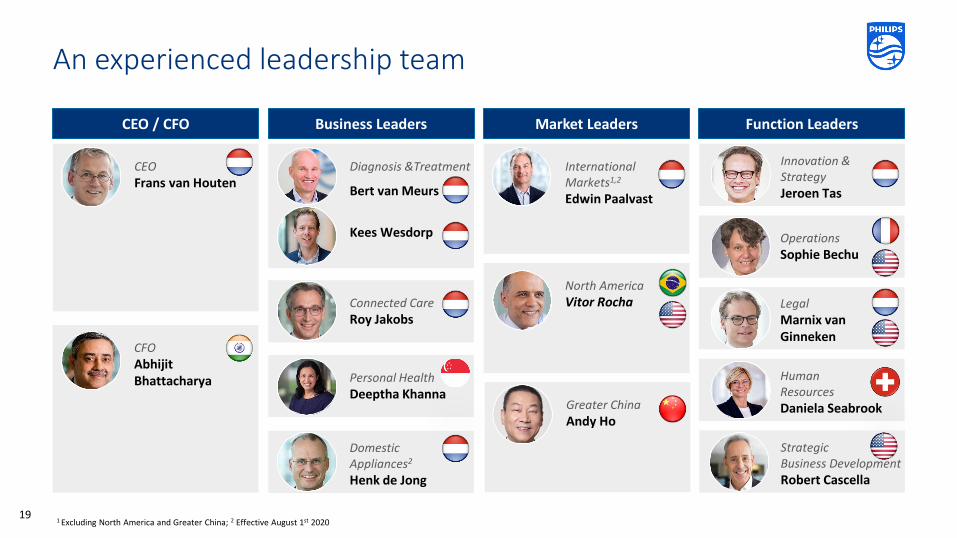
An experienced leadership team
1 Excluding North America and Greater China; 2 Effective August 1st 2020
CEOFrans van Houten
CFOAbhijit Bhattacharya
CEO / CFO Business Leaders Market Leaders Function Leaders
InternationalMarkets1,2
Edwin Paalvast
Greater ChinaAndy Ho
OperationsSophie Bechu
HumanResourcesDaniela Seabrook
Legal Marnix van Ginneken
Innovation & StrategyJeroen Tas
North AmericaVitor Rocha
19
Connected Care Roy Jakobs
Diagnosis &Treatment
Bert van Meurs
Kees Wesdorp
Personal HealthDeeptha Khanna
DomesticAppliances2
Henk de Jong
Strategic Business DevelopmentRobert Cascella

Content
1. Company overview and strategy
2. Financial outlook
3. Financial performance in the quarter
Appendix
20
4
21
27
32

Continued focus on value creation
2017-2020 targets1
Revenue growthComparable sales growth
4-6% annually
Cash generationFree Cash Flow in 2020
above EUR 1.5 billion
ROICOrganic ROIC in 2020
mid-to-high-teens
Margin expansionAdj. EBITA improvement
average annual 100 bps improvement
21
After 2020 we will drive further improvement
1 As per announcement of July 20th, 2020, we continue to aim for a modest sales growth and Adj. EBITA margin improvement in 2020

0.3
0.50.7
~8500.1
0.2
0.3
~300
0.1
0.3
0.5
~650
2017 2018 2019 2020E
Manufacturing productivityCost reductionProcurement savings
Productivity program of > EUR 1.8 billion by 2020
22 1 Excluding the acquisitions post 2016
Manufacturing footprint
• Consolidating regional manufacturing footprint from 50 to ~30 production locations1; 18 locations completed to date
Cost reduction
• Significant increase in scope and traction in Global Business Services
• Marketing transformation to fund more advertising firepower
• IT landscape simplification on track
• R&D to deliver 40-50 bps productivity by 2020
Procurement
• Expanding proven DfX approach to the full value chain
Restructuring
• Due to additional productivity, restructuring charges expected to be 90-100 bps in 2020, thereafter ~40 bps
2017 – 2020 cumulated net productivity savings
EUR 1.4 billion
> EUR 1.8 billion
++ +
EUR 0.5 billion
EUR 0.9 billion

1.0%
1.6%
0.6% (1.1)%
(1.1)%
~100bps
Volume Gross margin Cost reduction Price erosion Inflation Average annualimprovement
Indicative annual Adjusted EBITA target bridge1
23
• Procurement• Manufacturing productivity• Mix improvement
• Geographic expansion• New product introduction• Operating leverage
• Standardization of back offices with Global Business Services
• IT landscape simplification
1 Not valid for Full Year 2020: We continue to aim for a modest sales growth and Adj. EBITA margin improvement in 2020

Balanced capital allocation policy
Share buybackfor capital reduction purposes
Dividendaimed at dividend stability
M&Adisciplined but more
active approach
Reinvestin high-return growth
opportunities
Total shareholder return since 20161,2
1 As of market close July 17th, 2020; 2 TSR peer index includes companies as described in the Philips Annual Report 201924
+109%
+67%
17%
Royal Philips TSR peer group EURO STOXX 50
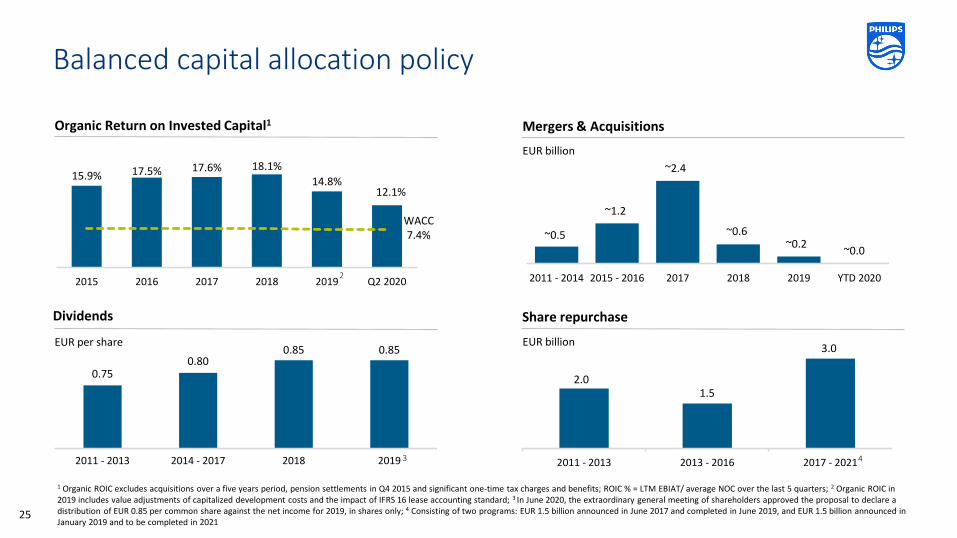
0.750.80
0.85 0.85
2011 - 2013 2014 - 2017 2018 2019
EUR per share
2.01.5
3.0
2011 - 2013 2013 - 2016 2017 - 2021
EUR billion
Balanced capital allocation policy
Organic Return on Invested Capital1
Share repurchase
Mergers & Acquisitions
Dividends
EUR billion
1 Organic ROIC excludes acquisitions over a five years period, pension settlements in Q4 2015 and significant one-time tax charges and benefits; ROIC % = LTM EBIAT/ average NOC over the last 5 quarters; 2 Organic ROIC in 2019 includes value adjustments of capitalized development costs and the impact of IFRS 16 lease accounting standard; 3 In June 2020, the extraordinary general meeting of shareholders approved the proposal to declare a distribution of EUR 0.85 per common share against the net income for 2019, in shares only; 4 Consisting of two programs: EUR 1.5 billion announced in June 2017 and completed in June 2019, and EUR 1.5 billion announced in January 2019 and to be completed in 2021
15.9% 17.5% 17.6% 18.1%14.8%
12.1%
2015 2016 2017 2018 2019 Q2 2020
WACC7.4%
25
43
2 2011 - 2014 2015 - 2016 2017 2018 2019 YTD 2020
~0.5
~1.2
~2.4
~0.6~0.2 ~0.0

Content
1. Company overview and strategy
2. Financial outlook
3. Financial performance in the quarter
Appendix
26
4
21
27
32

Q2 2020 financial performance highlights
• Comparable order intake increased 27%
• Adjusted EBITA margin was 9.5% of sales, compared to 11.8% of sales in Q2 2019
• Income from operations amounted to EUR 229 million, compared to EUR 350 million in Q2 2019
• Adjusted EPS amounted to EUR 0.35, compared to EUR 0.42 in Q2 2019
• Free cash flow increased to EUR 311 million, compared to EUR 174 million in Q2 2019
Sales EUR million Comparable sales growth Adj. EBITA margin Adj. EBITDA
margin
Diagnosis & Treatment 1,919 (9)% 8.6% 12.2%
Connected Care 1,322 14% 17.8% 21.8%
Personal Health 1,069 (19)% 5.6% 9.6%
Other 84
Philips 4,395 (6)% 9.5% 15.2%
27
28
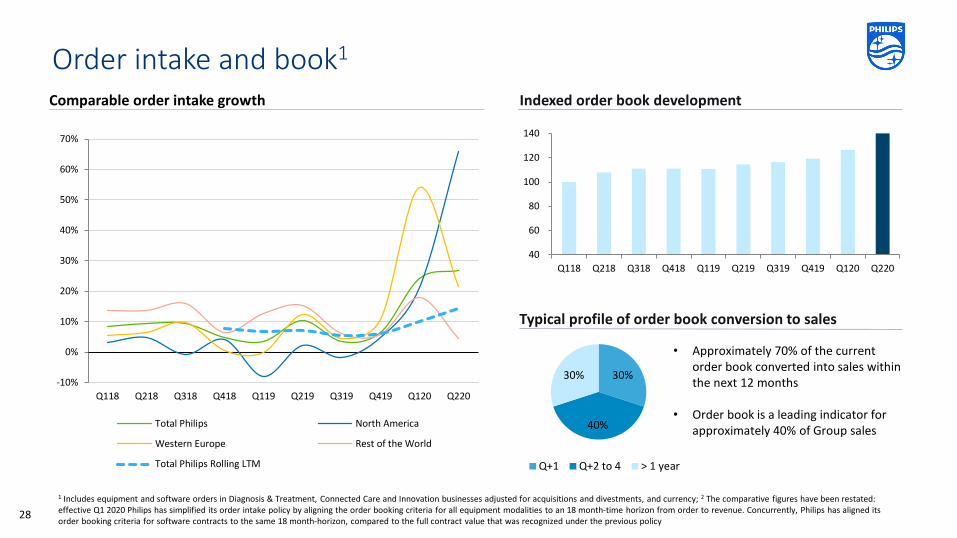
Order intake and book1
Comparable order intake growth Indexed order book development
• Approximately 70% of the current order book converted into sales within the next 12 months
• Order book is a leading indicator for approximately 40% of Group sales
Typical profile of order book conversion to sales
1 Includes equipment and software orders in Diagnosis & Treatment, Connected Care and Innovation businesses adjusted for acquisitions and divestments, and currency; 2 The comparative figures have been restated: effective Q1 2020 Philips has simplified its order intake policy by aligning the order booking criteria for all equipment modalities to an 18 month-time horizon from order to revenue. Concurrently, Philips has aligned its order booking criteria for software contracts to the same 18 month-horizon, compared to the full contract value that was recognized under the previous policy
-10%
0%
10%
20%
30%
40%
50%
60%
70%
Q118 Q218 Q318 Q418 Q119 Q219 Q319 Q419 Q120 Q220
Total Philips North America
Western Europe Rest of the World
Total Philips Rolling LTM
40
60
80
100
120
140
Q118 Q218 Q318 Q418 Q119 Q219 Q319 Q419 Q120 Q220
30%
40%
30%
Q+1 Q+2 to 4 > 1 year

Adjusted EBITA margin1 bridge Q2 2020
29 1 Excluding restructuring costs, acquisition-related charges and other one-time charges and gains; 2 Includes tariffs and other
as a % of sales
11.8%
1.0%
1.9%
0.5%(1.0%)
(1.1%)
(3.6%)
9.5%
Adj. EBITAQ2 2019
Volume Gross margin Cost reduction Price erosion Inflation Other & COVID-19 Adj. EBITAQ2 2020
2

Working capital and inventories
1 Working capital excluding segment Other; 2 Working capital and Inventories as a % of LTM sales are excluding acquisitions, divestments, and discontinued operations
11.5%12.8%
11.7% 11.4% 11.4%
7%
11%
1,000
1,500
2,000
2,500
Q219 Q319 Q419 Q120 Q220
15.9% 16.7%14.2% 15.1% 16.6%
-2%
8%
18%
1,500
2,000
2,500
3,000
3,500
Q219 Q319 Q419 Q120 Q220
as % of LTM sales2Working capital1, EUR million as % of LTM sales2Inventories, EUR million
2.7%
4.4%
2.5% 2.6%1.7%
0%
5%
0
100
200
300
400
Q219 Q319 Q419 Q120 Q220
16.5% 17.7%15.8% 15.8%
17.1%
9%
13%
17%
0
500
1,000
1,500
Q219 Q319 Q419 Q120 Q220
13.7% 14.5%15.9%
14.1% 12.6%
5%
9%
13%
17%
0
200
400
600
800
Q219 Q319 Q419 Q120 Q220
Diagnosis & Treatment Personal HealthConnected Care
30

Appendix

Restructuring, acquisition-related charges, and other items
Due to rounding, amounts may not add up precisely to totals provided.1. Mainly related to the consent decree focused on the defibrillator manufacturing in the US; 2. Gains related to divestments and asset disposals; 3. Charges related to litigation provisions; 4. Includes a value adjustment of
capitalized development costs; 5. Provision related to legal matters; 6. Includes gain related to release of a contingent consideration liability; 7. Inventory valuation charges resulting from deployment of new systems; 8. Includes separation costs related to Domestic Appliances business
32
EUR mi l l ion ColumCo
Q1 19 Q2 19 Q3 19 Q4 19 2019 Q1 20 Q2 20
Diagnosis & Treatment (30) (41) (47) (106) (222) (76) 59
Restructuring & Acq.-related charges (27) (37) (20) (66) (149) (43) 62
Other i tems (3) (4) (27) (40) (73) (33) (3)
Connected Care (29) (32) (27) (44) (131) (31) (31)
Restructuring & Acq.-related charges (19) (15) (12) (18) (64) (11) (14)
Other i tems (10) (16) (15) (26) (67) (20) (17)
Personal Health (16) (8) (23) (27) (73) (8) (39)
Restructuring & Acq.-related charges (16) (7) (3) (24) (50) (8) (13)
Other i tems - - (20) (3) (23) - (26)
Other 26 (29) (17) (22) (43) (2) (20)
Restructuring & Acq.-related charges (9) (22) (12) (10) (54) (1) (5)
Other i tems 35 (7) (5) (12) 11 (1) (14)
Philips (50) (109) (114) (198) (471) (117) (30)
Restructuring costs (39) (66) (35) (109) (249) (39) (44)
Acquis i tion related charges (32) (16) (12) (9) (69) (23) 73 Other i tems 21 (28) (67) (80) (153) (55) (60)
1
2, 3
1
2, 3
1
4
5
2, 3
1
2, 3
4
4
1
4
1
6
7
8

Capital expenditures, Depreciation and Amortization
EUR million Q2 2019 Q2 2020 FY 2019
Capital expenditures on property, plant and equipment 116 130 518
Capitalization of development costs 123 109 460
Depreciation 151 173 645
Amortization of acquired intangible assets 91 159 350
Amortization of software 18 21 75
Amortization of development costs 59 58 332
Depreciation and amortization1 319 411 1,402
33 1 Includes impairments

Philips' debt has a long maturity profile
Characteristics of long-term debt
• Total net debt position of EUR 5.0 billion
• Maturities up to 2042
• Average tenor of long-term debt is 8.9 years3
• No financial covenants
• In March 2020 Philips issued a EUR 500 million 1.375% fixed rate Sustainability Innovation bond due 2025 and a EUR 500 million 2.000% fixed rate bond due 2030
• In Q2 2020 Philips entered into EUR 493 million of forward transactions as part of the share buyback program for capital reduction purposes with settlement dates extending into the second half of 2021
1 Short-term debt includes local credit facilities that are being rolled forward on a continuous basis; 2 Debt includes forward transactions entered into as part of share repurchase programs for share cancellation and LTI purposes; 3 Based on long-term debt only, excludes short-term debt and forward share repurchases for share cancellation and LTI purposes
Debt maturity profile as per 30 June 2020
EUR million
34
Long-term debt
Short-term debt1
Unutilized standby & other committed facilities
Forward share repurchases2

Calendar for the upcoming eventsSeptember 9 Goldman Sachs - European Medtech and Healthcare Services Conference
September 9 Kepler Cheuvreux Autumn Conference (ESG)
September 15 Morgan Stanley - Virtual Global Healthcare Conference
September 17 Bank of America - Global Healthcare Conference
September 23-24 Alliance Bernstein - Pan European Strategic Decisions Conference
October 19 Third quarter results 2020
contact us Royal Philips, Investor Relations
phone +31 20 5977222
email [email protected]
website www.philips.com/a-w/about/investor.html
35