rs 70 rs 74 gmr infrastructure ltd (gmrinf) - icici...
TRANSCRIPT
1 | P a g e
ICICIdirect.com, Equity Research
Exhibit 1: Key Financials FY08 FY09 FY10E FY11E FY12E
Net Sales 2,294.7 4,019.2 5,374.1 6,509.7 7,710.4 EBITDA 598.5 1,067.1 1,560.7 2,082.0 2,690.9 Net Profit 210.2 279.4 -11.7* 295.4 285.0 EPS (Rs) 0.6 0.8 (0.0) 0.8 0.8EPS Growth (%) 0.0 33.0 NA NA (3.5)EBITDA margin (%) 26.1 26.6 29.0 32.0 34.9PER (x) 104.0 129.7 NA 86.9 90.1P/BV (x) 4.2 4.0 4.0 3.8 3.6 Price/sales (x) 11.2 6.4 4.8 3.9 3.3 Dividend Yield (%) 0.0 0.0 0.0 0.0 0.0RoCE (%) 3.0 3.2 3.7 4.4 3.9RoNW(%) 3.6 3.3 (0.7) 3.1 2.5
Source: Company, ICICIdirect.com Research * Net profit is expected to decline significantly due to one time GEL relocation in Q4FY10E
Analysts’ Name
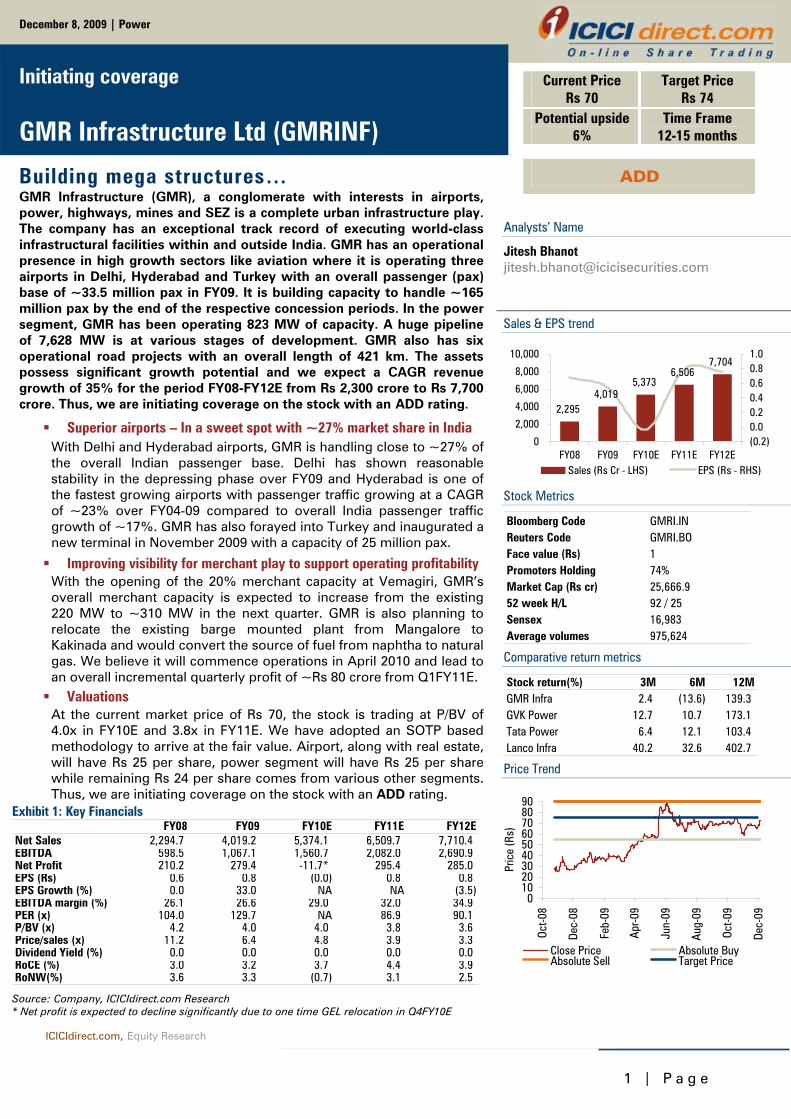
Jitesh Bhanot [email protected] Sales & EPS trend
2,2954,019
5,3736,506
7,704
0
2,000
4,000
6,000
8,000
10,000
FY08 FY09 FY10E FY11E FY12E(0.2)0.00.20.40.60.81.0
Sales (Rs Cr - LHS) EPS (Rs - RHS)
Stock Metrics
Bloomberg Code GMRI.INReuters Code GMRI.BOFace value (Rs) 1Promoters Holding 74%Market Cap (Rs cr) 25,666.952 week H/L 92 / 25Sensex 16,983Average volumes 975,624 Comparative return metrics
Stock return(%) 3M 6M 12MGMR Infra 2.4 (13.6) 139.3GVK Power 12.7 10.7 173.1Tata Power 6.4 12.1 103.4Lanco Infra 40.2 32.6 402.7 Price Trend
0102030405060708090
Oct-0
8
Dec-
08
Feb-
09
Apr-0
9
Jun-
09
Aug-
09
Oct-0
9
Dec-
09
Pric
e (R
s)
Close Price Absolute BuyAbsolute Sell Target Price
December 8, 2009 | Power
Initiating coverage
GMR Infrastructure Ltd (GMRINF)
Building mega structures… GMR Infrastructure (GMR), a conglomerate with interests in airports, power, highways, mines and SEZ is a complete urban infrastructure play. The company has an exceptional track record of executing world-class infrastructural facilities within and outside India. GMR has an operational presence in high growth sectors like aviation where it is operating three airports in Delhi, Hyderabad and Turkey with an overall passenger (pax) base of ~33.5 million pax in FY09. It is building capacity to handle ~165 million pax by the end of the respective concession periods. In the power segment, GMR has been operating 823 MW of capacity. A huge pipeline of 7,628 MW is at various stages of development. GMR also has six operational road projects with an overall length of 421 km. The assets possess significant growth potential and we expect a CAGR revenue growth of 35% for the period FY08-FY12E from Rs 2,300 crore to Rs 7,700 crore. Thus, we are initiating coverage on the stock with an ADD rating.
Superior airports – In a sweet spot with ~27% market share in India With Delhi and Hyderabad airports, GMR is handling close to ~27% of the overall Indian passenger base. Delhi has shown reasonable stability in the depressing phase over FY09 and Hyderabad is one of the fastest growing airports with passenger traffic growing at a CAGR of ~23% over FY04-09 compared to overall India passenger traffic growth of ~17%. GMR has also forayed into Turkey and inaugurated a new terminal in November 2009 with a capacity of 25 million pax.
Improving visibility for merchant play to support operating profitability With the opening of the 20% merchant capacity at Vemagiri, GMR’s overall merchant capacity is expected to increase from the existing 220 MW to ~310 MW in the next quarter. GMR is also planning to relocate the existing barge mounted plant from Mangalore to Kakinada and would convert the source of fuel from naphtha to natural gas. We believe it will commence operations in April 2010 and lead to an overall incremental quarterly profit of ~Rs 80 crore from Q1FY11E. Valuations At the current market price of Rs 70, the stock is trading at P/BV of 4.0x in FY10E and 3.8x in FY11E. We have adopted an SOTP based methodology to arrive at the fair value. Airport, along with real estate, will have Rs 25 per share, power segment will have Rs 25 per share while remaining Rs 24 per share comes from various other segments. Thus, we are initiating coverage on the stock with an ADD rating.
Current Price Rs 70
Target Price Rs 74
Potential upside 6%
Time Frame 12-15 months
ADD
2 | P a g e
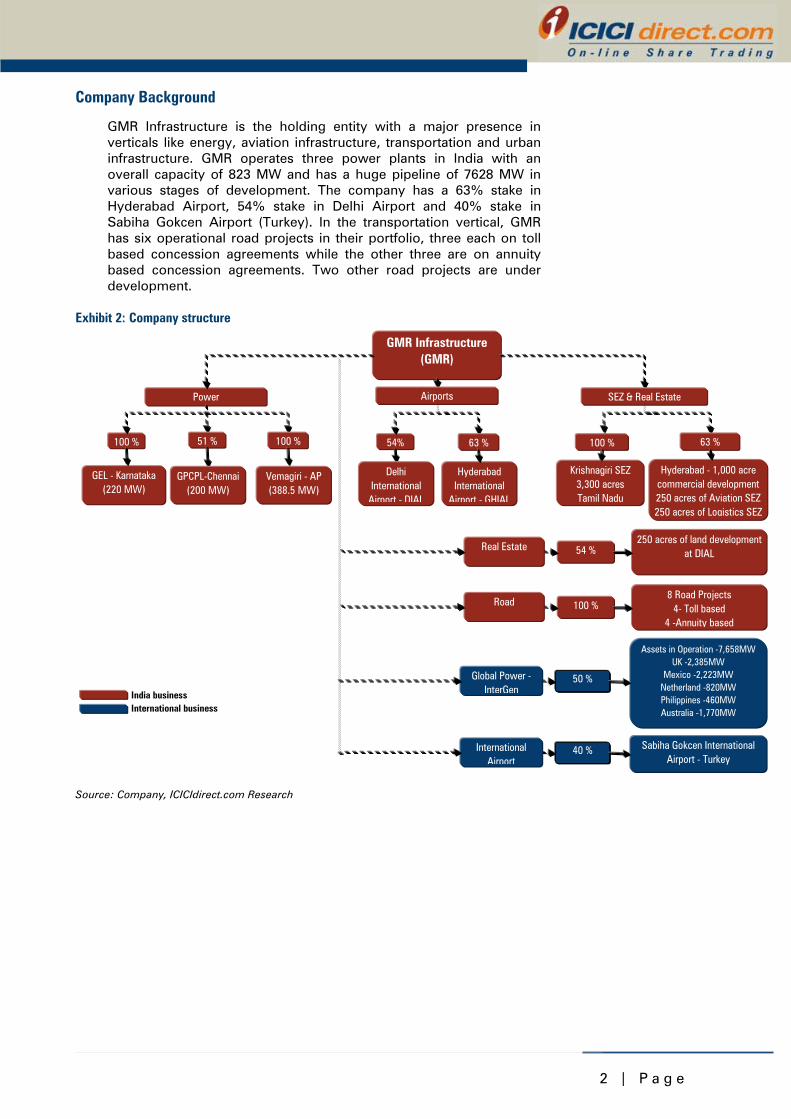
Company Background
GMR Infrastructure is the holding entity with a major presence in verticals like energy, aviation infrastructure, transportation and urban infrastructure. GMR operates three power plants in India with an overall capacity of 823 MW and has a huge pipeline of 7628 MW in various stages of development. The company has a 63% stake in Hyderabad Airport, 54% stake in Delhi Airport and 40% stake in Sabiha Gokcen Airport (Turkey). In the transportation vertical, GMR has six operational road projects in their portfolio, three each on toll based concession agreements while the other three are on annuity based concession agreements. Two other road projects are under development.
Exhibit 2: Company structure
India businessInternational business
GMR Infrastructure (GMR)
Power
8 Road Projects4- Toll based
4 -Annuity based
100 %
GEL - Karnataka(220 MW)
100 %
Vemagiri - AP(388.5 MW)
100 %
Road
Assets in Operation -7,658MWUK -2,385MW
Mexico -2,223MWNetherland -820MWPhilippines -460MWAustralia -1,770MW
50 %Global Power -InterGen
SEZ & Real Estate
100 % 63 %51 %
GPCPL-Chennai(200 MW)
Krishnagiri SEZ3,300 acresTamil Nadu
Hyderabad - 1,000 acre commercial development250 acres of Aviation SEZ250 acres of Logistics SEZ
Airports
Hyderabad International
Airport - GHIAL
63 %54%
Delhi International
Airport - DIAL
Sabiha Gokcen International Airport - Turkey
40 %International Airport
250 acres of land developmentat DIAL54 %Real Estate
Source: Company, ICICIdirect.com Research
3 | P a g e
Power assets GMR has three operational power plants with an overall capacity of 823 MW. One each is in Andhra Pradesh, Karnataka and Tamil Nadu. GMR is operating the 220 MW barge mounted power plant in Karnataka on naphtha. This is expected to be relocated to Andhra Pradesh in Q4FY10 and would commence operations on natural gas after relocation. Another 388.5 MW plant in Vemagiri, located in Andhra Pradesh, has already achieved commissioning date (CoD) in 2006. However, owing to non-availability of fuel, the company was operating at very low PLFs. The PLF in FY09 was ~20%. After the improvement of gas availability, the PLF has been ramped up to ~87% for April-October 2009. For the Vemagiri plant, the government has also given a go-ahead for selling 20% of the power under merchant capacity. The requisite regulatory approval is expected shortly and the merchant power sale is expected to commence from December 2009. The third operational plant of 200 MW is in Chennai and is based on low sulphur heavy stock (LSHS) as feedstock with an operational record since 1999.
The company has a huge power portfolio lined up for operation in the coming years. The current generation capacity of the company stands at 823 MW and the company has planned capacities of ~6,813 MW (83% based on thermal and 17% based on hydro). The planned and operational plant details have been summarised below along with their expected CoD.
Exhibit 3: Details of power assets
PlantCapacity
(MW) Fuel Type StatusCoD/ Exp.
CoD Offtake Arrangements% sold under
merchant basisGEL, Tamil Nadu 200 LSHS Functional 1998 Regulated 0Barge Mounted, Karnataka GPCPL) 220 Naptha Functional 2001 Merchant 100Vermagiri Phase I, AP (VPGL) 388 Natural Gas Functional Feb-08 Regulated/ Merchant 20Vemagiri Phase II, AP (VPGL) 768 Natural Gas Under Development FY12-13 Merchant 50Kamlanga Dhenkamal Orissa 1,050 Coal Financial Closure FY12-13 Regulated/ Merchant 20Emco Energy 600 Coal Financial Closure FY12-13 NA NAGMR energy Raipur Chattisgarh 1,200 Coal Under Development FY12-13 Regulated/ Merchant 30Gujarat Coastal 1,320 Coal Under Development FY13-14 Regulated/ Merchant 35AP Coastal 700 Coal Under Development FY13-14 Merchant 100Alaknanda Hydro Uttarakhand 300 Hydro Under Development FY14-15 Merchant 100Talong Hydro Arunanchal Pradesh 160 Hydro Under Development FY15-16 Merchant 100Bajoli Holi Himachal Pradesh 180 Hydro Under Development FY16-17 Merchant 100Karnali, Nepal 300 Hydro Under Development FY16-17 Merchant 100Marsyangdi, Nepal 250 Hydro Under Development FY16-17 Merchant 100Total 7,636 Source: Company, ICICIdirect.com Research
International power assets The company has acquired a 50% stake in InterGen NV, a Netherlands based leading power generation company, with operational assets to the tune of 7,658 MW and assets under construction of 428 MW. The assets have an 87:13 fuel mix of natural gas to coal. It operates 12 power plants based in four continents. GMR has also acquired a 100% stake in Island Power, Singapore, from InterGen, which has gas-based assets portfolio of 800 MW in the development stage. GMR also has a trading company in its kitty for accentuating trading revenues through the merchant power trade route.
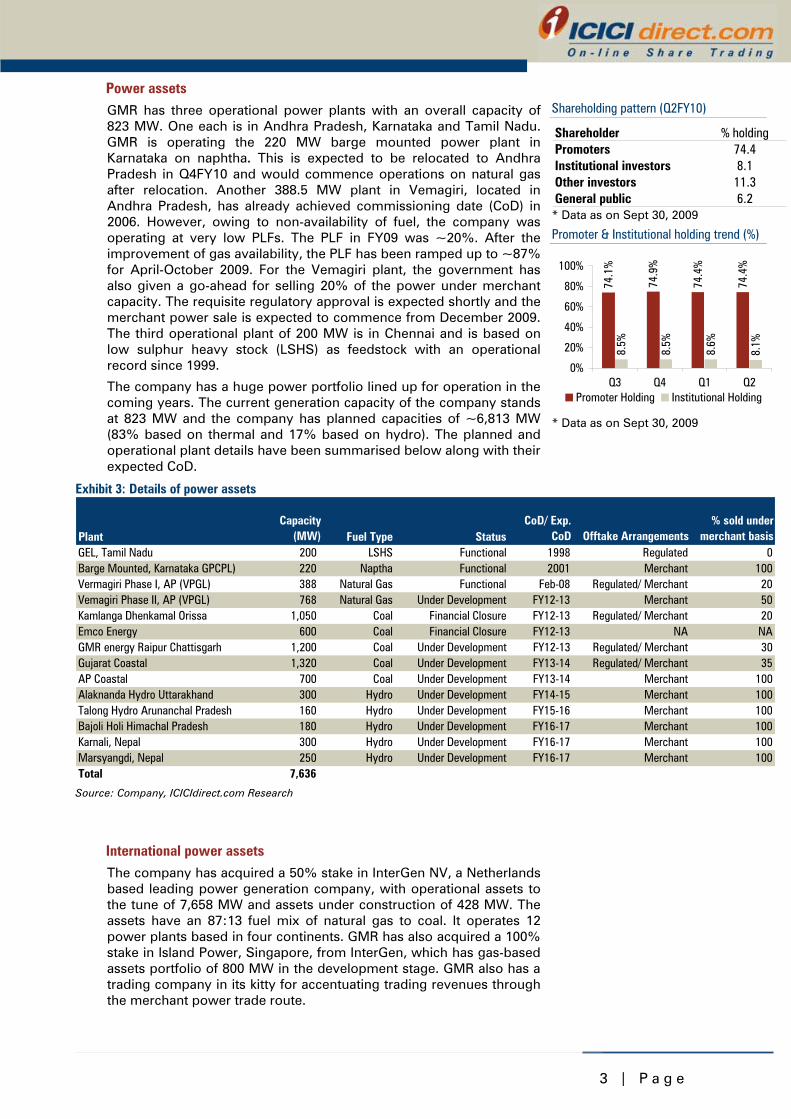
Shareholding pattern (Q2FY10)
Shareholder % holdingPromoters 74.4Institutional investors 8.1Other investors 11.3General public 6.2* Data as on Sept 30, 2009 Promoter & Institutional holding trend (%)
74.1
%
74.9
%
74.4
%
74.4
%
8.5%
8.5%
8.6%
8.1%
0%
20%
40%
60%
80%
100%
Q3 Q4 Q1 Q2Promoter Holding Institutional Holding
* Data as on Sept 30, 2009
4 | P a g e
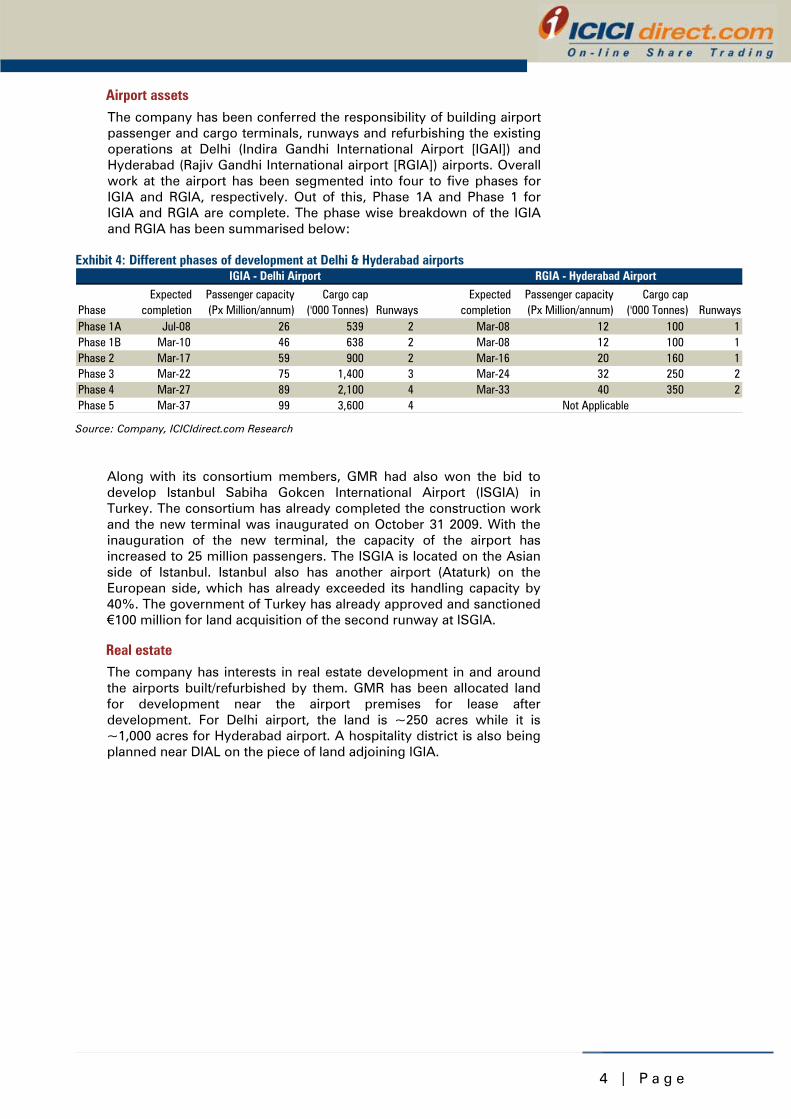
Airport assets The company has been conferred the responsibility of building airport passenger and cargo terminals, runways and refurbishing the existing operations at Delhi (Indira Gandhi International Airport [IGAI]) and Hyderabad (Rajiv Gandhi International airport [RGIA]) airports. Overall work at the airport has been segmented into four to five phases for IGIA and RGIA, respectively. Out of this, Phase 1A and Phase 1 for IGIA and RGIA are complete. The phase wise breakdown of the IGIA and RGIA has been summarised below:
Exhibit 4: Different phases of development at Delhi & Hyderabad airports
PhaseExpected
completionPassenger capacity(Px Million/annum)
Cargo cap('000 Tonnes) Runways
Expectedcompletion
Passenger capacity(Px Million/annum)
Cargo cap('000 Tonnes) Runways
Phase 1A Jul-08 26 539 2 Mar-08 12 100 1Phase 1B Mar-10 46 638 2 Mar-08 12 100 1Phase 2 Mar-17 59 900 2 Mar-16 20 160 1Phase 3 Mar-22 75 1,400 3 Mar-24 32 250 2Phase 4 Mar-27 89 2,100 4 Mar-33 40 350 2Phase 5 Mar-37 99 3,600 4 Not Applicable
IGIA - Delhi Airport RGIA - Hyderabad Airport
Source: Company, ICICIdirect.com Research
Along with its consortium members, GMR had also won the bid to develop Istanbul Sabiha Gokcen International Airport (ISGIA) in Turkey. The consortium has already completed the construction work and the new terminal was inaugurated on October 31 2009. With the inauguration of the new terminal, the capacity of the airport has increased to 25 million passengers. The ISGIA is located on the Asian side of Istanbul. Istanbul also has another airport (Ataturk) on the European side, which has already exceeded its handling capacity by 40%. The government of Turkey has already approved and sanctioned €100 million for land acquisition of the second runway at ISGIA.
Real estate The company has interests in real estate development in and around the airports built/refurbished by them. GMR has been allocated land for development near the airport premises for lease after development. For Delhi airport, the land is ~250 acres while it is ~1,000 acres for Hyderabad airport. A hospitality district is also being planned near DIAL on the piece of land adjoining IGIA.
5 | P a g e
SEZ GMR is also expected to develop several SEZs. Krishnagiri project is the first SEZ and is located on NH7 towards the Tamil Nadu-Bangalore border. Spanning across 3,300 acres to be operational by FY14, the target portfolio at the SEZ would constitute sunrise sectors such as solar and photo volt, biotechnology, IT, ITeS, electronics and engineering industries. The other projects include the 250 acres aviation specific development SEZ (aviation cluster) near Hyderabad airport and a 250-acre logistic hub as a multi-product SEZ. The SEZ is also expected to attract tax holidays and other benefits for the SEZ developer.
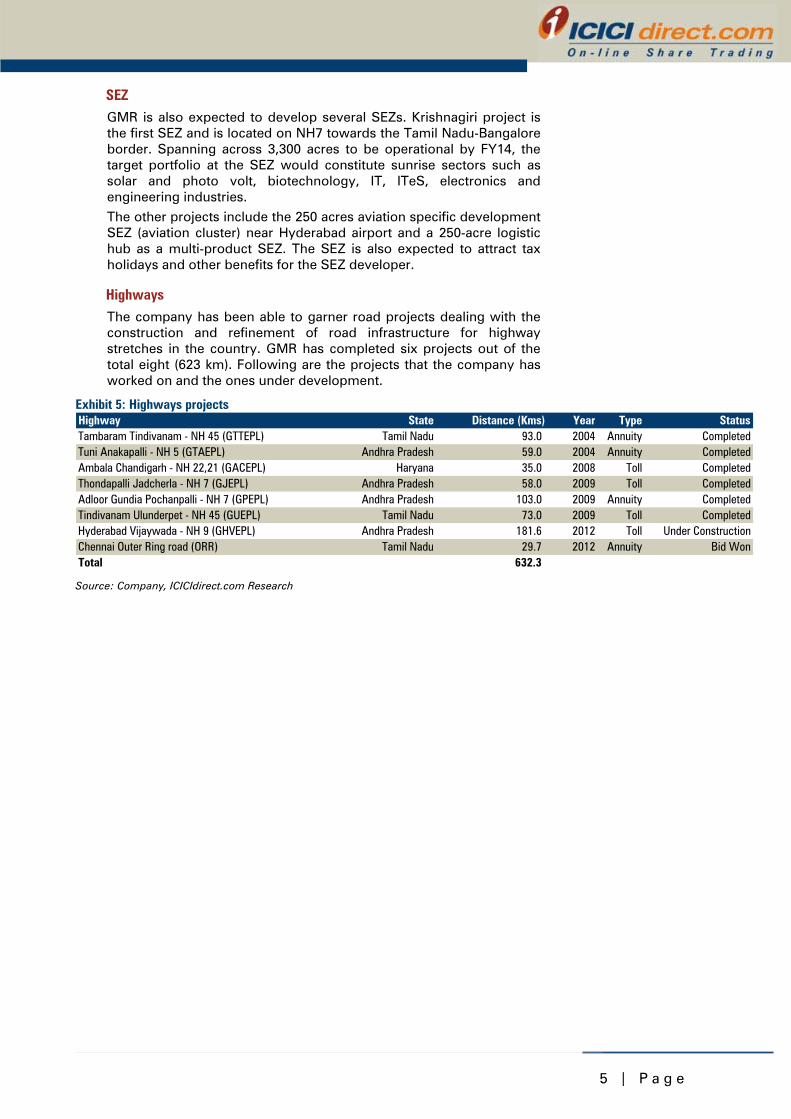
Highways The company has been able to garner road projects dealing with the construction and refinement of road infrastructure for highway stretches in the country. GMR has completed six projects out of the total eight (623 km). Following are the projects that the company has worked on and the ones under development.
Exhibit 5: Highways projects Highway State Distance (Kms) Year Type StatusTambaram Tindivanam - NH 45 (GTTEPL) Tamil Nadu 93.0 2004 Annuity CompletedTuni Anakapalli - NH 5 (GTAEPL) Andhra Pradesh 59.0 2004 Annuity CompletedAmbala Chandigarh - NH 22,21 (GACEPL) Haryana 35.0 2008 Toll CompletedThondapalli Jadcherla - NH 7 (GJEPL) Andhra Pradesh 58.0 2009 Toll CompletedAdloor Gundia Pochanpalli - NH 7 (GPEPL) Andhra Pradesh 103.0 2009 Annuity CompletedTindivanam Ulunderpet - NH 45 (GUEPL) Tamil Nadu 73.0 2009 Toll CompletedHyderabad Vijaywada - NH 9 (GHVEPL) Andhra Pradesh 181.6 2012 Toll Under ConstructionChennai Outer Ring road (ORR) Tamil Nadu 29.7 2012 Annuity Bid WonTotal 632.3 Source: Company, ICICIdirect.com Research
6 | P a g e
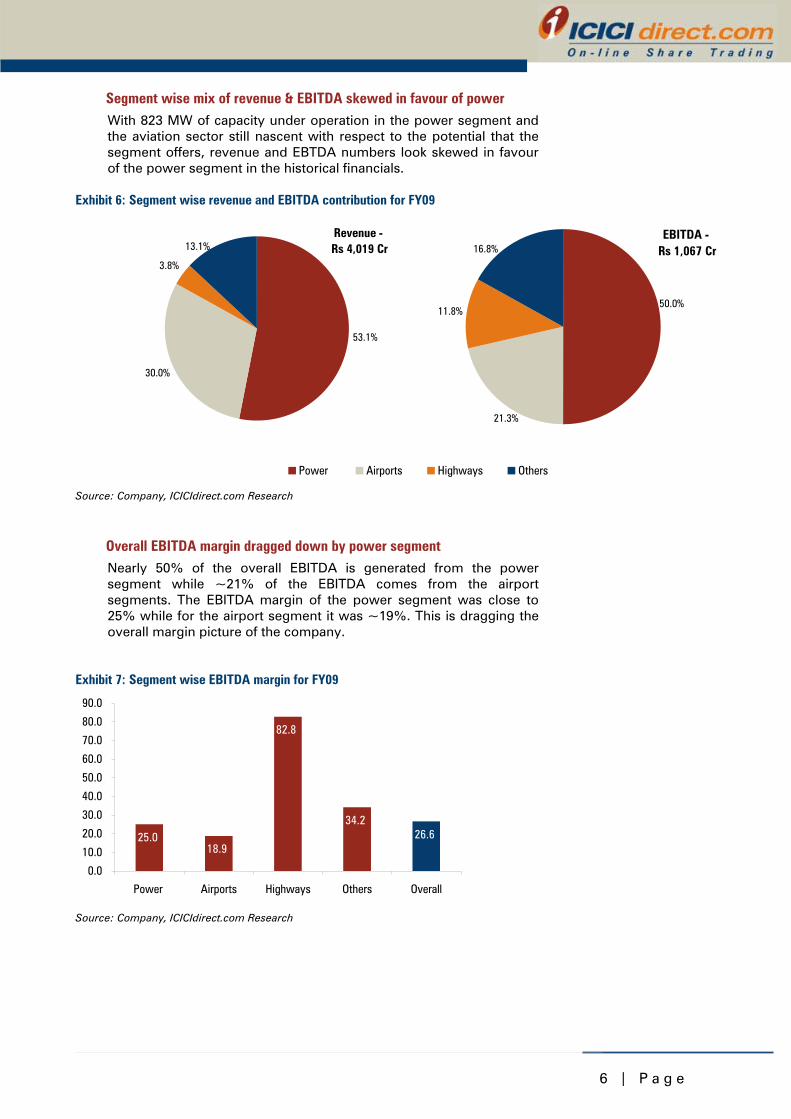
Segment wise mix of revenue & EBITDA skewed in favour of power With 823 MW of capacity under operation in the power segment and the aviation sector still nascent with respect to the potential that the segment offers, revenue and EBTDA numbers look skewed in favour of the power segment in the historical financials.
Exhibit 6: Segment wise revenue and EBITDA contribution for FY09
Revenue - Rs 4,019 Cr
53.1%
30.0%
3.8%
13.1%EBITDA -
Rs 1,067 Cr
11.8%
21.3%
16.8%
50.0%
Power Airports Highways Others
Source: Company, ICICIdirect.com Research
Overall EBITDA margin dragged down by power segment Nearly 50% of the overall EBITDA is generated from the power segment while ~21% of the EBITDA comes from the airport segments. The EBITDA margin of the power segment was close to 25% while for the airport segment it was ~19%. This is dragging the overall margin picture of the company.
Exhibit 7: Segment wise EBITDA margin for FY09
25.018.9
34.226.6
82.8
0.0
10.0
20.0
30.0
40.0
50.0
60.0
70.0
80.0
90.0
Power Airports Highways Others Overall
Source: Company, ICICIdirect.com Research
7 | P a g e
Investment Rationale
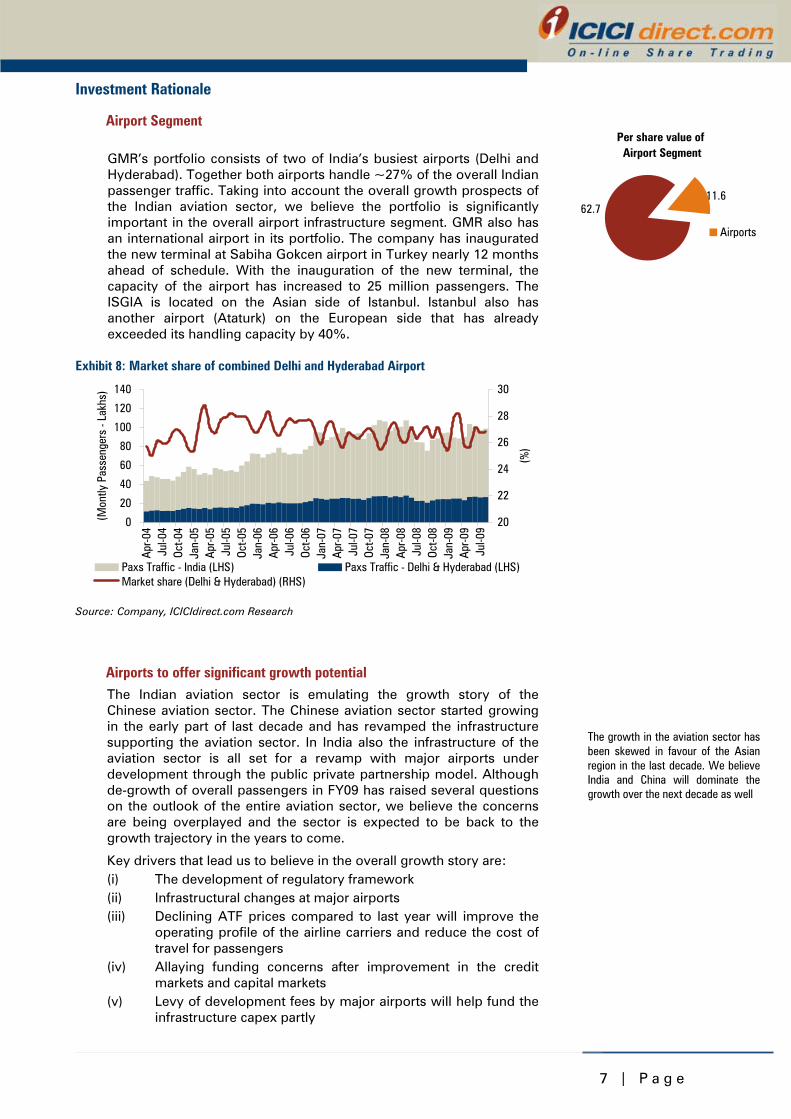
Airport Segment GMR’s portfolio consists of two of India’s busiest airports (Delhi and Hyderabad). Together both airports handle ~27% of the overall Indian passenger traffic. Taking into account the overall growth prospects of the Indian aviation sector, we believe the portfolio is significantly important in the overall airport infrastructure segment. GMR also has an international airport in its portfolio. The company has inaugurated the new terminal at Sabiha Gokcen airport in Turkey nearly 12 months ahead of schedule. With the inauguration of the new terminal, the capacity of the airport has increased to 25 million passengers. The ISGIA is located on the Asian side of Istanbul. Istanbul also has another airport (Ataturk) on the European side that has already exceeded its handling capacity by 40%.
Exhibit 8: Market share of combined Delhi and Hyderabad Airport
0
20
40
60
80
100
120
140
Apr-0
4Ju
l-04
Oct-0
4Ja
n-05
Apr-0
5Ju
l-05
Oct-0
5Ja
n-06
Apr-0
6Ju
l-06
Oct-0
6Ja
n-07
Apr-0
7Ju
l-07
Oct-0
7Ja
n-08
Apr-0
8Ju
l-08
Oct-0
8Ja
n-09
Apr-0
9Ju
l-09
(Mon
tly P
asse
nger
s - L
akhs
)
20
22
24
26
28
30
(%)
Paxs Traffic - India (LHS) Paxs Traffic - Delhi & Hyderabad (LHS)Market share (Delhi & Hyderabad) (RHS)
Source: Company, ICICIdirect.com Research
Airports to offer significant growth potential The Indian aviation sector is emulating the growth story of the Chinese aviation sector. The Chinese aviation sector started growing in the early part of last decade and has revamped the infrastructure supporting the aviation sector. In India also the infrastructure of the aviation sector is all set for a revamp with major airports under development through the public private partnership model. Although de-growth of overall passengers in FY09 has raised several questions on the outlook of the entire aviation sector, we believe the concerns are being overplayed and the sector is expected to be back to the growth trajectory in the years to come.
Key drivers that lead us to believe in the overall growth story are: (i) The development of regulatory framework (ii) Infrastructural changes at major airports (iii) Declining ATF prices compared to last year will improve the
operating profile of the airline carriers and reduce the cost of travel for passengers
(iv) Allaying funding concerns after improvement in the credit markets and capital markets
(v) Levy of development fees by major airports will help fund the infrastructure capex partly
Per share value of Airport Segment
11.662.7
Airports
The growth in the aviation sector has been skewed in favour of the Asian region in the last decade. We believe India and China will dominate the growth over the next decade as well
8 | P a g e
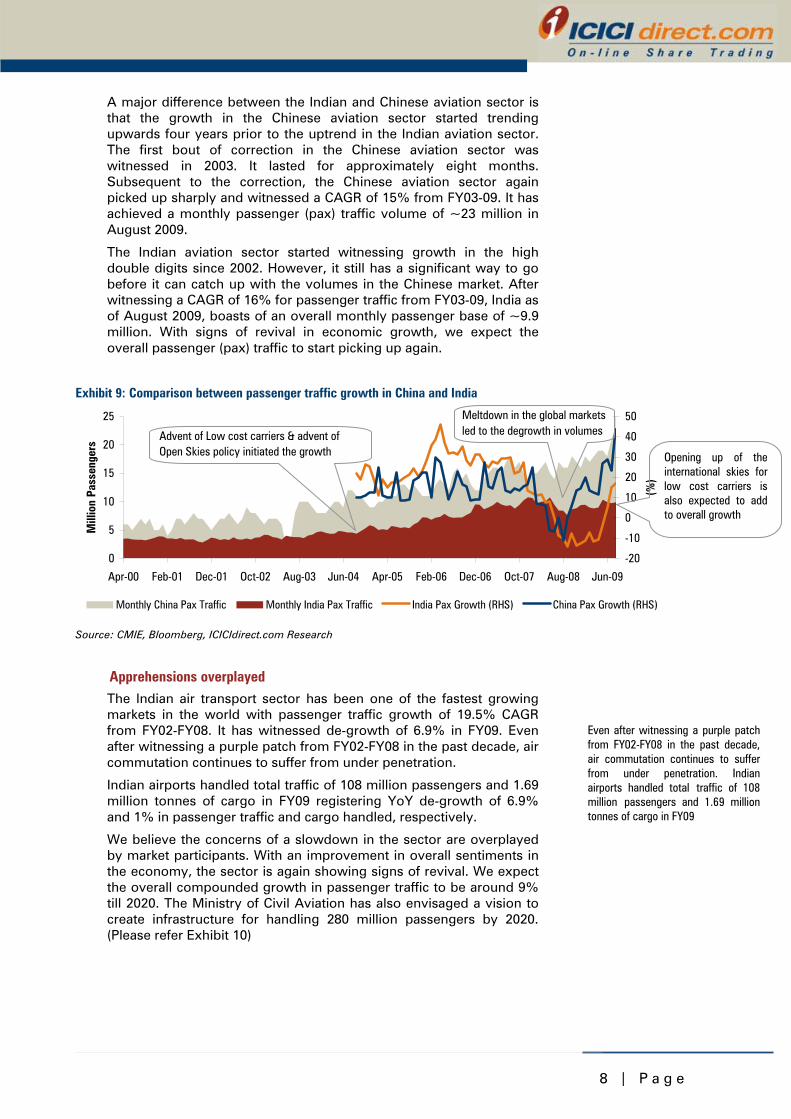
A major difference between the Indian and Chinese aviation sector is that the growth in the Chinese aviation sector started trending upwards four years prior to the uptrend in the Indian aviation sector. The first bout of correction in the Chinese aviation sector was witnessed in 2003. It lasted for approximately eight months. Subsequent to the correction, the Chinese aviation sector again picked up sharply and witnessed a CAGR of 15% from FY03-09. It has achieved a monthly passenger (pax) traffic volume of ~23 million in August 2009.
The Indian aviation sector started witnessing growth in the high double digits since 2002. However, it still has a significant way to go before it can catch up with the volumes in the Chinese market. After witnessing a CAGR of 16% for passenger traffic from FY03-09, India as of August 2009, boasts of an overall monthly passenger base of ~9.9 million. With signs of revival in economic growth, we expect the overall passenger (pax) traffic to start picking up again.
Exhibit 9: Comparison between passenger traffic growth in China and India
0
5
10
15
20
25
Apr-00 Feb-01 Dec-01 Oct-02 Aug-03 Jun-04 Apr-05 Feb-06 Dec-06 Oct-07 Aug-08 Jun-09
Mill
ion
Pass
enge
rs
-20
-10
0
10
20
30
40
50
(%)
Monthly China Pax Traffic Monthly India Pax Traffic India Pax Growth (RHS) China Pax Growth (RHS)
Advent of Low cost carriers & advent of Open Skies policy initiated the growth
Meltdown in the global markets led to the degrowth in volumes
Source: CMIE, Bloomberg, ICICIdirect.com Research
Apprehensions overplayed The Indian air transport sector has been one of the fastest growing markets in the world with passenger traffic growth of 19.5% CAGR from FY02-FY08. It has witnessed de-growth of 6.9% in FY09. Even after witnessing a purple patch from FY02-FY08 in the past decade, air commutation continues to suffer from under penetration.
Indian airports handled total traffic of 108 million passengers and 1.69 million tonnes of cargo in FY09 registering YoY de-growth of 6.9% and 1% in passenger traffic and cargo handled, respectively.
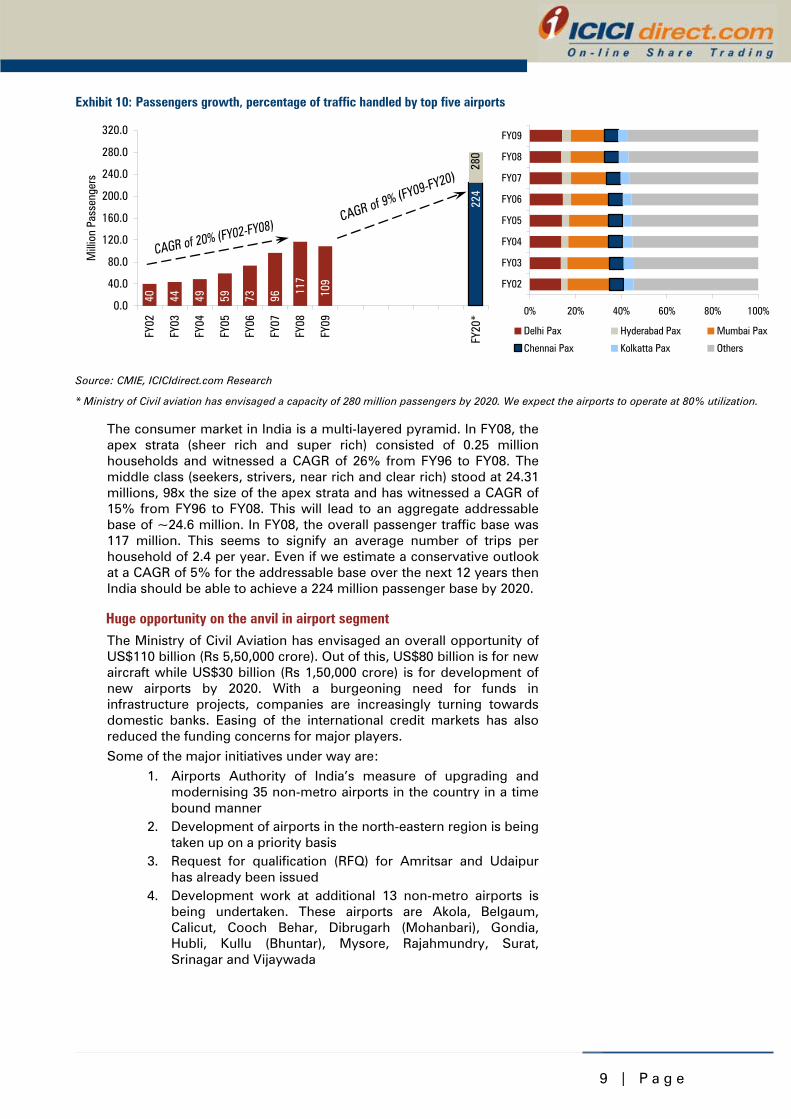
We believe the concerns of a slowdown in the sector are overplayed by market participants. With an improvement in overall sentiments in the economy, the sector is again showing signs of revival. We expect the overall compounded growth in passenger traffic to be around 9% till 2020. The Ministry of Civil Aviation has also envisaged a vision to create infrastructure for handling 280 million passengers by 2020. (Please refer Exhibit 10)
Even after witnessing a purple patch from FY02-FY08 in the past decade, air commutation continues to suffer from under penetration. Indian airports handled total traffic of 108 million passengers and 1.69 million tonnes of cargo in FY09
Opening up of the international skies for low cost carriers is also expected to add to overall growth
9 | P a g e
Exhibit 10: Passengers growth, percentage of traffic handled by top five airports
40 44 59 96 109
49 73
117
224
0.0
40.0
80.0
120.0
160.0
200.0
240.0
280.0
320.0
FY02
FY03
FY04
FY05
FY06
FY07
FY08
FY09
FY20
*
Mill
ion
Pass
enge
rs
280
0% 20% 40% 60% 80% 100%
FY02
FY03
FY04
FY05
FY06
FY07
FY08
FY09
Delhi Pax Hyderabad Pax Mumbai Pax
Chennai Pax Kolkatta Pax Others
Source: CMIE, ICICIdirect.com Research
* Ministry of Civil aviation has envisaged a capacity of 280 million passengers by 2020. We expect the airports to operate at 80% utilization.
The consumer market in India is a multi-layered pyramid. In FY08, the apex strata (sheer rich and super rich) consisted of 0.25 million households and witnessed a CAGR of 26% from FY96 to FY08. The middle class (seekers, strivers, near rich and clear rich) stood at 24.31 millions, 98x the size of the apex strata and has witnessed a CAGR of 15% from FY96 to FY08. This will lead to an aggregate addressable base of ~24.6 million. In FY08, the overall passenger traffic base was 117 million. This seems to signify an average number of trips per household of 2.4 per year. Even if we estimate a conservative outlook at a CAGR of 5% for the addressable base over the next 12 years then India should be able to achieve a 224 million passenger base by 2020.
Huge opportunity on the anvil in airport segment The Ministry of Civil Aviation has envisaged an overall opportunity of US$110 billion (Rs 5,50,000 crore). Out of this, US$80 billion is for new aircraft while US$30 billion (Rs 1,50,000 crore) is for development of new airports by 2020. With a burgeoning need for funds in infrastructure projects, companies are increasingly turning towards domestic banks. Easing of the international credit markets has also reduced the funding concerns for major players. Some of the major initiatives under way are:
1. Airports Authority of India’s measure of upgrading and modernising 35 non-metro airports in the country in a time bound manner
2. Development of airports in the north-eastern region is being taken up on a priority basis
3. Request for qualification (RFQ) for Amritsar and Udaipur has already been issued
4. Development work at additional 13 non-metro airports is being undertaken. These airports are Akola, Belgaum, Calicut, Cooch Behar, Dibrugarh (Mohanbari), Gondia, Hubli, Kullu (Bhuntar), Mysore, Rajahmundry, Surat, Srinagar and Vijaywada
1 0 | P a g e
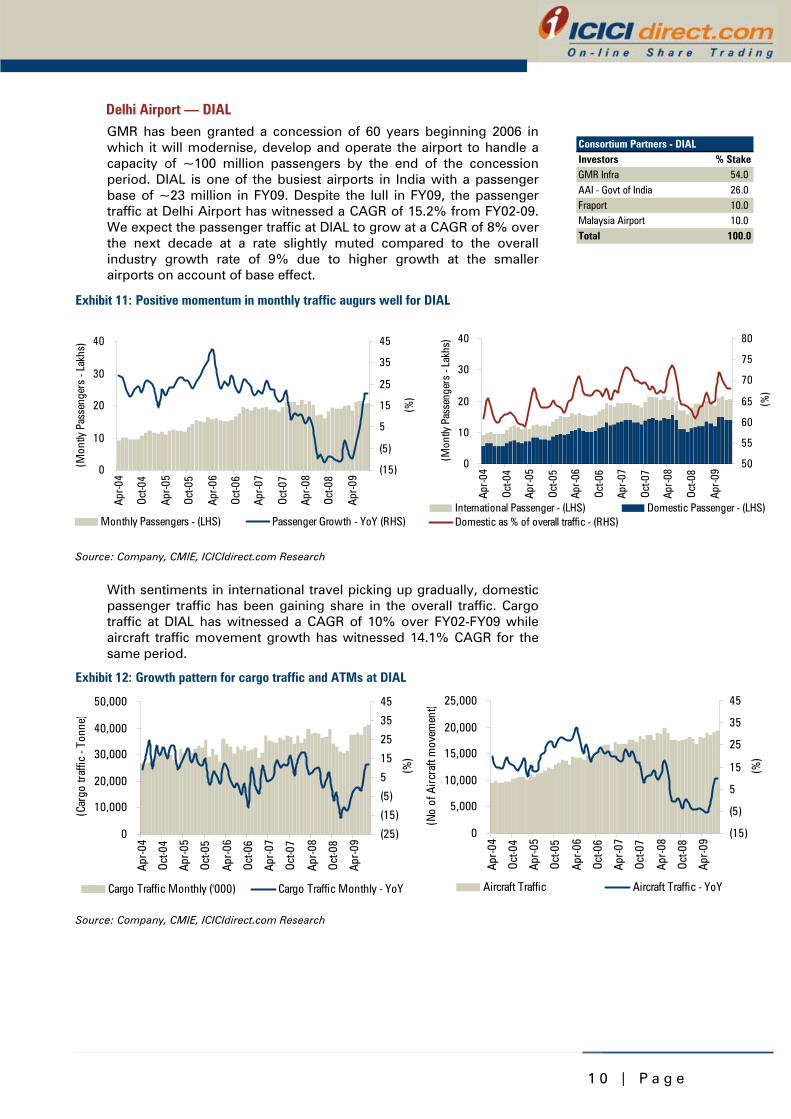
Delhi Airport — DIAL GMR has been granted a concession of 60 years beginning 2006 in which it will modernise, develop and operate the airport to handle a capacity of ~100 million passengers by the end of the concession period. DIAL is one of the busiest airports in India with a passenger base of ~23 million in FY09. Despite the lull in FY09, the passenger traffic at Delhi Airport has witnessed a CAGR of 15.2% from FY02-09. We expect the passenger traffic at DIAL to grow at a CAGR of 8% over the next decade at a rate slightly muted compared to the overall industry growth rate of 9% due to higher growth at the smaller airports on account of base effect.
Exhibit 11: Positive momentum in monthly traffic augurs well for DIAL
0
10
20
30
40
Apr-0
4
Oct-0
4
Apr-0
5
Oct-0
5
Apr-0
6
Oct-0
6
Apr-0
7
Oct-0
7
Apr-0
8
Oct-0
8
Apr-0
9
(Mon
tly P
asse
nger
s - L
akhs
)
50
55
60
65
70
75
80
(%)
International Passenger - (LHS) Domestic Passenger - (LHS)Domestic as % of overall traffic - (RHS)
Source: Company, CMIE, ICICIdirect.com Research
With sentiments in international travel picking up gradually, domestic passenger traffic has been gaining share in the overall traffic. Cargo traffic at DIAL has witnessed a CAGR of 10% over FY02-FY09 while aircraft traffic movement growth has witnessed 14.1% CAGR for the same period.
Exhibit 12: Growth pattern for cargo traffic and ATMs at DIAL
0
10,000
20,000
30,000
40,000
50,000
Apr-0
4
Oct-0
4
Apr-0
5
Oct-0
5
Apr-0
6
Oct-0
6
Apr-0
7
Oct-0
7
Apr-0
8
Oct-0
8
Apr-0
9
(Car
go tr
affic
- To
nne )
(25)
(15)
(5)
5
15
25
35
45
(%)
Cargo Traffic Monthly ('000) Cargo Traffic Monthly - YoY
0
5,000
10,000
15,000
20,000
25,000
Apr-0
4
Oct-0
4
Apr-0
5
Oct-0
5
Apr-0
6
Oct-0
6
Apr-0
7
Oct-0
7
Apr-0
8
Oct-0
8
Apr-0
9
(No
of A
ircra
ft m
ovem
ent)
(15)
(5)
5
15
25
35
45
(%)
Aircraft Traffic Aircraft Traffic - YoY
Source: Company, CMIE, ICICIdirect.com Research
0
10
20
30
40
Apr-0
4
Oct-0
4
Apr-0
5
Oct-0
5
Apr-0
6
Oct-0
6
Apr-0
7
Oct-0
7
Apr-0
8
Oct-0
8
Apr-0
9
(Mon
tly P
asse
nger
s - L
akhs
)
(15)
(5)
5
15
25
35
45
(%)
Monthly Passengers - (LHS) Passenger Growth - YoY (RHS)
Consortium Partners - DIALInvestors % StakeGMR Infra 54.0AAI - Govt of India 26.0Fraport 10.0Malaysia Airport 10.0Total 100.0
1 1 | P a g e
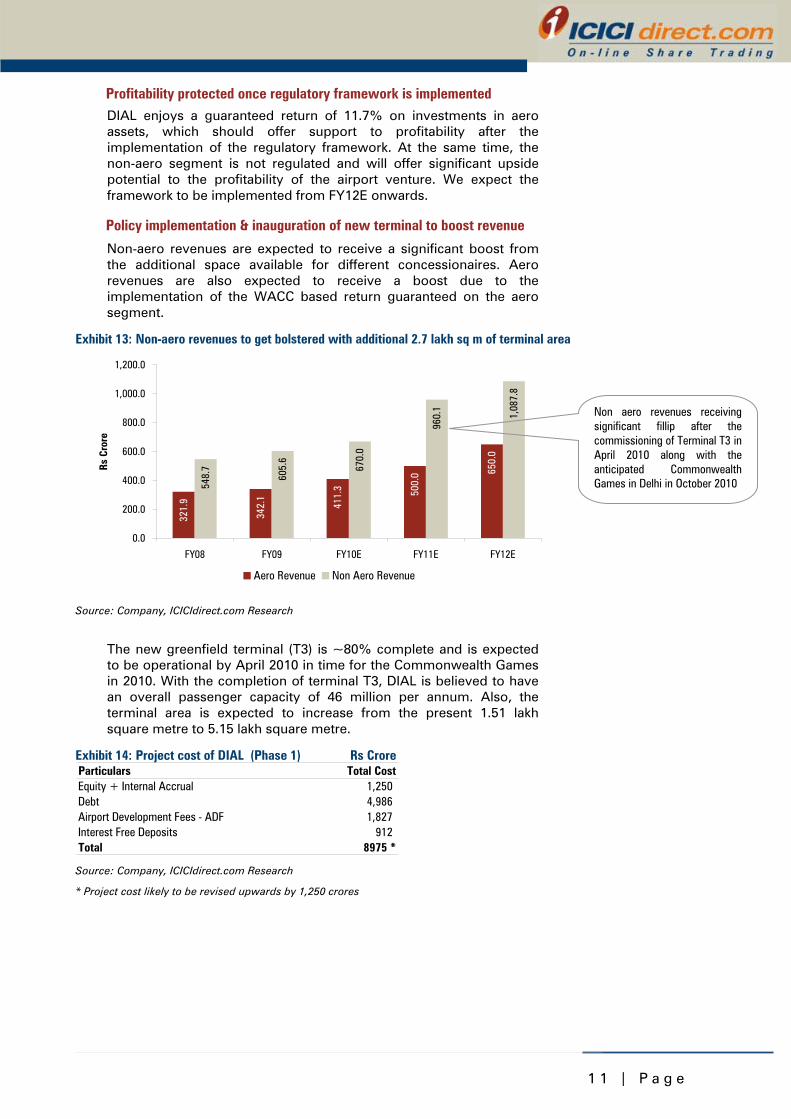
Profitability protected once regulatory framework is implemented DIAL enjoys a guaranteed return of 11.7% on investments in aero assets, which should offer support to profitability after the implementation of the regulatory framework. At the same time, the non-aero segment is not regulated and will offer significant upside potential to the profitability of the airport venture. We expect the framework to be implemented from FY12E onwards.
Policy implementation & inauguration of new terminal to boost revenue
Non-aero revenues are expected to receive a significant boost from the additional space available for different concessionaires. Aero revenues are also expected to receive a boost due to the implementation of the WACC based return guaranteed on the aero segment.
Exhibit 13: Non-aero revenues to get bolstered with additional 2.7 lakh sq m of terminal area
321.
9
342.
1
411.
3 500.
0 650.
0
548.
7
605.
6
670.
0
960.
1
1,08
7.8
0.0
200.0
400.0
600.0
800.0
1,000.0
1,200.0
FY08 FY09 FY10E FY11E FY12E
Rs C
rore
Aero Revenue Non Aero Revenue
Source: Company, ICICIdirect.com Research
The new greenfield terminal (T3) is ~80% complete and is expected to be operational by April 2010 in time for the Commonwealth Games in 2010. With the completion of terminal T3, DIAL is believed to have an overall passenger capacity of 46 million per annum. Also, the terminal area is expected to increase from the present 1.51 lakh square metre to 5.15 lakh square metre.
Exhibit 14: Project cost of DIAL (Phase 1) Rs Crore Particulars Total CostEquity + Internal Accrual 1,250Debt 4,986Airport Development Fees - ADF 1,827Interest Free Deposits 912Total 8975 * Source: Company, ICICIdirect.com Research
* Project cost likely to be revised upwards by 1,250 crores
Non aero revenues receiving significant fillip after the commissioning of Terminal T3 in April 2010 along with the anticipated Commonwealth Games in Delhi in October 2010
1 2 | P a g e
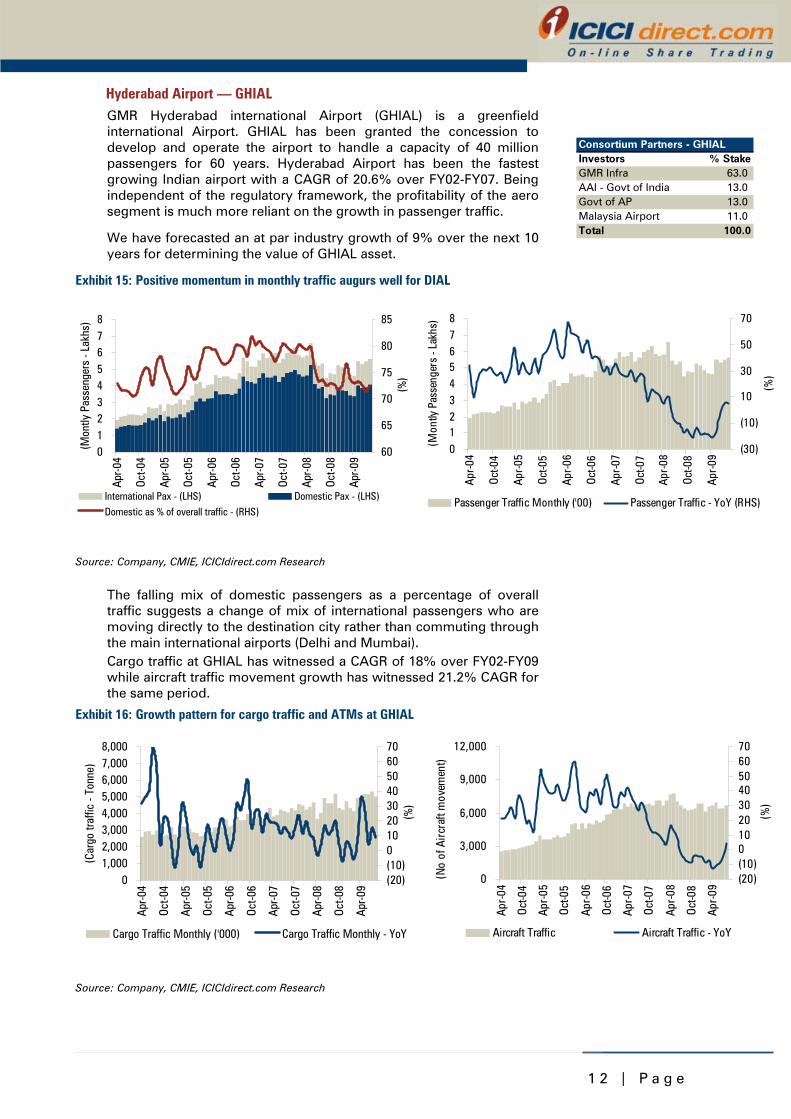
Hyderabad Airport — GHIAL GMR Hyderabad international Airport (GHIAL) is a greenfield international Airport. GHIAL has been granted the concession to develop and operate the airport to handle a capacity of 40 million passengers for 60 years. Hyderabad Airport has been the fastest growing Indian airport with a CAGR of 20.6% over FY02-FY07. Being independent of the regulatory framework, the profitability of the aero segment is much more reliant on the growth in passenger traffic.
We have forecasted an at par industry growth of 9% over the next 10 years for determining the value of GHIAL asset.
Exhibit 15: Positive momentum in monthly traffic augurs well for DIAL
012345678
Apr-0
4
Oct-0
4
Apr-0
5
Oct-0
5
Apr-0
6
Oct-0
6
Apr-0
7
Oct-0
7
Apr-0
8
Oct-0
8
Apr-0
9
(Mon
tly P
asse
nger
s - L
akhs
)
60
65
70
75
80
85
(%)
International Pax - (LHS) Domestic Pax - (LHS)Domestic as % of overall traffic - (RHS)
Source: Company, CMIE, ICICIdirect.com Research
The falling mix of domestic passengers as a percentage of overall traffic suggests a change of mix of international passengers who are moving directly to the destination city rather than commuting through the main international airports (Delhi and Mumbai). Cargo traffic at GHIAL has witnessed a CAGR of 18% over FY02-FY09 while aircraft traffic movement growth has witnessed 21.2% CAGR for the same period.
Exhibit 16: Growth pattern for cargo traffic and ATMs at GHIAL
01,0002,0003,0004,0005,0006,0007,0008,000
Apr-0
4
Oct-0
4
Apr-0
5
Oct-0
5
Apr-0
6
Oct-0
6
Apr-0
7
Oct-0
7
Apr-0
8
Oct-0
8
Apr-0
9
(Car
go tr
affic
- To
nne)
(20)(10)010203040506070
(%)
Cargo Traffic Monthly ('000) Cargo Traffic Monthly - YoY
Source: Company, CMIE, ICICIdirect.com Research
Consortium Partners - GHIALInvestors % StakeGMR Infra 63.0AAI - Govt of India 13.0Govt of AP 13.0Malaysia Airport 11.0Total 100.0
012345678
Apr-0
4
Oct-0
4
Apr-0
5
Oct-0
5
Apr-0
6
Oct-0
6
Apr-0
7
Oct-0
7
Apr-0
8
Oct-0
8
Apr-0
9
(Mon
tly P
asse
nger
s - L
akhs
)(30)
(10)
10
30
50
70
(%)
Passenger Traffic Monthly ('00) Passenger Traffic - YoY (RHS)
0
3,000
6,000
9,000
12,000
Apr-0
4
Oct-0
4
Apr-0
5
Oct-0
5
Apr-0
6
Oct-0
6
Apr-0
7
Oct-0
7
Apr-0
8
Oct-0
8
Apr-0
9
(No
of A
ircra
ft m
ovem
ent)
(20)(10)010203040506070
(%)
Aircraft Traffic Aircraft Traffic - YoY
1 3 | P a g e
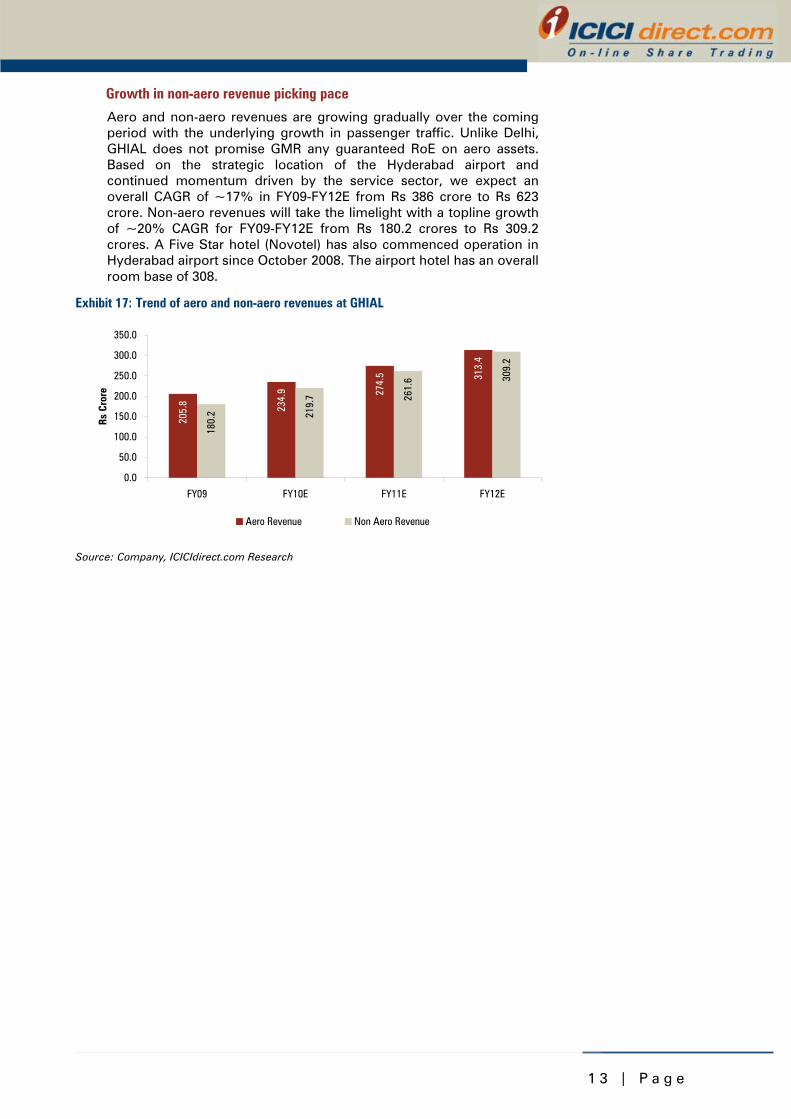
Growth in non-aero revenue picking pace
Aero and non-aero revenues are growing gradually over the coming period with the underlying growth in passenger traffic. Unlike Delhi, GHIAL does not promise GMR any guaranteed RoE on aero assets. Based on the strategic location of the Hyderabad airport and continued momentum driven by the service sector, we expect an overall CAGR of ~17% in FY09-FY12E from Rs 386 crore to Rs 623 crore. Non-aero revenues will take the limelight with a topline growth of ~20% CAGR for FY09-FY12E from Rs 180.2 crores to Rs 309.2 crores. A Five Star hotel (Novotel) has also commenced operation in Hyderabad airport since October 2008. The airport hotel has an overall room base of 308.
Exhibit 17: Trend of aero and non-aero revenues at GHIAL
205.
8 234.
9 274.
5 313.
4
180.
2 219.
7 261.
6 309.
2
0.0
50.0
100.0
150.0
200.0
250.0
300.0
350.0
FY09 FY10E FY11E FY12E
Rs C
rore
Aero Revenue Non Aero Revenue
Source: Company, ICICIdirect.com Research
1 4 | P a g e
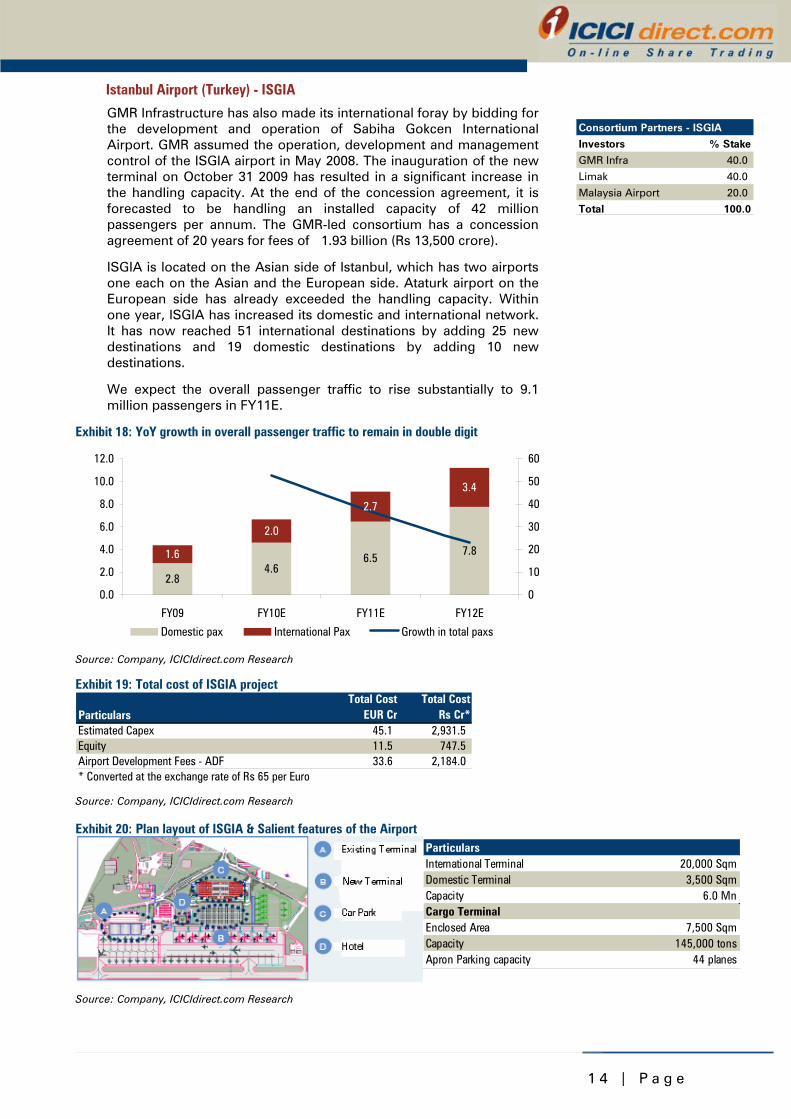
Istanbul Airport (Turkey) - ISGIA
GMR Infrastructure has also made its international foray by bidding for the development and operation of Sabiha Gokcen International Airport. GMR assumed the operation, development and management control of the ISGIA airport in May 2008. The inauguration of the new terminal on October 31 2009 has resulted in a significant increase in the handling capacity. At the end of the concession agreement, it is forecasted to be handling an installed capacity of 42 million passengers per annum. The GMR-led consortium has a concession agreement of 20 years for fees of �1.93 billion (Rs 13,500 crore).
ISGIA is located on the Asian side of Istanbul, which has two airports one each on the Asian and the European side. Ataturk airport on the European side has already exceeded the handling capacity. Within one year, ISGIA has increased its domestic and international network. It has now reached 51 international destinations by adding 25 new destinations and 19 domestic destinations by adding 10 new destinations.
We expect the overall passenger traffic to rise substantially to 9.1 million passengers in FY11E.
Exhibit 18: YoY growth in overall passenger traffic to remain in double digit
2.84.6
6.57.81.6
2.0
2.7
3.4
0.0
2.0
4.0
6.0
8.0
10.0
12.0
FY09 FY10E FY11E FY12E
0
10
20
30
40
50
60
Domestic pax International Pax Growth in total paxs
Source: Company, ICICIdirect.com Research
Exhibit 19: Total cost of ISGIA project
ParticularsTotal Cost
EUR CrTotal Cost
Rs Cr*Estimated Capex 45.1 2,931.5Equity 11.5 747.5Airport Development Fees - ADF 33.6 2,184.0* Converted at the exchange rate of Rs 65 per Euro Source: Company, ICICIdirect.com Research
Exhibit 20: Plan layout of ISGIA & Salient features of the Airport
Source: Company, ICICIdirect.com Research
Consortium Partners - ISGIA
Investors % Stake
GMR Infra 40.0
Limak 40.0
Malaysia Airport 20.0
Total 100.0
ParticularsInternational Terminal 20,000 SqmDomestic Terminal 3,500 SqmCapacity 6.0 MnCargo TerminalEnclosed Area 7,500 SqmCapacity 145,000 tonsApron Parking capacity 44 planes
1 5 | P a g e
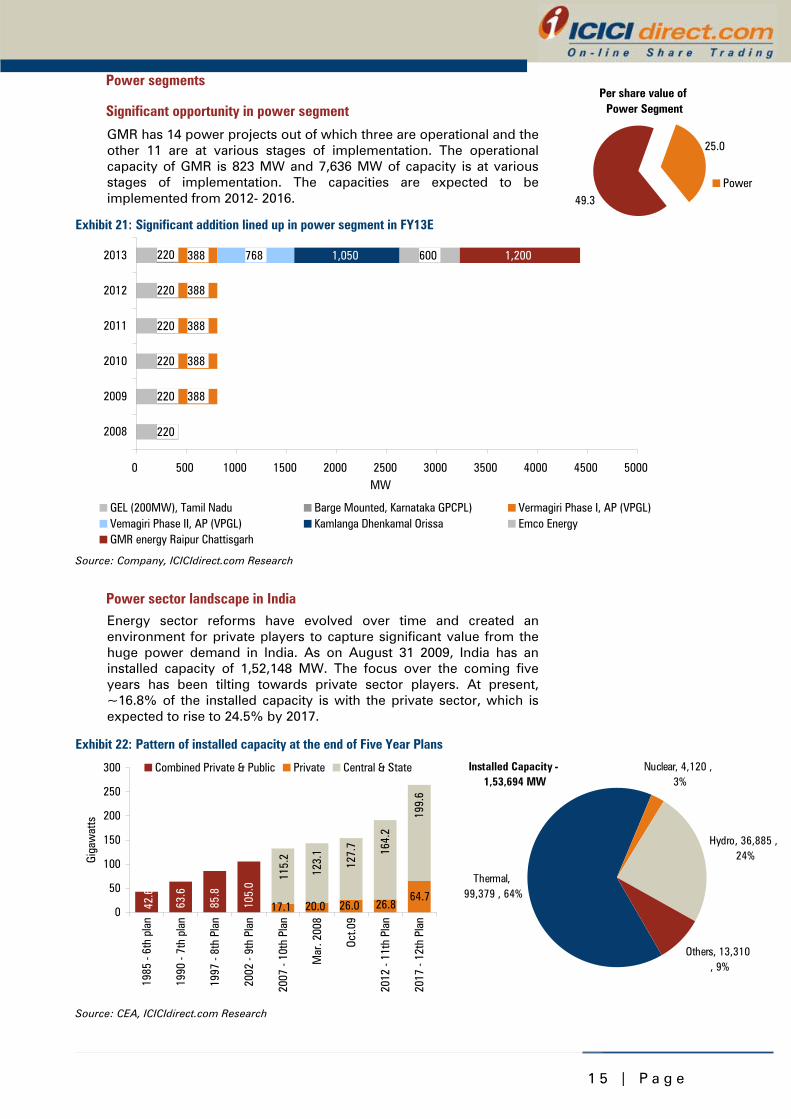
Power segments
Significant opportunity in power segment
GMR has 14 power projects out of which three are operational and the other 11 are at various stages of implementation. The operational capacity of GMR is 823 MW and 7,636 MW of capacity is at various stages of implementation. The capacities are expected to be implemented from 2012- 2016.
Exhibit 21: Significant addition lined up in power segment in FY13E
220
220
220
220
220
388
388
388
388
388 768 1,050 600 1,200220
0 500 1000 1500 2000 2500 3000 3500 4000 4500 5000
2008
2009
2010
2011
2012
2013
MW
GEL (200MW), Tamil Nadu Barge Mounted, Karnataka GPCPL) Vermagiri Phase I, AP (VPGL)Vemagiri Phase II, AP (VPGL) Kamlanga Dhenkamal Orissa Emco EnergyGMR energy Raipur Chattisgarh
Source: Company, ICICIdirect.com Research
Power sector landscape in India Energy sector reforms have evolved over time and created an environment for private players to capture significant value from the huge power demand in India. As on August 31 2009, India has an installed capacity of 1,52,148 MW. The focus over the coming five years has been tilting towards private sector players. At present, ~16.8% of the installed capacity is with the private sector, which is expected to rise to 24.5% by 2017.
Exhibit 22: Pattern of installed capacity at the end of Five Year Plans
199.
6
63.6
85.8
105.
0
42.6 64.7
26.020.017.1 26.8
123.
1
115.
2
127.
7 164.
2
0
50
100
150
200
250
300
1985
- 6t
h pl
an
1990
- 7t
h pl
an
1997
- 8t
h Pl
an
2002
- 9t
h Pl
an
2007
- 10
th P
lan
Mar
. 200
8
Oct.0
9
2012
- 11
th P
lan
2017
- 12
th P
lan
Giga
wat
ts
Combined Private & Public Private Central & State
Source: CEA, ICICIdirect.com Research
Per share value of Power Segment
49.3
25.0
Power
Installed Capacity - 1,53,694 MW
Thermal, 99,379 , 64%
Hydro, 36,885 ,24%
Others, 13,310 , 9%
Nuclear, 4,120 , 3%
1 6 | P a g e
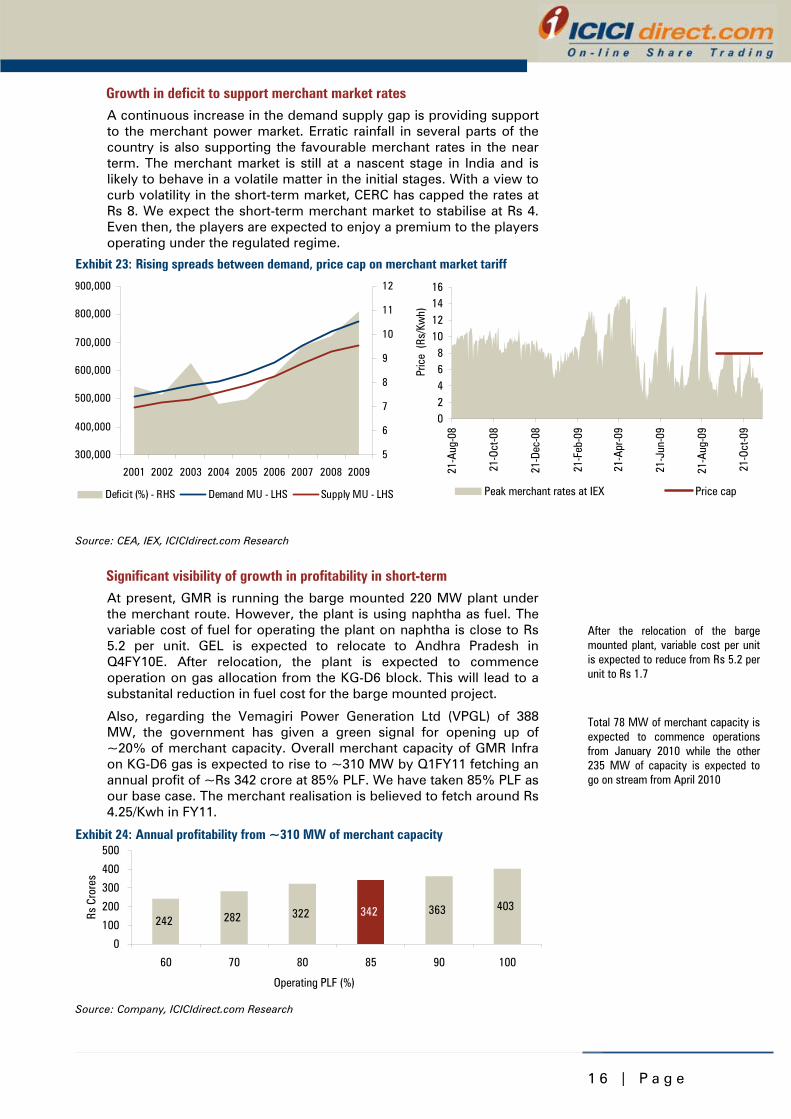
Growth in deficit to support merchant market rates A continuous increase in the demand supply gap is providing support to the merchant power market. Erratic rainfall in several parts of the country is also supporting the favourable merchant rates in the near term. The merchant market is still at a nascent stage in India and is likely to behave in a volatile matter in the initial stages. With a view to curb volatility in the short-term market, CERC has capped the rates at Rs 8. We expect the short-term merchant market to stabilise at Rs 4. Even then, the players are expected to enjoy a premium to the players operating under the regulated regime.
Exhibit 23: Rising spreads between demand, price cap on merchant market tariff
02468
10121416
21-A
ug-0
8
21-O
ct-0
8
21-D
ec-0
8
21-F
eb-0
9
21-A
pr-0
9
21-J
un-0
9
21-A
ug-0
9
21-O
ct-0
9
Pric
e (R
s/Kw
h)
Peak merchant rates at IEX Price cap
Source: CEA, IEX, ICICIdirect.com Research
Significant visibility of growth in profitability in short-term At present, GMR is running the barge mounted 220 MW plant under the merchant route. However, the plant is using naphtha as fuel. The variable cost of fuel for operating the plant on naphtha is close to Rs 5.2 per unit. GEL is expected to relocate to Andhra Pradesh in Q4FY10E. After relocation, the plant is expected to commence operation on gas allocation from the KG-D6 block. This will lead to a substanital reduction in fuel cost for the barge mounted project.
Also, regarding the Vemagiri Power Generation Ltd (VPGL) of 388 MW, the government has given a green signal for opening up of ~20% of merchant capacity. Overall merchant capacity of GMR Infra on KG-D6 gas is expected to rise to ~310 MW by Q1FY11 fetching an annual profit of ~Rs 342 crore at 85% PLF. We have taken 85% PLF as our base case. The merchant realisation is believed to fetch around Rs 4.25/Kwh in FY11.
Exhibit 24: Annual profitability from ~310 MW of merchant capacity
242 282 322 363 403342
0
100
200
300
400
500
60 70 80 85 90 100
Operating PLF (%)
Rs C
rore
s
Source: Company, ICICIdirect.com Research
300,000
400,000
500,000
600,000
700,000
800,000
900,000
2001 2002 2003 2004 2005 2006 2007 2008 2009
5
6
7
8
9
10
11
12
Deficit (%) - RHS Demand MU - LHS Supply MU - LHS
After the relocation of the barge mounted plant, variable cost per unit is expected to reduce from Rs 5.2 per unit to Rs 1.7
Total 78 MW of merchant capacity is expected to commence operations from January 2010 while the other 235 MW of capacity is expected to go on stream from April 2010
1 7 | P a g e
GMR unlocking value in the power segment over the next year GMR Infra has a significant pipeline in various stages of implementation and has progressively hedged its exposure to coal price fluctuations. We believe the company will look to raise funds by tapping the capital market through the IPO route in FY11E. This may result in a further upside to our valuation case.
Inorganic route to offer additional opportunity for growth GMR has been aggressive in the market and has already acquired full stake in EMCO Energy, which is setting up a 600 MW coal-based plant. The project has already achieved financial closure and is expected to commence construction by Q4FY10. The project is expected to witness commissioning in FY12-13.
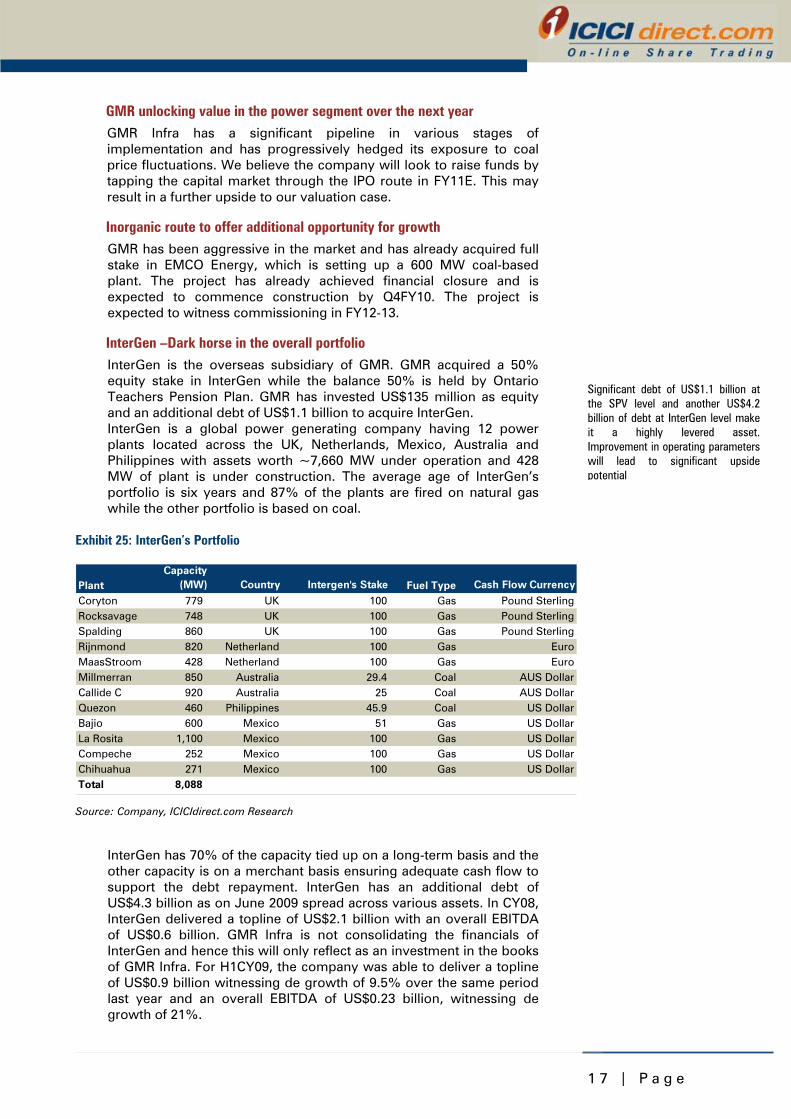
InterGen –Dark horse in the overall portfolio InterGen is the overseas subsidiary of GMR. GMR acquired a 50% equity stake in InterGen while the balance 50% is held by Ontario Teachers Pension Plan. GMR has invested US$135 million as equity and an additional debt of US$1.1 billion to acquire InterGen. InterGen is a global power generating company having 12 power plants located across the UK, Netherlands, Mexico, Australia and Philippines with assets worth ~7,660 MW under operation and 428 MW of plant is under construction. The average age of InterGen’s portfolio is six years and 87% of the plants are fired on natural gas while the other portfolio is based on coal.
Exhibit 25: InterGen’s Portfolio
PlantCapacity
(MW) Country Intergen's Stake Fuel Type Cash Flow Currency
Coryton 779 UK 100 Gas Pound SterlingRocksavage 748 UK 100 Gas Pound SterlingSpalding 860 UK 100 Gas Pound SterlingRijnmond 820 Netherland 100 Gas EuroMaasStroom ( 428 Netherland 100 Gas EuroMillmerran 850 Australia 29.4 Coal AUS DollarCallide C 920 Australia 25 Coal AUS DollarQuezon 460 Philippines 45.9 Coal US DollarBajio 600 Mexico 51 Gas US DollarLa Rosita 1,100 Mexico 100 Gas US DollarCompeche 252 Mexico 100 Gas US DollarChihuahua 271 Mexico 100 Gas US DollarTotal 8,088
Source: Company, ICICIdirect.com Research
InterGen has 70% of the capacity tied up on a long-term basis and the other capacity is on a merchant basis ensuring adequate cash flow to support the debt repayment. InterGen has an additional debt of US$4.3 billion as on June 2009 spread across various assets. In CY08, InterGen delivered a topline of US$2.1 billion with an overall EBITDA of US$0.6 billion. GMR Infra is not consolidating the financials of InterGen and hence this will only reflect as an investment in the books of GMR Infra. For H1CY09, the company was able to deliver a topline of US$0.9 billion witnessing de growth of 9.5% over the same period last year and an overall EBITDA of US$0.23 billion, witnessing de growth of 21%.
Significant debt of US$1.1 billion at the SPV level and another US$4.2 billion of debt at InterGen level make it a highly levered asset. Improvement in operating parameters will lead to significant upside potential

1 8 | P a g e
Island Power Corporation The GMR Group acquired a 100% stake in Island Power Singapore in May 2009 for ~US$10 million. On completion, the gas-based power plant will have an operational capacity of 800 MW. The company expects low cost gas linkage from Indonesia. Construction of the power plant is expected to commence in the fourth quarter of 2010.
1 9 | P a g e
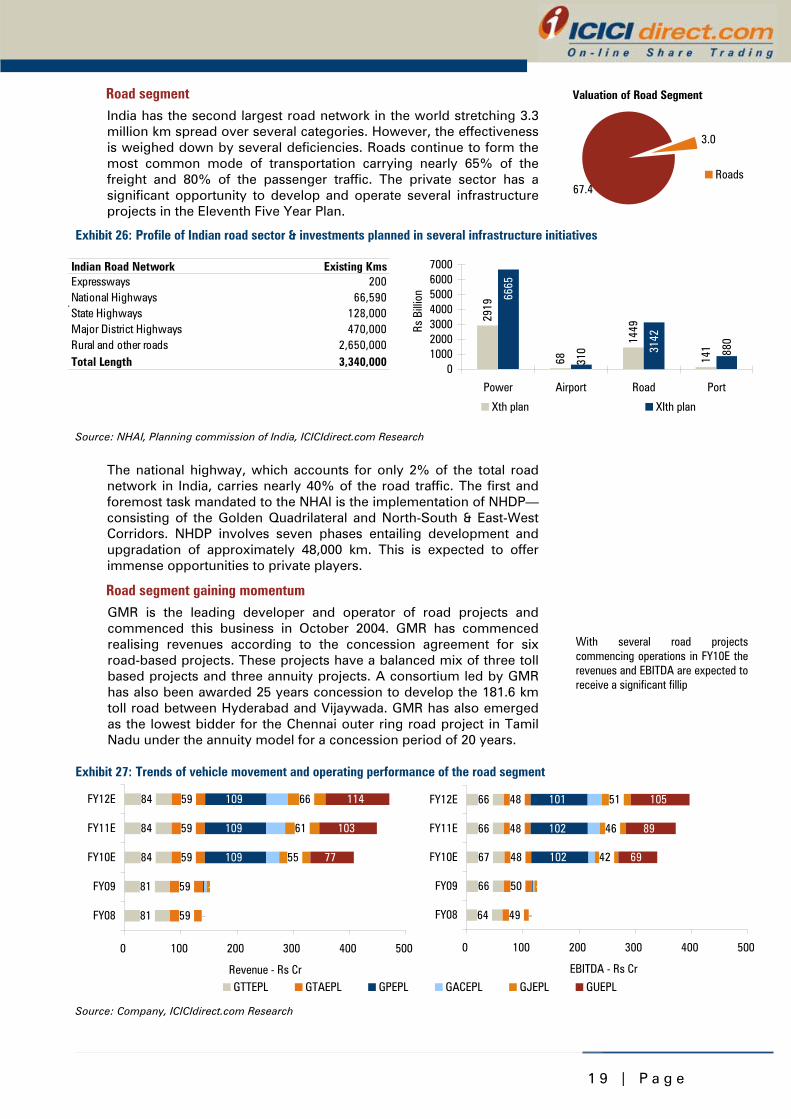
Road segment India has the second largest road network in the world stretching 3.3 million km spread over several categories. However, the effectiveness is weighed down by several deficiencies. Roads continue to form the most common mode of transportation carrying nearly 65% of the freight and 80% of the passenger traffic. The private sector has a significant opportunity to develop and operate several infrastructure projects in the Eleventh Five Year Plan.
Exhibit 26: Profile of Indian road sector & investments planned in several infrastructure initiatives
2919
68
1449
141
6665
3142
880
310
01000200030004000500060007000
Power Airport Road Port
Rs B
illio
nXth plan XIth plan
Source: NHAI, Planning commission of India, ICICIdirect.com Research
The national highway, which accounts for only 2% of the total road network in India, carries nearly 40% of the road traffic. The first and foremost task mandated to the NHAI is the implementation of NHDP— consisting of the Golden Quadrilateral and North-South & East-West Corridors. NHDP involves seven phases entailing development and upgradation of approximately 48,000 km. This is expected to offer immense opportunities to private players.
Road segment gaining momentum GMR is the leading developer and operator of road projects and commenced this business in October 2004. GMR has commenced realising revenues according to the concession agreement for six road-based projects. These projects have a balanced mix of three toll based projects and three annuity projects. A consortium led by GMR has also been awarded 25 years concession to develop the 181.6 km toll road between Hyderabad and Vijaywada. GMR has also emerged as the lowest bidder for the Chennai outer ring road project in Tamil Nadu under the annuity model for a concession period of 20 years.
Exhibit 27: Trends of vehicle movement and operating performance of the road segment
81
81
84
84
84
59
59
59
59
59
-
109
109
109
-
55
61
66
-
-
77
103
114
0 100 200 300 400 500
FY08
FY09
FY10E
FY11E
FY12E
Revenue - Rs Cr
64
66
67
66
66
49
50
48
48
48
-
102
102
101
-
42
46
51
-
-
69
89
105
0 100 200 300 400 500
FY08
FY09
FY10E
FY11E
FY12E
EBITDA - Rs Cr
GTTEPL GTAEPL GPEPL GACEPL GJEPL GUEPL Source: Company, ICICIdirect.com Research
With several road projects commencing operations in FY10E the revenues and EBITDA are expected to receive a significant fillip
Indian Road Network Existing KmsExpressways 200National Highways 66,590State Highways 128,000Major District Highways 470,000Rural and other roads 2,650,000Total Length 3,340,000
Valuation of Road Segment
3.0
67.4Roads
2 0 | P a g e
Real estate segment
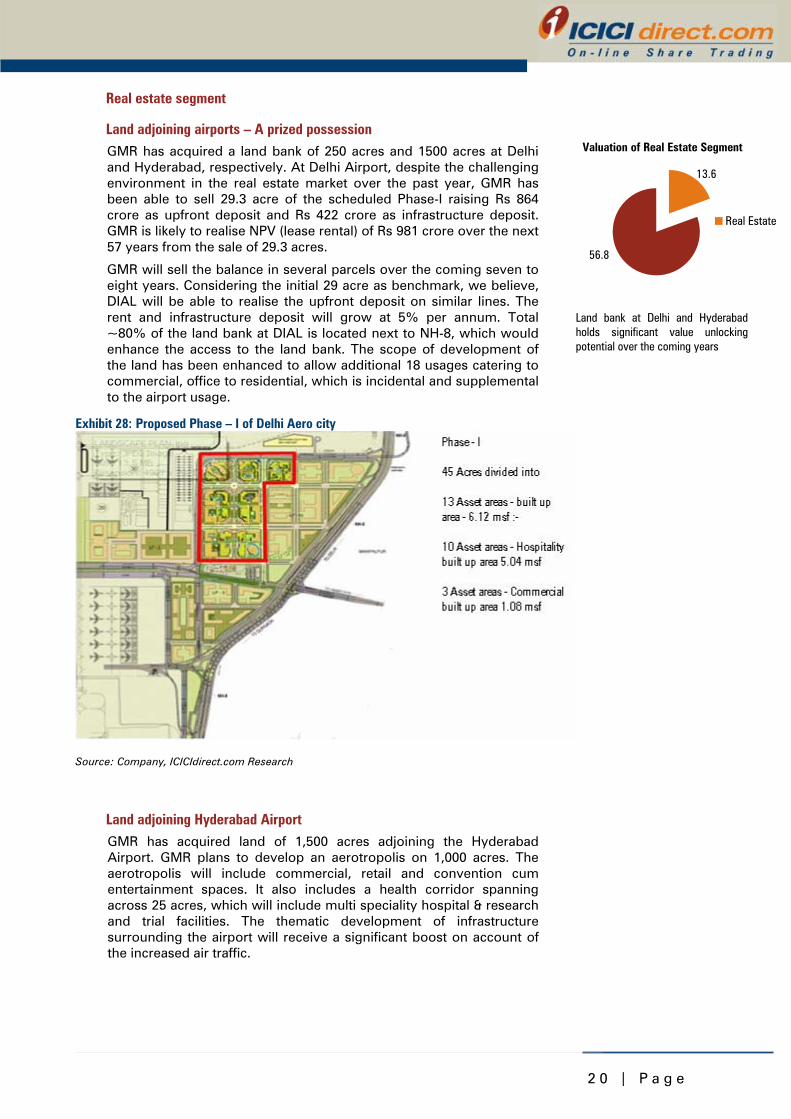
Land adjoining airports – A prized possession GMR has acquired a land bank of 250 acres and 1500 acres at Delhi and Hyderabad, respectively. At Delhi Airport, despite the challenging environment in the real estate market over the past year, GMR has been able to sell 29.3 acre of the scheduled Phase-I raising Rs 864 crore as upfront deposit and Rs 422 crore as infrastructure deposit. GMR is likely to realise NPV (lease rental) of Rs 981 crore over the next 57 years from the sale of 29.3 acres.
GMR will sell the balance in several parcels over the coming seven to eight years. Considering the initial 29 acre as benchmark, we believe, DIAL will be able to realise the upfront deposit on similar lines. The rent and infrastructure deposit will grow at 5% per annum. Total ~80% of the land bank at DIAL is located next to NH-8, which would enhance the access to the land bank. The scope of development of the land has been enhanced to allow additional 18 usages catering to commercial, office to residential, which is incidental and supplemental to the airport usage.
Exhibit 28: Proposed Phase – I of Delhi Aero city
Source: Company, ICICIdirect.com Research
Land adjoining Hyderabad Airport GMR has acquired land of 1,500 acres adjoining the Hyderabad Airport. GMR plans to develop an aerotropolis on 1,000 acres. The aerotropolis will include commercial, retail and convention cum entertainment spaces. It also includes a health corridor spanning across 25 acres, which will include multi speciality hospital & research and trial facilities. The thematic development of infrastructure surrounding the airport will receive a significant boost on account of the increased air traffic.
Valuation of Real Estate Segment
13.6
56.8
Real Estate
Land bank at Delhi and Hyderabad holds significant value unlocking potential over the coming years
2 1 | P a g e
Aviation & logistic SEZ Out of the remaining land of 500 acres at the Hyderabad Airport, GMR plans to develop a logistics and aviation SEZ spanning 250 acres each. GMR has signed a JV agreement with Malaysian Airlines to set up a maintenance repair & overhauling (MRO) facility spanning across 25 acres. GMR has also signed an agreement with CFM, a French multinational, to set up an aviation training school. The increase in fleet utilisation by existing carriers and the probable expansion of aircraft fleets with the growing traffic augurs well for the proposed MRO facility in Hyderabad. GMR is also looking at setting up a 250-acre multi-produce SEZ of logistics.
Krishnagiri SEZ GMR has entered into an MoU with Tamil Nadu Industrial Development Corporation (TIDCO) for development of a multi-product SEZ. GMR plans to develop 3,300 acres focusing on biotechnology, IT & ITeS, electronic and engineering industries. The proximity of Krishnagiri district to Bangalore (IT hub) and Hosur (automobile industry hub) will support the overall demand for the SEZ.
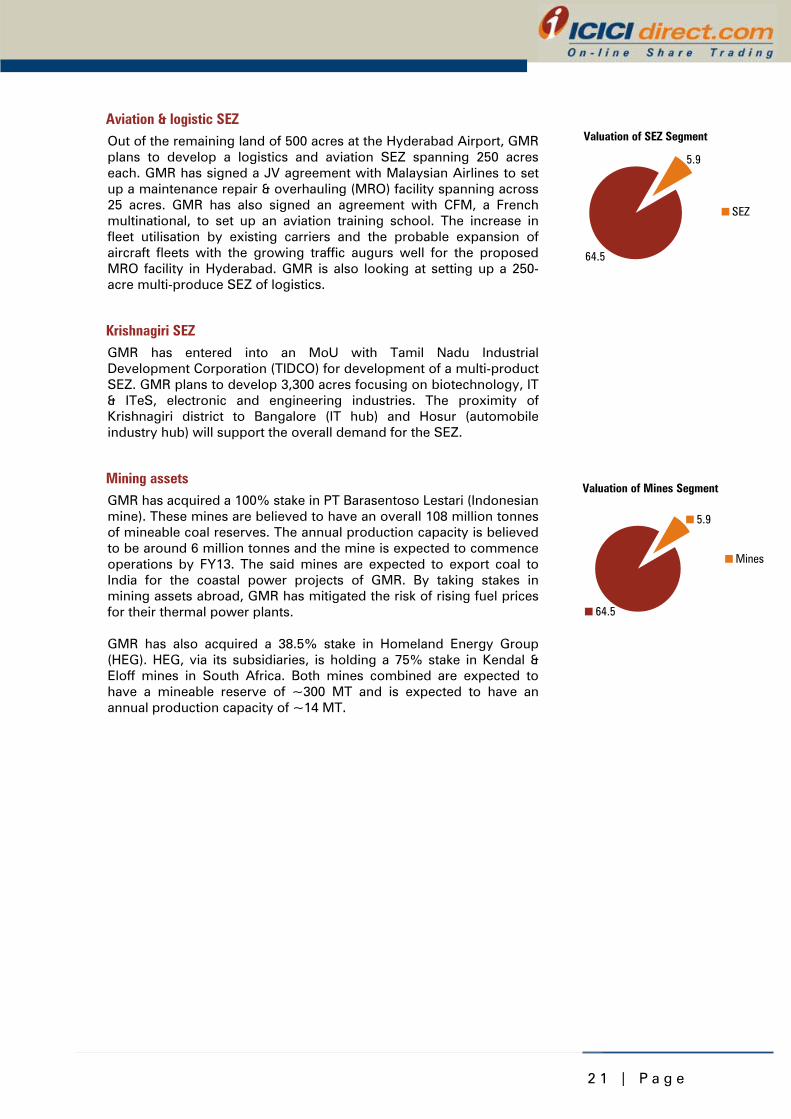
Mining assets GMR has acquired a 100% stake in PT Barasentoso Lestari (Indonesian mine). These mines are believed to have an overall 108 million tonnes of mineable coal reserves. The annual production capacity is believed to be around 6 million tonnes and the mine is expected to commence operations by FY13. The said mines are expected to export coal to India for the coastal power projects of GMR. By taking stakes in mining assets abroad, GMR has mitigated the risk of rising fuel prices for their thermal power plants. GMR has also acquired a 38.5% stake in Homeland Energy Group (HEG). HEG, via its subsidiaries, is holding a 75% stake in Kendal & Eloff mines in South Africa. Both mines combined are expected to have a mineable reserve of ~300 MT and is expected to have an annual production capacity of ~14 MT.
Valuation of SEZ Segment
64.5
5.9
SEZ
Valuation of Mines Segment
5.9
64.5
Mines
2 2 | P a g e
Risks & Concerns
Adverse regulatory developments may impact operations GMR has interests in several business sectors that are regulated in nature. Any disappointing amendment of the regulatory framework may impact the operating performance of the company. The regulations of the aviation sector are at the formulation stage. The delay in implementation of the new regulatory framework may adversely impact the revenues of the airport segment.
Operation and expansion of power project linked to fuel availability The commencement of gas from Reliance KG-D6 block has assured a regular supply of fuel for existing plants. However, any disruption could result in the operating performance getting impacted. GMR has significant gas-based expansion plans in Andhra Pradesh. Non-availability of fuel may significantly impair the position of the company.
Delay in implementation of order selling 20% capacity on merchant Delay in implementation of the order for selling around ~78 MW of capacity on a merchant basis is pending with the regulator. The delay in implementation will result in GMR losing out on the opportunity to capitalise on high merchant power tariff.
Cash flows to remain choppy Short-term cash flows are dependent on real estate projects ancillary to the airport segment. Since the company is in the capital expenditure phase, the company needs to generate significant cash flows from real estate deposits in order to meet future funding requirements.
Execution risk GMR is aggressively pursuing growth opportunities in all verticals in which it has a presence. The company is heavily reliant on Chinese vendors for executing power projects on time. Any adverse development may delay the execution of the project pipeline. However, GMR has an excellent track record of delivering projects on time in the past. This may mitigate the execution risk to some extent.
Funding risk for the expansion plans GMR has an aggressive expansion plans with the overall capex requirement to the tune of ~Rs 26,700 crores over the next three years. GMR will have to tap the markets for raising another round of equity either at the parent level or at the SPV level.
Implementation of direct tax code without any alteration to be negative GMR Infra enjoys tax benefits under major segments. After the implantation of the direct tax code the liability of GMR is expected to rise. This is because the government in the draft copy has proposed MAT on the gross asset base compared to the existing tax computation, which is based on book profitability.
Consolidation of Intergen books will lead to significant leverage GMR Infra is not consolidating the books of InterGen in the accounts of GMR Infra. If the company starts consolidating the books with InterGen then the additional leverage of US$4.2 billion at the InterGen level will start reflecting in the books of GMR Infra and spoil the debt coverage ratios.
Delay in the implementation of the order to sell power in the merchant market will lead to losing out an opportunity to take advantage of the high merchant tariffs in the near term.
2 3 | P a g e
Financials
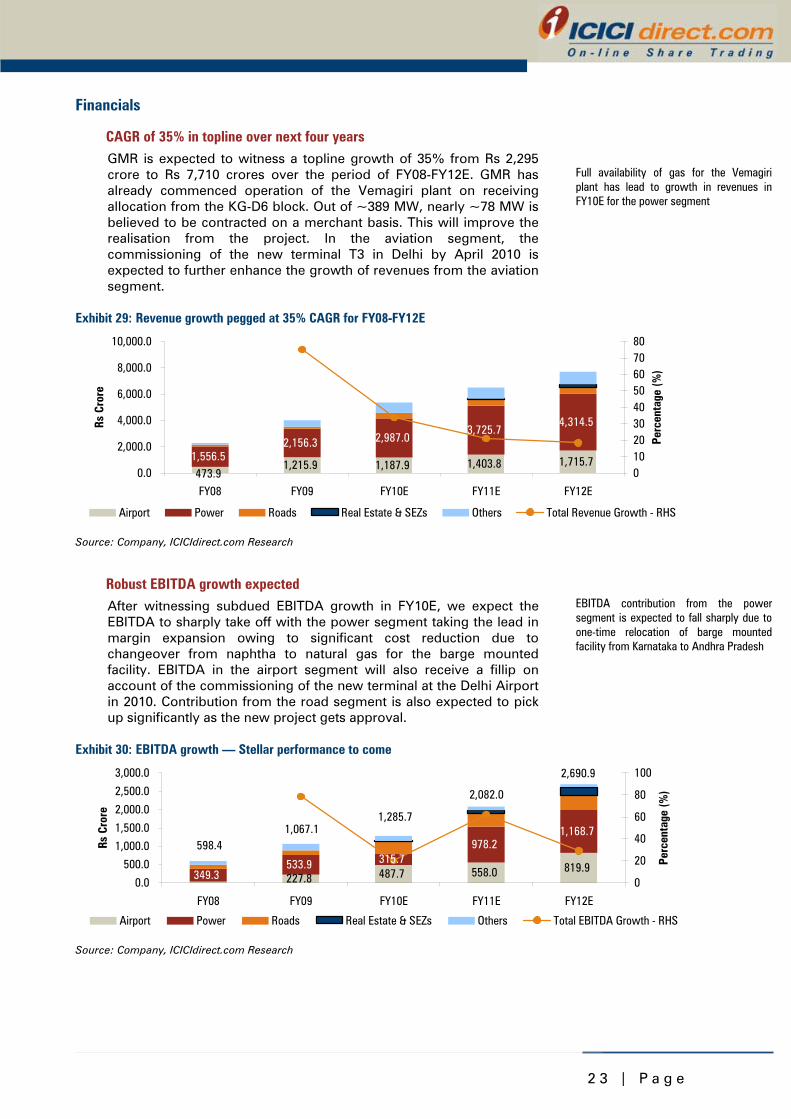
CAGR of 35% in topline over next four years GMR is expected to witness a topline growth of 35% from Rs 2,295 crore to Rs 7,710 crores over the period of FY08-FY12E. GMR has already commenced operation of the Vemagiri plant on receiving allocation from the KG-D6 block. Out of ~389 MW, nearly ~78 MW is believed to be contracted on a merchant basis. This will improve the realisation from the project. In the aviation segment, the commissioning of the new terminal T3 in Delhi by April 2010 is expected to further enhance the growth of revenues from the aviation segment.
Exhibit 29: Revenue growth pegged at 35% CAGR for FY08-FY12E
1,215.9 1,187.9 1,403.8 1,715.71,556.52,156.3 2,987.0
3,725.74,314.5
473.90.0
2,000.0
4,000.0
6,000.0
8,000.0
10,000.0
FY08 FY09 FY10E FY11E FY12E
Rs C
rore
01020304050607080
Perc
enta
ge (%
)
Airport Power Roads Real Estate & SEZs Others Total Revenue Growth - RHS
Source: Company, ICICIdirect.com Research
Robust EBITDA growth expected After witnessing subdued EBITDA growth in FY10E, we expect the EBITDA to sharply take off with the power segment taking the lead in margin expansion owing to significant cost reduction due to changeover from naphtha to natural gas for the barge mounted facility. EBITDA in the airport segment will also receive a fillip on account of the commissioning of the new terminal at the Delhi Airport in 2010. Contribution from the road segment is also expected to pick up significantly as the new project gets approval.
Exhibit 30: EBITDA growth — Stellar performance to come
227.8 487.7 558.0 819.9349.3
533.9 315.7978.2
1,168.7
0.0
500.0
1,000.0
1,500.0
2,000.0
2,500.0
3,000.0
FY08 FY09 FY10E FY11E FY12E
Rs C
rore
0
20
40
60
80
100
Perc
enta
ge (%
)
Airport Power Roads Real Estate & SEZs Others Total EBITDA Growth - RHS
598.41,067.1
1,285.7
2,082.0
2,690.9
Source: Company, ICICIdirect.com Research
Full availability of gas for the Vemagiri plant has lead to growth in revenues in FY10E for the power segment
EBITDA contribution from the power segment is expected to fall sharply due to one-time relocation of barge mounted facility from Karnataka to Andhra Pradesh
2 4 | P a g e
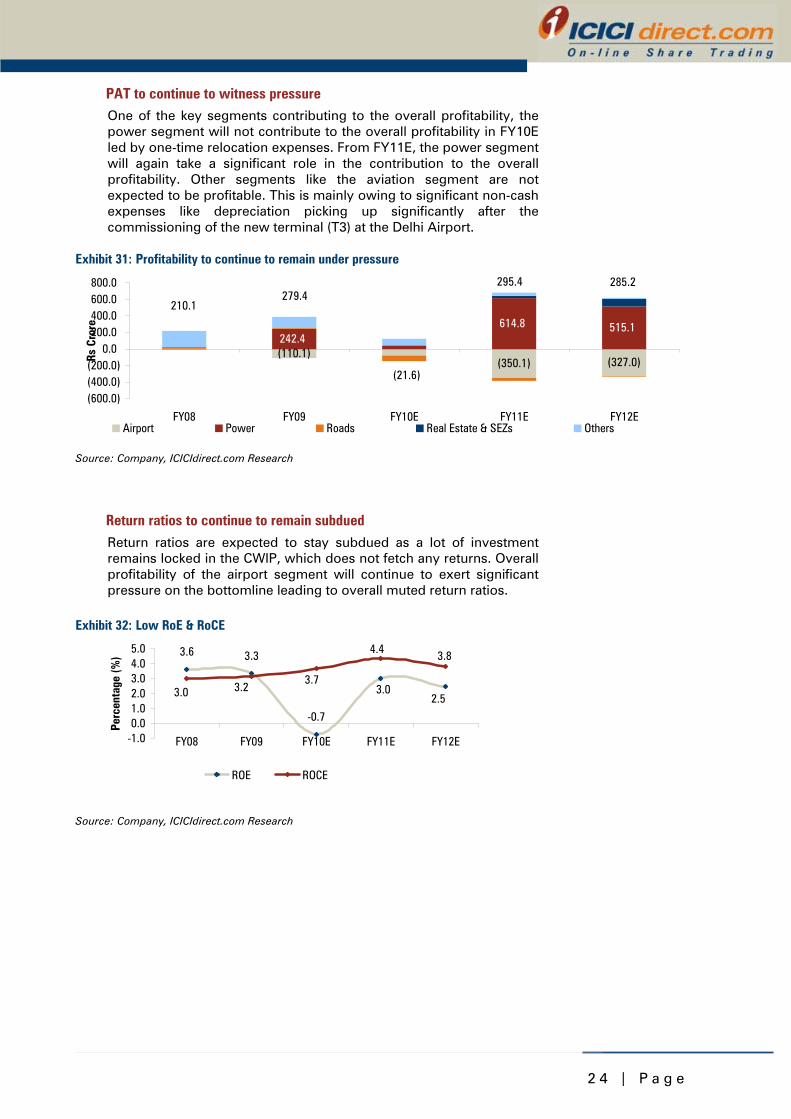
PAT to continue to witness pressure One of the key segments contributing to the overall profitability, the power segment will not contribute to the overall profitability in FY10E led by one-time relocation expenses. From FY11E, the power segment will again take a significant role in the contribution to the overall profitability. Other segments like the aviation segment are not expected to be profitable. This is mainly owing to significant non-cash expenses like depreciation picking up significantly after the commissioning of the new terminal (T3) at the Delhi Airport.
Exhibit 31: Profitability to continue to remain under pressure
(110.1)(350.1) (327.0)
242.4614.8 515.1
(600.0)(400.0)(200.0)
0.0200.0400.0600.0800.0
FY08 FY09 FY10E FY11E FY12E
Rs C
rore
Airport Power Roads Real Estate & SEZs Others
210.1 279.4
(21.6)
295.4 285.2
Source: Company, ICICIdirect.com Research
Return ratios to continue to remain subdued Return ratios are expected to stay subdued as a lot of investment remains locked in the CWIP, which does not fetch any returns. Overall profitability of the airport segment will continue to exert significant pressure on the bottomline leading to overall muted return ratios.
Exhibit 32: Low RoE & RoCE
3.6 3.3
-0.7
2.53.03.0
3.8
3.23.7
4.4
-1.00.01.02.03.04.05.0
FY08 FY09 FY10E FY11E FY12E
Perc
enta
ge (%
)
ROE ROCE
Source: Company, ICICIdirect.com Research
2 5 | P a g e
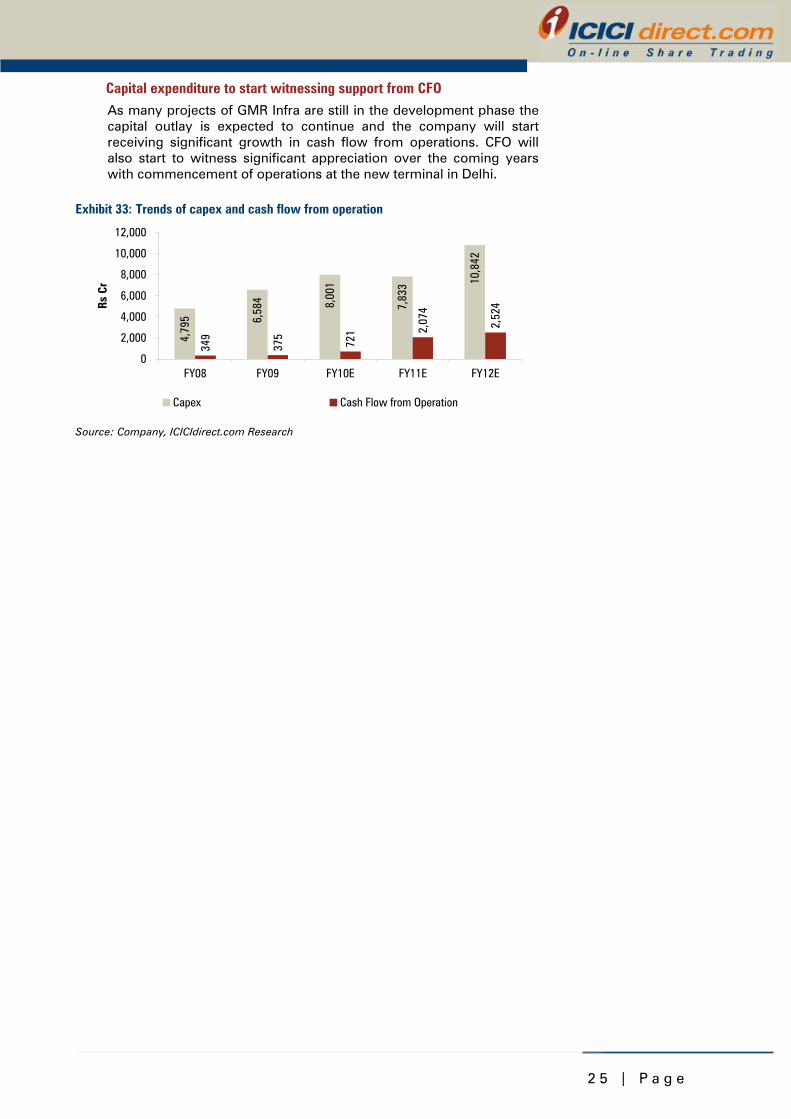
Capital expenditure to start witnessing support from CFO As many projects of GMR Infra are still in the development phase the capital outlay is expected to continue and the company will start receiving significant growth in cash flow from operations. CFO will also start to witness significant appreciation over the coming years with commencement of operations at the new terminal in Delhi.
Exhibit 33: Trends of capex and cash flow from operation
4,79
5 6,58
4 8,00
1
7,83
3 10,8
42
349
375
721 2,
074
2,52
4
0
2,000
4,000
6,000
8,000
10,000
12,000
FY08 FY09 FY10E FY11E FY12E
Rs C
r
Capex Cash Flow from Operation
Source: Company, ICICIdirect.com Research
2 6 | P a g e
Valuations
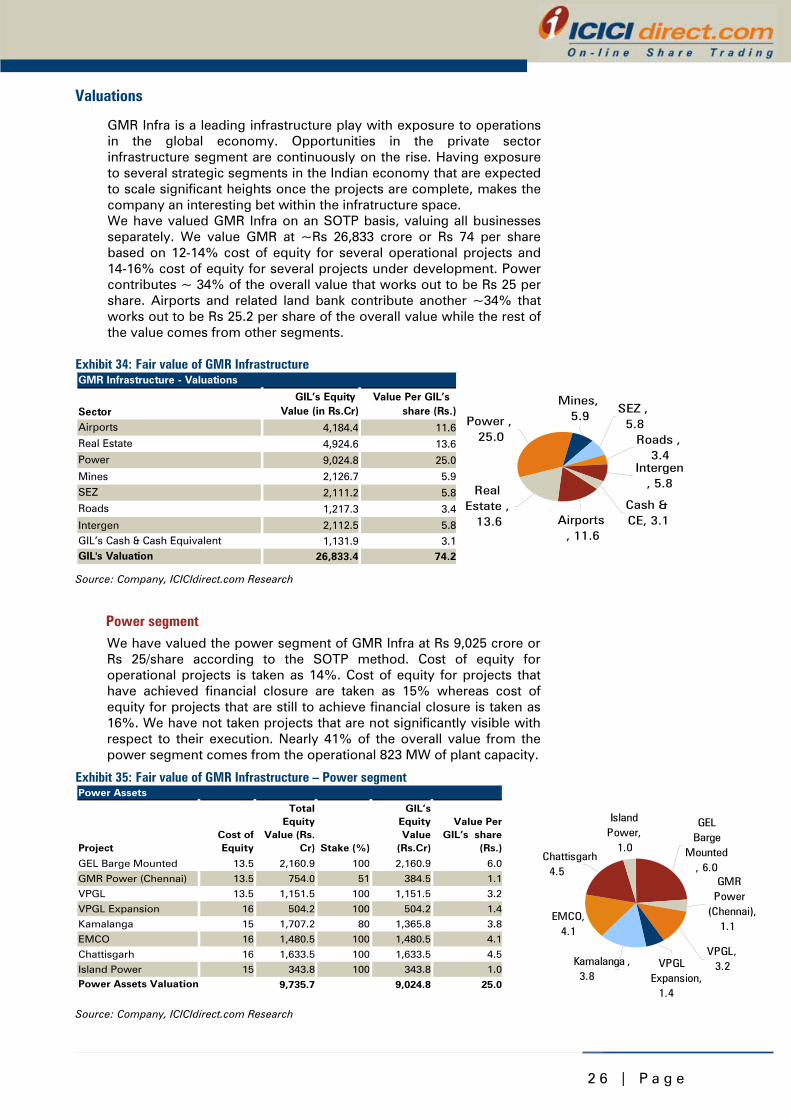
GMR Infra is a leading infrastructure play with exposure to operations in the global economy. Opportunities in the private sector infrastructure segment are continuously on the rise. Having exposure to several strategic segments in the Indian economy that are expected to scale significant heights once the projects are complete, makes the company an interesting bet within the infratructure space. We have valued GMR Infra on an SOTP basis, valuing all businesses separately. We value GMR at ~Rs 26,833 crore or Rs 74 per share based on 12-14% cost of equity for several operational projects and 14-16% cost of equity for several projects under development. Power contributes ~ 34% of the overall value that works out to be Rs 25 per share. Airports and related land bank contribute another ~34% that works out to be Rs 25.2 per share of the overall value while the rest of the value comes from other segments.
Exhibit 34: Fair value of GMR Infrastructure
GIL’s Equity Value (in Rs.Cr)
Value Per GIL’s share (Rs.)
4,184.4 11.6
4,924.6 13.6
9,024.8 25.0
Mines 2,126.7 5.9
2,111.2 5.8
1,217.3 3.4
Intergen 2,112.5 5.81,131.9 3.1
26,833.4 74.2
SEZ
Real Estate
GMR Infrastructure - Valuations
SectorAirports
Power
Roads
GIL’s Cash & Cash EquivalentGIL's Valuation
Power , 25.0
Intergen, 5.8
Roads , 3.4
Real Estate ,
13.6Cash & CE, 3.1Airports
, 11.6
SEZ , 5.8
Mines, 5.9
Source: Company, ICICIdirect.com Research
Power segment We have valued the power segment of GMR Infra at Rs 9,025 crore or Rs 25/share according to the SOTP method. Cost of equity for operational projects is taken as 14%. Cost of equity for projects that have achieved financial closure are taken as 15% whereas cost of equity for projects that are still to achieve financial closure is taken as 16%. We have not taken projects that are not significantly visible with respect to their execution. Nearly 41% of the overall value from the power segment comes from the operational 823 MW of plant capacity.
Exhibit 35: Fair value of GMR Infrastructure – Power segment Power Assets
Project Cost ofEquity
TotalEquity
Value (Rs.Cr) Stake (%)
GIL’sEquityValue
(Rs.Cr)
Value PerGIL’s share
(Rs.)
GEL Barge Mounted 13.5 2,160.9 100 2,160.9 6.0
GMR Power (Chennai) 13.5 754.0 51 384.5 1.1
VPGL 13.5 1,151.5 100 1,151.5 3.2
VPGL Expansion 16 504.2 100 504.2 1.4
Kamalanga 15 1,707.2 80 1,365.8 3.8
EMCO 16 1,480.5 100 1,480.5 4.1
Chattisgarh 16 1,633.5 100 1,633.5 4.5
Island Power 15 343.8 100 343.8 1.0
9,735.7 9,024.8 25.0Power Assets Valuation
Source: Company, ICICIdirect.com Research
EMCO, 4.1
Island Power,
1.0Chattisgarh 4.5
Kamalanga , 3.8
VPGL Expansion,
1.4
GMR Power
(Chennai), 1.1
VPGL, 3.2
GEL Barge
Mounted, 6.0
2 7 | P a g e
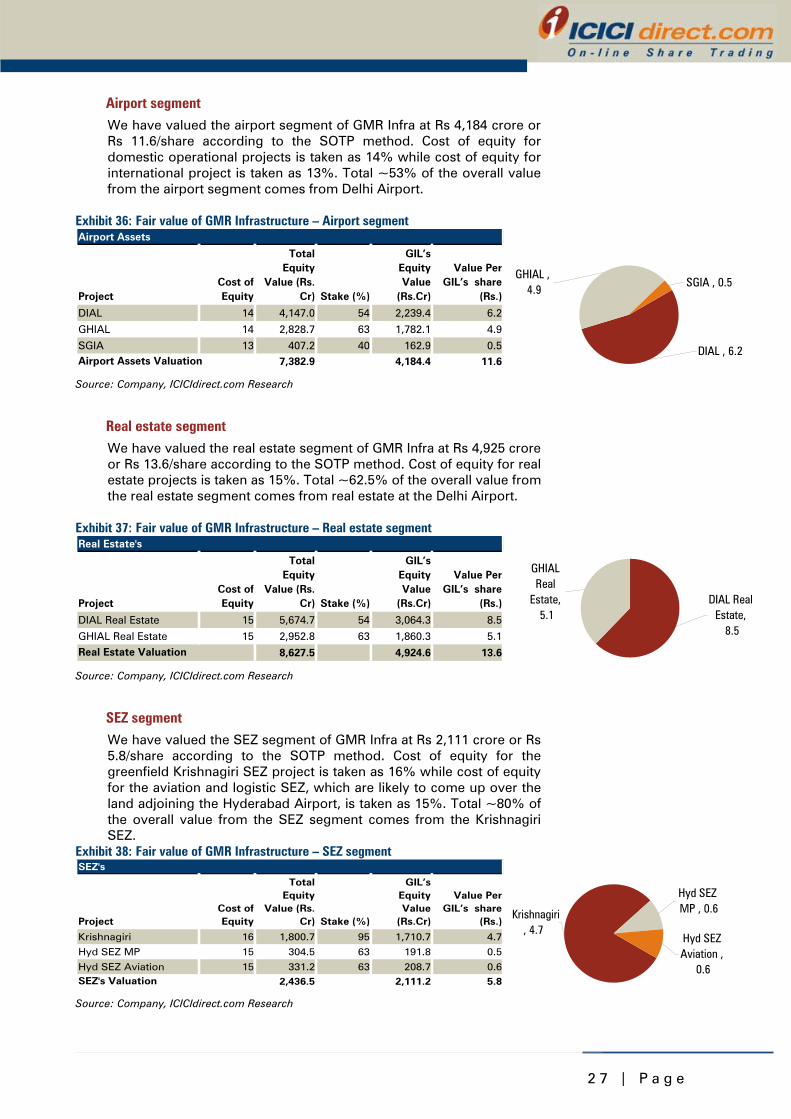
Airport segment We have valued the airport segment of GMR Infra at Rs 4,184 crore or Rs 11.6/share according to the SOTP method. Cost of equity for domestic operational projects is taken as 14% while cost of equity for international project is taken as 13%. Total ~53% of the overall value from the airport segment comes from Delhi Airport.
Exhibit 36: Fair value of GMR Infrastructure – Airport segment Airport Assets
Project Cost ofEquity
TotalEquity
Value (Rs.Cr) Stake (%)
GIL’sEquityValue
(Rs.Cr)
Value PerGIL’s share
(Rs.)
DIAL 14 4,147.0 54 2,239.4 6.2
GHIAL 14 2,828.7 63 1,782.1 4.9
SGIA 13 407.2 40 162.9 0.57,382.9 4,184.4 11.6Airport Assets Valuation
DIAL , 6.2
SGIA , 0.5GHIAL ,
4.9
Source: Company, ICICIdirect.com Research
Real estate segment We have valued the real estate segment of GMR Infra at Rs 4,925 crore or Rs 13.6/share according to the SOTP method. Cost of equity for real estate projects is taken as 15%. Total ~62.5% of the overall value from the real estate segment comes from real estate at the Delhi Airport.
Exhibit 37: Fair value of GMR Infrastructure – Real estate segment Real Estate's
Project Cost ofEquity
TotalEquity
Value (Rs.Cr) Stake (%)
GIL’sEquityValue
(Rs.Cr)
Value PerGIL’s share
(Rs.)
DIAL Real Estate 15 5,674.7 54 3,064.3 8.5
GHIAL Real Estate 15 2,952.8 63 1,860.3 5.1
8,627.5 4,924.6 13.6Real Estate Valuation
GHIAL Real
Estate, 5.1
DIAL Real Estate,
8.5
Source: Company, ICICIdirect.com Research
SEZ segment We have valued the SEZ segment of GMR Infra at Rs 2,111 crore or Rs 5.8/share according to the SOTP method. Cost of equity for the greenfield Krishnagiri SEZ project is taken as 16% while cost of equity for the aviation and logistic SEZ, which are likely to come up over the land adjoining the Hyderabad Airport, is taken as 15%. Total ~80% of the overall value from the SEZ segment comes from the Krishnagiri SEZ.
Exhibit 38: Fair value of GMR Infrastructure – SEZ segment SEZ's
Project Cost ofEquity
TotalEquity
Value (Rs.Cr) Stake (%)
GIL’sEquityValue
(Rs.Cr)
Value PerGIL’s share
(Rs.)
Krishnagiri 16 1,800.7 95 1,710.7 4.7
Hyd SEZ MP 15 304.5 63 191.8 0.5
Hyd SEZ Aviation 15 331.2 63 208.7 0.62,436.5 2,111.2 5.8SEZ's Valuation
Krishnagiri, 4.7
Hyd SEZ Aviation ,
0.6
Hyd SEZ MP , 0.6
Source: Company, ICICIdirect.com Research
2 8 | P a g e
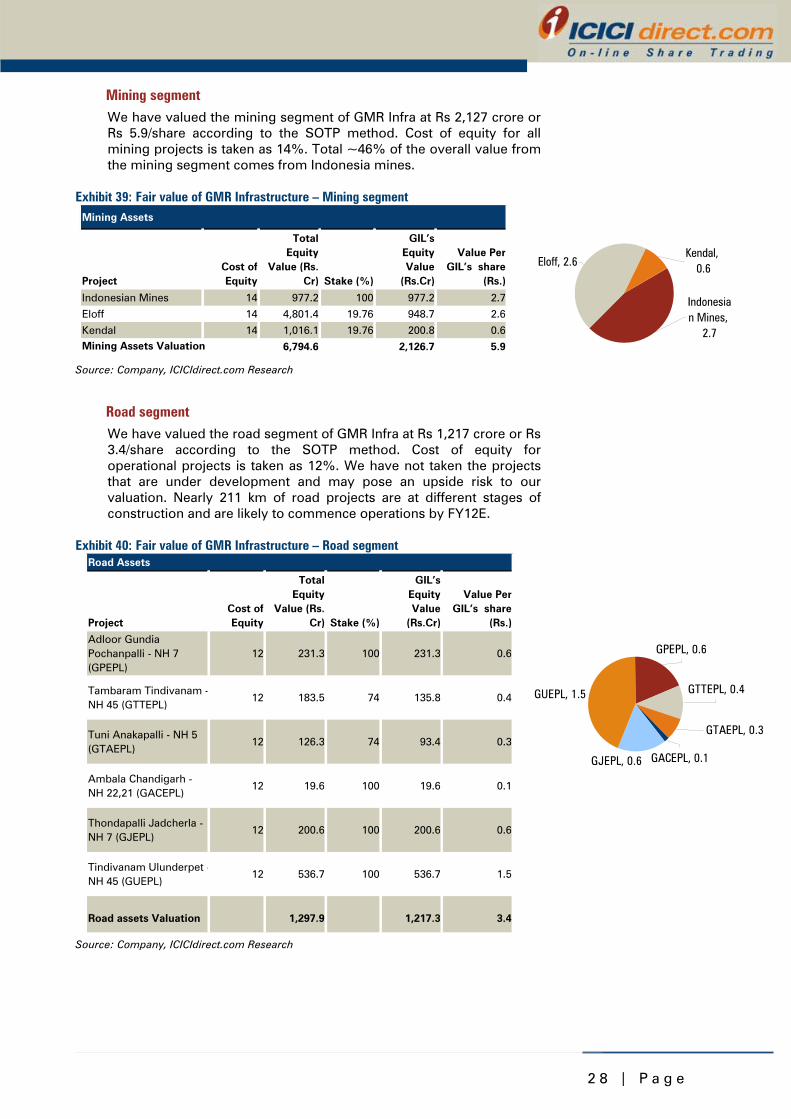
Mining segment We have valued the mining segment of GMR Infra at Rs 2,127 crore or Rs 5.9/share according to the SOTP method. Cost of equity for all mining projects is taken as 14%. Total ~46% of the overall value from the mining segment comes from Indonesia mines.
Exhibit 39: Fair value of GMR Infrastructure – Mining segment
Mining Assets
Project Cost ofEquity
TotalEquity
Value (Rs.Cr) Stake (%)
GIL’sEquityValue
(Rs.Cr)
Value PerGIL’s share
(Rs.)
Indonesian Mines 14 977.2 100 977.2 2.7
Eloff 14 4,801.4 19.76 948.7 2.6
Kendal 14 1,016.1 19.76 200.8 0.6
6,794.6 2,126.7 5.9Mining Assets Valuation
Eloff, 2.6Kendal,
0.6
Indonesian Mines,
2.7
Source: Company, ICICIdirect.com Research
Road segment We have valued the road segment of GMR Infra at Rs 1,217 crore or Rs 3.4/share according to the SOTP method. Cost of equity for operational projects is taken as 12%. We have not taken the projects that are under development and may pose an upside risk to our valuation. Nearly 211 km of road projects are at different stages of construction and are likely to commence operations by FY12E.
Exhibit 40: Fair value of GMR Infrastructure – Road segment Road Assets
Project Cost ofEquity
TotalEquity
Value (Rs.Cr) Stake (%)
GIL’sEquityValue
(Rs.Cr)
Value PerGIL’s share
(Rs.)
Adloor Gundia Pochanpalli - NH 7 (GPEPL)
12 231.3 100 231.3 0.6
Tambaram Tindivanam -NH 45 (GTTEPL)
12 183.5 74 135.8 0.4
Tuni Anakapalli - NH 5 (GTAEPL)
12 126.3 74 93.4 0.3
Ambala Chandigarh - NH 22,21 (GACEPL)
12 19.6 100 19.6 0.1
Thondapalli Jadcherla - NH 7 (GJEPL)
12 200.6 100 200.6 0.6
Tindivanam Ulunderpet -NH 45 (GUEPL)
12 536.7 100 536.7 1.5
Road assets Valuation 1,297.9 1,217.3 3.4
Source: Company, ICICIdirect.com Research
GUEPL, 1.5
GJEPL, 0.6
GPEPL, 0.6
GTAEPL, 0.3
GTTEPL, 0.4
GACEPL, 0.1

2 9 | P a g e
Cash and other investments We have valued the cash and cash equivalents along with its investment in Intergen at Rs 3,244 crore or Rs 8.9/share. The investments in the global power major are valued at 2.5x book value of investments done in InterGen. We believe that with marginal improvements of spark spreads in the global markets and also the improvement in realisation for carbon credits the equity value of the stake in Intergen has appreciated over the last year. We must also consider that this investment position in Intergen is highly levered and it may pose a risk to our valuation case.
3 0 | P a g e
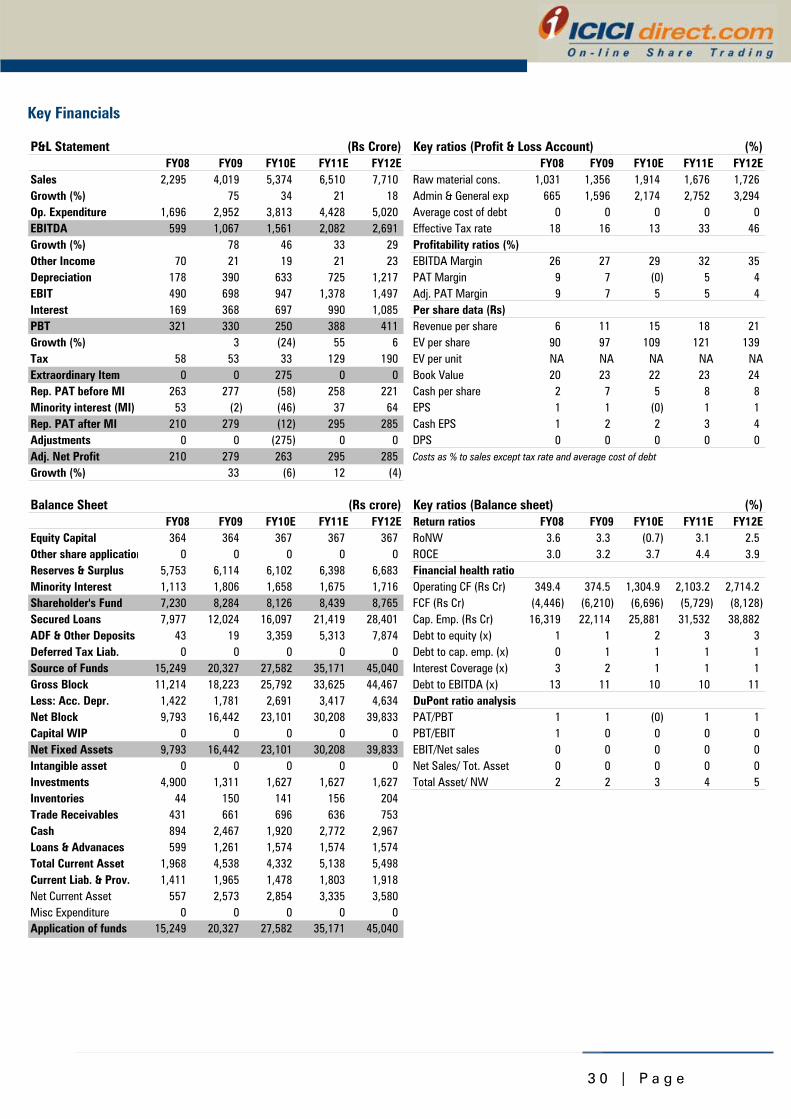
Key Financials
P&L Statement (Rs Crore) Key ratios (Profit & Loss Account) (%)FY08 FY09 FY10E FY11E FY12E FY08 FY09 FY10E FY11E FY12E
Sales 2,295 4,019 5,374 6,510 7,710 Raw material cons. 1,031 1,356 1,914 1,676 1,726Growth (%) 75 34 21 18 Admin & General exp 665 1,596 2,174 2,752 3,294Op. Expenditure 1,696 2,952 3,813 4,428 5,020 Average cost of debt 0 0 0 0 0EBITDA 599 1,067 1,561 2,082 2,691 Effective Tax rate 18 16 13 33 46Growth (%) 78 46 33 29 Profitability ratios (%)Other Income 70 21 19 21 23 EBITDA Margin 26 27 29 32 35Depreciation 178 390 633 725 1,217 PAT Margin 9 7 (0) 5 4EBIT 490 698 947 1,378 1,497 Adj. PAT Margin 9 7 5 5 4Interest 169 368 697 990 1,085 Per share data (Rs)PBT 321 330 250 388 411 Revenue per share 6 11 15 18 21Growth (%) 3 (24) 55 6 EV per share 90 97 109 121 139Tax 58 53 33 129 190 EV per unit NA NA NA NA NAExtraordinary Item 0 0 275 0 0 Book Value 20 23 22 23 24Rep. PAT before MI 263 277 (58) 258 221 Cash per share 2 7 5 8 8Minority interest (MI) 53 (2) (46) 37 64 EPS 1 1 (0) 1 1Rep. PAT after MI 210 279 (12) 295 285 Cash EPS 1 2 2 3 4Adjustments 0 0 (275) 0 0 DPS 0 0 0 0 0Adj. Net Profit 210 279 263 295 285 Costs as % to sales except tax rate and average cost of debt
Growth (%) 33 (6) 12 (4)
Balance Sheet (Rs crore) Key ratios (Balance sheet) (%)FY08 FY09 FY10E FY11E FY12E Return ratios FY08 FY09 FY10E FY11E FY12E
Equity Capital 364 364 367 367 367 RoNW 3.6 3.3 (0.7) 3.1 2.5Other share application 0 0 0 0 0 ROCE 3.0 3.2 3.7 4.4 3.9Reserves & Surplus 5,753 6,114 6,102 6,398 6,683 Financial health ratioMinority Interest 1,113 1,806 1,658 1,675 1,716 Operating CF (Rs Cr) 349.4 374.5 1,304.9 2,103.2 2,714.2Shareholder's Fund 7,230 8,284 8,126 8,439 8,765 FCF (Rs Cr) (4,446) (6,210) (6,696) (5,729) (8,128)Secured Loans 7,977 12,024 16,097 21,419 28,401 Cap. Emp. (Rs Cr) 16,319 22,114 25,881 31,532 38,882ADF & Other Deposits 43 19 3,359 5,313 7,874 Debt to equity (x) 1 1 2 3 3Deferred Tax Liab. 0 0 0 0 0 Debt to cap. emp. (x) 0 1 1 1 1Source of Funds 15,249 20,327 27,582 35,171 45,040 Interest Coverage (x) 3 2 1 1 1Gross Block 11,214 18,223 25,792 33,625 44,467 Debt to EBITDA (x) 13 11 10 10 11Less: Acc. Depr. 1,422 1,781 2,691 3,417 4,634 DuPont ratio analysisNet Block 9,793 16,442 23,101 30,208 39,833 PAT/PBT 1 1 (0) 1 1Capital WIP 0 0 0 0 0 PBT/EBIT 1 0 0 0 0Net Fixed Assets 9,793 16,442 23,101 30,208 39,833 EBIT/Net sales 0 0 0 0 0Intangible asset 0 0 0 0 0 Net Sales/ Tot. Asset 0 0 0 0 0Investments 4,900 1,311 1,627 1,627 1,627 Total Asset/ NW 2 2 3 4 5Inventories 44 150 141 156 204 Spread of RoIC over WACC (?????) (%)Trade Receivables 431 661 696 636 753 RoICCash 894 2,467 1,920 2,772 2,967 WACCLoans & Advanaces 599 1,261 1,574 1,574 1,574 EVATotal Current Asset 1,968 4,538 4,332 5,138 5,498Current Liab. & Prov. 1,411 1,965 1,478 1,803 1,918Net Current Asset 557 2,573 2,854 3,335 3,580Misc Expenditure 0 0 0 0 0Application of funds 15,249 20,327 27,582 35,171 45,040
3 1 | P a g e
Contd...
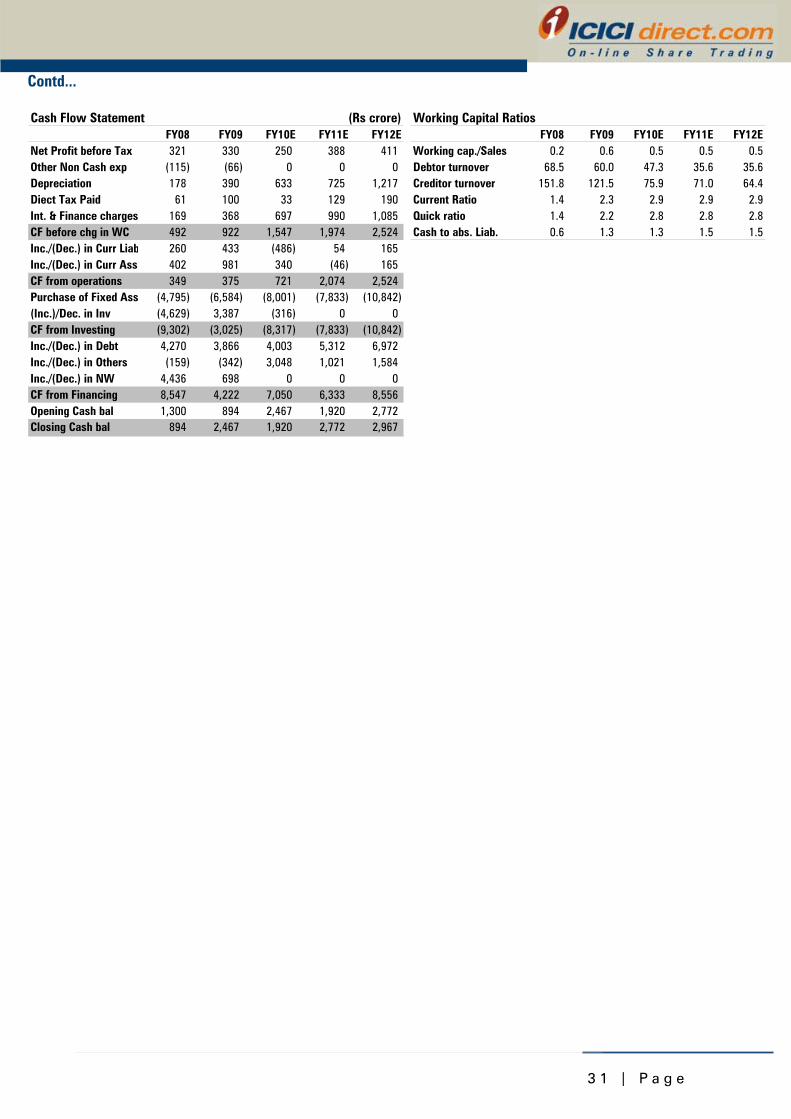
Cash Flow Statement (Rs crore) Working Capital RatiosFY08 FY09 FY10E FY11E FY12E FY08 FY09 FY10E FY11E FY12E
Net Profit before Tax 321 330 250 388 411 Working cap./Sales 0.2 0.6 0.5 0.5 0.5Other Non Cash exp (115) (66) 0 0 0 Debtor turnover 68.5 60.0 47.3 35.6 35.6Depreciation 178 390 633 725 1,217 Creditor turnover 151.8 121.5 75.9 71.0 64.4Diect Tax Paid 61 100 33 129 190 Current Ratio 1.4 2.3 2.9 2.9 2.9Int. & Finance charges 169 368 697 990 1,085 Quick ratio 1.4 2.2 2.8 2.8 2.8CF before chg in WC 492 922 1,547 1,974 2,524 Cash to abs. Liab. 0.6 1.3 1.3 1.5 1.5Inc./(Dec.) in Curr Liab 260 433 (486) 54 165Inc./(Dec.) in Curr Ass. 402 981 340 (46) 165 EBITDACF from operations 349 375 721 2,074 2,524 Less: TaxPurchase of Fixed Ass (4,795) (6,584) (8,001) (7,833) (10,842) NOPLAT(Inc.)/Dec. in Inv (4,629) 3,387 (316) 0 0 CapexCF from Investing (9,302) (3,025) (8,317) (7,833) (10,842) Change in working cap.Inc./(Dec.) in Debt 4,270 3,866 4,003 5,312 6,972 FCFInc./(Dec.) in Others (159) (342) 3,048 1,021 1,584Inc./(Dec.) in NW 4,436 698 0 0 0CF from Financing 8,547 4,222 7,050 6,333 8,556Opening Cash bal 1,300 894 2,467 1,920 2,772Closing Cash bal 894 2,467 1,920 2,772 2,967
3 2 | P a g e
RATING RATIONALE ICICIdirect.com endeavours to provide objective opinions and recommendations. ICICIdirect.com assigns ratings to its stocks according to their notional target price vs. current market price and then categorises them as Strong Buy, Buy, Add, Reduce and Sell. The performance horizon is two years unless specified and the notional target price is defined as the analysts' valuation for a stock. Strong Buy: 20% or more; Buy: Between 10% and 20%; Add: Up to 10%; Reduce: Up to -10% Sell: -10% or more; Pankaj Pandey Head – Research [email protected]
ICICIdirect.com Research Desk, ICICI Securities Limited, 7th Floor, Akruti Centre Point, MIDC Main Road, Marol Naka Andheri (East) Mumbai – 400 093
[email protected] ANALYST CERTIFICATION We /I, Jitesh Bhanot ACA research analysts, authors and the names subscribed to this report, hereby certify that all of the views expressed in this research report accurately reflect our personal views about any and all of the subject issuer(s) or securities. We also certify that no part of our compensation was, is, or will be directly or indirectly related to the specific recommendation(s) or view(s) in this report. Analysts aren't registered as research analysts by FINRA and might not be an associated person of the ICICI Securities Inc.
Disclosures: ICICI Securities Limited (ICICI Securities) and its affiliates are a full-service, integrated investment banking, investment management and brokerage and financing group. We along with affiliates are leading underwriter of securities and participate in virtually all securities trading markets in India. We and our affiliates have investment banking and other business relationship with a significant percentage of companies covered by our Investment Research Department. Our research professionals provide important input into our investment banking and other business selection processes. ICICI Securities generally prohibits its analysts, persons reporting to analysts and their dependent family members from maintaining a financial interest in the securities or derivatives of any companies that the analysts cover.
The information and opinions in this report have been prepared by ICICI Securities and are subject to change without any notice. The report and information contained herein is strictly confidential and meant solely for the selected recipient and may not be altered in any way, transmitted to, copied or distributed, in part or in whole, to any other person or to the media or reproduced in any form, without prior written consent of ICICI Securities. While we would endeavour to update the information herein on reasonable basis, ICICI Securities, its > subsidiaries and associated companies, their directors and employees (“ICICI Securities and affiliates”) are under no obligation to update or keep the information current. Also, there may be regulatory, compliance or other reasons that may prevent ICICI Securities from doing so. Non-rated securities indicate that rating on a particular security has been suspended temporarily and such suspension is in compliance with applicable regulations and/or ICICI Securities policies, in circumstances where ICICI Securities is acting in an advisory capacity to this company, or in certain other circumstances.
This report is based on information obtained from public sources and sources believed to be reliable, but no independent verification has been made nor is its accuracy or completeness guaranteed. This report and information herein is solely for informational purpose and may not be used or considered as an offer document or solicitation of offer to buy or sell or subscribe for securities or other financial instruments. Though disseminated to all the customers simultaneously, not all customers may receive this report at the same time. ICICI Securities will not treat recipients as customers by virtue of their receiving this report. Nothing in this report constitutes investment, legal, accounting and tax advice or a representation that any investment or strategy is suitable or appropriate to your specific circumstances. The securities discussed and opinions expressed in this report may not be suitable for all investors, who must make their own investment decisions, based on their own investment objectives, financial positions and needs of specific recipient. This may not be taken in substitution for the exercise of independent judgement by any recipient. The recipient should independently evaluate the investment risks. The value and return of investment may vary because of changes in interest rates, foreign exchange rates or any other reason. ICICI Securities and affiliates accept no liabilities for any loss or damage of any kind arising out of the use of this report. Past performance is not necessarily a guide to future performance. Investors are advised to see Risk Disclosure Document to understand the risks associated before investing in the securities markets. Actual results may differ materially from those set forth in projections. Forward-looking statements are not predictions and may be subject to change without notice.
ICICI Securities and its affiliates might have managed or co-managed a public offering for the subject company in the preceding twelve months. ICICI Securities and affiliates might have received compensation from the companies mentioned in the report during the period preceding twelve months from the date of this report for services in respect of public offerings, corporate finance, investment banking or other advisory services in a merger or specific transaction. ICICI Securities and affiliates expect to receive compensation from the companies mentioned in the report within a period of three months following the date of publication of the research report for services in respect of public offerings, corporate finance, investment banking or other advisory services in a merger or specific transaction. It is confirmed that Jitesh Bhanot ACA research analysts and the authors of this report have not received any compensation from the companies mentioned in the report in the preceding twelve months. Our research professionals are paid in part based on the profitability of ICICI Securities, which include earnings from Investment Banking and other business.
ICICI Securities or its subsidiaries collectively do not own 1% or more of the equity securities of the Company mentioned in the report as of the last day of the month preceding the publication of the research report.
It is confirmed that Jitesh Bhanot ACA research analysts and the authors of this report or any of their family members does not serve as an officer, director or advisory board member of the companies mentioned in the report.
ICICI Securities may have issued other reports that are inconsistent with and reach different conclusion from the information presented in this report. ICICI Securities and affiliates may act upon or make use of information contained in the report prior to the publication thereof.
This report is not directed or intended for distribution to, or use by, any person or entity who is a citizen or resident of or located in any locality, state, country or other jurisdiction, where such distribution, publication, availability or use would be contrary to law, regulation or which would subject ICICI Securities and affiliates to any registration or licensing requirement within such jurisdiction. The securities described herein may or may not be eligible for sale in all jurisdictions or to certain category of investors. Persons in whose possession this document may come are required to inform themselves of and to observe such restriction.
This report has not been prepared by ICICI Securities, Inc. However, ICICI Securities, Inc. has reviewed the report and, in so far as it includes current or historical information, it is believed to be reliable, although its accuracy and completeness cannot be guaranteed.
ICICI Securities Limited has been mandated to act as one of the Book Running Lead Managers to manage the IPO of the group company of GMR Infrastructure Limited, viz., GMR Energy Limited. This report is prepared on the basis of publicly available information.