rt for high-risk and post- operative prostate cancer · rt for high-risk and post- operative...
TRANSCRIPT
RT for High-Risk and Post- operative Prostate Cancer ASTRO Refresher Course 2014
Stanley Liauw MD
Associate Professor University of Chicago
Dept of Radiation and Cellular Oncology
Objectives • Review evidence regarding the role of RT for
high-risk (locally advanced) prostate cancer • Review evidence regarding the role of RT after
radical prostatectomy • Review treatment factors which influence
outcomes (disease control, toxicity) • Review technical aspects of post-operative
radiation planning and treatment

High-Risk, Intact Prostate Cancer
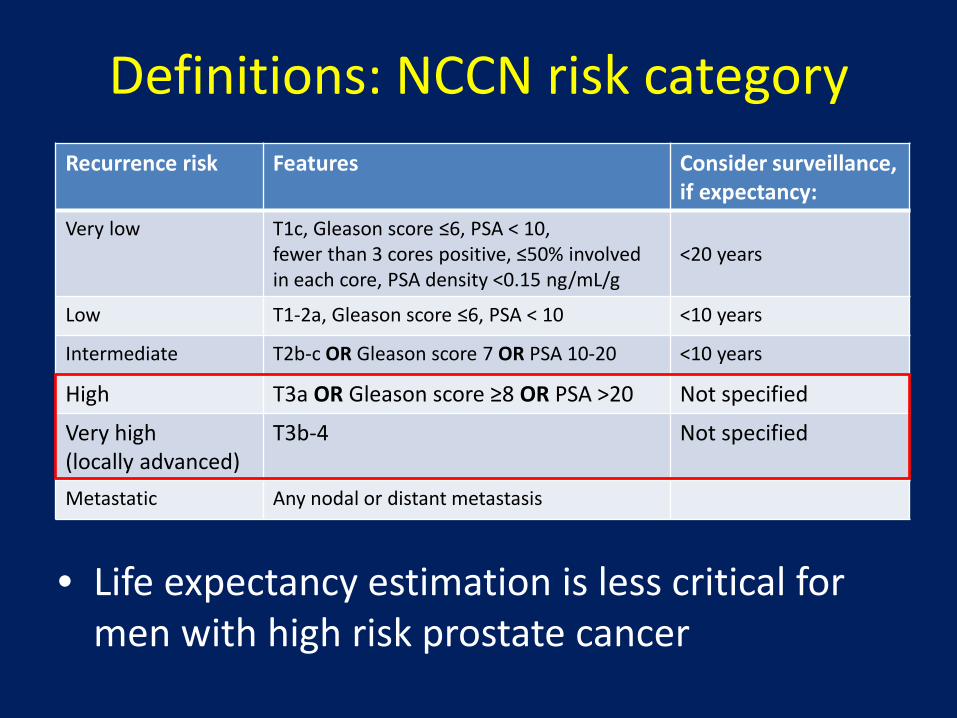
Definitions: NCCN risk category
• Life expectancy estimation is less critical for men with high risk prostate cancer
Recurrence risk Features Consider surveillance, if expectancy:
Very low T1c, Gleason score ≤6, PSA < 10, fewer than 3 cores positive, ≤50% involved in each core, PSA density <0.15 ng/mL/g
<20 years
Low T1-2a, Gleason score ≤6, PSA < 10 <10 years
Intermediate T2b-c OR Gleason score 7 OR PSA 10-20 <10 years
High T3a OR Gleason score ≥8 OR PSA >20 Not specified
Very high (locally advanced)
T3b-4 Not specified
Metastatic Any nodal or distant metastasis
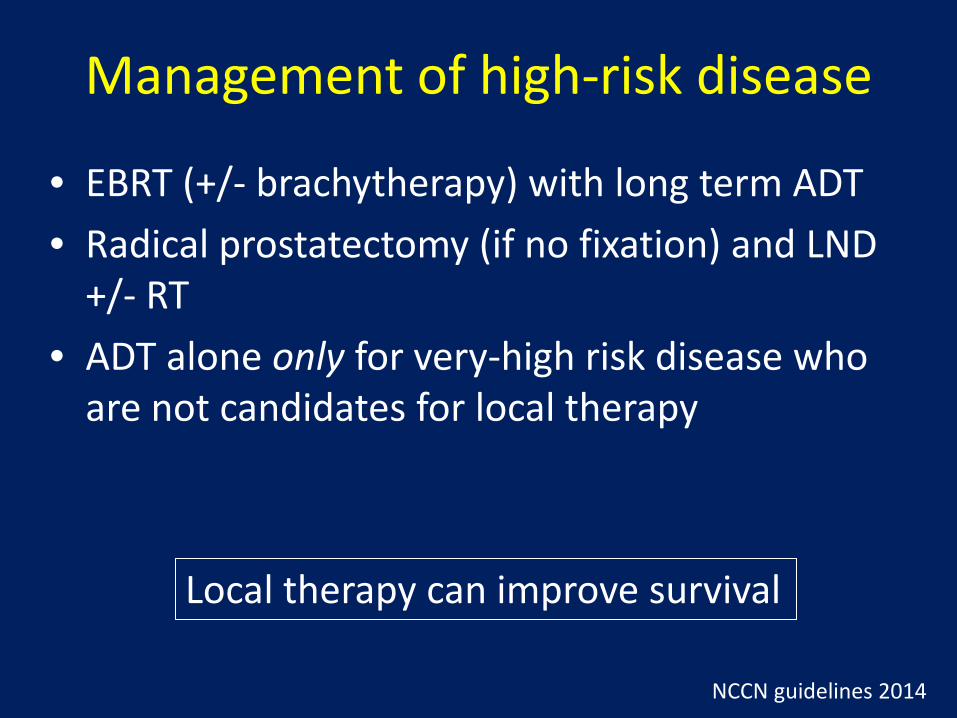
Management of high-risk disease
• EBRT (+/- brachytherapy) with long term ADT • Radical prostatectomy (if no fixation) and LND
+/- RT • ADT alone only for very-high risk disease who
are not candidates for local therapy
NCCN guidelines 2014
Local therapy can improve survival
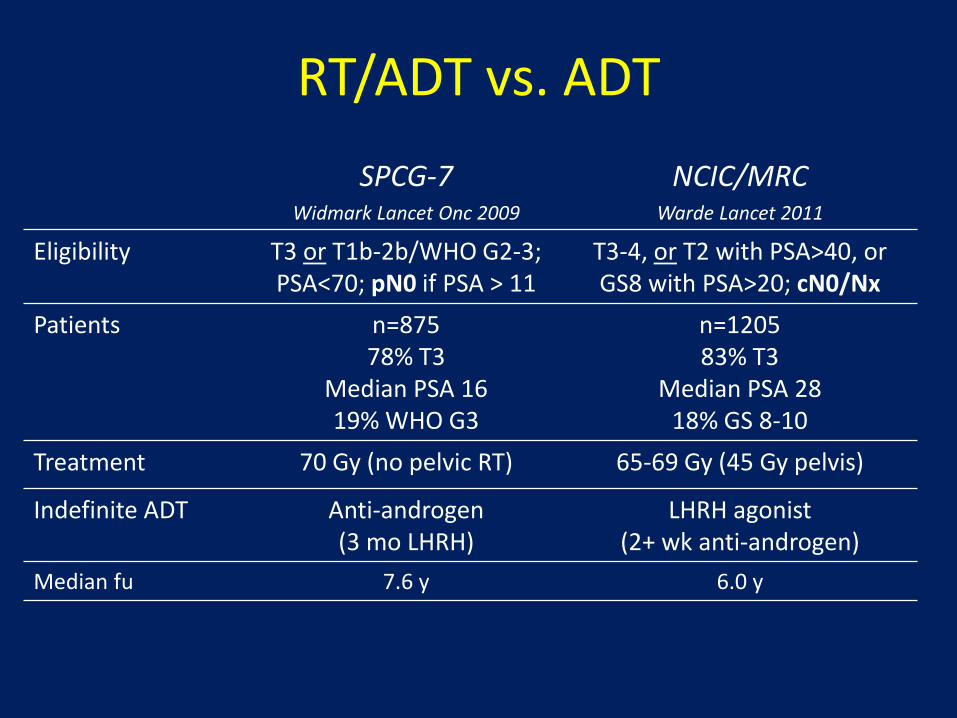
RT/ADT vs. ADT SPCG-7
Widmark Lancet Onc 2009 NCIC/MRC
Warde Lancet 2011
Eligibility T3 or T1b-2b/WHO G2-3; PSA<70; pN0 if PSA > 11
T3-4, or T2 with PSA>40, or GS8 with PSA>20; cN0/Nx
Patients n=875 78% T3
Median PSA 16 19% WHO G3
n=1205 83% T3
Median PSA 28 18% GS 8-10
Treatment 70 Gy (no pelvic RT) 65-69 Gy (45 Gy pelvis)
Indefinite ADT Anti-androgen (3 mo LHRH)
LHRH agonist (2+ wk anti-androgen)
Median fu 7.6 y 6.0 y
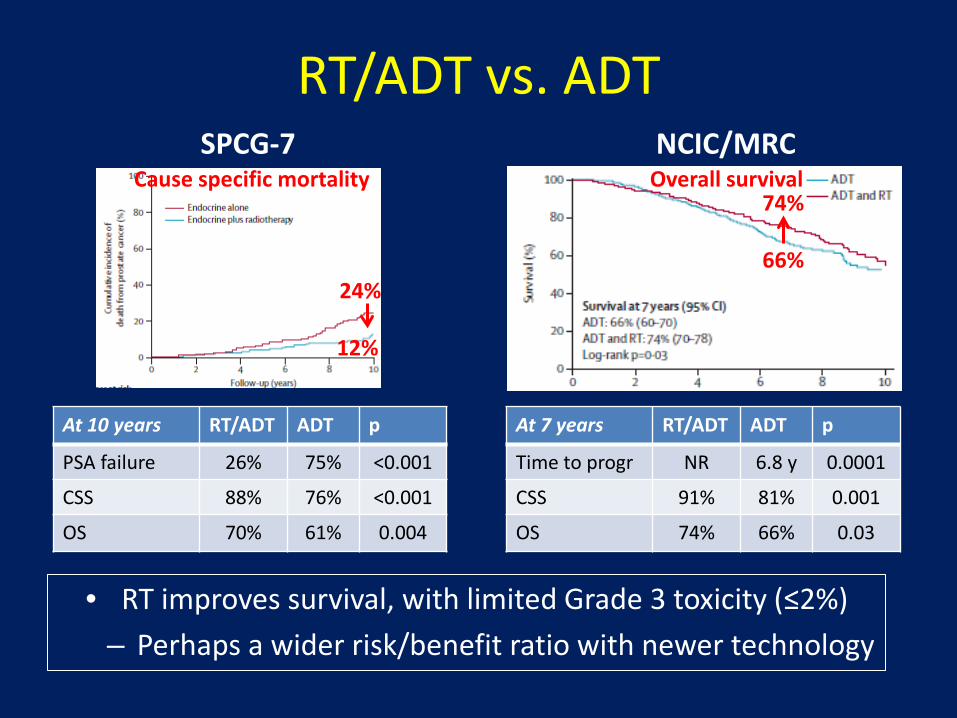
RT/ADT vs. ADT
• RT improves survival, with limited Grade 3 toxicity (≤2%) – Perhaps a wider risk/benefit ratio with newer technology
SPCG-7
24%
12%
Cause specific mortality NCIC/MRC
Overall survival 74%
66%
At 10 years RT/ADT ADT p
PSA failure 26% 75% <0.001
CSS 88% 76% <0.001
OS 70% 61% 0.004
At 7 years RT/ADT ADT p
Time to progr NR 6.8 y 0.0001
CSS 91% 81% 0.001
OS 74% 66% 0.03

What about surgery?
RP has traditionally been reserved for lower risk disease Cooperberg, JCO 2010
Low risk Intermediate risk High risk
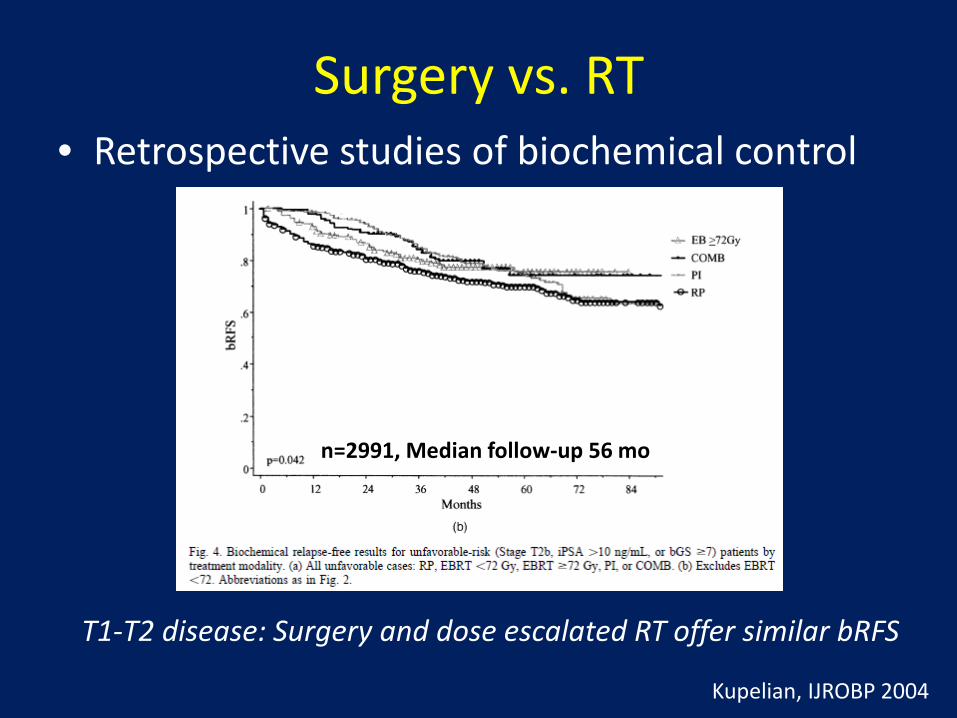
Surgery vs. RT • Retrospective studies of biochemical control
Kupelian, IJROBP 2004
n=2991, Median follow-up 56 mo
T1-T2 disease: Surgery and dose escalated RT offer similar bRFS

Surgery vs. RT • Retrospective studies of late endpoints,
including high risk disease
– HRs favor RP (1.5-2.8), largest for high-risk disease
Outcome Endpoint Reference
MSKCC, n=2380 RP > EBRT Metastasis Zelefsky JCO 2010
CapSURE, n=7538 RP > EBRT Cancer mortality Cooperberg, Cancer 2010
Mayo/FCCC, n=1847 RP > EBRT (RP = EBRT/ADT)
Cancer mortality Boorjian, Cancer 2011
CCF/WashU, n=10429 RP > EBRT Cancer mortality Kibel, J Urol 2012
PCOS, n=1655 RP > EBRT Cancer mortality Hoffman, JNCI 2013
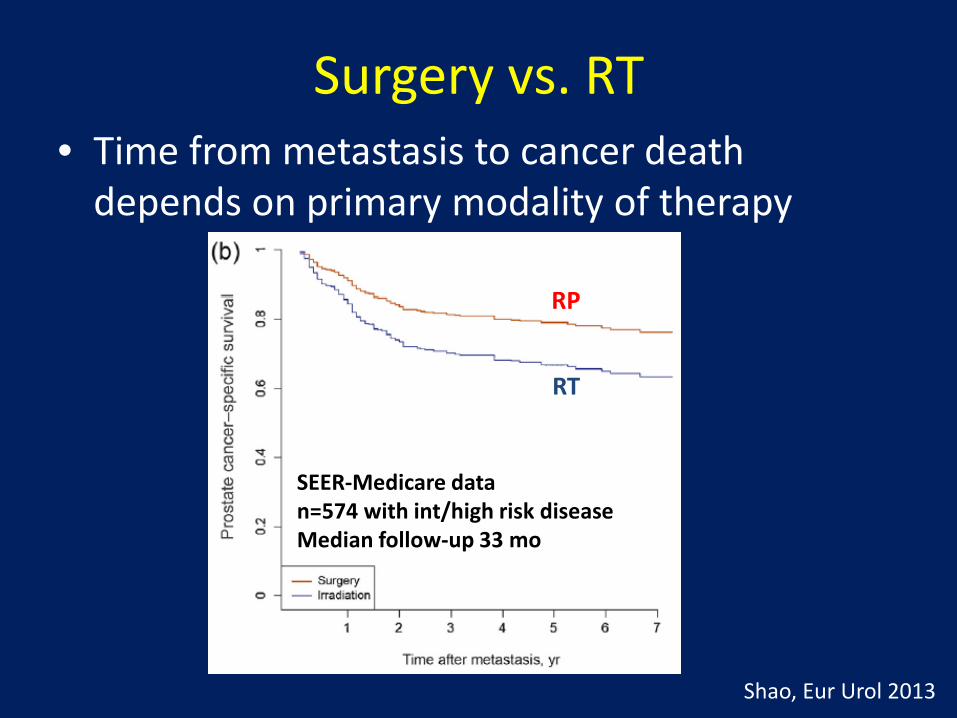
Surgery vs. RT • Time from metastasis to cancer death
depends on primary modality of therapy
SEER-Medicare data n=574 with int/high risk disease Median follow-up 33 mo
Shao, Eur Urol 2013
RP
RT
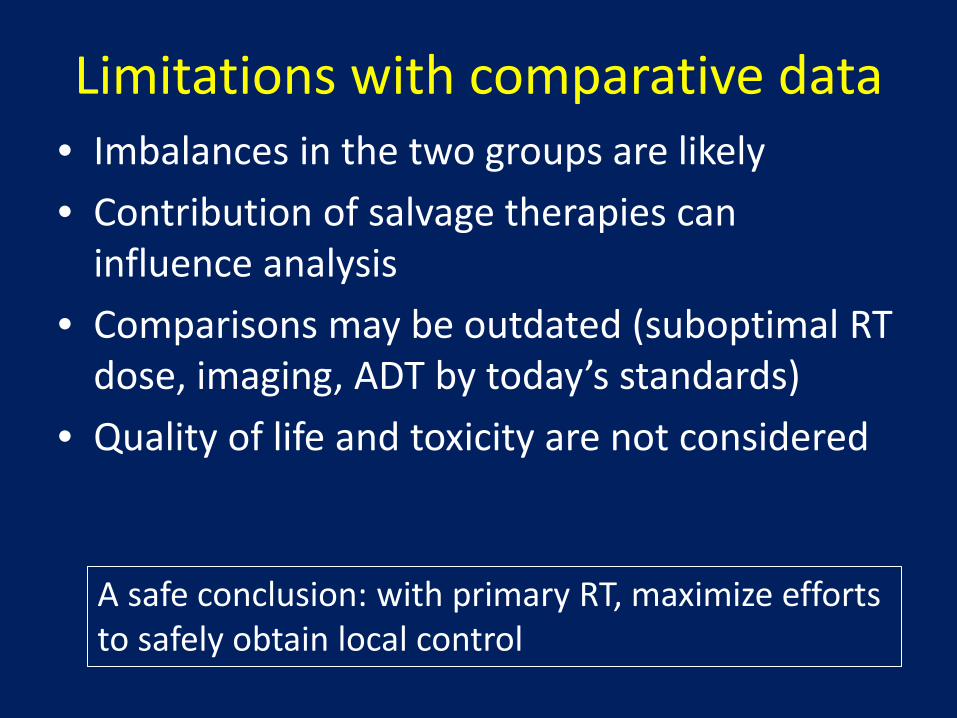
Limitations with comparative data • Imbalances in the two groups are likely • Contribution of salvage therapies can
influence analysis • Comparisons may be outdated (suboptimal RT
dose, imaging, ADT by today’s standards) • Quality of life and toxicity are not considered
A safe conclusion: with primary RT, maximize efforts to safely obtain local control

RT dose • Supported by several randomized trials
to improve biochemical control
Kuban, IJROBP 2008
78 Gy 73% at 10 y
70 Gy 50% at 10 y
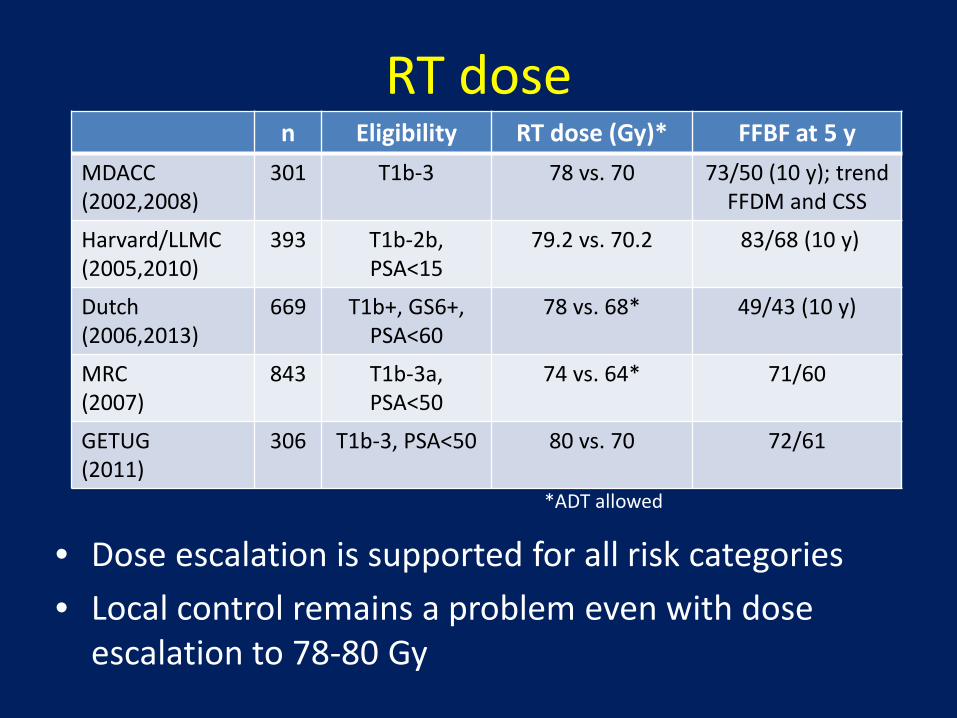
RT dose n Eligibility RT dose (Gy)* FFBF at 5 y
MDACC (2002,2008)
301 T1b-3 78 vs. 70 73/50 (10 y); trend FFDM and CSS
Harvard/LLMC (2005,2010)
393 T1b-2b, PSA<15
79.2 vs. 70.2 83/68 (10 y)
Dutch (2006,2013)
669 T1b+, GS6+, PSA<60
78 vs. 68* 49/43 (10 y)
MRC (2007)
843 T1b-3a, PSA<50
74 vs. 64* 71/60
GETUG (2011)
306 T1b-3, PSA<50 80 vs. 70 72/61
*ADT allowed
• Dose escalation is supported for all risk categories • Local control remains a problem even with dose
escalation to 78-80 Gy

RT dose
Kuban, IJROBP 2011
Distant failures after 78 Gy
• MDACC study: median follow-up 9.7 years
0% 0% 3%

Combination EBRT/brachytherapy • 848 outcomes studies (n=14,793 high risk pts)
Grimm, BJUI 2012
• Suggestion of improved outcomes with EBRT + seeds in comparison to EBRT or RP
EBRT
EBRT+seeds+ADT
EBRT+seeds
RP
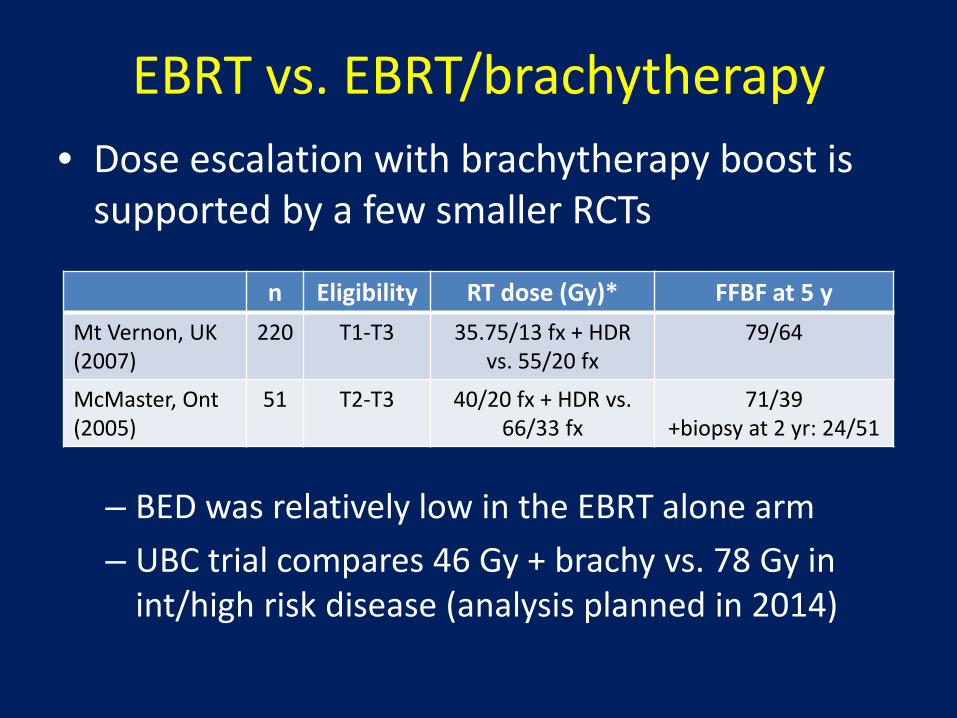
EBRT vs. EBRT/brachytherapy • Dose escalation with brachytherapy boost is
supported by a few smaller RCTs
n Eligibility RT dose (Gy)* FFBF at 5 y Mt Vernon, UK (2007)
220 T1-T3 35.75/13 fx + HDR vs. 55/20 fx
79/64
McMaster, Ont (2005)
51 T2-T3 40/20 fx + HDR vs. 66/33 fx
71/39 +biopsy at 2 yr: 24/51
– BED was relatively low in the EBRT alone arm – UBC trial compares 46 Gy + brachy vs. 78 Gy in
int/high risk disease (analysis planned in 2014)

Role of ADT with RT • Several randomized trials test RT/ADT vs. RT
n Eligibility ADT Important endpoints affected EORTC (1997,2010)
412 T3-4, WHO G3
36 m vs. 0 m bRFS, LC, DM, CSS, OS
RTOG 8531 (1997,2005)
997 T3, or N+ (non-bulky)
Indef. vs. none bRFS, LC, DM, CSS [OS for GS7-10]
RTOG 8610 (1995,2001)
456 T2-4 bulky, or N+
4 m vs. 0 m bRFS, [LC, DM, CSS, OS for GS2-6]
TROG 9601 (2005,2011)
818 T2b-4; N0 0 vs. 3 vs. 6 m bRFS, LC [DM, CSS, OS for 6 m]
Harvard (2004,2010)
206 PSA 10-40, or GS7+, T1b-2b
6 m vs. 0 m FFbF, FF salvage, CSS, OS
RTOG 9408 (2011)
1979 T1b-2b, PSA≤20; cN0
4 m vs. 0 m FFbF, DM, CSS [OS for int-risk] +biopsy at 2 y
RT is conventional fractionation, 66-70 Gy; whole pelvic RT for high risk patients
The addition of ADT (dual agent) to RT improves survival
High
-risk
In
t-ris
k
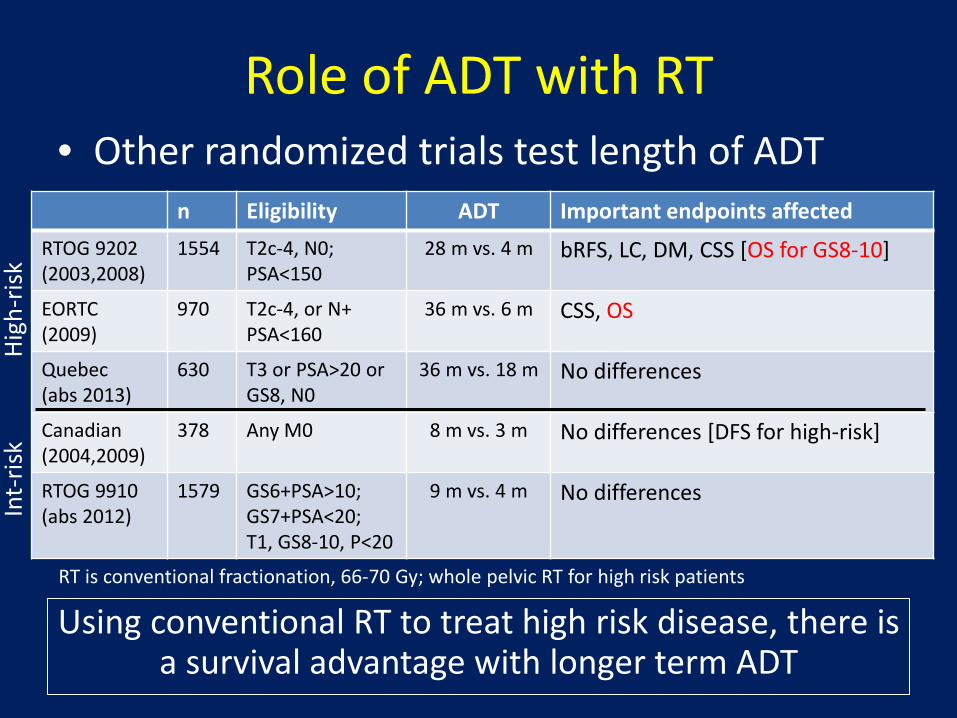
Role of ADT with RT • Other randomized trials test length of ADT
n Eligibility ADT Important endpoints affected RTOG 9202 (2003,2008)
1554 T2c-4, N0; PSA<150
28 m vs. 4 m bRFS, LC, DM, CSS [OS for GS8-10]
EORTC (2009)
970 T2c-4, or N+ PSA<160
36 m vs. 6 m CSS, OS
Quebec (abs 2013)
630 T3 or PSA>20 or GS8, N0
36 m vs. 18 m No differences
Canadian (2004,2009)
378 Any M0 8 m vs. 3 m No differences [DFS for high-risk]
RTOG 9910 (abs 2012)
1579 GS6+PSA>10; GS7+PSA<20; T1, GS8-10, P<20
9 m vs. 4 m No differences
Using conventional RT to treat high risk disease, there is a survival advantage with longer term ADT
RT is conventional fractionation, 66-70 Gy; whole pelvic RT for high risk patients
High
-risk
In
t-ris
k
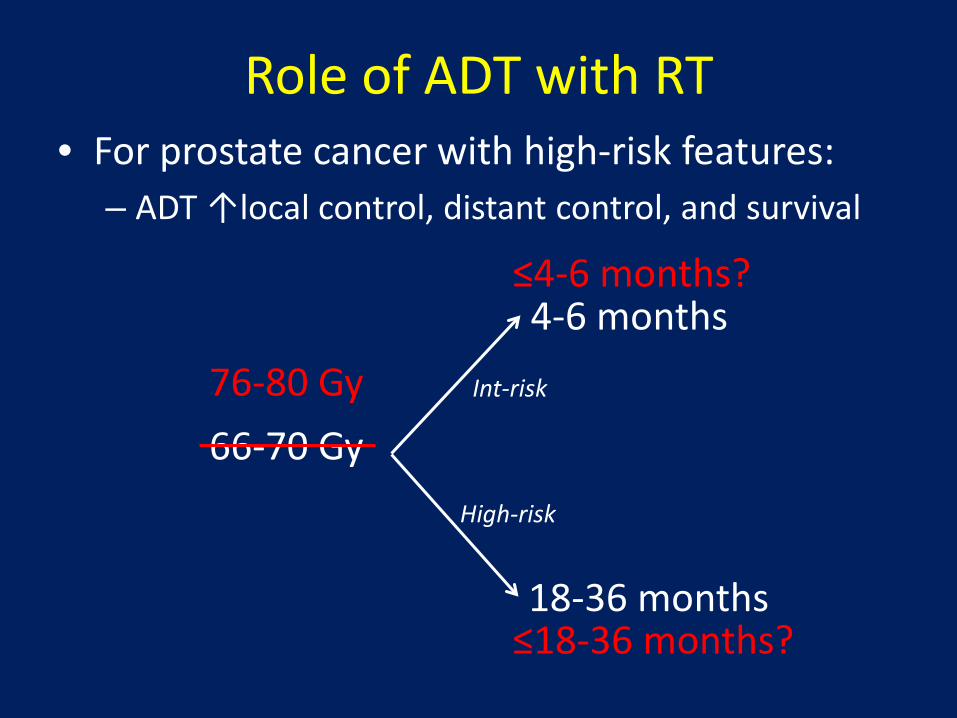
Role of ADT with RT • For prostate cancer with high-risk features:
– ADT ↑local control, distant control, and survival
66-70 Gy Int-risk
4-6 months
18-36 months
High-risk
76-80 Gy
≤4-6 months?
≤18-36 months?

Dose escalated EBRT +/- ADT
– After dose escalated RT, long term ADT is associated with better biochemical and distant control
Feng IJROBP 2013
Retrospective analysis of 234 men treated with 75-79.2 Gy and varying ADT
>≥1 year

0.00.10.20.30.40.50.60.70.80.91.0
FFbF
0 12 24 36 48 60Time (months )
PSA response as a prognostic variable?
These potential biomarkers to guide duration of ADT must be further tested
Pre-RT PSA halving time ≤ 2 weeks
4yr FFbF 96%
4yr FFbF 81%
Pre-RT PSA nadir ≤0.3
Post-RT PSA nadir ≤0.5
8yr PCSM 4-7%
8yr PCSM 27-28%
10yr FFDM 86%
10yr FFDM 79%
D’Amico Lancet Onc 2012 Malik IJROBP 2011
Zelefsky IJROBP 2013
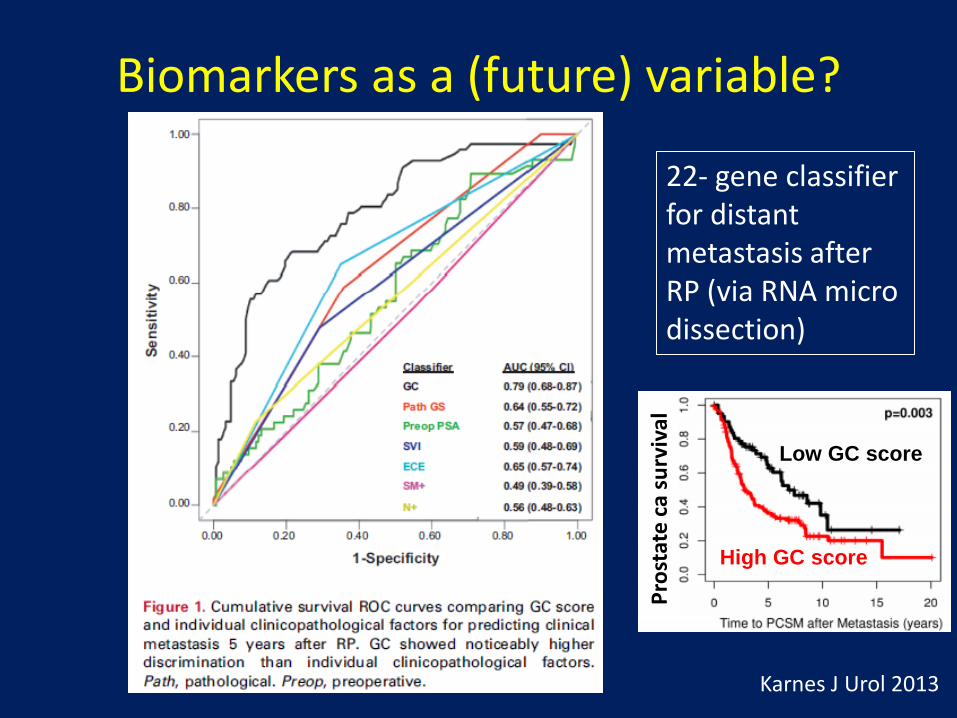
Biomarkers as a (future) variable?
Karnes J Urol 2013
22- gene classifier for distant metastasis after RP (via RNA micro dissection)
Low GC score
High GC score
Pros
tate
ca su
rviv
al
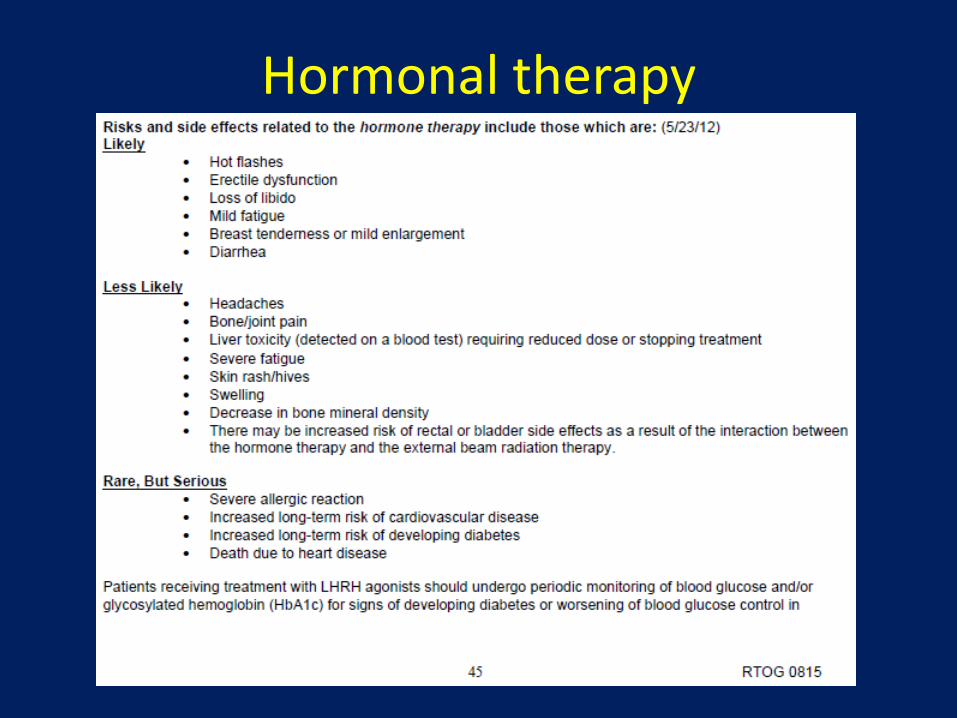
Hormonal therapy
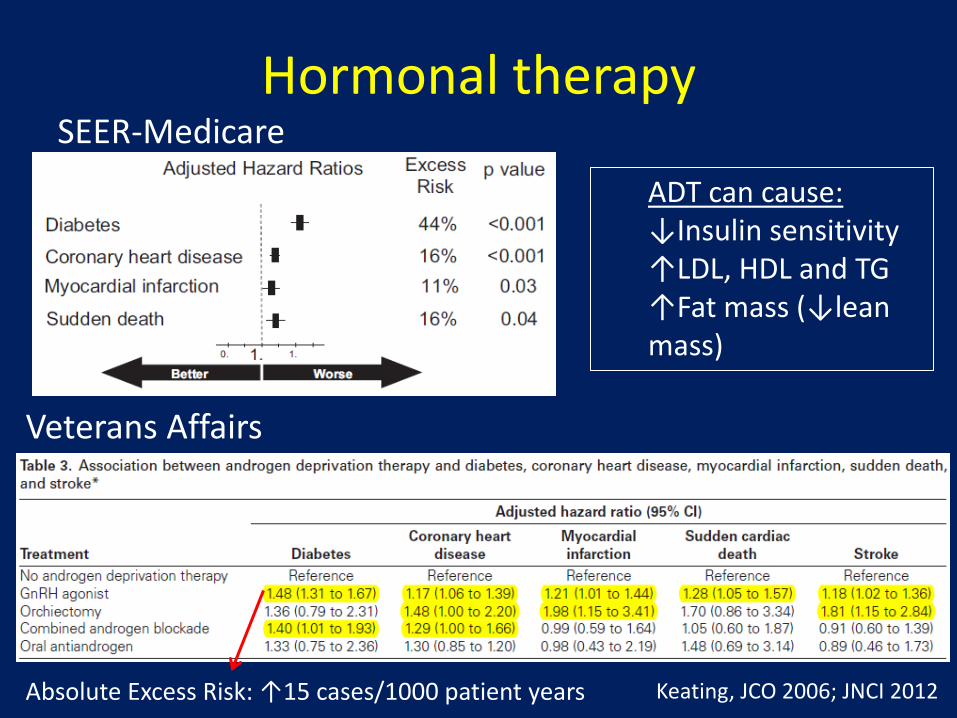
Hormonal therapy SEER-Medicare
Keating, JCO 2006; JNCI 2012
ADT can cause: ↓Insulin sensitivity ↑LDL, HDL and TG ↑Fat mass (↓lean mass)
Veterans Affairs
Absolute Excess Risk: ↑15 cases/1000 patient years
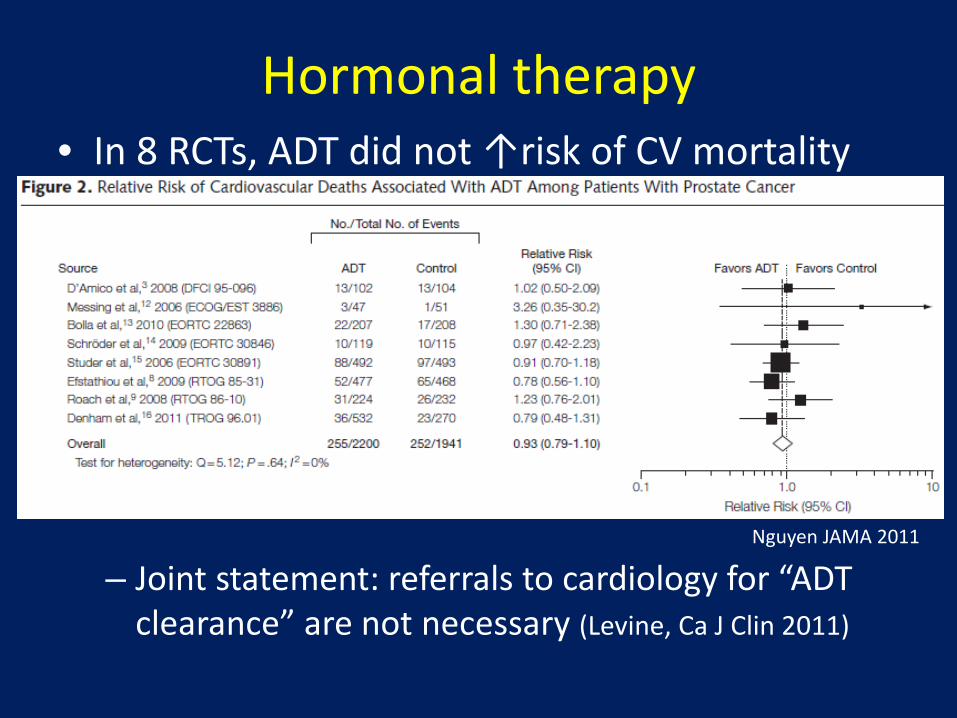
Hormonal therapy
– Joint statement: referrals to cardiology for “ADT clearance” are not necessary (Levine, Ca J Clin 2011)
Nguyen JAMA 2011
• In 8 RCTs, ADT did not ↑risk of CV mortality
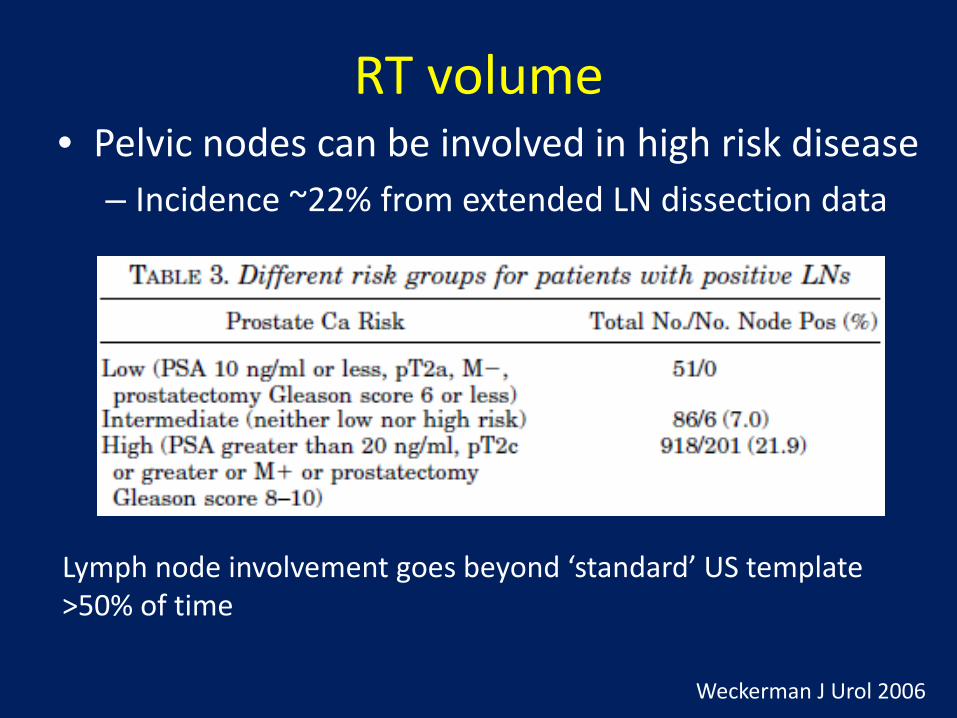
RT volume • Pelvic nodes can be involved in high risk disease
– Incidence ~22% from extended LN dissection data
Lymph node involvement goes beyond ‘standard’ US template >50% of time
Weckerman J Urol 2006

RT volume
n Eligibility Arms Endpoints affected RTOG 9413 (2003,2007)
1292 T2c-4 GS6+, or LN+ risk >15%; PSA<100
Whole Pelvis vs. Px only Neoadj HT vs. Adj HT
Trend PFS for WPRT/NHT (and PORT/AHT)
GETUG-01 (2007)
444 T1b-3 Low pelvis RT vs. Px only (ADT allowed)
None
• Does pelvic radiation improve outcomes?
Lawton IJROBP 2007
WP/NHT vs. PO/NHT p=0.066 WP/AHT p=0.022 PO/AHT p=0.75
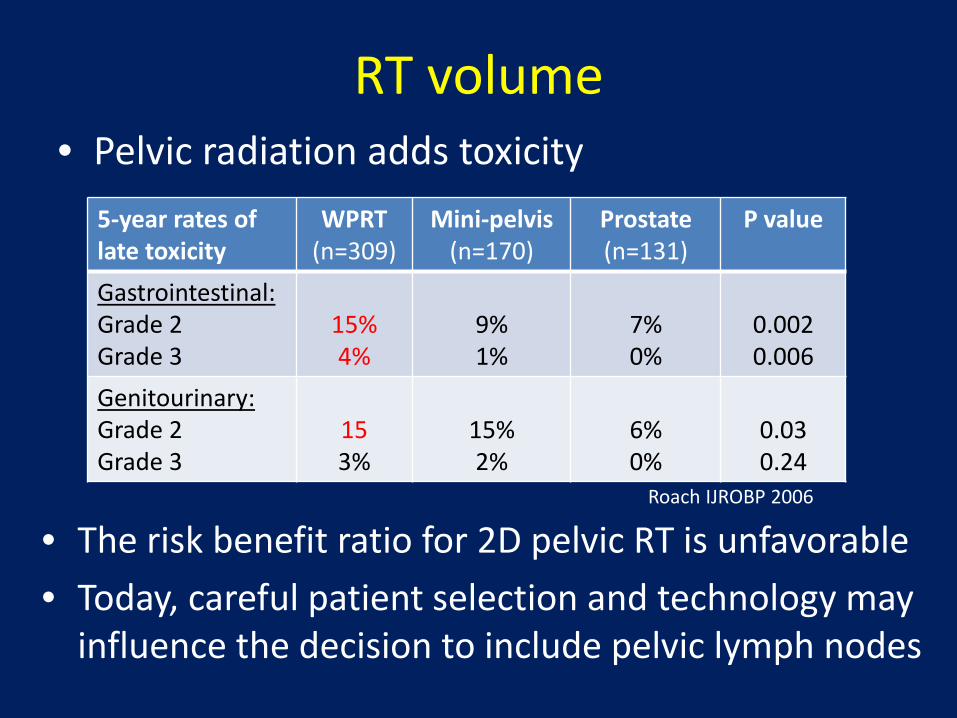
RT volume
5-year rates of late toxicity
WPRT (n=309)
Mini-pelvis (n=170)
Prostate (n=131)
P value
Gastrointestinal: Grade 2 Grade 3
15% 4%
9% 1%
7% 0%
0.002 0.006
Genitourinary: Grade 2 Grade 3
15 3%
15% 2%
6% 0%
0.03 0.24
• Pelvic radiation adds toxicity
• The risk benefit ratio for 2D pelvic RT is unfavorable • Today, careful patient selection and technology may
influence the decision to include pelvic lymph nodes
Roach IJROBP 2006
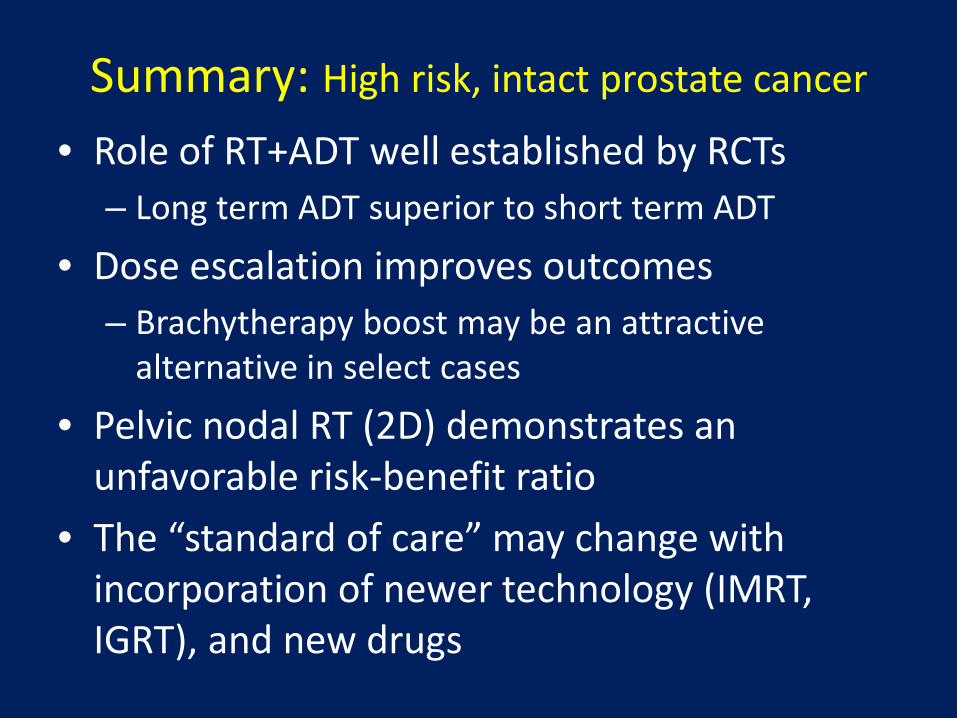
Summary: High risk, intact prostate cancer
• Role of RT+ADT well established by RCTs – Long term ADT superior to short term ADT
• Dose escalation improves outcomes – Brachytherapy boost may be an attractive
alternative in select cases
• Pelvic nodal RT (2D) demonstrates an unfavorable risk-benefit ratio
• The “standard of care” may change with incorporation of newer technology (IMRT, IGRT), and new drugs

UCMC guidelines for Intact prostate cancer
• Comorbidity can downstage treatment (~1 category) • Consider protocol enrollment a priority when eligible
Always weigh comorbidity (and consider surveillance)
Low-risk Intermediate risk High risk NCCN risk category:
EBRT:
ADT:
brachy:
78 Gy at 2/fx Prostate only
No
Monotherapy preferred if age<65
<50% cores ≥50% cores <T3 T3; GS9-10; high vol; N1
78 Gy at 2/fx Prostate/SV
No
Monotherapy preferred if age<65
78 Gy at 2/fx Prostate/SV
6 mo
Boost considered if age<65
78 Gy at 2/fx Prostate/SV
6 vs. 28 mo
Boost considered if age<65
79.2 Gy at 1.8/fx Pelvic LN, Px/SV
28 mo
Boost considered if age<65
Discuss: Treatment vs. no treatment, Surgery vs. RT

Post-operative Prostate Cancer

Outcomes after prostatectomy Overview Risk factors %bNED-10 y
8 centers Karakiewicz Urol 2005
N=5831
1983-2000 Med fu 25 mo
bNED 61% at 10 y 0% adj RT
+ margins ECE, +/- margins SVI, +/- margins LNI, +/- margins
36 25/46 12/20 14/8
Wash U Roehl J Urol 2004
n=3478
1983-2003 Med fu 65 mo
bNED 68% at 10 y 6% adj RT
Stage cT3 Gleason score ≥8 ECE, +/- margins
SVI LN
15 32
53/62 26 12
Baylor Hull J Urol 2002 n=1000
1983-1998 Med fu 47 mo
bNED 75% at 10 y 0% adj treatment
+margins ECE alone
SVI LN
36 71 37 7
Men with +margins, pT3 disease have >50% risk of failure at 10 yrs
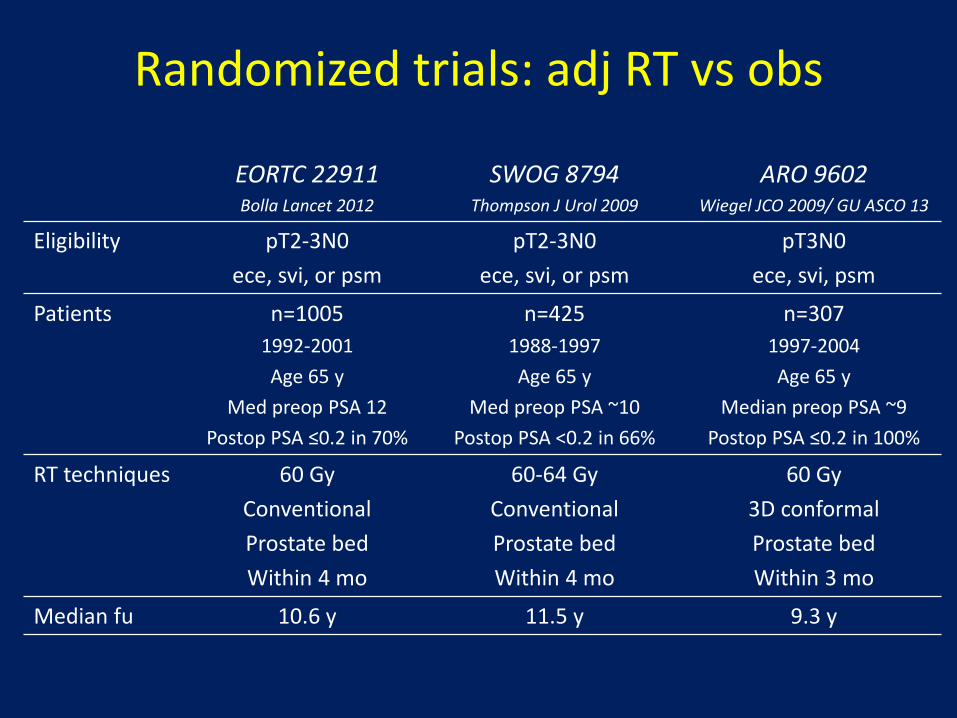
Randomized trials: adj RT vs obs
EORTC 22911 Bolla Lancet 2012
SWOG 8794 Thompson J Urol 2009
ARO 9602 Wiegel JCO 2009/ GU ASCO 13
Eligibility pT2-3N0 ece, svi, or psm
pT2-3N0 ece, svi, or psm
pT3N0 ece, svi, psm
Patients n=1005 1992-2001 Age 65 y
Med preop PSA 12 Postop PSA ≤0.2 in 70%
n=425 1988-1997 Age 65 y
Med preop PSA ~10 Postop PSA <0.2 in 66%
n=307 1997-2004 Age 65 y
Median preop PSA ~9 Postop PSA ≤0.2 in 100%
RT techniques 60 Gy Conventional Prostate bed Within 4 mo
60-64 Gy Conventional Prostate bed Within 4 mo
60 Gy 3D conformal Prostate bed Within 3 mo
Median fu 10.6 y 11.5 y 9.3 y
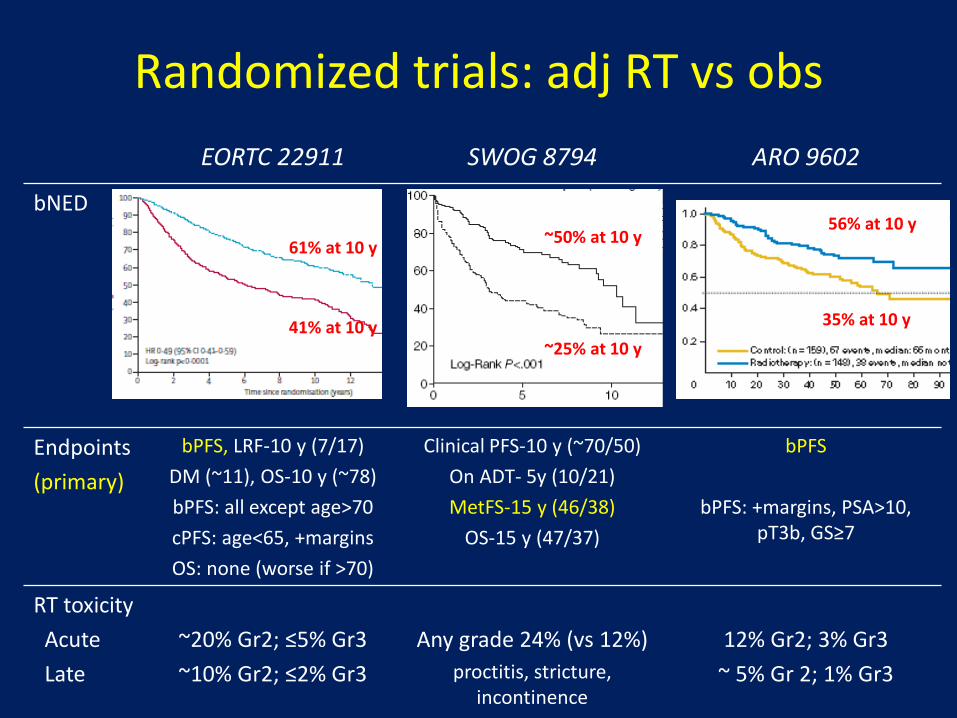
EORTC 22911 SWOG 8794 ARO 9602
bNED
Endpoints (primary)
bPFS, LRF-10 y (7/17) DM (~11), OS-10 y (~78) bPFS: all except age>70 cPFS: age<65, +margins OS: none (worse if >70)
Clinical PFS-10 y (~70/50) On ADT- 5y (10/21) MetFS-15 y (46/38)
OS-15 y (47/37)
bPFS
bPFS: +margins, PSA>10, pT3b, GS≥7
RT toxicity Acute Late
~20% Gr2; ≤5% Gr3 ~10% Gr2; ≤2% Gr3
Any grade 24% (vs 12%)
proctitis, stricture, incontinence
12% Gr2; 3% Gr3
~ 5% Gr 2; 1% Gr3
Randomized trials: adj RT vs obs
61% at 10 y
41% at 10 y
~50% at 10 y
~25% at 10 y
56% at 10 y
35% at 10 y
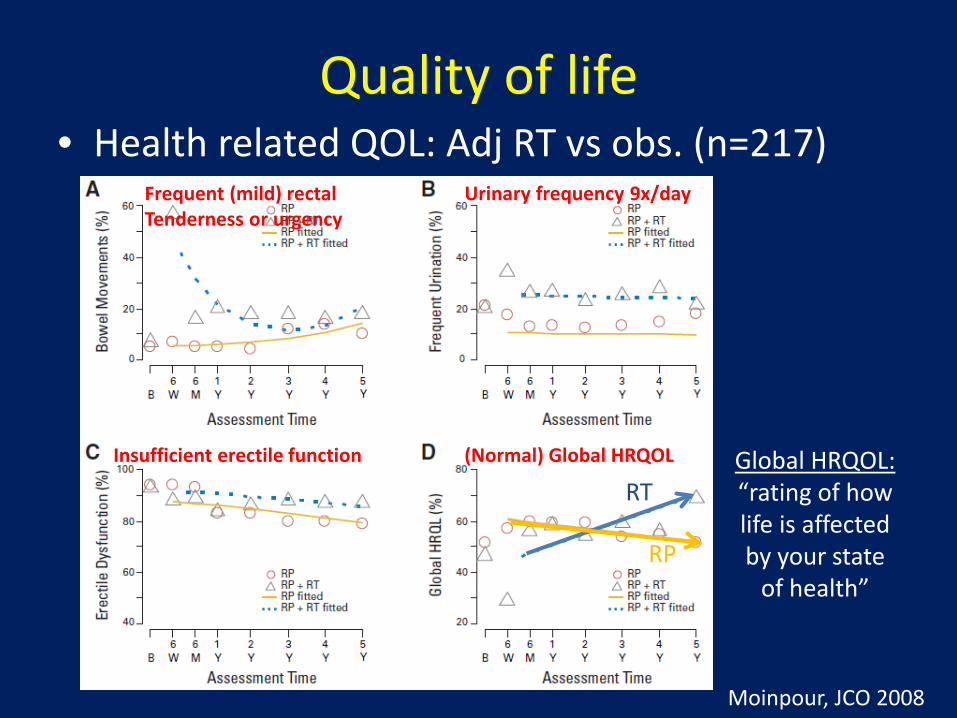
Quality of life • Health related QOL: Adj RT vs obs. (n=217)
Global HRQOL: “rating of how life is affected by your state
of health”
Moinpour, JCO 2008
Frequent (mild) rectal Tenderness or urgency
Urinary frequency 9x/day
Insufficient erectile function (Normal) Global HRQOL
RT
RP
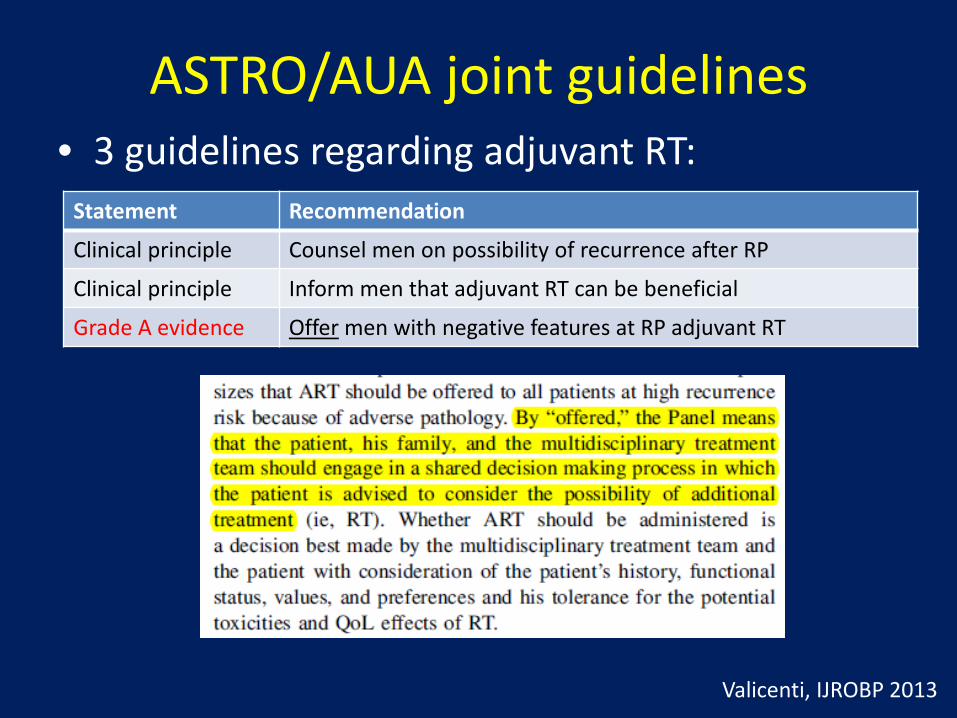
ASTRO/AUA joint guidelines • 3 guidelines regarding adjuvant RT:
Valicenti, IJROBP 2013
Statement Recommendation
Clinical principle Counsel men on possibility of recurrence after RP
Clinical principle Inform men that adjuvant RT can be beneficial
Grade A evidence Offer men with negative features at RP adjuvant RT
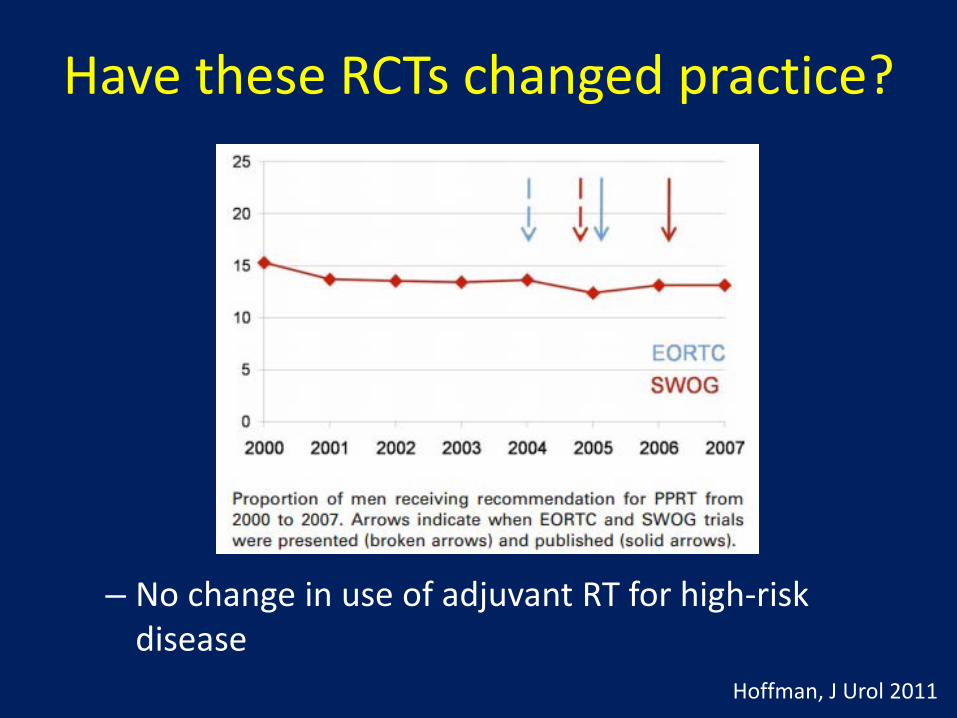
Have these RCTs changed practice?
– No change in use of adjuvant RT for high-risk disease
Hoffman, J Urol 2011

Concerns with adjuvant RT exist 1. “Observation” group did not routinely
receive early salvage RT after failure
– Original protocol specified salvage treatment at LF – If early salvage RT were routinely given, perhaps
we would not detect a benefit with adjuvant RT Bolla, Lancet 2005
Median time 2.2 years
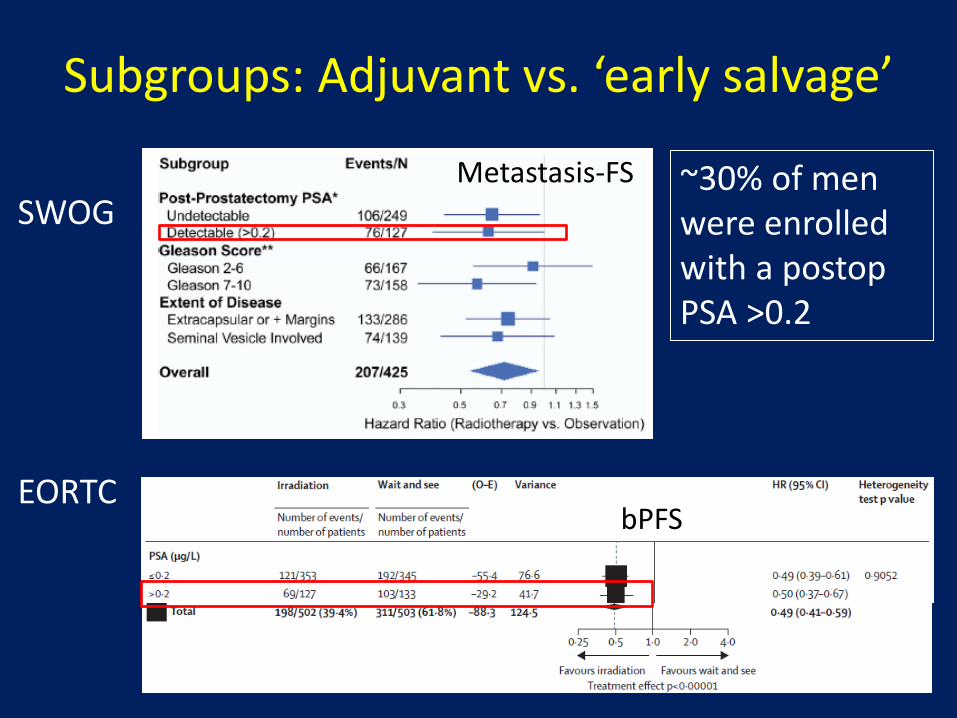
Subgroups: Adjuvant vs. ‘early salvage’
SWOG
EORTC
~30% of men were enrolled with a postop PSA >0.2
bPFS
Metastasis-FS
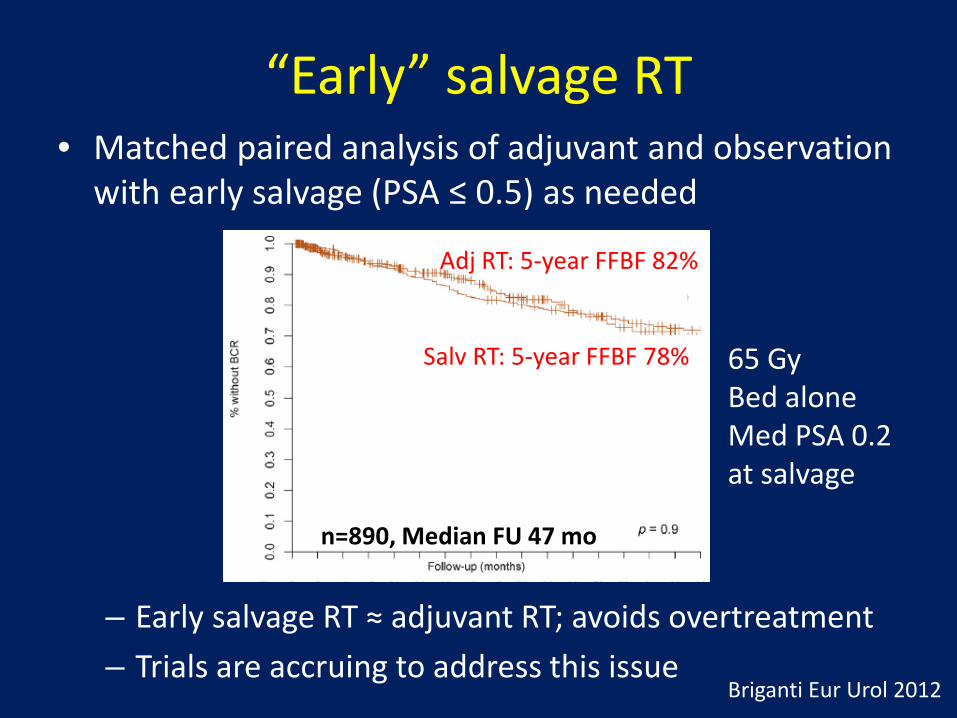
“Early” salvage RT • Matched paired analysis of adjuvant and observation
with early salvage (PSA ≤ 0.5) as needed
– Early salvage RT ≈ adjuvant RT; avoids overtreatment – Trials are accruing to address this issue
Salv RT: 5-year FFBF 78%
Briganti Eur Urol 2012
n=890, Median FU 47 mo
Adj RT: 5-year FFBF 82%
65 Gy Bed alone Med PSA 0.2 at salvage
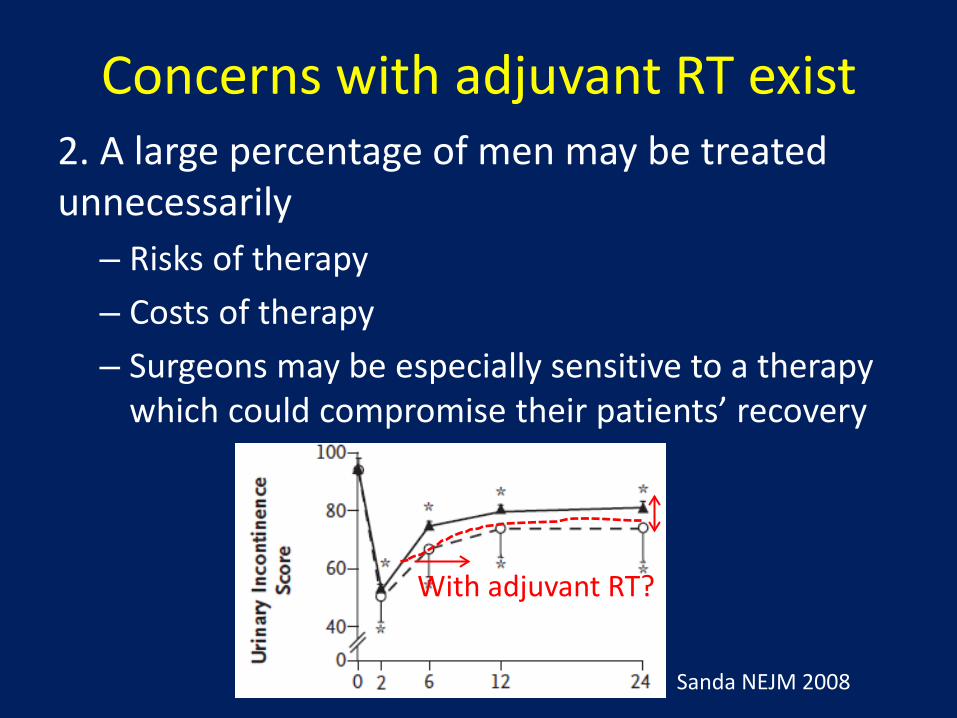
Concerns with adjuvant RT exist 2. A large percentage of men may be treated unnecessarily
– Risks of therapy – Costs of therapy – Surgeons may be especially sensitive to a therapy
which could compromise their patients’ recovery
With adjuvant RT?
Sanda NEJM 2008
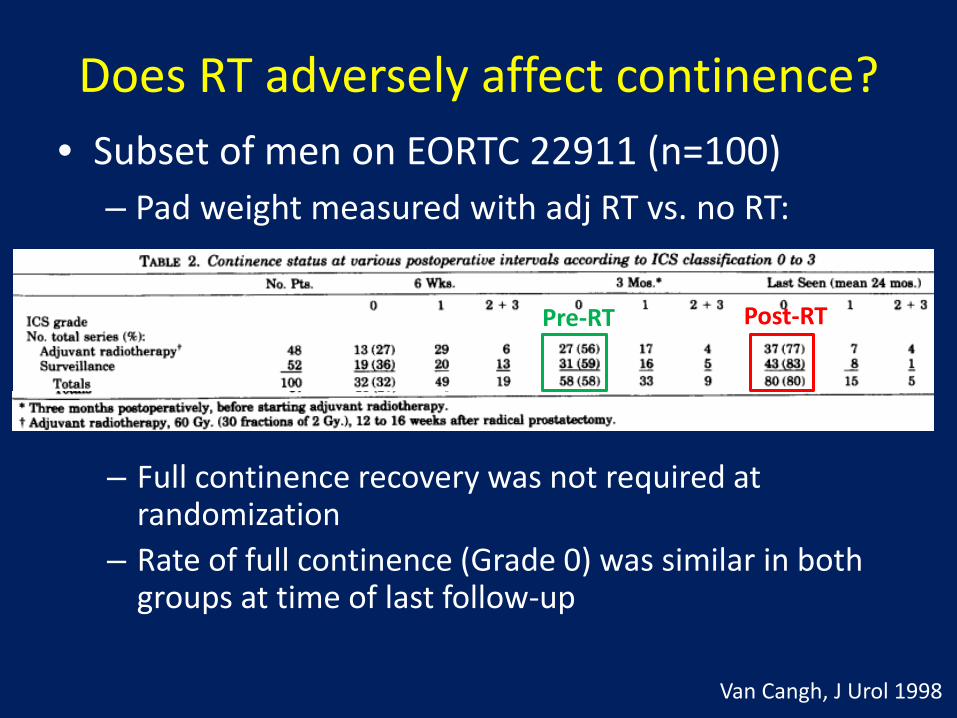
Does RT adversely affect continence? • Subset of men on EORTC 22911 (n=100)
– Pad weight measured with adj RT vs. no RT:
– Full continence recovery was not required at randomization
– Rate of full continence (Grade 0) was similar in both groups at time of last follow-up
Van Cangh, J Urol 1998
Pre-RT Post-RT
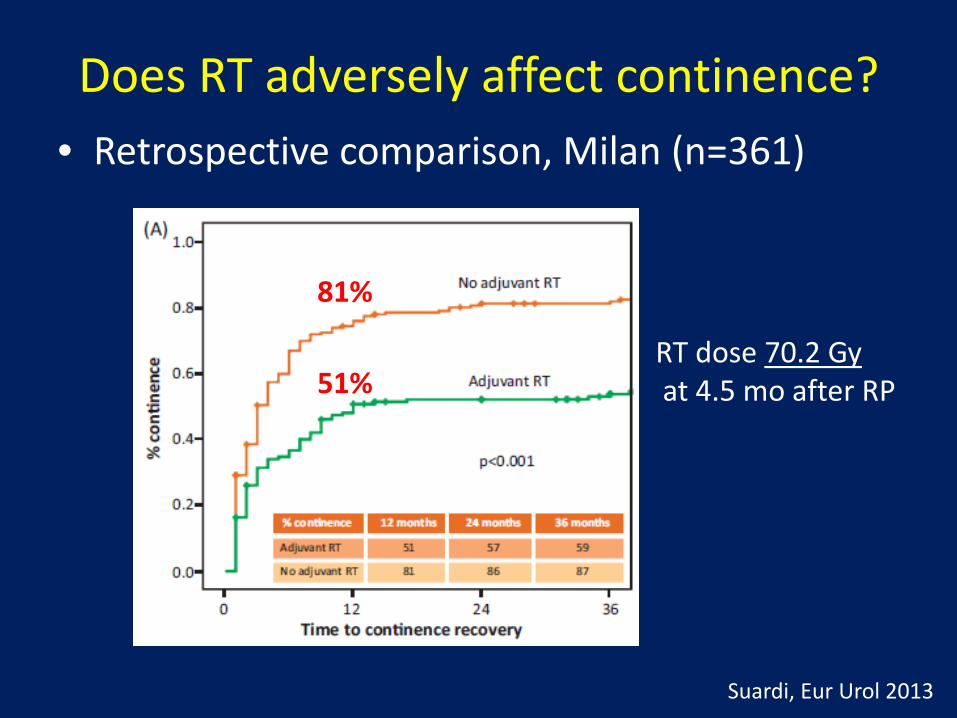
Does RT adversely affect continence? • Retrospective comparison, Milan (n=361)
RT dose 70.2 Gy at 4.5 mo after RP
81%
51%
Suardi, Eur Urol 2013
The Ideal candidate for adjuvant RT (?) • High risk for recurrence:
– Positive margins or pT3 – Consider for post-RP LN+ disease
• Reasonably good recovery of continence • Longer life expectancy • Patient who understands potential pros/cons
of therapy

The Ideal candidate for adjuvant RT (?) • Hypotheses: Adjuvant RT is better because …
– Adjuvant treatment is less toxic than salvage RT 60-64 Gy without ADT vs. ~68+ Gy +/- ADT
– A delay in treatment might ↑risk of DM – PSA does not reliably report disease burden or
growth kinetics in all cases – Follow-up anxiety can be minimized
Caveat: We cannot confirm that early salvage RT is an inferior approach
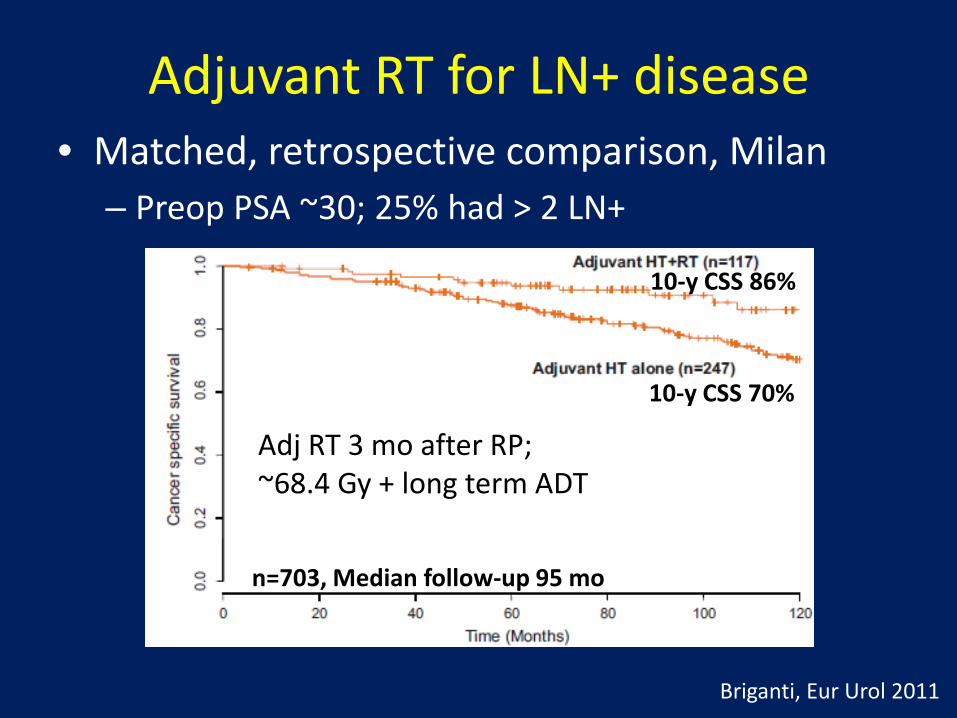
Adjuvant RT for LN+ disease • Matched, retrospective comparison, Milan
– Preop PSA ~30; 25% had > 2 LN+
Briganti, Eur Urol 2011
n=703, Median follow-up 95 mo
10-y CSS 86%
10-y CSS 70%
Adj RT 3 mo after RP; ~68.4 Gy + long term ADT
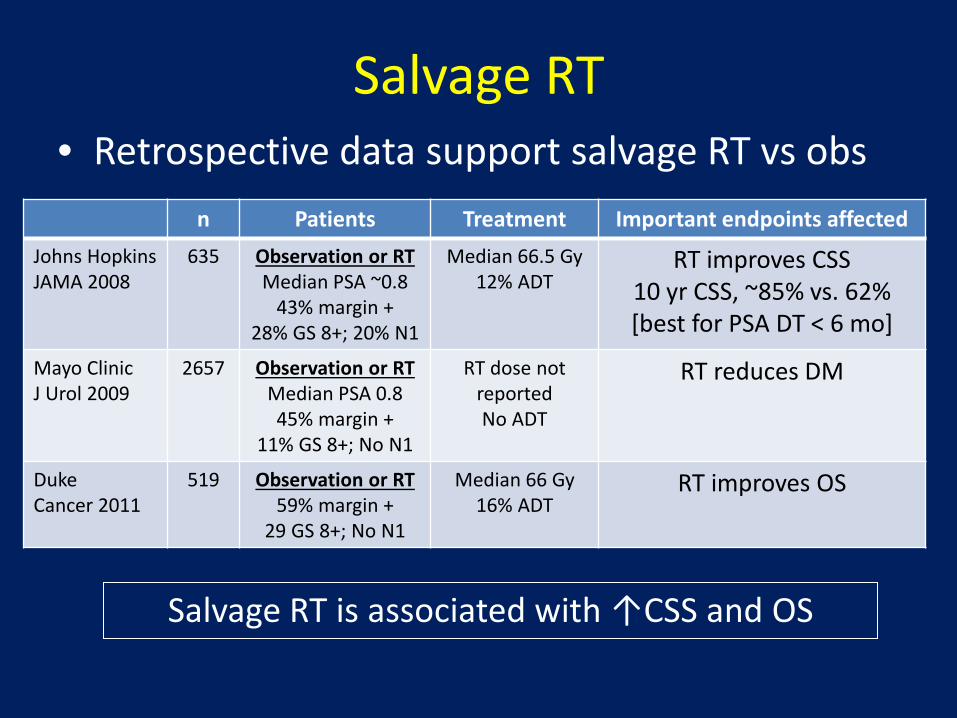
Salvage RT • Retrospective data support salvage RT vs obs
n Patients Treatment Important endpoints affected Johns Hopkins JAMA 2008
635 Observation or RT Median PSA ~0.8
43% margin + 28% GS 8+; 20% N1
Median 66.5 Gy 12% ADT
RT improves CSS 10 yr CSS, ~85% vs. 62% [best for PSA DT < 6 mo]
Mayo Clinic J Urol 2009
2657 Observation or RT Median PSA 0.8 45% margin +
11% GS 8+; No N1
RT dose not reported No ADT
RT reduces DM
Duke Cancer 2011
519 Observation or RT 59% margin +
29 GS 8+; No N1
Median 66 Gy 16% ADT
RT improves OS
Salvage RT is associated with ↑CSS and OS

Salvage RT
PSA ≤ 0.5 PSA > 1.5
48% 18%
FFP-6 y FFP associated with: • Gleason score • Pre-RT PSA • LN involvement • Margin status • PSA DT • Use of ADT
Stephenson, JCO 2007
– Similar to intact prostate (T/N, Gleason, PSA) + two post-op factors (margins and PSA DT)
n=1540, Median follow-up 53 mo

Salvage RT • Meta-analysis of 41 salvage RT studies
King IJROBP 2012
– Best outcomes with lower pre-RT PSA (0.2 probably better than 0.5)
2.6% loss of RFS per ↑0.1 ng/mL PSA
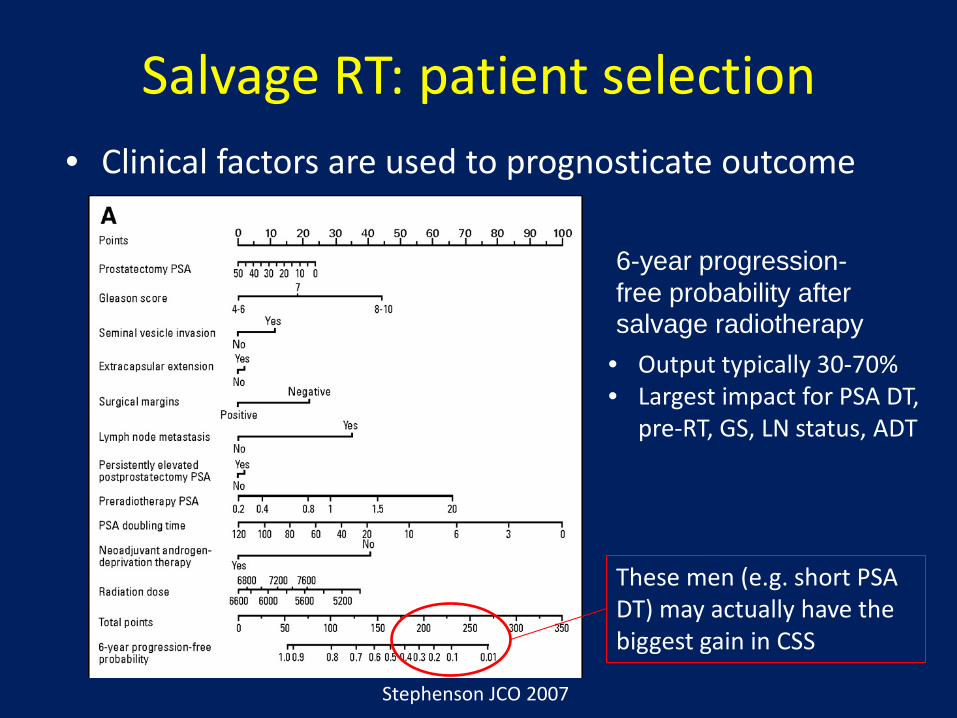
Salvage RT: patient selection • Clinical factors are used to prognosticate outcome
6-year progression-free probability after salvage radiotherapy
Stephenson JCO 2007
• Output typically 30-70% • Largest impact for PSA DT,
pre-RT, GS, LN status, ADT
These men (e.g. short PSA DT) may actually have the biggest gain in CSS
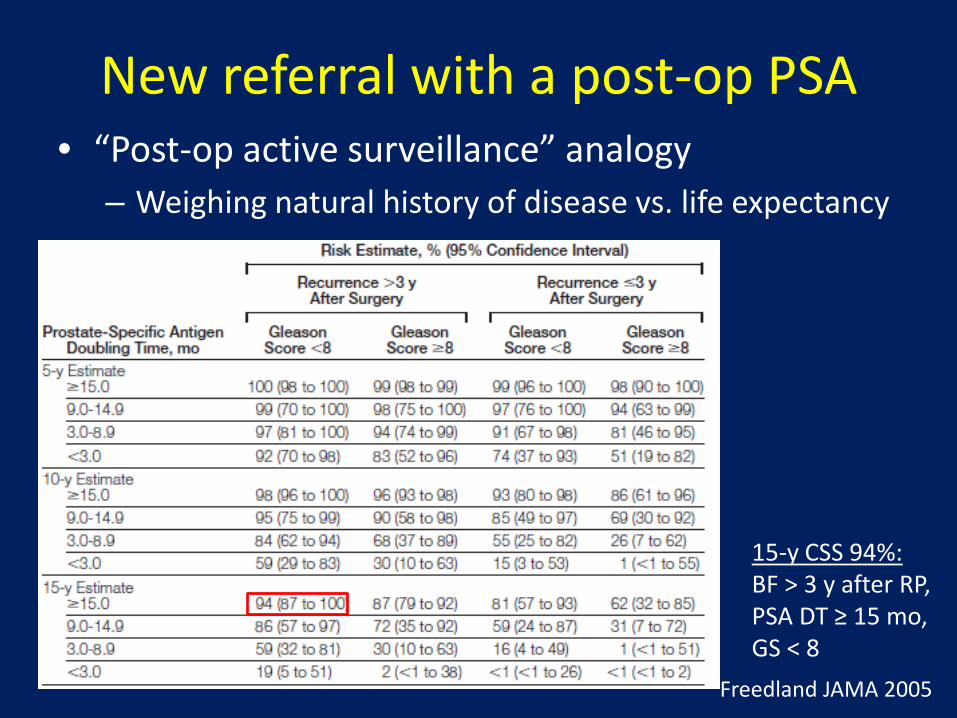
New referral with a post-op PSA • “Post-op active surveillance” analogy
– Weighing natural history of disease vs. life expectancy
Freedland JAMA 2005
15-y CSS 94%: BF > 3 y after RP, PSA DT ≥ 15 mo, GS < 8
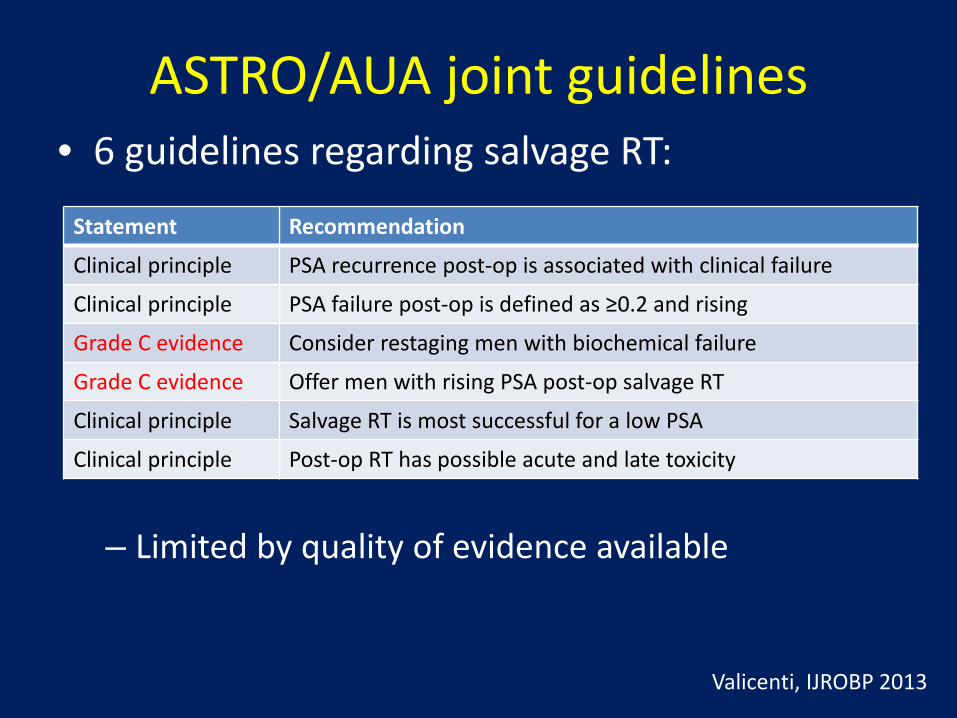
ASTRO/AUA joint guidelines
– Limited by quality of evidence available
Statement Recommendation
Clinical principle PSA recurrence post-op is associated with clinical failure
Clinical principle PSA failure post-op is defined as ≥0.2 and rising
Grade C evidence Consider restaging men with biochemical failure
Grade C evidence Offer men with rising PSA post-op salvage RT
Clinical principle Salvage RT is most successful for a low PSA
Clinical principle Post-op RT has possible acute and late toxicity
Valicenti, IJROBP 2013
• 6 guidelines regarding salvage RT:
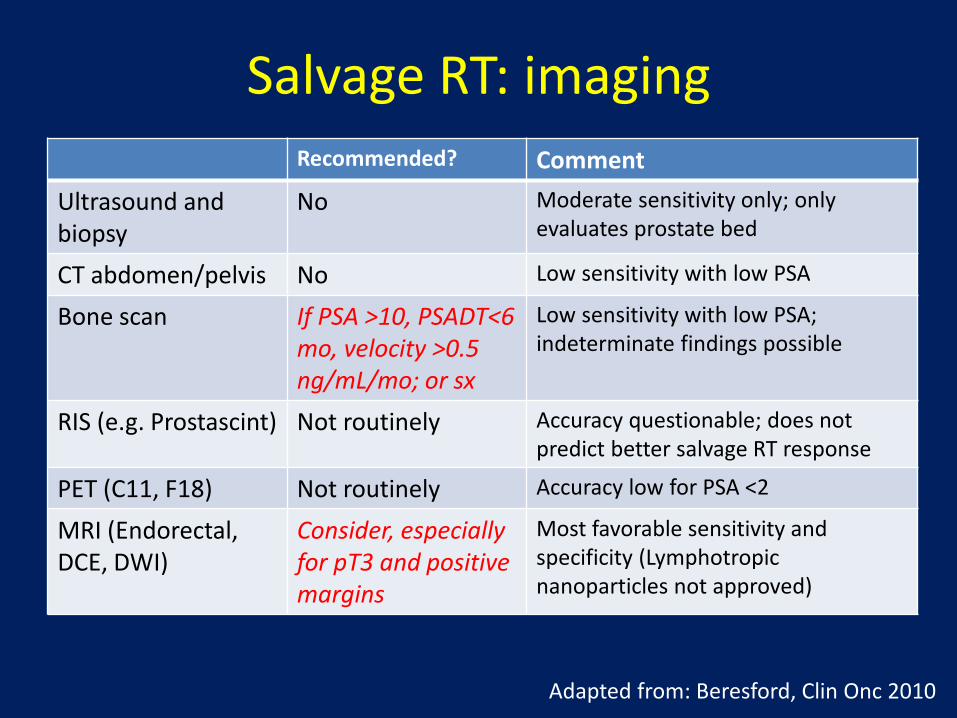
Salvage RT: imaging Recommended? Comment
Ultrasound and biopsy
No Moderate sensitivity only; only evaluates prostate bed
CT abdomen/pelvis No Low sensitivity with low PSA
Bone scan If PSA >10, PSADT<6 mo, velocity >0.5 ng/mL/mo; or sx
Low sensitivity with low PSA; indeterminate findings possible
RIS (e.g. Prostascint) Not routinely Accuracy questionable; does not predict better salvage RT response
PET (C11, F18) Not routinely Accuracy low for PSA <2
MRI (Endorectal, DCE, DWI)
Consider, especially for pT3 and positive margins
Most favorable sensitivity and specificity (Lymphotropic nanoparticles not approved)
Adapted from: Beresford, Clin Onc 2010

Salvage RT: Endorectal MRI
• 88 men evaluated for salvage RT, median PSA 0.3 – Radiographic abnormalities in prostate bed in 24% (α PSA) – Abnormalities seen on T2 MRI (90%) > DWI or DCE
• Still unclear whether MRI findings should influence patient selection or treatment
Liauw IJROBP 2013
“Local recurrences” as seen on endorectal MRI:
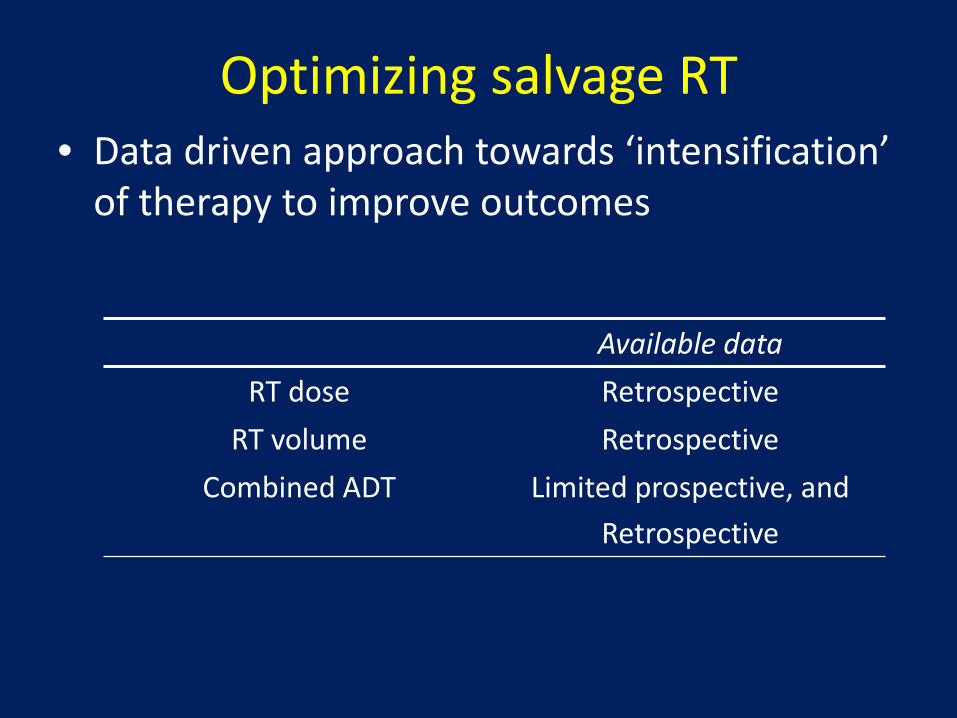
Optimizing salvage RT • Data driven approach towards ‘intensification’
of therapy to improve outcomes
Available data RT dose Retrospective
RT volume Retrospective Combined ADT Limited prospective, and
Retrospective
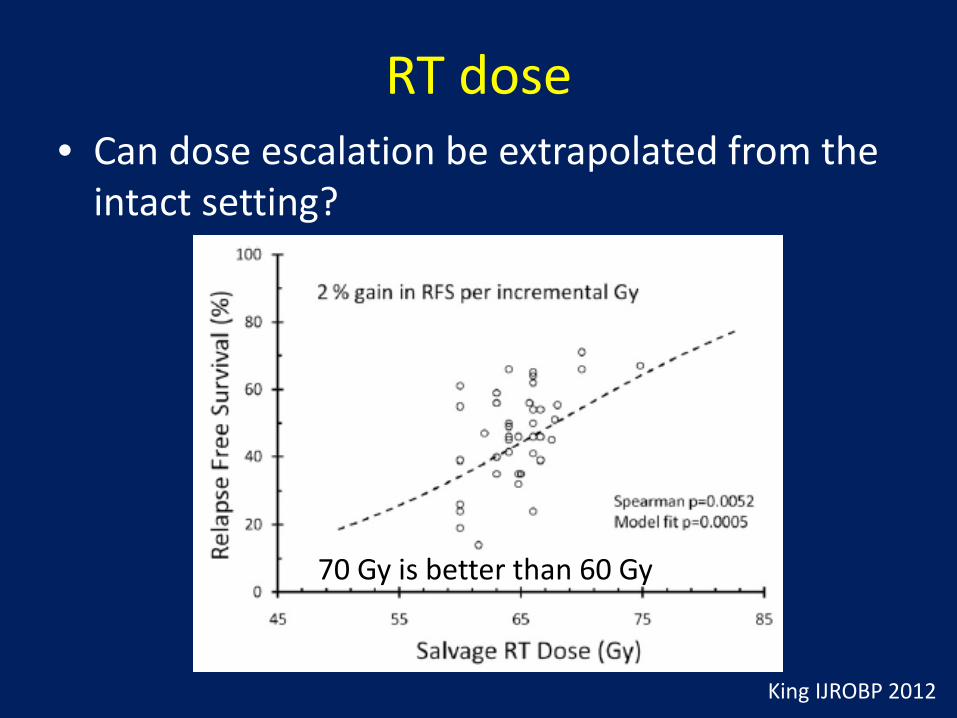
RT dose • Can dose escalation be extrapolated from the
intact setting?
King IJROBP 2012
70 Gy is better than 60 Gy
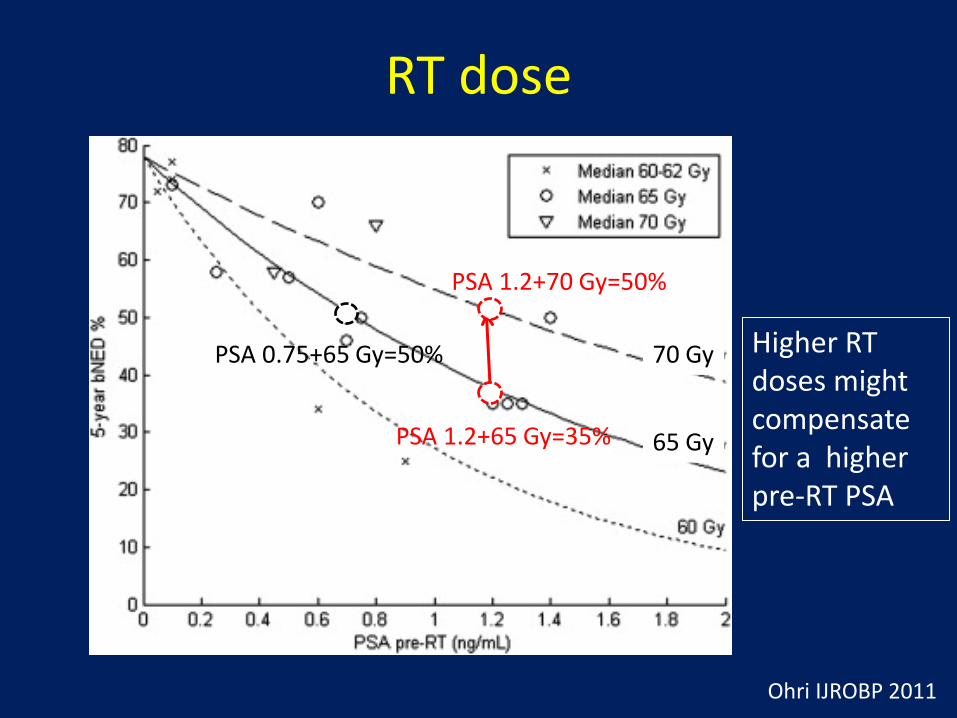
RT dose
Ohri IJROBP 2011
70 Gy
65 Gy
Higher RT doses might compensate for a higher pre-RT PSA
PSA 1.2+70 Gy=50%
PSA 0.75+65 Gy=50%
PSA 1.2+65 Gy=35%

RT dose • Is there an upper limit to the dose response?
Goenka IJROBP 2012
… but dose ≥70 Gy was associated with lower rate of local failure men with LF on eMRI (p=0.07)
n=285, Median follow-up 60 mo
Median pre-RT PSA 0.4

RT dose
• High dose IMRT is tolerated with limited G3 tox (Smaller, MRI defined prostate bed + 4-7 mm with IGRT)
Ost Eur Urol 2011
n=136, Med follow-up 60 mo
5 year FFBF 56%
Toxicity: Gr2-3 GU 22% Gr2-3 GI 8%
• 76 Gy to the post-operative bed
Median pre-RT PSA 0.8
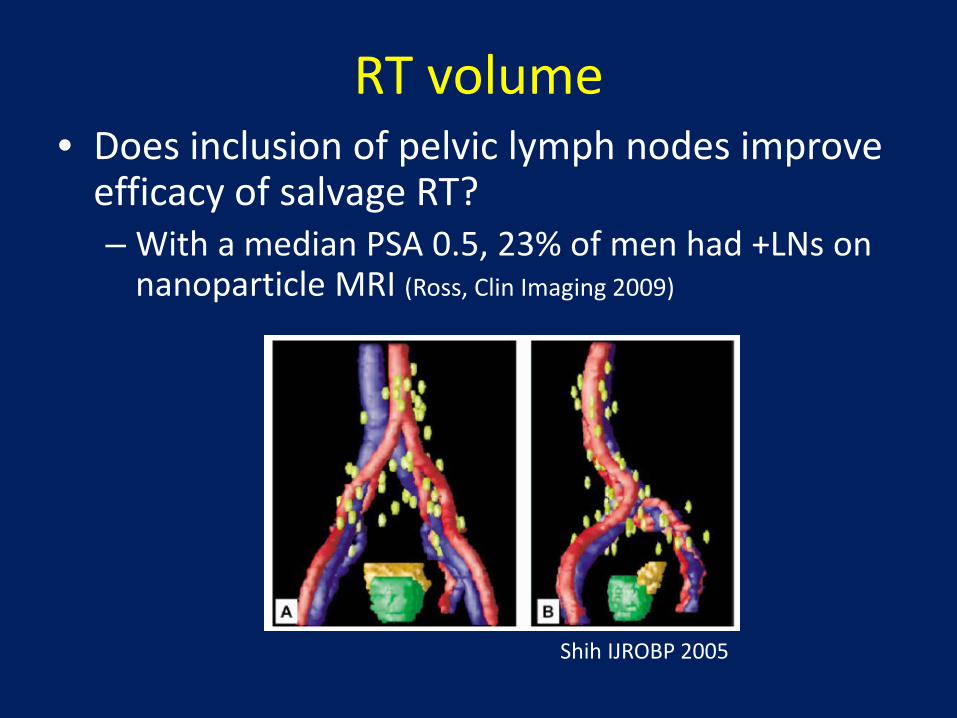
RT volume • Does inclusion of pelvic lymph nodes improve
efficacy of salvage RT? – With a median PSA 0.5, 23% of men had +LNs on
nanoparticle MRI (Ross, Clin Imaging 2009)
Shih IJROBP 2005

RT volume
– Certain subsets may benefit from pelvic nodal RT
Spiotto IJROBP 2007 Moghanaki Cancer 2013
Stanford Duke/VCU Subset: pT3, GS8+, preop PSA>20 (with ADT)
Subset: PSA >0.4 (no ADT)
WPRT
PBRT n=139, median follow-up 4 y
n=114, median follow-up >5 y
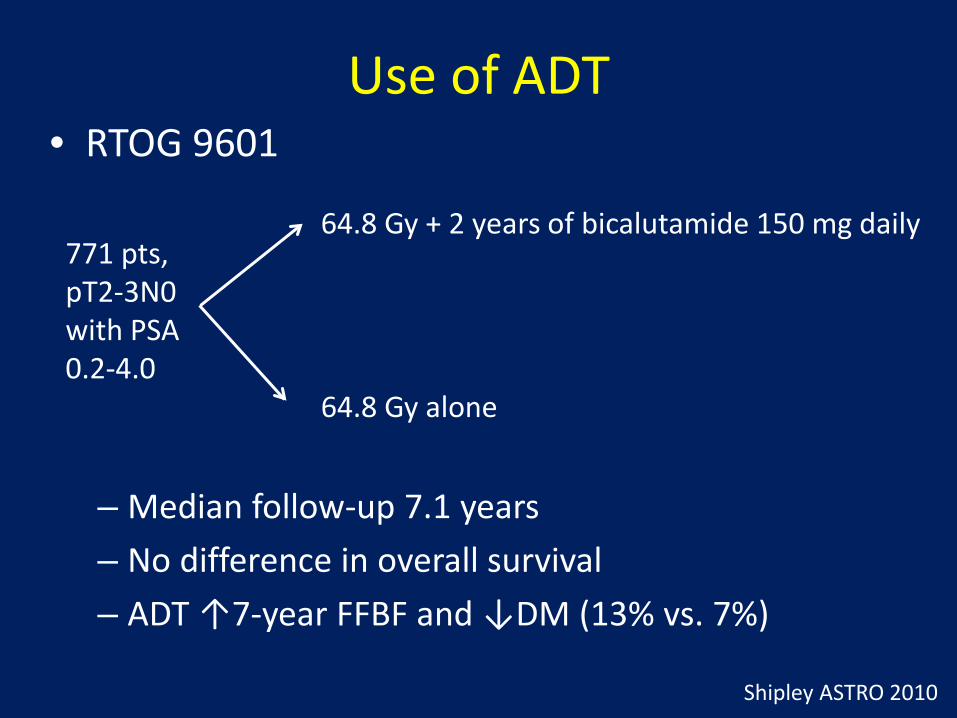
Use of ADT • RTOG 9601
771 pts, pT2-3N0 with PSA 0.2-4.0
64.8 Gy + 2 years of bicalutamide 150 mg daily
64.8 Gy alone
– Median follow-up 7.1 years – No difference in overall survival – ADT ↑7-year FFBF and ↓DM (13% vs. 7%)
Shipley ASTRO 2010
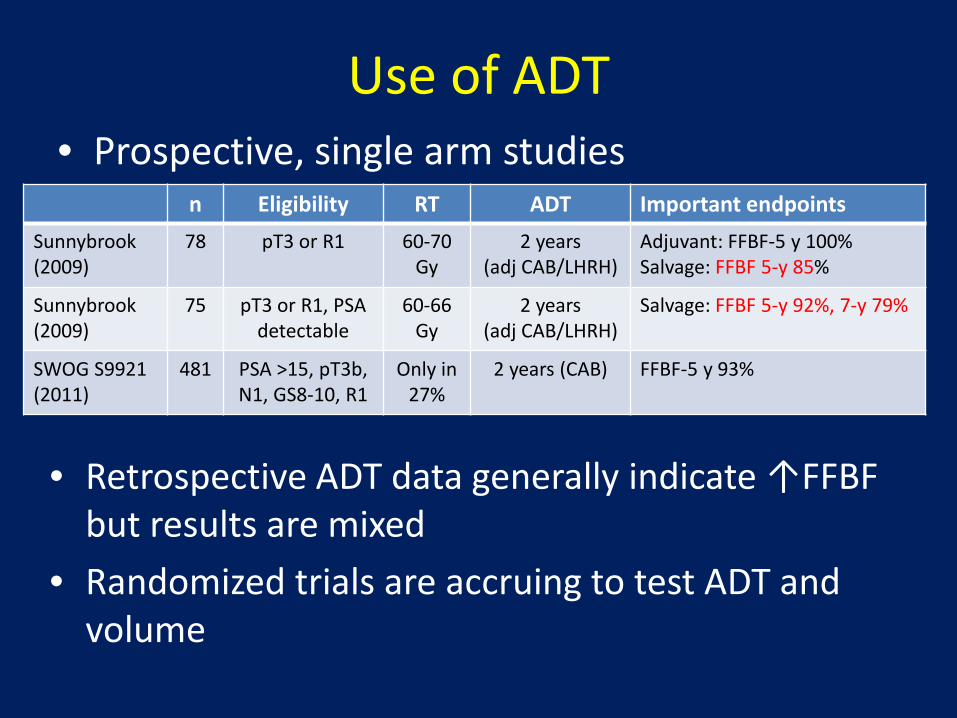
Use of ADT
• Retrospective ADT data generally indicate ↑FFBF but results are mixed
• Randomized trials are accruing to test ADT and volume
n Eligibility RT ADT Important endpoints Sunnybrook (2009)
78 pT3 or R1 60-70 Gy
2 years (adj CAB/LHRH)
Adjuvant: FFBF-5 y 100% Salvage: FFBF 5-y 85%
Sunnybrook (2009)
75 pT3 or R1, PSA detectable
60-66 Gy
2 years (adj CAB/LHRH)
Salvage: FFBF 5-y 92%, 7-y 79%
SWOG S9921 (2011)
481 PSA >15, pT3b, N1, GS8-10, R1
Only in 27%
2 years (CAB) FFBF-5 y 93%
• Prospective, single arm studies
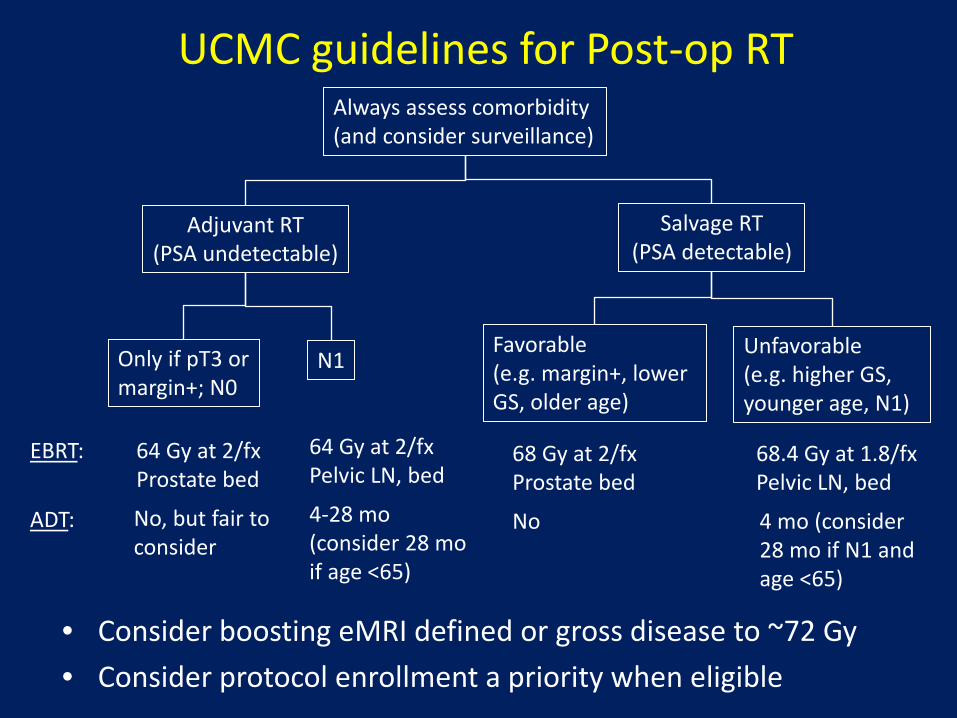
UCMC guidelines for Post-op RT
• Consider boosting eMRI defined or gross disease to ~72 Gy • Consider protocol enrollment a priority when eligible
Adjuvant RT (PSA undetectable)
Salvage RT (PSA detectable)
EBRT:
ADT:
64 Gy at 2/fx Prostate bed
No, but fair to consider
Only if pT3 or margin+; N0
N1 Favorable (e.g. margin+, lower GS, older age)
Unfavorable (e.g. higher GS, younger age, N1)
64 Gy at 2/fx Pelvic LN, bed
4-28 mo (consider 28 mo if age <65)
68 Gy at 2/fx Prostate bed
No
68.4 Gy at 1.8/fx Pelvic LN, bed
4 mo (consider 28 mo if N1 and age <65)
Always assess comorbidity (and consider surveillance)

Late Toxicity (Grade)
• Comparable toxicity rates to intact setting • Treatment factors including volume and dose
likely have impact
RT Modality (+/- ADT as indicated)
GI Toxicity GU Toxicity References
Gr2 Gr3 Gr2 Gr3
Adjuvant RT 5 2 5 2 EORTC
Salvage RT Standard dose 76 Gy with IMRT
5 8
1 1
10 22
1 3
Multi-institutional Belgium

Toxicity (Symptom Scores) • Patient reported QOL shows stability at 4 years
Melotek, submitted
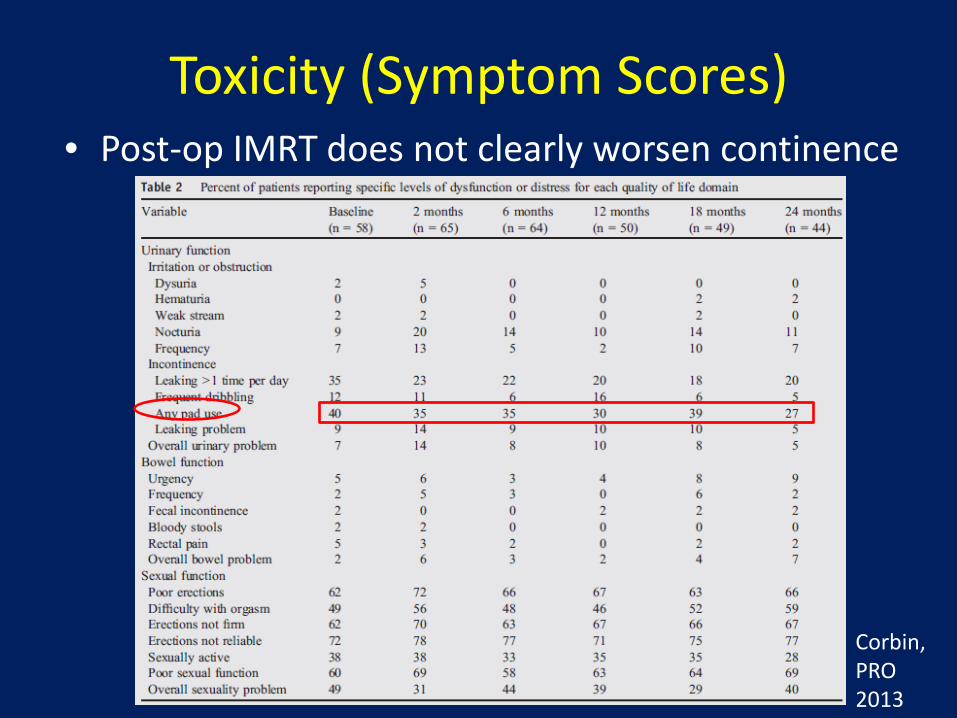
Toxicity (Symptom Scores) • Post-op IMRT does not clearly worsen continence
Corbin, PRO 2013

Contouring: Prostate bed
• RTOG guidelines are online for prostate bed and pelvic LNs
• Guidelines have been proposed by 4 groups – Differences mainly regard coverage of anterior
and superior prostate bed
Wiltshire, IJROBP 2007
PMH
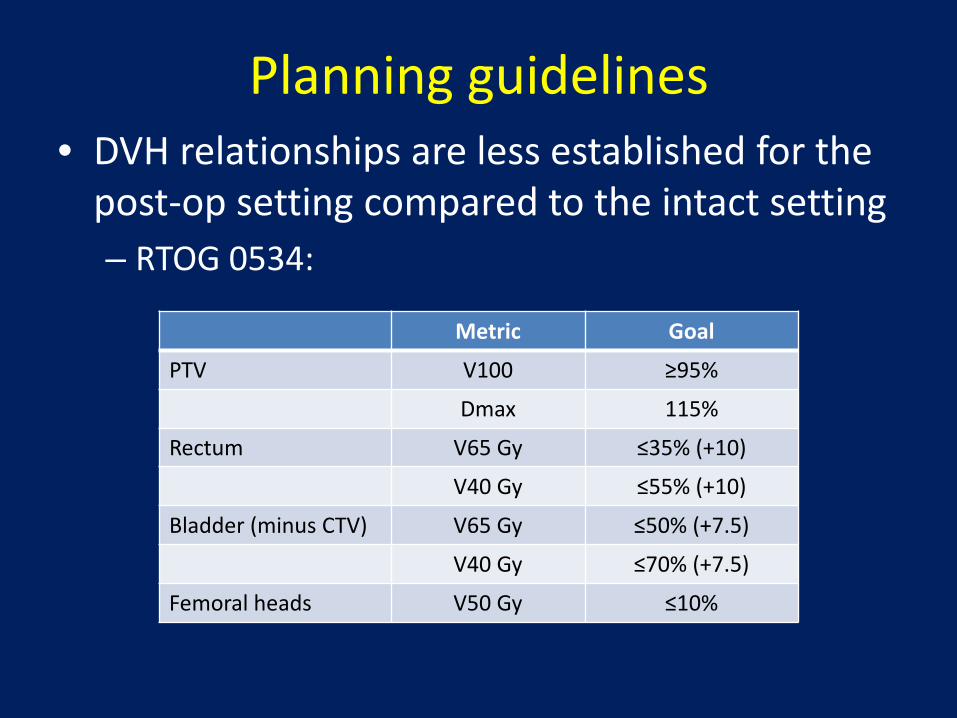
Planning guidelines • DVH relationships are less established for the
post-op setting compared to the intact setting – RTOG 0534:
Metric Goal
PTV V100 ≥95%
Dmax 115%
Rectum V65 Gy ≤35% (+10)
V40 Gy ≤55% (+10)
Bladder (minus CTV) V65 Gy ≤50% (+7.5)
V40 Gy ≤70% (+7.5)
Femoral heads V50 Gy ≤10%

IMRT • SEER-Medicare: 2000-2009
Goldin, JAMA Int Med 2013
82%
0%
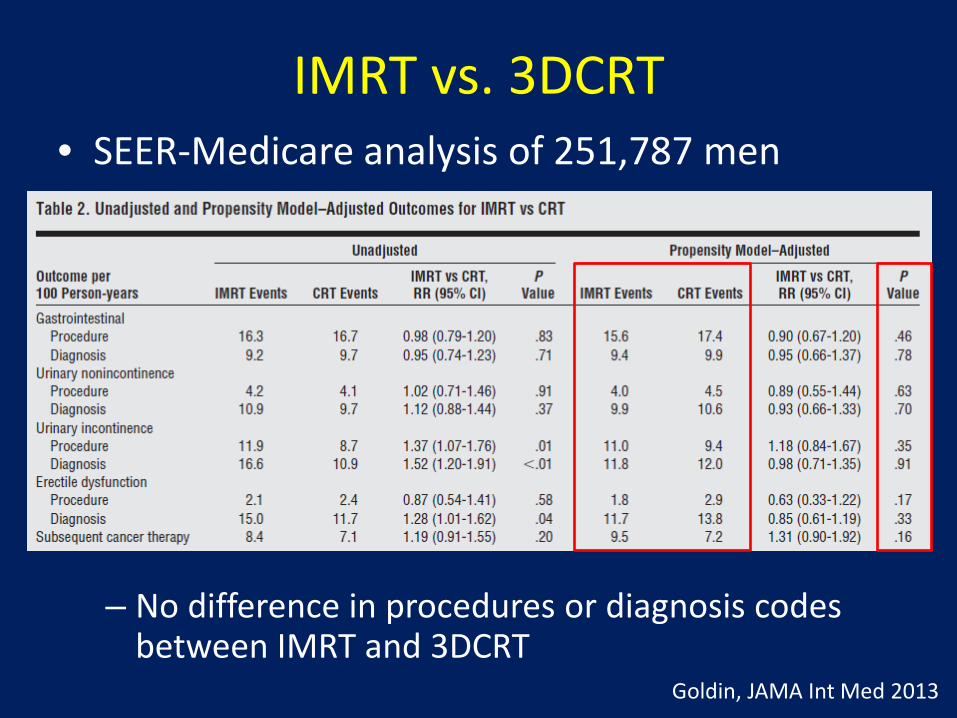
IMRT vs. 3DCRT
– No difference in procedures or diagnosis codes between IMRT and 3DCRT
Goldin, JAMA Int Med 2013
• SEER-Medicare analysis of 251,787 men
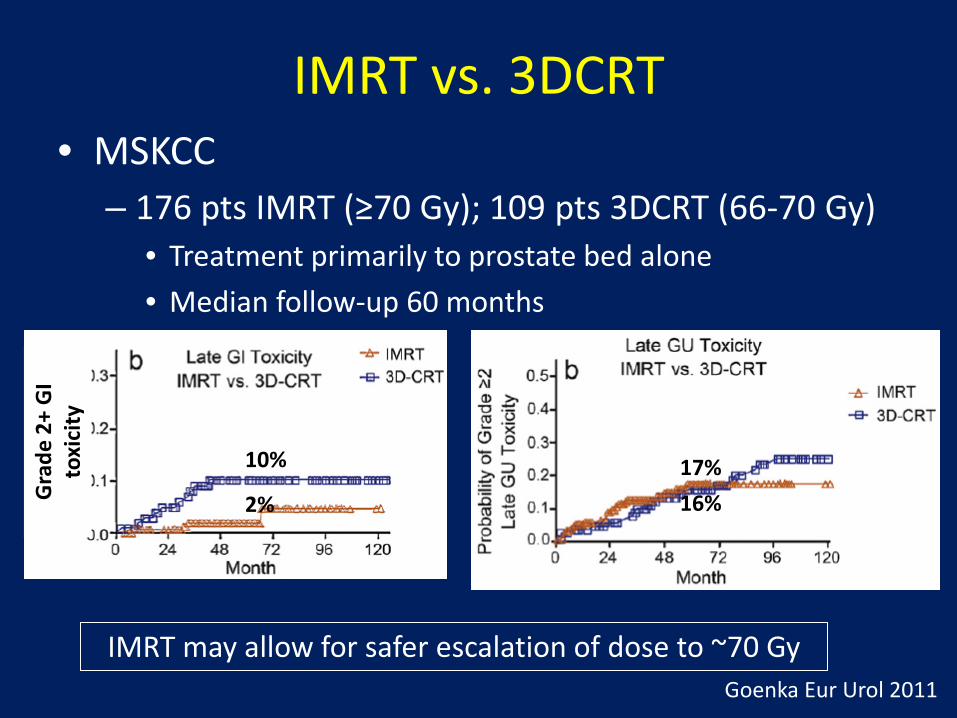
IMRT vs. 3DCRT • MSKCC
– 176 pts IMRT (≥70 Gy); 109 pts 3DCRT (66-70 Gy)
2%
10%
16% 17%
• Treatment primarily to prostate bed alone • Median follow-up 60 months
IMRT may allow for safer escalation of dose to ~70 Gy Goenka Eur Urol 2011
Gra
de 2
+ G
I to
xici
ty
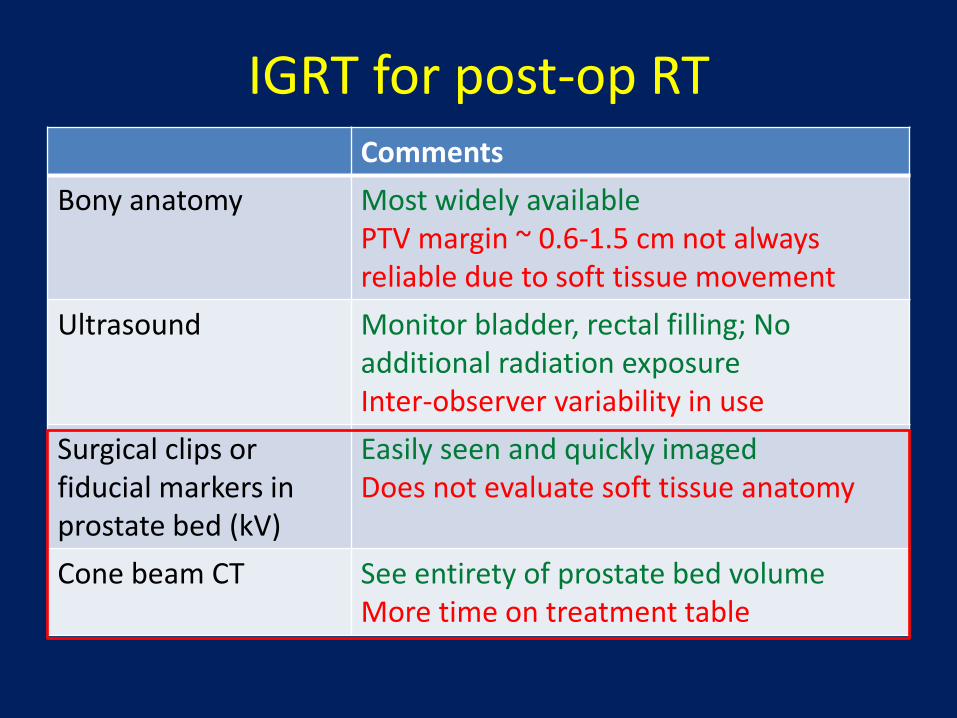
IGRT for post-op RT Comments
Bony anatomy Most widely available PTV margin ~ 0.6-1.5 cm not always reliable due to soft tissue movement
Ultrasound Monitor bladder, rectal filling; No additional radiation exposure Inter-observer variability in use
Surgical clips or fiducial markers in prostate bed (kV)
Easily seen and quickly imaged Does not evaluate soft tissue anatomy
Cone beam CT See entirety of prostate bed volume More time on treatment table
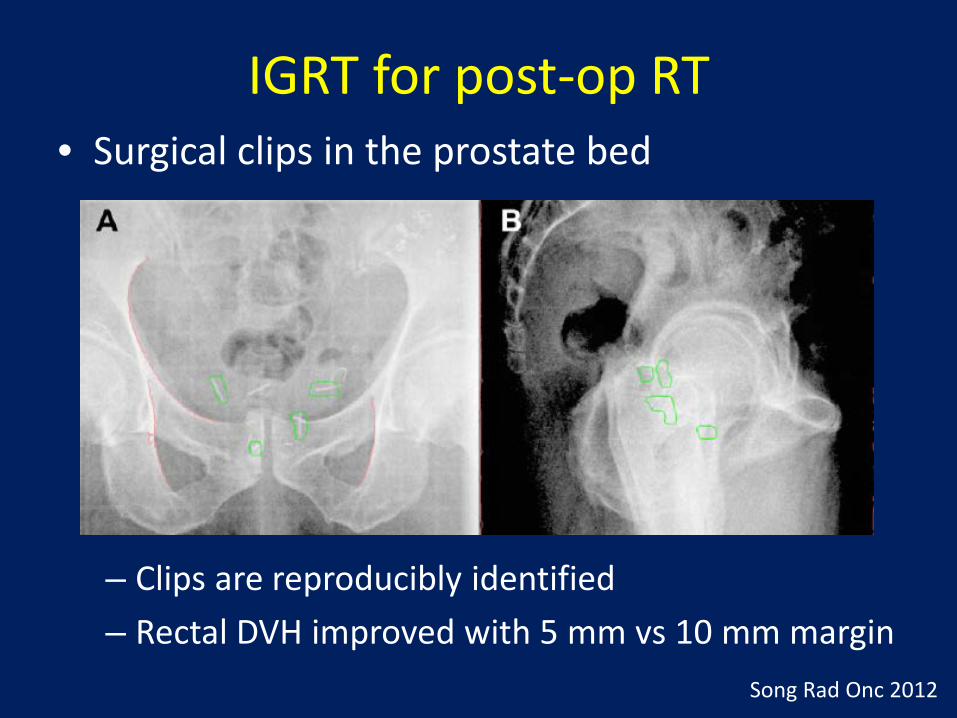
IGRT for post-op RT • Surgical clips in the prostate bed
Song Rad Onc 2012
– Clips are reproducibly identified – Rectal DVH improved with 5 mm vs 10 mm margin
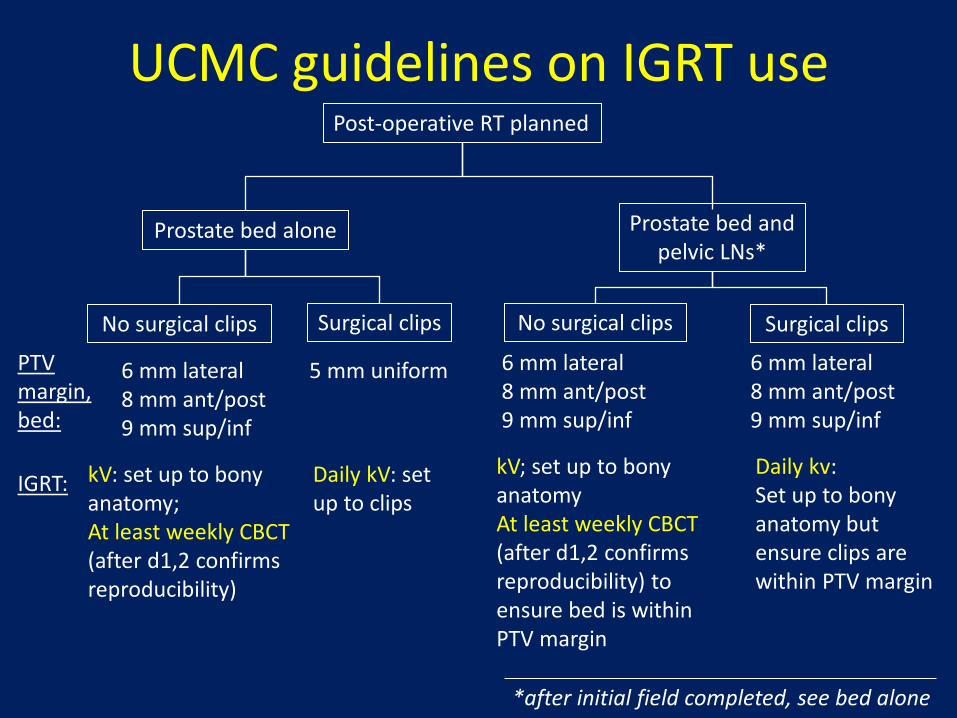
UCMC guidelines on IGRT use
Prostate bed alone Prostate bed and pelvic LNs*
PTV margin, bed:
6 mm lateral 8 mm ant/post 9 mm sup/inf
No surgical clips Surgical clips No surgical clips Surgical clips
5 mm uniform
Post-operative RT planned
IGRT: kV: set up to bony anatomy; At least weekly CBCT (after d1,2 confirms reproducibility)
Daily kV: set up to clips
6 mm lateral 8 mm ant/post 9 mm sup/inf
6 mm lateral 8 mm ant/post 9 mm sup/inf
kV; set up to bony anatomy At least weekly CBCT (after d1,2 confirms reproducibility) to ensure bed is within PTV margin
Daily kv: Set up to bony anatomy but ensure clips are within PTV margin
*after initial field completed, see bed alone
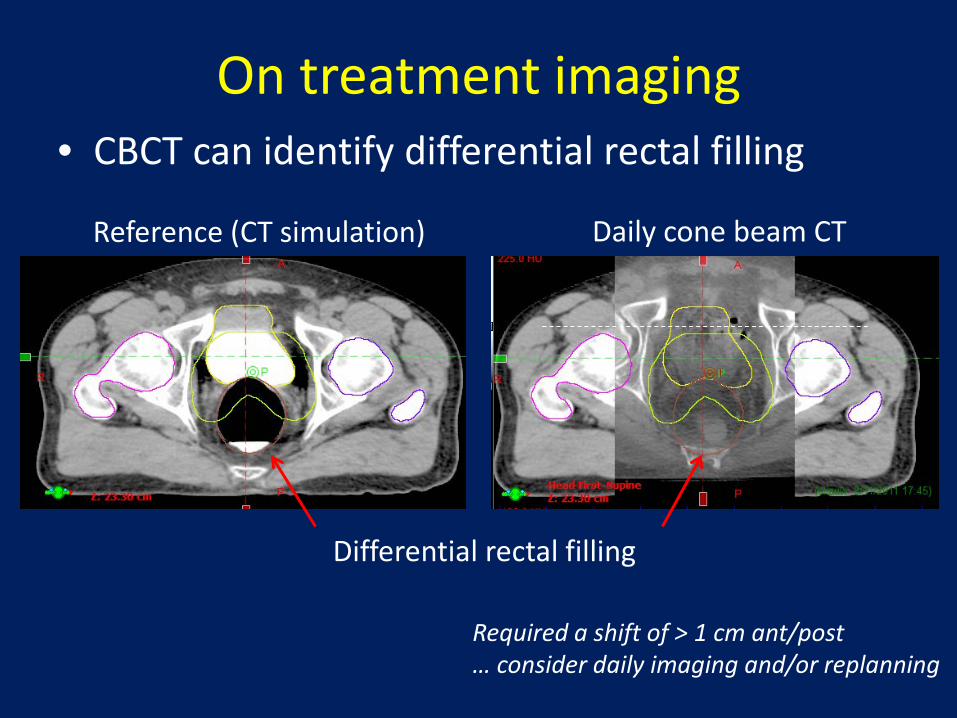
On treatment imaging • CBCT can identify differential rectal filling
Differential rectal filling
Daily cone beam CT Reference (CT simulation)
Required a shift of > 1 cm ant/post … consider daily imaging and/or replanning
Conclusions: EBRT for postop prostate • Adjuvant RT is better than observation for
men with pT3, +margins • Early salvage RT (if needed) is an alternative to
adjuvant RT • Salvage RT is moderately effective, and could
impact biochemical control and survival • Uncertainty regarding timing of RT, and best
use of dose, volume, ADT will hopefully be addressed with future trials