rtma quarterly report october december 2017
TRANSCRIPT

DISCLAIMER This document was prepared with support from the American people through the United States Agency for International Development (USAID). Its contents are the sole responsibility of the author(s) and do not necessarily reflect the views of USAID or of the Government of
the United States of America. This publication was produced was prepared by Nathan Associates Inc.
RTMA QUARTERLY REPORT
OCTOBER–DECEMBER 2017
CONTRACT No.AID-596-C-13-00001
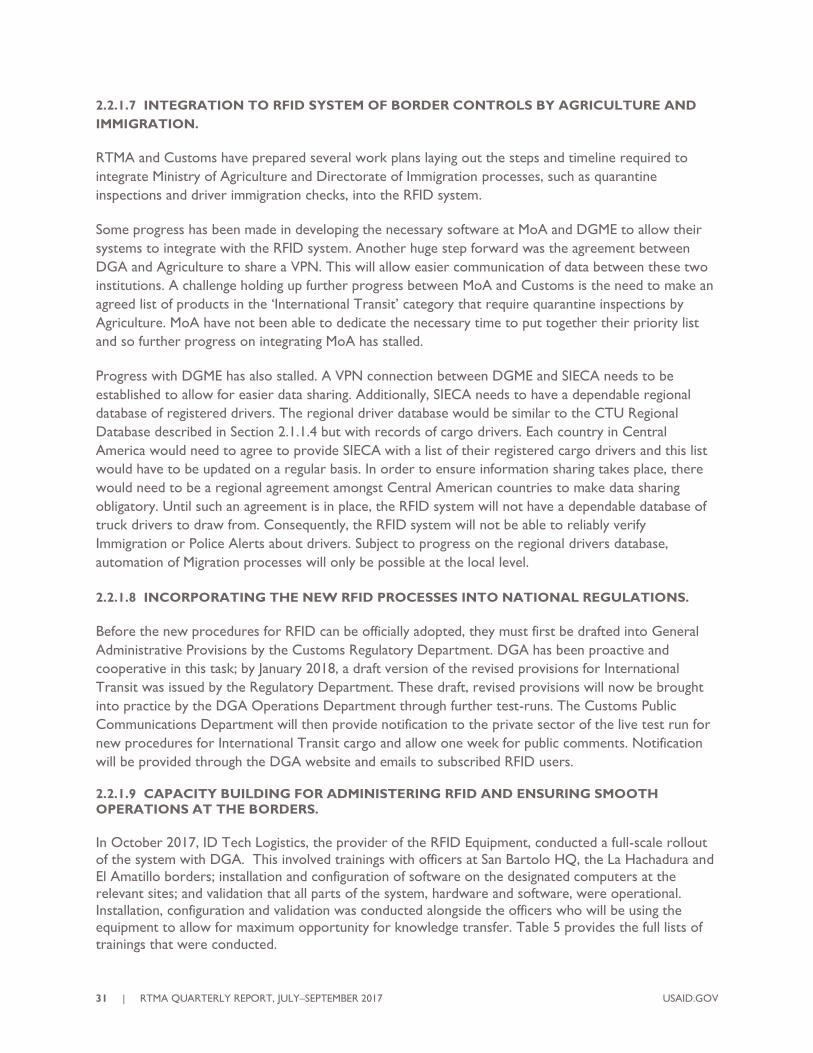
INSTALLATION OF THE CANOPY AT LA HACHADURA


USAID.GOV RTMA QUARTERLY REPORT, JULY–SEPTEMBER 2017 | 2
CONTENTS
EXECUTIVE SUMMARY 5
COMPONENT 1- INCREASE ACCESS TO REGIONAL VALUE CHAIN MARKETS
FOR CRITICAL AGRICULTURAL PRODUCTS AND ALLIANCES WITH
PRIVATE SECTORS. 6
1.1 MARKET ALLIANCES REPORT 6
1.2 COORDINATING WITH RTFE’S ECONOMIC IMPACT ASSESSMENT IN EL AMATILLO
(HN-SV) 6
COMPONENT 2 - INCREASED TRADE FACILITATION AND IMPROVED
TRADE AND INSTITUTIONAL CAPACITY 7
2.1 REDUCTION OF LOGISTICS COSTS AT THE BORDERS 7
2.1.1 COST AND TIME STATISTICS AT EL SALVADOR’S BORDER CROSSINGS 7
2.1.2 CAPACITY BUILDING FOR ANALYSIS AND REPORTING 17
2.1.3 INTEGRATION OF “CARAVANA” INTO SIECA’S IT SYSTEM 18
2.2 IMPROVEMENT OF ADMINISTRATIVE PROCESSES APPLICABLE TO TRADE 22
2.2.1 STATUS OF RFID INSTALLATION 22
2.2.1.1 INSTALLATION OF RFID INFRASTRUCTURE AT THE BORDERS. 22
2.2.1.2 PROGRESS ON RFID IT PROGRAMMING AT DGA. 25
2.2.1.3 SECURITY ASSESSMENT 27
2.2.1.4 PROGRESS ON USER ENROLLMENT, NORTHERN TRIANGLE ACTIONS. 27
2.2.1.7 INTEGRATION TO RFID SYSTEM OF BORDER CONTROLS BY AGRICULTURE
AND IMMIGRATION. 31
2.2.1.8 INCORPORATING THE NEW RFID PROCESSES INTO NATIONAL
REGULATIONS. 31
2.2.1.9 CAPACITY BUILDING FOR ADMINISTERING RFID AND ENSURING SMOOTH
OPERATIONS AT THE BORDERS. 31
2.2.1.10 CENTRAL AMERICAN RFID OPERATIONAL MANUAL. 32
2.2.1.11 LINKING THE AEO PROGRAM TO THE RFID SYSTEM. 33 2.3 SUPPORTING THE INCORPORATION OF EL SALVADOR TO THE CUSTOMS UNION 33

3 | RTMA QUARTERLY REPORT, JULY–SEPTEMBER 2017 USAID.GOV
ACRONYMS
AEO Authorized Economic Operator
ASYCUDA Automated System for Customs Data (Sistema Aduanero Automatizado)
COP Chief of Party
CTU Cargo Transport Units
DARA Deputy Direction of Customs Revenue
DGA General Directorate of Customs El Salvador (Dirección General de Aduanas de El Salvador)
DGA Directorate General of Customs
DGME General Directorate of Migration and Aliens Affairs
EIA Economic Impact Assessment
EMMP Environmental Mitigation and Monitoring Plan
ES El Salvador
FAUCA Central American Single Customs Form (Formulario Aduanero Único Centroamericano)
FOB Free On Board
FUSADES Salvadoran Foundation for Economic and Social Development (Fundación Salvadoreña para
el Desarrollo Económico y Social)
GD General Director
GoES Government of El Salvador
GT Guatemala
HN Honduras
HQ Headquarters
IDL ID Tech Logistics, S.A. de C.V., RTMA’s vendor
INL U.S. State Department International Bureau on Narcotics Affairs and Law Enforcement
IT Information Technology
ITD International Transit Declaration
MCC Millennium Challenge Corporation
MoA/MAG Ministry of Agriculture
NT Northern Triangle Countries
OIRSA Regional International Agency for Agricultural and Livestock Health (Organismo
Internacional Regional de Sanidad Agropecuaria)
PC Desktop or laptop
PDA Pedro de Alvarado
PERSUAP Pesticide Evaluation Report and Safer Use Action Plan
PPE Pesticide Protective Equipment

USAID.GOV RTMA QUARTERLY REPORT, JULY–SEPTEMBER 2017 | 4
RCEI USAID Central America Regional Clean Energy Initiative
RFID Radio Frequency Identification
RTFE USAID’s Regional Trade Facilitation Expansion Activity
RTMA USAID’s Regional Trade and Market Alliances Project
SAT Superintendence of Tax Administration
SIECA Central American Economic Integration Secretariat (Secretaría De Integración Económica
Centroamericana)
SYPRO Suministros y Proyectos S.A. de C.V., RTMA’s vendor
TFMP Trade Facilitation Monitoring Platform
TIM International Transit Shipments (Tránsito Internacional de Mercancías)
VPN Virtual Private Network

5 | RTMA QUARTERLY REPORT, JULY–SEPTEMBER 2017 USAID.GOV
EXECUTIVE SUMMARY
During the October – December 2017 reporting period, the RTMA Project continued working at
the La Hachadura and El Amatillo borders of El Salvador on RFID installment and curved roofs (i.e.
canopies). The Project successfully completed the installment of canopies requested by El Salvador
Customs to help improve working conditions at the border inspection points. The shade provided
by the canopies is allowing border authority agents to work more comfortably during the hottest
parts of the day as well as during inclement weather. This, in turn, is resulting in increased
continuity of border operations.
The installation of the RFID system is almost complete. All hardware and infrastructure was
installed at both La Hachadura and El Amatillo by the end of December 2017. Work continues on
programming the software at DGA and SIECA and conducting test runs of the system. The RTMA
Team is aiming to finalize all operational variable test runs, as required by Customs El Salvador, in
the first quarter of 2018, so that the RFID system is operational for International Transit
shipments before the end of the RTMA Project. Unfortunately, due to the lack of staff availability
at SIECA and DGA to work on the necessary IT programming, it will not be possible to have the
Import and Export processes operational in the RFID system before the end of the project. DGA
and SIECA have both committed to undertaking the necessary programming for Imports and
Exports, however future USAID assistance may be needed to complete this work.
The Project has been providing group and one-on-one trainings to build the capacity of DGA
officers to gather and analyze the data they are collecting in their operations to measure the cost
and time of trade. This means that the officers and management of DGA will be able to maximize
the potential of the data gathering abilities of the RFID system and use the information to analyze
transit times and improve border procedures and trade policies for El Salvador and the region
beyond the life of the Project.
Private sector enrollment for the RFID Program has continued at a good pace. During the
reporting period, 375 trucks were enrolled and 4,076 tags distributed, allowing DGA to begin
collecting data on transit cargo. By project end, it is estimated that 1,100 trucks will be enrolled.
Another highlight from the Quarter has been progress on the integration of the CARAVANA tool
into SIECA. This trade facilitation tool, developed by FUNDEVI with funds from an RTMA Grant,
has two modules – Module 1- collection and publication of logistics indicators and Module 2 – a
freight services exchange tool for transporters. RTMA has been working jointly with the RTFE
Project to help SIECA publish logistic indicators on its website by June 2018.
These milestones and other progress updates made between October and December 2017 are
presented in the following pages.

USAID.GOV RTMA QUARTERLY REPORT, JULY–SEPTEMBER 2017 | 6
COMPONENT 1- INCREASE ACCESS TO REGIONAL VALUE
CHAIN MARKETS FOR CRITICAL AGRICULTURAL PRODUCTS
AND ALLIANCES WITH PRIVATE SECTORS.
1.1 MARKET ALLIANCES REPORT
RTMA continued finalizing the Market Alliances Report, which covers
• A step by step description of how Component 1 Grant beneficiaries were selected
• Due diligence conducted on prospective grantees
• Description of grantees and their proposals
• Areas of improvement for the grants program and grantees
• The work conducted with the grant funds
• Results achieved
• Lessons learned
The report offers a comprehensive review of Component 1 activities, achievements, and challenges. The
main challenges included delays in being able to select and award grants resulting in grantees receiving
funding later than planned by the project, the lifetime of the grant being an insufficient timeline to
achieve tangible results and weaknesses in the administration and financial management capacities of the
beneficiary associations. The report concludes with how grantees can continue making improvements
needed to take them to the next level of value chain integration.
The Spanish version of the report will be submitted to USAID during the next quarter for review and
comment. An English version will be produced after final edits are incorporated.
1.2 COORDINATING WITH RTFE’S ECONOMIC IMPACT ASSESSMENT IN EL AMATILLO
(HN-SV)
RTMA has been coordinating with USAID’s LPFM buy-in mechanism, the Regional Trade Facilitation
Extension (RTFE) Project in Honduras and Guatemala on the Economic Impact Assessment for La
Hachadura so that the same methodology is used as the study conducted by RTMA in El Amatillo.
RTMA has also supported this initiative by facilitating meetings and gathering information from
Salvadoran stakeholders including private sector entities, the El Salvador Chamber of Trade and
Industry, GoES Ministry of Economy, as well as the local community on the El Salvador side of the El
Amatillo border.

7 | RTMA QUARTERLY REPORT, JULY–SEPTEMBER 2017 USAID.GOV
COMPONENT 2 - INCREASED TRADE FACILITATION AND
IMPROVED TRADE AND INSTITUTIONAL CAPACITY
2.1 REDUCTION OF LOGISTICS COSTS AT THE BORDERS
2.1.1 COST AND TIME STATISTICS AT EL SALVADOR’S BORDER CROSSINGS
RTMA is analyzing cross border data at El Amatillo and La Hachadura in order to provide a statistical
picture of: (i) the Cost to Import into El Salvador; (ii) the Cost to Export from El Salvador and (iii) the
Cost for Cargo to Transit through El Salvador.
The Project has been capturing data at these borders through various methods and for varying purposes
since 2013. Since April 2017, the Project has been measuring “Transaction Cost per Ton in border
crossings receiving USG assistance” so as to have a measure of the impact of interventions being
conducted at the borders under Component 2. 1
Transaction Cost per Ton per Kilometer – CTK – is calculated using the following formula:
𝐶𝑇𝐾 = 𝑇𝐶
𝑊 ∗ 𝐾𝑚
Where total costs (TC) = freightage2 + hidden cost + value of the cargo in (FOB), the distance (Km) is
the actual number of kilometers for each corridor being evaluated (Guatemala City – San Salvador, San
Salvador - Tegucigalpa), and the weight (W) is the cargo being transported in tons.3,4
From April 2017, the project expanded its data sources to DGA’s Border Operation logs which
measure times and costs for all shipments going across the PDA/LH and El Amatillo borders. This data
was analyzed alongside the data being gathered by GPS units attached to trucks and allowed for a better
understanding of how much time and cost figures can be attributed to border processes versus other
external factors. For example, one significant external factor that has negatively influenced the times
and costs reported during 2017 at El Amatillo is the expansion of the highway from Tegucigalpa to El
Amatillo and the modernization of the highway at the El Amatillo border point, one of the results of
which will be an additional lane for transit cargo entering Honduras. As these highway improvements
1 Please note, that the figures in RTMA Quarterly, Annual and M&E Reports for C2-1 from 2013 to 2016 reflect
Transaction Cost per Ton In Selected Value Chains receiving USG assistance and should not be compared with the
figures for C2-1 from April 2017 (the first Quarter of Y5 of the Project) onwards. 2 Freightage = Value of the contract issued by the transporter to transport goods from the exporter/seller to the
importer/buyer. 3 The measurement only considers >18 Ton transport units. 4 For imports and exports, the measurement only considers units transporting cargo regionally using the Central
American Single Customs Form (FAUCA).

USAID.GOV RTMA QUARTERLY REPORT, JULY–SEPTEMBER 2017 | 8
aim to improve the efficiency of this transport corridor, current construction work is increasing journey
times.
Tables 1 to 3 A-B below show the figures when the CTK methodology described above is applied to
Customs Log data from 2013 to 2017.
In order to better understand the trends in Tables A and B it is necessary to analyze the underlying
trends in the variables that make up the Cost and Time calculations. RTMA did this by evaluating the
DGA Operations Log data on Number of Operations being conducted at each border per year, total
weight of imports being processed at each border throughout the year, and changes in the Freightage
amount being charged by the transporter. This data is captured in Tables C-E for each operation type
below.
IMPORTS
The average cost for importing cargo into El Salvador is calculated using cost data of imports from
Guatemala City, GT and Tegucigalpa, HN, going through La Hachadura SV and El Amatillo SV
respectively.
Cost and Time measurements are taken from the electronic submission of the FAUCA at origin to
clearance of the FAUCA by DGA when clearing the border in El Salvador.
Please see Figure 1 and tables below, which illustrates each step of the Import process and the parts of
this process being measured by RTMA to provide an indicator of time and cost for importing to El
Salvador.
FIGURE 1: PROCESS FOR IMPORTING GOODS INTO EL SALVADOR

9 | RTMA QUARTERLY REPORT, JULY–SEPTEMBER 2017 USAID.GOV
Table 1A shows the Annual Average Cost of Importing Cargo into El Salvador between 2013 and 2017.
Table 1B shows the Annual Average Time of Importing Cargo into El Salvador between 2013 and 2017.
The cost indicator for Imports into El Salvador at both La Hachadura and El Amatillo shows an overall
decline in cost since the start of the project. The cost of importing has increased a little within the past
year although not to the levels seen before project interventions. The time statistics for La Hachadura
also show a decline; however, in El Amatillo it now takes longer to import than it did in 2013.
Table 1C shows an increase in import operations being conducted at both La Hachadura and El Amatillo
over the four years being measured.
TABLE 1C. NUMBER OF OPERATIONS BEING IMPORTED BETWEEN GT/SV (LA HACHADURA) AND
HN/SV (EL AMATILLO)
BORDER 2013 2017 % CHANGE
LA HACHADURA 18,897 26,091 +38.1%
EL AMATILLO 3,200 4,916 +53.6%
Table 1D shows an increase in the total weight being imported through La Hachadura and El Amatillo
over the four years being measured.
TABLE 1D. AVERAGE WEIGHT (TM) BEING IMPORTED BETWEEN GT/SV (LA HACHADURA) AND
HN/SV (EL AMATILLO)
BORDER 2013 2017 % CHANGE
LA HACHADURA 446,055 585,830 +31%
EL AMATILLO 78,916 137,165 +74%
TABLE 1A: AVERAGE COST FOR IMPORTING CARGO INTO EL SALVADOR MEASURED IN USD PER
METRIC TON PER KM
BORDER YEAR
2013 2014 2015 2016 Annual Variation
LA
HACHADURA $ 0.089 $ 0.087 $ 0.082 $ 0.081
EL AMATILLO $ 0.108 $ 0.095 $ 0.090 $ 0.086
TABLE 1B. AVERAGE TIME TO IMPORT CARGO INTO EL SALVADOR (DAYS:HOUR:MINS)
BORDER YEAR
2013 2014 2015 2016 Annual Variation
LA
HACHADURA 01:18:08 01:15:43 01:15:09 01:12:11
EL AMATILLO 02:17:06 02:10:50 02:20:26 03:10:03
Promedio de Indicador Años
Aduanas 2013 2014 2015 2016 2017 Promedio general Variación anual
05 - TERRESTRE LA HACHADURA 0.089$ 0.087$ 0.082$ 0.081$ 0.083$ 0.084$
09 - TERRESTRE EL AMATILLO 0.108$ 0.095$ 0.090$ 0.086$ 0.091$ 0.093$
Promedio general 0.092$ 0.088$ 0.083$ 0.082$ 0.084$ 0.085$

USAID.GOV RTMA QUARTERLY REPORT, JULY–SEPTEMBER 2017 | 10
Table 1E shows a decrease in the amount for Freightage being charged by transporters for imports going
through La Hachadura and El Amatillo over the four years being measured.
TABLE 1E AVERAGE COST OF FREIGHTAGE (USD/TRIP) FOR CARGO BEING IMPORTED THROUGH
LA HACHADURA AND EL AMATILLO.
BORDER 2013 2017 % CHANGE
LA HACHADURA $512 $433 -15%
EL AMATILLO $785 $763 -3%
The decrease in freightage is linked to the increase in weight, as cargo transport units can be more
efficiently utilized if they are filled to capacity.
It can be concluded, therefore, that external factors, most likely the delays due to road construction of
the new highway in Honduras are contributing to the increased times for imports through El Amatillo.
The significant increase in times for imports through El Amatillo, however, have not led to an equal
impact in cost of importing through this border point. It is possible, therefore, that trade facilitation
measures implemented by RTMA have encouraged a greater volume of imports, which has led to more
efficient freightage charges.
EXPORTS
The average cost for exporting cargo out of El Salvador is calculated in a similar way to import costs,
using cost data from DGA’s Operations Log for exports to Guatemala City, GT and Tegucigalpa, HN,
going through La Hachadura SV and El Amatillo SV respectively.
Cost and Time measurements are taken from the point when the operator electronically registered the
export operation in the SICEX5 electronic system for El Salvador’s single window (CIEX)6 to the point
when the FAUCA is cleared by DGA as it exits the country.
Please see Figure 2 and the tables below, which illustrates each step of the Export process and the parts
of this process being measured by RTMA to provide an indicator of time and cost of exporting from El
Salvador.
5 Sistema Integrado de Comercio Exterior. 6 Centro de Trámites de Importaciones y Exportaciones CIEX of the Central Bank.

11 | RTMA QUARTERLY REPORT, JULY–SEPTEMBER 2017 USAID.GOV
FIGURE 2: PROCESS FOR EXPORTING GOODS OUT OF EL SALVADOR
Table 2A shows the costs between 2013 and 2017 using CTK to calculate the Annual Average Cost for
exporting cargo out of El Salvador.
Table 2B shows the Annual Average Time of exporting Cargo out of El Salvador between 2013 and
2017.
The cost indicator for exporting from El Salvador shows an increase in costs for both La Hachadura and
El Amatillo since the start of the project. The time indicator for La Hachadura shows an increase in
times to export since 2015, however, in El Amatillo times have decreased since 2014.
Table 2C shows a decrease in export operations being conducted at La Hachadura but an increase in
export operations at El Amatillo between 2013 and 2017.
TABLE 2A: AVERAGE COST FOR EXPORTING CARGO OUT OF EL SALVADOR MEASURED IN USD PER METRIC TON PER KM
BORDER YEAR
2013 2014 2015 2016 Annual Variation
LA
HACHADURA $ 0.112 $ 0.113 $ 0.112 $ 0.112
EL AMATILLO $ 0.101 $ 0.099 $ 0.099 $ 0.098
TABLE 2B: AVERAGE TIME TO EXPORT CARGO OUT OF EL SALVADOR (DAYS:HOURS:MINUTES)
BORDER YEAR
2013 2014 2015 2016 Annual Variation
LA
HACHADURA 02:20:26 03:02:29 03:03:20 03:07:05
EL AMATILLO 01:11:22 01:13:44 01:10:05 01:08:35
Promedio de Indicador Años
Aduanas 2013 2014 2015 2016 2017 Prom general Variación anual
05 - TERRESTRE LA HACHADURA 0.112$ 0.113$ 0.112$ 0.112$ 0.119$ 0.114$
09 - TERRESTRE EL AMATILLO 0.101$ 0.099$ 0.099$ 0.098$ 0.101$ 0.100$
Prom general 0.108$ 0.107$ 0.107$ 0.106$ 0.111$ 0.108$
Promedio de tiempo (días) Años
Aduanas 2013 2014 2015 2016 2017 Prom general Variación anual
05 - TERRESTRE LA HACHADURA 02:20:26 03:02:29 03:03:20 03:07:05 04:01:39 03:06:52
09 - TERRESTRE EL AMATILLO 01:11:22 01:13:44 01:10:05 01:08:35 01:07:32 01:10:06
Prom general 02:07:14 02:11:05 02:09:34 02:10:23 02:19:25 02:11:36

USAID.GOV RTMA QUARTERLY REPORT, JULY–SEPTEMBER 2017 | 12
TABLE 2C. NO. OF EXPORT OPERATIONS TAKING PLACE AT LA HACHADURA AND EL AMATILLO
BORDER 2013 2017 % CHANGE
LA HACHADURA 8,362 7,601 -9.1
EL AMATILLO 5,550 6,405 +15.4
Table 2D shows a small increase in the total weight being exported through La Hachadura and a
significant increase in weight being exported through El Amatillo over the four years being measured.
TABLE 2D. TOTAL WEIGHT OF CARGO BEING EXPORTED THROUGH LA HACHADURA AND EL
AMATILLO.
BORDER 2013 2017 % CHANGE
LA HACHADURA 184,500 193,356 +4.8
EL AMATILLO 138,700 162,900 +17.5
Table 2E shows an increase in the amount for Freightage being charged by transporters for exports
going through La Hachadura and a decrease in Freightage for exports through El Amatillo over the four
years being measured.
TABLE 2E. AVERAGE COST OF FREIGHTAGE FOR CARGO BEING EXPORTED THROUGH LA
HACHADURA AND EL AMATILLO.
BORDER 2013 2017 % CHANGE
LA HACHADURA $529.5 $554.3 +4.6
EL AMATILLO $777 $723 -7%
There has been a small increase in weight being exported through La Hachadura; however, it has not
been significant enough to translate into lower freightage costs. It would appear that there are other
external factors affecting the length of time it takes to export through La Hachadura. For example, in
September and October 2017 the SAT seal inspections and El Salvador’s immigration checks were
moved to a new location to eventually be under the new canopies that were pending installation. It was
thought that by combining more procedures at one checkpoint shipments would be processed quicker.
However, in the case of exports, the time taken has increased by a full day since 2016. This situation is
analyzed further below through the GPS data that the project collected from 1,320 cargo journeys
passing through El Salvador.
At El Amatillo, the Cost to Export has increased but the time to export has decreased. The increase in
costs does not seem to be related to inefficiency of CTUs as freightage costs have decreased as weight
has increased. Time to export at El Amatillo has decreased; therefore, we conclude that the reason
behind the increasing costs must be due to some other external factor, such as power failures, road
construction, poor working conditions (weather, lighting, security). INTERNATIONAL TRANSITS

13 | RTMA QUARTERLY REPORT, JULY–SEPTEMBER 2017 USAID.GOV
In the case of international transits operations, time and cost calculations are derived from the point
that a CTU enters El Salvador through one of the two borders of USG intervention (La Hachadura SV
or El Amatillo SV) to the point that the CTU exits the other El Salvador border of USG intervention. A
pro-rata value of the freightage7 registered for these international transit operations is used. Time and
cost is calculated from the point the DGA official logs in the transit into its customs management system
through the time it takes the cargo unit to transit through El Salvador and exit the border, marking the
finalization with the DGA official logging the exit in the customs system. Each international transit
operation has a 24-hour period to initiate and close. Please see Figure 3 below, which illustrates the
points covered in the calculation of the average cost in USD per MT per Km and time for cargo to
transit through El Salvador from the point of import from Honduras to the point of export to Mexico.
FIGURE 3: PROCESS FOR GOODS TRANSITING THROUGH EL SALVADOR FROM HONDURAS TO MEXICO
Table 3A shows the average cost, per the CTK methodology, for transiting cargo across El Salvador
between 2013 and 2017.
7 Proportionate value of the freightage corresponding to the amount of the journey that takes place in El Salvador
compared to the other countries through which the CTU will travel to its final destination.

USAID.GOV RTMA QUARTERLY REPORT, JULY–SEPTEMBER 2017 | 14
Table 3B shows the Annual Average Time for Cargo to transit across El Salvador between 2013 and
2017.
The cost for cargo to transit through El Salvador at both La Hachadura and El Amatillo increased
between 2013 and 2014 and only started to decline from 2015 onwards. By the end of 2017, the cost of
transit through La Hachadura had returned to the level it was at in 2013 and the cost to transit through
El Amatillo had dropped below the 2013 cost.
In La Hachadura, the time for transiting goods increased through 2015 but has since seen a gradual
decline, although still above the average time from 2013. Overall, the time for cargo to transit El
Amatillo has reduced by approximately 1hr since 2013 despite some increases experienced in 2015 and
2016.
Table 3C shows a significant decrease in transit operations being conducted at La Hachadura and a slight
increase in transit operations at El Amatillo between 2013 and 2017.
TABLE 3C. NO. OF TRANSIT OPERATIONS TAKING PLACE AT LA HACHADURA AND EL AMATILLO
BORDER 2013 2017 % CHANGE
LA HACHADURA 8,843 7,133 -19.3
EL AMATILLO 26,860 27,558 +2.6
Table 3D shows a large decrease in total weight of transit cargo through La Hachadura and a small
increase in weight of transit cargo through El Amatillo between 2013 and 2017.
TABLE 3D. TOTAL WEIGHT OF TRANSIT CARGO THROUGH LA HACHADURA AND EL AMATILLO.
BORDER 2013 2017 % CHANGE
LA HACHADURA 192,500 154,962 -19.5
EL AMATILLO 590,000 626,300 +6.2
TABLE 3A. AVERAGE COST FOR CARGO TRANSITING THROUGH EL SALVADOR MEASURED IN
USD PER METRIC TON PER KM
BORDER YEAR
2013 2014 2015 2016 2017 Annual Variation
LA
HACHADURA $ 0.102 $ 0.108 $ 0.106 $ 0.106 $ 0.102
EL AMATILLO $ 0.098 $ 0.101 $ 0.100 $ 0.098 $ 0.096
TABLE 3B. AVERAGE TIME FOR CARGO TRANSITING THROUGH EL SALVADOR
(DAYS:HOURS:MINUTES)
BORDER YEAR
2013 2014 2015 2016 2017 Annual Variation
LA
HACHADURA 01:04:32 01:06:54 01:07:01 01:06:33 01:06:02
EL AMATILLO 00:19:09 00:18:31 00:18:00 00:18:48 00:18:17
Aduana de destino 2013 2014 2015 2016 2017 Prom general Variación anual
TERRESTRE LA HACHADURA 0.102$ 0.108$ 0.106$ 0.106$ 0.102$ 0.105$
TERRESTRE EL AMATILLO 0.098$ 0.101$ 0.100$ 0.098$ 0.096$ 0.098$
Prom general 0.099$ 0.103$ 0.101$ 0.100$ 0.097$ 0.100$

15 | RTMA QUARTERLY REPORT, JULY–SEPTEMBER 2017 USAID.GOV
Table 3E shows a minimal increase in the pro-rata cost of Freightage for cargo transiting El Salvador
through La Hachadura and a decrease in pro-rata freightage at El Amatillo between 2013 and 2017.
TABLE 3E. AVERAGE PRO RATA FREIGHTAGE COST FOR CARGO TRANSITING THROUGH LA
HACHADURA AND EL AMATILLO.
BORDER 2013 2017 % CHANGE
LA HACHADURA $650 $653 +0.4
EL AMATILLO $693 $641 -7.5%
In La Hachadura, the decline in total weight of transit operations contributed to a slight increase in
Freightage costs and partially explains why there has not been a greater reduction in cost for transit
shipments through La Hachadura. The overall time for transit shipments at La Hachadura has increased
by 1.5hrs since 2013 and is likely the result of external factors. (The GPS data analyzed in the next
section provides some insights about the parts of the journey where the shipment is experiencing
delays.)
In El Amatillo, weight of transit shipments has increased over the period between 2013 and 2017, which
has contributed to a decline in freightage costs. There have been no offsetting counter factors at El
Amatillo, therefore, overall Cost per Metric Ton per Km has also declined and time taken for transit
operations at El Amatillo has been reduced by 1hr since 2013. This decline in costs and time at El
Amatillo would appear to be at least partially attributable to the project’s interventions, such as
facilitation of inter-institutional coordination between El Salvador and Honduras to improve and align
border processes.
RTMA is confident that the downward trajectory for transit costs will continue as the RFID system
becomes operational for Transit operations.
ADDITIONAL GPS DATA MONITORING IN LA HACHADURA
Since February 2016, RTMA has been collecting data from 5km outside of both the Guatemalan and El
Salvador Customs facilities via GPS units installed in several CTUs. This measurement allows the Project
to calculate the time spent in lines formed outside the border and the time spent by authorities clearing
the cargo at the border.
These data results show an 18% increase since February 2016 in the time taken for goods to cross the
border to enter El Salvador, and a 97% increase in time required to cross the border to exit El Salvador.
Please see Figure 4 below.

USAID.GOV RTMA QUARTERLY REPORT, JULY–SEPTEMBER 2017 | 16
Figures 5 and 6 below illustrates the time trends for entering and exiting El Salvador at La Hachadura
based on the GPS data.
8:14
5:15
10:01
2:574:01
9:44
0:00
1:12
2:24
3:36
4:48
6:00
7:12
8:24
9:36
10:48
L Í N E A B A S E F E B A J U N 1 6
P E R Í O D O 1J U L A N O V 1 6
P E R Í O D O 2 D I C 1 6 A A B R 1 7
P E R Í O D O 3 M A Y A J U N 1 7
P E R Í O D O 4 J U L A S E P 2 0 1 7
P E R Í O D O 5 O C T A D I C 2 0 1 7
CARGO ENTERING EL SALVADOR
FIGURE 4: AVERAGE TIME FOR CARGO ENTERING AND EXITING EL SALVADOR THROUGH LA HACHADURA SV AND PEDRO DE ALVARADO GT BORDER CROSSING CALCULATED WITH GPS EQUIPMENT IN CARGO TRANSPORT UNIT (HOURS:MINUTES)
FIGURE 5: AVERAGE TIME FOR CARGO ENTERING EL SALVADOR THROUGH LA HACHADURA SV CALCULATED WITH GPS EQUIPMENT IN CARGO TRANSPORT UNIT (HOURS:MINUTES)

17 | RTMA QUARTERLY REPORT, JULY–SEPTEMBER 2017 USAID.GOV
2.1.2 CAPACITY BUILDING FOR ANALYSIS AND REPORTING
During this past quarter, RTMA spent a significant amount of time transferring data analysis know-how
to DGA customs officers to be able to generate reports on time and cost of trade according to the type
of border operations. DGA has been proactively capturing data but has struggled to translate the data
into meaningful analysis and policy changes. This is partially due to lack of resources, with only one
official dedicated to this task part-time.
RTMA held meetings with DGA Managers to identify their objectives for data analysis. DGA prioritized
being able to measure and understand International Transit CTUs for two main reasons. The first is
related to the improved design of the export process introduced by DGA going beyond Guatemala and
Honduras. These exports are now able to go through pre-clearance centers in El Salvador (e.g. Metalío
and Santa Ana, Special Processing Zones, specified warehouses, etc.) where DGA processes, clears and
releases the exports. At these pre-clearance centers, DGA supports the operators by initiating their
international transit declarations for the Customs Authorities in the other countries through which they
will pass on their way to their final destination. Covering all of these operations at the pre-clearance
centers means that DGA only has to focus on one operation at the borders - communicating the results
of the risk management process (i.e. directing the operator to the green, red or yellow lanes). In theory,
this allows the CTU to pass through the El Salvador border more quickly to continue its journey to its
final destination. The second reason for focusing on International Transit data is that transits operations
make up the largest trade regime for El Salvador’s customs authority.
RTMA is coordinating with DGA to build the capacity of more officers to conduct data analysis. Training
will continue in March when more DGA officers will be trained by the Project on the RFID process,
enrollment and data analysis.
DGA will be monitoring the time it takes to inspect goods, value of goods, origin, and destination to
help assess and measure the impact of the various trade facilitation measures introduced in previous
quarters by SAT and DGA at La Hachadura and El Amatillo border points such as:
2:29
1:40 1:371:03
1:32
4:53
0:00
1:12
2:24
3:36
4:48
6:00
L Í N E A B A S E F E B A J U N 1 6
P E R Í O D OJ U L A N O V 1 6
P E R Í O D O 2 D I C 1 6 A A B R 1 7
P E R Í O D O 3 M A Y A J U N 1 7
P E R Í O D O 4 J U L A S E P 2 0 1 7
P E R Í O D O 5 O C T A D I C 2 0 1 7
CARGO EXITING EL SALVADOR
FIGURE 6: AVERAGE TIME FOR CARGO EXITING EL SALVADOR THROUGH LA HACHADURA SV CALCULATED WITH GPS EQUIPMENT IN CARGO TRANSPORT UNIT (HOURS:MINUTES)

USAID.GOV RTMA QUARTERLY REPORT, JULY–SEPTEMBER 2017 | 18
Custom authorizing the Guatemalan traffic police to manage the traffic at the border agency
entry and exit points in Pedro de Alvarado;
Creating an additional window at La Hachadura for fast processing and final review of cargo
declarations that have been submitted electronically in advance;
Paving parking areas and adapting infrastructure in the Primary Zone of La Hachadura to allow a
wider turn radius for CTUs;
Limiting parking in the primary zone to vehicles with imports.
Assigning specific time periods for the fast passage of empty trucks.
Coordinating immigration checks between El Salvador and Guatemala.
Increasing security presence in the access zones (i.e. roads leading to the border) for the
protection of cargo and drivers.
Additionally, the Guatemalan and El Salvador border control authorities (DGA, SAT and the National
Police from both countries) have implemented the following activities to improve logistics management
at the border and improve the time it takes for cargo to cross the border through Pedro de Alvarado
and La Hachadura:
Improving and adjusting the fumigation area at the border point of La Hachadura.
Allowing for exchange of X-ray images between the DGA and the Anti-Narcotics Division of
the National Civil Police.
Including a fast-pass window for National Civil Police at La Hachadura.
RTMA has also provided direct support in previous quarters through the procurement of signage for the
border primary zones and the RFID system that will become operational in the coming months to help
direct traffic in an orderly fashion.
2.1.3 INTEGRATION OF “CARAVANA” INTO SIECA’S IT SYSTEM
The CARAVANA data collection and freight services exchange platform, produced by FUNDEVI with
funds from an RTMA grant has two modules. Module 1 involves the collection and publication of
logistics indicators. The data for the indicators comes from the TIM system (Customs International
Transit System) through which every operator must submit their Transit declarations. The TIM system
is already managed by SIECA so there is easy access to this system for SIECA and no charge involved in
acquiring the data. Module 2 utilizes the logistics data from Module 1 to provide a freight services
exchange tool for transporters, whereby demand and supply for freight services can be identified.
The CARAVANA platform was officially handed over to SIECA in April 2017 upon the signing of an
MOU between USAID and SIECA. In November 2017, SIECA’s new Director General, Mr. Melvin
Redondo became increasingly interested in integrating CARAVANA Module 1 into SIECA’s main IT
system to maximize the potential of the tool. In December, RTMA developed and presented a roadmap

19 | RTMA QUARTERLY REPORT, JULY–SEPTEMBER 2017 USAID.GOV
for technical integration of Module 1. This roadmap laid out the technical expertise and steps required
to allow SIECA to generate an initial set of border crossing indicators to make them publically available
on the SIECA website by March 2018.
8 This is the same indicator as is being used for the RTMA Custom Indicator 2-1 referenced in Section 2.1.1.
RTMA is building capacity of SIECA staff to collect the necessary data and make the relevant calculations for this
Indicator. 9 “Reasonable Time” is defined as the median point having taken the extreme times (lowest and highest) for each
procedure.
TABLE 4. LIST OF CARAVANA PHASE 1 INDICATORS TO BE PUBLISHED ON THE SIECA WEBSITE
1. Cost of Transport per Metric Ton8
2. Average reasonable time9 between registration of International Transits Declarations (ITD) by
shipper and clearance of goods at the first CA Customs border encountered by the shipper.
3. Average reasonable time between entry at first CA Customs check to clearance from final CA
Customs Authority.
4. Average speed in route between countries from initiation point of shipment to conclusion of
international transit operations with any Customs Authority in the CA region.
5. Percentage of international transit shipments completed out of the total number of
international transit operations initiated by Customs on their IT Platform.
6. Percentage of consolidated ITDs registered electronically in the system per month in each of
the CA countries.
7. Percentage of ITDs initiated that involve goods potentially subject to quarantine.
8. Number of international transits, by CA country, for which the deadlines to conclude their
transit expire before the transit is completed.
9. Percentage of ITDs submitted by private operators in advance.
10. Percentage of ITDs registered but not initiating their journeys for more than 10 or 30 days
after registering.
11. Concentration of operations – number of international transit shipments initiated at each
border.

USAID.GOV RTMA QUARTERLY REPORT, JULY–SEPTEMBER 2017 | 20
RTMA and RTFE have been working together to help SIECA publish the indicators on their website by
June 2018. This has included providing technical experts to work on the IT integration and transfer
knowledge of the system and indicator calculations to SIECA staff.
Regarding Module 2 - The Freight Services Exchange – SIECA has been receiving conflicting feedback
from the private sector on the exchange concept since the handover of the tool from USAID to SIECA
in April 2017. Truck associations have expressed concerns about making their rates public on the
exchange and the downward pressure that could create for rate quotes to stay competitive. They are
also worried about not receiving payments from client companies, having unregistered carriers on the
exchange, vetting the competence of participating carriers, and how to make the exchange exclusive to
carriers that can ensure a level of quality. SIECA will continue working with the private sector to
address their concerns and attempt to achieve greater buy-in for the tool.
For now, Module 2 will continue to be administered by SIECA free of charge; however, SIECA is
interested in exploring options for outsourcing the administration of the platform to a private third
party. A private third party could introduce some form of fee for the service that would generate
income and make the tool self-sustaining.
2.1.4 CANOPIES INSTALLATION AT LA HACHADURA AND EL AMATILLO BORDER POINT
During this reporting quarter, the project continued working onsite at the La Hachadura and El Amatillo
borders to install the curved roofs (i.e. canopies) requested by El Salvador Customs to help improve
working conditions at the border inspection points. The shade provided by the canopies is allowing
border authority agents to work more comfortably during the hottest parts of the day as well as during
inclement weather. This, in turn, is resulting in increased continuity of border operations.
The RTMA vendor worked on the installation of the canopies while DGA carried out necessary
relocation of utilities at the selected sites (i.e. electricity, telephone and data cables, and adjustments to
sewage pipes). The El Salvador Ministry of Environment inspected the sites and gave the necessary
approvals.
The installation involved the following phases:
(i) Excavations and iron structure foundation work
(ii) Installation of cement pillars
(iii) Installation of the metal curved roofs
12. Concentration of operations – number of international transit shipments concluded at each
border.
13. Concentration by border – average declared weight in kilograms at journey initiation.
14. Concentration by border – average declared weight in kilograms at journey conclusion.
15. Concentration by border – average FOB value declared at journey initiation.
16. Concentration by border – average FOB value declared at journey conclusion.

21 | RTMA QUARTERLY REPORT, JULY–SEPTEMBER 2017 USAID.GOV
(iv) Construction of rain channels (i.e. rainfall run-off system)
(v) Electrical work for required indoor lighting inside the canopy
FIGURE 7: INSTALLATION OF THE METAL CURVED ROOF FOR THE CANOPY AT LA HACHADURA
RTMA’s civil engineering expert oversaw the whole installation process at both La Hachadura and El
Amatillo and provided advice and direction to the team and Customs whenever unanticipated challenges
arose.
The project had to coordinate closely with USAID’s Regional Clean Energy (RCE) Project, managed by
Tetratech, to ensure that the energy efficient lighting at the site of the canopies was not compromised
by the construction work or final installation of the canopies. When the project discovered that two of
the RCE lampposts were located inside the proposed site of the canopy at La Hachadura, the RTMA
Team worked with the lighting contractor used by the RCE Project to find a solution. This involved
shortening those particular lampposts so that they could fit under the canopy and still achieve the
objective of illuminating the area. This unanticipated challenge caused a small delay in the final delivery
schedule, meaning that the canopies were completed at the end of the month of December as opposed
to mid-December as originally scheduled. Since then, DGA has been able to conduct operations under
the canopies.
At La Hachadura, the SAT control point has been moved from the exposed area they were working at
by the bridge and are now located under the canopy. The Customs authorities in both El Salvador and
Guatemala are very satisfied with the canopy installed.
Additionally, at La Hachadura, DGME has been able to set up a control point under the canopy. This
means that CTU drivers no longer need to park their units and walk 500ft to the Immigration window

USAID.GOV RTMA QUARTERLY REPORT, JULY–SEPTEMBER 2017 | 22
for the required migration checks. With both Migration and Customs officers situated under the canopy,
all checks can be done on a single stop of the CTU.
The canopy has also allowed El Salvador Customs’ to be able to use their portable equipment to
communicate with the ASYCUDA system for international transit operations. Previously, it was difficult
to use this equipment, as the information on the portable screens could not be read very well in the
strong sunlight. The shade provided by the canopy allows the officers to use this equipment more easily
and as originally intended.
At El Amatillo, DGA expects to move its border posts with the help of an MCC project. The timeline
for this project is not yet confirmed, and therefore, at the request of customs and with USAID approval,
RTMA completed the installation of the canopy at the current border post location. An MOU will be
signed between USAID RTMA, DGA, INL and MCC stating that the canopy at El Amatillo can be moved
to a different site if necessary. Any move will take place after the RTMA Project has closed and
USAID/RTMA will not be responsible for funding the move of the canopy at that time.
2.2 IMPROVEMENT OF ADMINISTRATIVE PROCESSES APPLICABLE TO TRADE
2.2.1 STATUS OF RFID INSTALLATION
2.2.1.1 INSTALLATION OF RFID INFRASTRUCTURE AT THE BORDERS.
By the end of December 2017, the entire RFID infrastructure at La Hachadura and El Amatillo was
installed with some electrical work continuing into the following month.
Successful installation of all arches and mounting of scanners, control boxes and other necessary
equipment allowed the Project to move on to developing and installing the application for computers
and display monitors at specified sites at each border (La Hachadura and El Amatillo). The application
allows Customs officers to see, via installed display monitors at these posts, which border operations
have already been carried out (e.g. customs control and selectivity) for trucks that have enrolled in
RFID. Having reliable and timely information made available through RFID allows Customs’ Traffic
Controller to efficiently direct the trucks to the next required border operation (e.g. check-out, case
resolution or X-Ray). A PC and two large display monitors in protective casing were installed at two
sites at each border, as marked by the blue indicators in the aerial map in Figure 8.

23 | RTMA QUARTERLY REPORT, JULY–SEPTEMBER 2017 USAID.GOV
FIGURE 8: AERIAL VIEW OF LA HACHADURA AND MONITOR SITES
RTMA successfully programmed the computer at La Hachadura to receive the truck license plate
number, lane processing instructions, declaration number and corresponding customs process (i.e. case
resolution, X-Ray, check-out etc.). This information is then displayed on the monitors at the border (See
Figure 9) to guide border officers on how to direct truck drivers. Several application test runs were
performed and multiple communications tests were conducted between DGA and the monitors at La
Hachadura before confirming successful operation for International Transit shipments.

USAID.GOV RTMA QUARTERLY REPORT, JULY–SEPTEMBER 2017 | 24
FIGURE 9: MONITOR DISPLAYING INFORMATION RECEIVED FROM RFID TAG AND INSTRUCTIONS FOR PROCESSING.
One unexpected challenge involved laying down 50 meters of additional cable at the site near the bridge
in La Hachadura to ensure consistent communication between the PC and the monitor. The PC had to
be located at a different position than anticipated as the data flow was inconsistent at the original
position, resulting in an unsteady monitor image. Although the current location for the PC now works
well to receive and transmit the data signals, a more permanent and adequate solution needs to be
found for housing the PC as it is currently housed in a small hut exposed to dirt and weather conditions.
RTMA worked closely with DGA’s Equipment Maintenance Department to ensure knowledge transfer
and understanding of what is required to maintain this equipment for the long term and DGA is working
on finding an acceptable long-term solution for La Hachadura

25 | RTMA QUARTERLY REPORT, JULY–SEPTEMBER 2017 USAID.GOV
FIGURE 10: INADEQUATE HOUSING FOR PC AT LA HACHADURA BORDER POINT
Similar testing of communication between PCs and Monitors needs to be done at El Amatillo to confirm
successful transmission of data signals; however, DGA was not able to make any of the necessary staff
available before December to visit the border to work on this installation. Therefore, installation of the
display monitors at El Amatillo has been delayed until the following quarter.
2.2.1.2 PROGRESS ON RFID IT PROGRAMMING AT DGA.
RTMA alongside DGA’s IT staff, were able to run a complete cycle of communications tests between
RFID, SIECA and ASYCUDA World (DGA’s customs management system). Successful data flow was
confirmed between the RFID System and SIECA and between the SIECA and DGA systems with the
complete cycle illustrated in Figure 11.

USAID.GOV RTMA QUARTERLY REPORT, JULY–SEPTEMBER 2017 | 26
FIGURE 11: RFID’S FLOW OF INFORMATION
Antena RFID
Nodo remoto SIECA
VPN
VPN
Nodo Central SIECA
Web ServiceAduanas
DIAGRAMA DE FLUJO DE DATOS RFIDDiciembre 2017
Red Local DGAWeb Service
Web Service
VPN
Procesamiento en operaciones de Sydunea World
Mostrar Resultado en Pantalla en
Frontera
The RFID tag number on the truck is read by the antennas installed at the border and sent to SIECA’s
Local Node in El Salvador. From there it is transmitted to SIECA’s Regional Central Node in Guatemala
City. At the SIECA HQ, the Tag ID number is crosschecked against the Regional RFID Enrollment database
and the International Transits Declarations System (TIM). An XML10 file is then automatically generated
with the International Transit Declaration (ITD) number and the license plate number of the truck. SIECA
sends the XML text to DGA, which receives it in ASYCUDA WORLD. DGA validates the information
received and performs the necessary operations (e.g. check-in, customs control, risk selectivity, conclusion
of transits, departure control). The verified IDT number, license plate number of the truck, and results of
any customs operations are then displayed on the monitor at the border point11.
10 XML is a file extension for an Extensible Markup Language file format used to create common information
formats and share both the format and the data through IT systems. 11 Please see flow charts in sections 2.2.1.5 of this Quarterly Report for more details of the process.

27 | RTMA QUARTERLY REPORT, JULY–SEPTEMBER 2017 USAID.GOV
Completion of the necessary RFID IT programming is taking longer than anticipated due to limited staff
availability at SIECA to conduct the complete cycle test runs and to fulfil the quality requirements for
different scenarios. To enable successful completion of programming, the systems at every institution
involved must be operating at the same required quality level. Due to the multiple variables of the
import/export/transit process and the software used for RIFD, problems may arise that can only be
addressed by IT experts and those responsible for the implementation of the RFID system at their
institution. If the relevant staff are not available, this can slow down progress on programming.
The RTMA Team is aiming to finalize all operational variable test runs, as required by Customs El
Salvador, in the first quarter of 2018, so that the RFID system is operational for International Transit
shipments before the end of the RTMA Project. Unfortunately, due to the lack of staff availability at
SIECA and DGA to work on the necessary IT programming, it will not be possible to have the Import
and Export processes operational in the RFID system before the end of the project. DGA and SIECA
have both committed to undertaking the necessary programming for Imports and Exports, however
future USAID assistance may be needed.
2.2.1.3 SECURITY ASSESSMENT
To finalize the installation of the RFID system, the Project, as agreed with DGA, contracted an
independent IT consulting firm to identify potential risks or vulnerabilities across the system in both the
network and in the software components. The IT Security firm will analyze the physical and logical
configuration of network devices involved in the RFID system. Objectives include verifying the correct
configuration of network equipment; verifying the Quality Assurance of software components;
identifying if there are any ‘backdoors’ in the software where data can flow through communication
channels other than those that were authorized by DGA and SIECA in agreement with RTMA; verifying
the system’s compliance with security policies and protocols established by DGA, DARA, SAT and
SIECA; identifying redundancies in the network; verifying that the RFID system has no weak spots that
are vulnerable to security attacks and unauthorized access to data; and diagnosing any potential risks and
vulnerabilities in the system hardware and software. The firm will then return to assess the state and
level of security of the system after a set period of time has been given to correct the findings identified
in the original diagnosis.
An RFP for this work was issued in December and a firm had been selected by the Project to begin the
assessment in January. This will involve coordinating with the three Customs Authorities in the Northern
Triangle and SIECA.
2.2.1.4 PROGRESS ON USER ENROLLMENT, NORTHERN TRIANGLE ACTIONS.
The Project continues to work together with the RTFE Project to provide support for the design and
dissemination of the RFID enrollment platform. The platform was originally software based and held
locally on computers at the customs’ offices. (RTMA was able to provide computers dedicated for this
purpose to DGA and DARA.) However, RTMA and the customs agencies agreed, that for improved
security, the platform needed to draw from a Regional Enrollment Database, be web-based, and
administered and supported at a regional level by SIECA. RTFE provided SIECA with technical support
to develop a web-based platform that fulfills the IT and data security standards for each NT Customs
Authority and IT experts from RTFE, RTMA and SIECA are in the process of migrating the local
software platforms for each country into the regional platform.

USAID.GOV RTMA QUARTERLY REPORT, JULY–SEPTEMBER 2017 | 28
RTMA trained DGA customs officers on how to register and assign RFID tags to individual Cargo
Transporting Units (CTUs) through the web-based platform; how to identify the trucks that are to
receive tags; how to communicate the objectives of the program to the drivers; and how to physically
attach the tags to the truck windshields. This effort has included training 27 DGA Customs Officers and
4 technicians from the La Hachadura and El Amatillo borders and a Customs Regional Coordinator
located at the San Bartolo Central HQ.
RTMA coordinated with RTFE to deliver tags from the RFID vendors to SAT Guatemala and DARA
Honduras as well as laptops from the projects to facilitate registration at the border and pre-clearance
centers. DARA was able to enroll trucks with RFID tags during this period; Guatemala on the other
hand received training from RTFE on how to use the RFID Regional Enrollment Platform and will start
their enrollment early in January 2018.
As of mid-January 375 CTUs are enrolled in the RFID system; 156 of these records have been validated
and are ready to be migrated into the SIECA Regional Enrollment Database. The project aims to validate
the other 219 records and to have the regional database integrated and functioning with the RFID
system by the end of February.
The joint goal of Customs Authorities across the Northern Triangle is to have 1,100 CTU’s enrolled in
the system by the end of the RTMA project. One of the major challenges to achieving this goal includes
the lack of infrastructure for enrollment. Drivers do not have adequate space at the border to park
their trucks while they complete the registration. The registration space also needs to be where the
Customs Officer has access to a PC and internet connection. During this past quarter, the only spaces
where this could be done were at the International Transits Revisions areas at La Hachadura and El
Amatillo. This process is also taking longer due to the lack of availability of Customs Officers to
conduct the enrollments.
2.2.1.5 PROCESSES AT THE BORDER USING THE RFID CONTROL SYSTEM.
In November, RTMA prepared a procedures model for International Transit cargo incorporating the
new RFID technology and automated operations for La Hachadura and El Amatillo for DGA. These
procedures guides customs officers through the RFID procedures that need to be applied at the border.
The RFID process varies slightly depending on whether transit cargo is passing through a border post
for the first time or whether it has already passed a post and received a container seal from the customs
authority. However, the general process consists of three main parts at La Hachadura and El Amatillo:
RFID verification, inspection, and RFID Verification Post-Inspection.
The table below breaks down the three main processes into sequential steps that occur.

29 | RTMA QUARTERLY REPORT, JULY–SEPTEMBER 2017 USAID.GOV
TABLE 5: ENTERING AND EXITING THE BORDER USING THE RFID CONTROL SYSTEM
LEVEL OF AUTOMATION
STEPS CUSTOMS PERSONNEL INVOLVED
LOCATION AT LA HACHADURA
BORDER
PART 1 – RFID VERIFICATION
AUTOMATED
– UTILIZES RFID
1. Verification that physical truck license plate matches what is in the system and on the monitor.
Customs Traffic Controller
Bridge/Canopy Checkpoints
2. Identify Declaration No. in the System and on the monitor.
3. Review results of electronic risk management module’s automated selectivity check and direct to Red, Yellow or Green Lanes accordingly. Unresolved and complex cases are directed to the Alternative Flow Lane.
Alternative Flow Lane cases are usually shipments where the operator is missing a document or payment, which is why the electronic risk management module cannot run the Selectivity Check on the shipment. (i.e. assign to the Red, Yellow or Green Lanes)
4. Verification that physical seal matches what is in the electronic system.
5. Sign off on CTU.

USAID.GOV RTMA QUARTERLY REPORT, JULY–SEPTEMBER 2017 | 30
PART 2 – INSPECTION
NON-AUTOMATED
6. Various Operations conducted manually on operators directed to the Red, Yellow or Alternative Flow Lanes as directed by Selectivity Check/Alerts e.g. X-Ray Inspection, Physical Inspection, Case Resolution.
Customs Official/ Administrator/
Verifier
Central Border Zone Area
7. In the Red and Yellow lanes, a Customs Official consults with the operator on errors and determines what is required to resolve the case and make the shipment ready for the Green Lane.
Unresolved and complex cases are directed to the Alternative Flow Lane and handled by the Customs Administrator (senior level). The Administrator verifies the reason for being in the Alternative Flow lane.
8. Customs Official Redirects CTU to Green Lane after necessary manual operations are satisfactorily completed. International Transit with DGA is initiated/concluded.
PART 3 RFID POST - INSPECTION
AUTOMATED
– UTILIZES RFID
9. Verify that physical truck license plate matches what is in the system and on the monitor and linked to the correct International Transit Declaration.
Customs Traffic Controller
Canopy/Bridge Checkpoints
10. Identify Declaration No. in the System and on the monitor.
11. Verify that alerts have been addressed.
12. Verification that physical seal matches what is in the electronic system.
13. Customs release goods at the border.
14. Departure authorized.
15. CTU enters/exits El Salvador.
31 | RTMA QUARTERLY REPORT, JULY–SEPTEMBER 2017 USAID.GOV
2.2.1.7 INTEGRATION TO RFID SYSTEM OF BORDER CONTROLS BY AGRICULTURE AND
IMMIGRATION.
RTMA and Customs have prepared several work plans laying out the steps and timeline required to
integrate Ministry of Agriculture and Directorate of Immigration processes, such as quarantine
inspections and driver immigration checks, into the RFID system.
Some progress has been made in developing the necessary software at MoA and DGME to allow their
systems to integrate with the RFID system. Another huge step forward was the agreement between
DGA and Agriculture to share a VPN. This will allow easier communication of data between these two
institutions. A challenge holding up further progress between MoA and Customs is the need to make an
agreed list of products in the ‘International Transit’ category that require quarantine inspections by
Agriculture. MoA have not been able to dedicate the necessary time to put together their priority list
and so further progress on integrating MoA has stalled.
Progress with DGME has also stalled. A VPN connection between DGME and SIECA needs to be
established to allow for easier data sharing. Additionally, SIECA needs to have a dependable regional
database of registered drivers. The regional driver database would be similar to the CTU Regional
Database described in Section 2.1.1.4 but with records of cargo drivers. Each country in Central
America would need to agree to provide SIECA with a list of their registered cargo drivers and this list
would have to be updated on a regular basis. In order to ensure information sharing takes place, there
would need to be a regional agreement amongst Central American countries to make data sharing
obligatory. Until such an agreement is in place, the RFID system will not have a dependable database of
truck drivers to draw from. Consequently, the RFID system will not be able to reliably verify
Immigration or Police Alerts about drivers. Subject to progress on the regional drivers database,
automation of Migration processes will only be possible at the local level.
2.2.1.8 INCORPORATING THE NEW RFID PROCESSES INTO NATIONAL REGULATIONS.
Before the new procedures for RFID can be officially adopted, they must first be drafted into General
Administrative Provisions by the Customs Regulatory Department. DGA has been proactive and
cooperative in this task; by January 2018, a draft version of the revised provisions for International
Transit was issued by the Regulatory Department. These draft, revised provisions will now be brought
into practice by the DGA Operations Department through further test-runs. The Customs Public
Communications Department will then provide notification to the private sector of the live test run for
new procedures for International Transit cargo and allow one week for public comments. Notification
will be provided through the DGA website and emails to subscribed RFID users.
2.2.1.9 CAPACITY BUILDING FOR ADMINISTERING RFID AND ENSURING SMOOTH
OPERATIONS AT THE BORDERS.
In October 2017, ID Tech Logistics, the provider of the RFID Equipment, conducted a full-scale rollout
of the system with DGA. This involved trainings with officers at San Bartolo HQ, the La Hachadura and
El Amatillo borders; installation and configuration of software on the designated computers at the
relevant sites; and validation that all parts of the system, hardware and software, were operational.
Installation, configuration and validation was conducted alongside the officers who will be using the
equipment to allow for maximum opportunity for knowledge transfer. Table 5 provides the full lists of
trainings that were conducted.

USAID.GOV RTMA QUARTERLY REPORT, JULY–SEPTEMBER 2017 | 32
TABLE 6. RFID SYSTEM TRAINING
DESCRIPTION OF TRAINING PARTICIPANTS VENUE
Basic Principles of RFID and
Functionality of the RFID
System installed
10 San Bartolo HQ
Functionality of the RFID
Administration Software
7 San Bartolo HQ
Installation and Configuration of
the RFID Administration
Software
2 San Bartolo HQ
Installation and Configuration of
the RFID Enrollment software
and RFID Portable Reader
software
1 La Hachadura
Functionality of the RFID
Portable reader system
28 San Bartolo HQ, La Hachadura
and El Amatillo borders
Functionality of the RFID
enrollment software installed
locally
20 La Hachadura and El Amatillo
borders
Total Number of Attendees
(Note: This is not a cumulative
figure as some attendees
attended more than one
training.)
58
DGA has requested a second training to include more sessions on practical application of the system.
This training will be conducted during the next quarter.
2.2.1.10 CENTRAL AMERICAN RFID OPERATIONAL MANUAL.
In the previous quarter, SIECA requested that a RFID Operational Manual be created. This manual
would support the region’s ministries and customs authorities in understanding how the RFID
implementation will aid economic integration under the Central American Strategy on Trade Facilitation
and Competitiveness. The Manual will also be useful to national authorities in the region as they
integrate the RFID system with their own IT systems to enable increased automation of operations.
SIECA’s trade facilitation team and SIECA’s Secretary General, Mr. Melvin Redondo approved a draft
outline of the Manual in September 2017 and RTMA has been working with RTFE to complete the draft.
The first draft will be submitted to SIECA for review and feedback with the aim of incorporating edits in
the final quarter of the RTMA Project. SIECA will then be responsible for dissemination of the Manual.
The Manual describes the technical, tactical and strategic benefits of the RFID intervention that is being
implemented in the Central American Northern Triangle and the added value that the system brings to
Coordinated Management of Borders in the region, as envisaged in the Central American Strategy for
Trade Facilitation and Competitiveness, approved by COMIECO in October 2015. The Manual follows a
step-by-step methodology, going through the process operation improvements and IT programming
required in order to implement the use of RFID successfully at border points, starting with studies on

33 | RTMA QUARTERLY REPORT, JULY–SEPTEMBER 2017 USAID.GOV
flow lines and bottlenecks, time monitoring, economic impact assessments, and then concludes with a
section on lessons learned/challenges faced.
2.2.1.11 LINKING THE AEO PROGRAM TO THE RFID SYSTEM.
The Project has met with the DGA staff assigned to developing an Action Plan for linking RFID CTUs
and drivers to El Salvador’s AEO program, however, the DGA Manager responsible for has not been
available to dedicate time to move this initiative forward. RTMA has therefore suspended this activity
from its work plan.
2.3 SUPPORTING THE INCORPORATION OF EL SALVADOR TO THE CUSTOMS UNION
At the request of USAID, the Project supported the El Salvador Ministry of Economy in their efforts to
join the Customs Union with Honduras and Guatemala. The Project supported through provision of
catering services for 40 to 200 attendees at high-level meetings between MoE, SIECA, and
representatives from the following El Salvador, Guatemala and Honduras agencies: Customs, Ministry of
Finance, Directorate for Immigration, Ministry of Agriculture, Ministry of Health, Ports and Airports
Administration Authority and the Center for Import and Export Procedures (CIEX)12.
Negotiation sessions took place in San Salvador in October where the following topics were discussed:
1) Revision of El Salvador Integration Roadmap and commitments reached in previous session.
2) Observations on legal documents (agreements and administrative resolutions), derived from the
GT- HN customs union, to identify the need for modification or adjustment to these
documents.
3) Agenda for next meeting of trilateral negotiation to be held in February 2018.
Tables were organized for Vice ministers and counterparts to discuss what would be required to
integrate El Salvador into the Customs Union. The Head Table was made up of the Vice ministers of
Trade for El Salvador, Guatemala and Honduras, and expert level tables were set up to discuss Origin,
Tariffs, Domestic Taxes, Sanitary and Phytosanitary, Customs, Migration, IT and Public Works
(Infrastructure).
12 Department within the El Salvador Central Bank responsible for developing and promoting El Salvador’s Single
Window System.

USAID.GOV RTMA QUARTERLY REPORT, JULY–SEPTEMBER 2017 | 34
Ministry of Finances -
Directorate General of
Customs
SIECA
Secretary of
Economic
Development
Ministry of
Development,
Industry and Trade
Ministry of Agriculture and
Livestock Ministry of Economy
Revenue
Management
Service
Central Reserve Bank Superintendence of
Tax Administration
National Food and
Agricultural
Health and Safety
Service -SENASA
Ministry of Foreign Affairs Directorate-General
for Migration
Deputy Direction
of Customs
Revenue
Central Reserve Bank - Import
and Export Processing Center
Ministry of Foreign
Affairs
National Migration
Institute
Presidential Commissioner National Civilian
Police
General Directorate of
Migration and Aliens Affairs
Ministry of
Government
Ministry of Finances -
Directorate General of
Domestic Taxes
Ministry of
Agriculture,
Livestock and Food
Private sector associations
National Civilian Police
Ministry of Economy
TABLE 7. AGENCIES REPRESENTED AT THE CUSTOMS UNION MEETINGS
EL SALVADOR GUATEMALA HONDURAS NICARAGUA