running head: aging, reinforcement …supp.apa.org/psycarticles/supplemental/pag0000112/...running...
TRANSCRIPT
Running head: AGING, REINFORCEMENT LEARNING AND ATTENTION, supplemental material
1
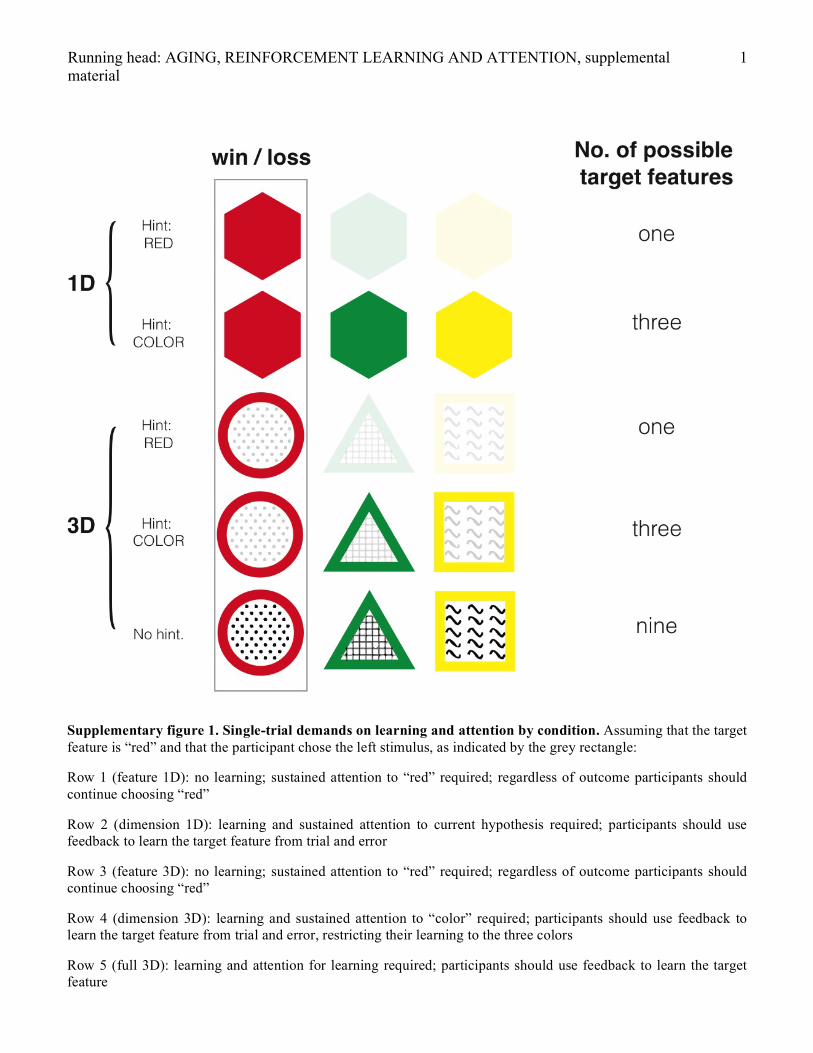
Supplementary figure 1. Single-trial demands on learning and attention by condition. Assuming that the target feature is “red” and that the participant chose the left stimulus, as indicated by the grey rectangle:
Row 1 (feature 1D): no learning; sustained attention to “red” required; regardless of outcome participants should continue choosing “red”
Row 2 (dimension 1D): learning and sustained attention to current hypothesis required; participants should use feedback to learn the target feature from trial and error
Row 3 (feature 3D): no learning; sustained attention to “red” required; regardless of outcome participants should continue choosing “red”
Row 4 (dimension 3D): learning and sustained attention to “color” required; participants should use feedback to learn the target feature from trial and error, restricting their learning to the three colors
Row 5 (full 3D): learning and attention for learning required; participants should use feedback to learn the target feature

Running head: AGING, REINFORCEMENT LEARNING AND ATTENTION, supplemental material
2
0 0.5 1 1.5 20
10
20
30
40
RT(s) in “feature 1D”
frequ
ency
0 0.5 1 1.5 20
10
20
30
40
RT(s) in “dimension 1D”
frequ
ency
0 0.5 1 1.5 20
10
20
30
40
RT(s) in “feature 3D”
frequ
ency
0 0.5 1 1.5 20
10
20
30
40
RT(s) in “dimension 3D”
frequ
ency
0 0.5 1 1.5 20
10
20
30
40
RT(s) in “full 3D”
frequ
ency
1 2 3 4 50
0.1
0.2
0.3
0.4
condition
expo
nent
ial co
mpo
nent 1 - feature 1D
2 - dimension 1D3 - feature 3D4 - dimension 3D5 - full 3D
Supplementary figure 2. Sample ex-gaussian fits for the reaction time distribution by condition for a single participant. Top left panel shows the value of the exponential skew component corresponding to the fit distribution for each of the 5 conditions. The best-fit distribution is shown in orange.
Running head: AGING, REINFORCEMENT LEARNING AND ATTENTION, supplemental material
3
younger adults older adults0
0.33
0.5
1
low performershigh performers
accu
racy
in “3
D n
o cu
e”co
nditi
on
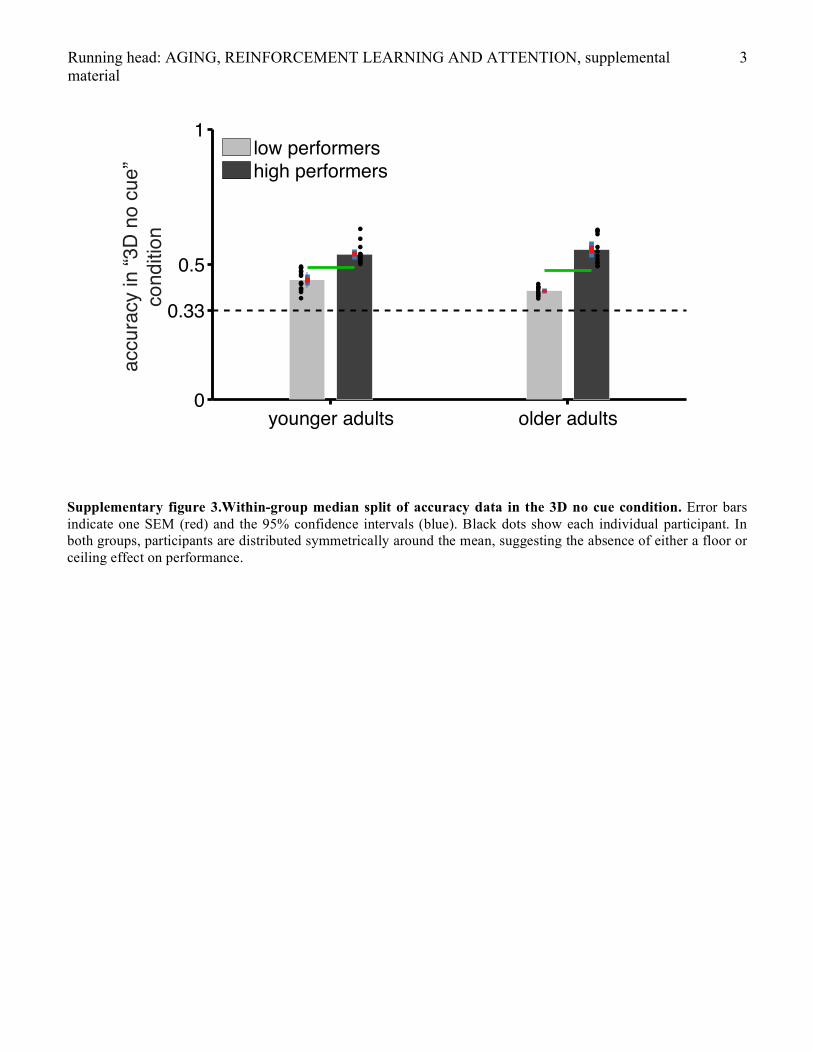
Supplementary figure 3.Within-group median split of accuracy data in the 3D no cue condition. Error bars indicate one SEM (red) and the 95% confidence intervals (blue). Black dots show each individual participant. In both groups, participants are distributed symmetrically around the mean, suggesting the absence of either a floor or ceiling effect on performance.
Running head: AGING, REINFORCEMENT LEARNING AND ATTENTION, supplemental material
4
0.4
0.5
0.6
0.7
0.8
0.9
1
resp
onse
time
(s)
1D cu
ed fea
ture
1D cu
ed dim
ension
3D cu
ed fea
ture
3D cu
ed dim
ension
3D no
cue
younger adultsolder adults
n.s.
***
*****
*
***
***
***
featur
e 1D
dimen
sion 1
D
featur
e 3D
dimen
sion 3
D
full 3
D
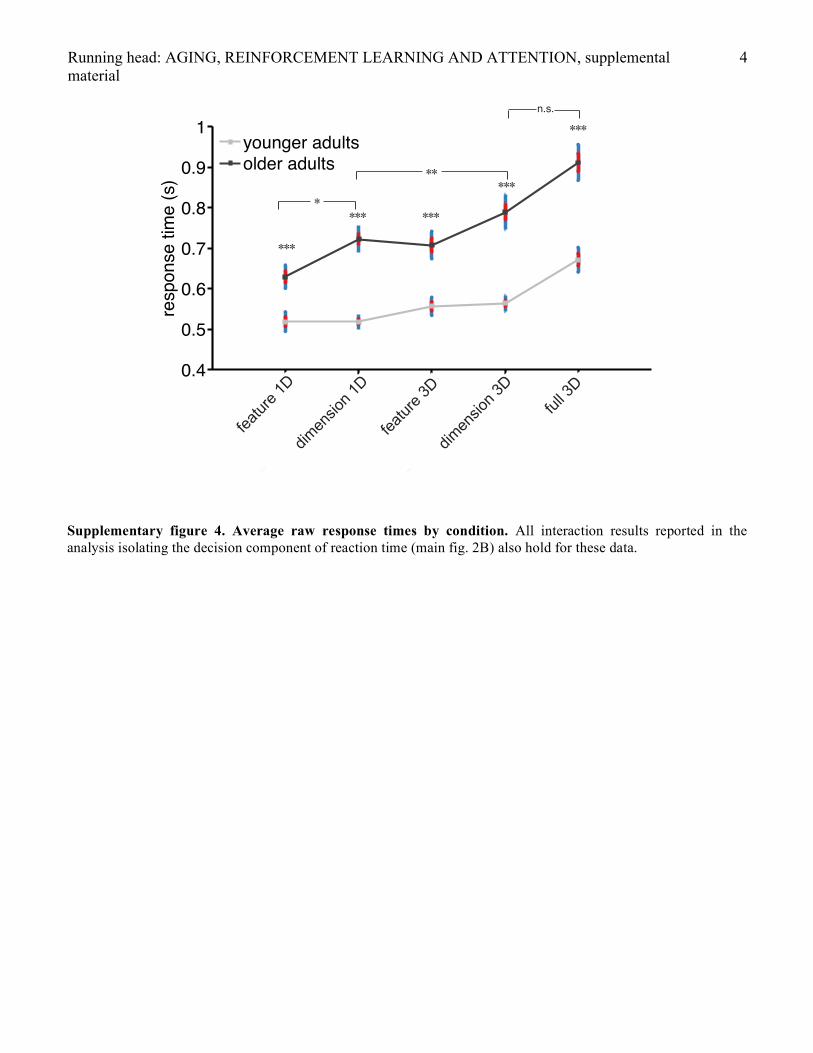
Supplementary figure 4. Average raw response times by condition. All interaction results reported in the analysis isolating the decision component of reaction time (main fig. 2B) also hold for these data.
Running head: AGING, REINFORCEMENT LEARNING AND ATTENTION, supplemental material
5
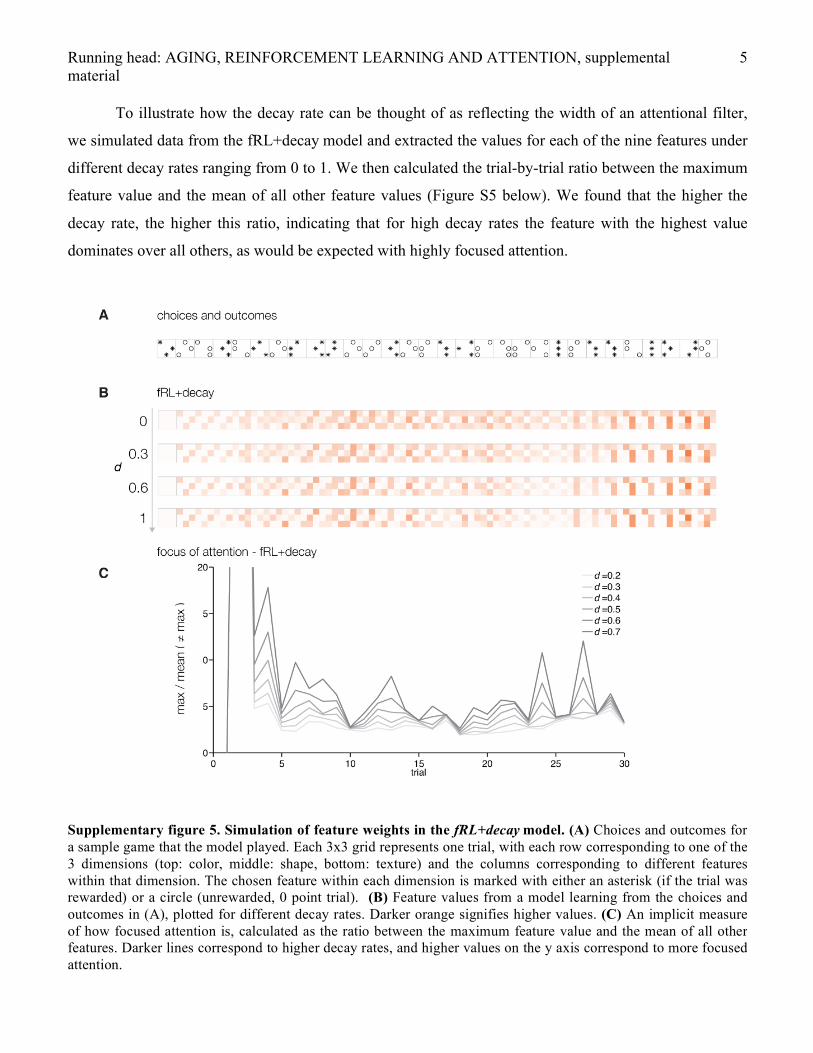
To illustrate how the decay rate can be thought of as reflecting the width of an attentional filter,
we simulated data from the fRL+decay model and extracted the values for each of the nine features under
different decay rates ranging from 0 to 1. We then calculated the trial-by-trial ratio between the maximum
feature value and the mean of all other feature values (Figure S5 below). We found that the higher the
decay rate, the higher this ratio, indicating that for high decay rates the feature with the highest value
dominates over all others, as would be expected with highly focused attention.
Supplementary figure 5. Simulation of feature weights in the fRL+decay model. (A) Choices and outcomes for a sample game that the model played. Each 3x3 grid represents one trial, with each row corresponding to one of the 3 dimensions (top: color, middle: shape, bottom: texture) and the columns corresponding to different features within that dimension. The chosen feature within each dimension is marked with either an asterisk (if the trial was rewarded) or a circle (unrewarded, 0 point trial). (B) Feature values from a model learning from the choices and outcomes in (A), plotted for different decay rates. Darker orange signifies higher values. (C) An implicit measure of how focused attention is, calculated as the ratio between the maximum feature value and the mean of all other features. Darker lines correspond to higher decay rates, and higher values on the y axis correspond to more focused attention.
Running head: AGING, REINFORCEMENT LEARNING AND ATTENTION, supplemental material
6
Learning rate Learning rate Temperature
●●
●
●
●●
●●
●●
●●
●
●● ●
●
●
●
●
●●
●
●●●
●
●
●
●
●
●
●
●
●
●●●
●
●●
●
●
●
●
●
●
●
●
●
●●
●
●
0
10
20
30
40
50
0.0 0.1 0.2 0.3 0.4 0.5
●
●●●
●●
●
●●
●
●●●●
● ●
●
●
●
●●
●●
●
●●
●
●
●
●●●
●
●
●●
●
●
●
●
●
●
●
●● ● ● ●
●
●
●●
●●
0.00
0.25
0.50
0.75
1.00
0.0 0.1 0.2 0.3 0.4 0.5
●
●● ●
●●
●
●●
●
●● ●●
●●
●
●
●
●●
● ●
●
●●
●
●
●
● ●●
●
●
●●
●
●
●
●
●
●
●
●●●●●
●
●
●●
● ●
0.00
0.25
0.50
0.75
1.00
0 10 20 30 40 50
Tem
pera
ture
Deca
y ra
te
Deca
y ra
te
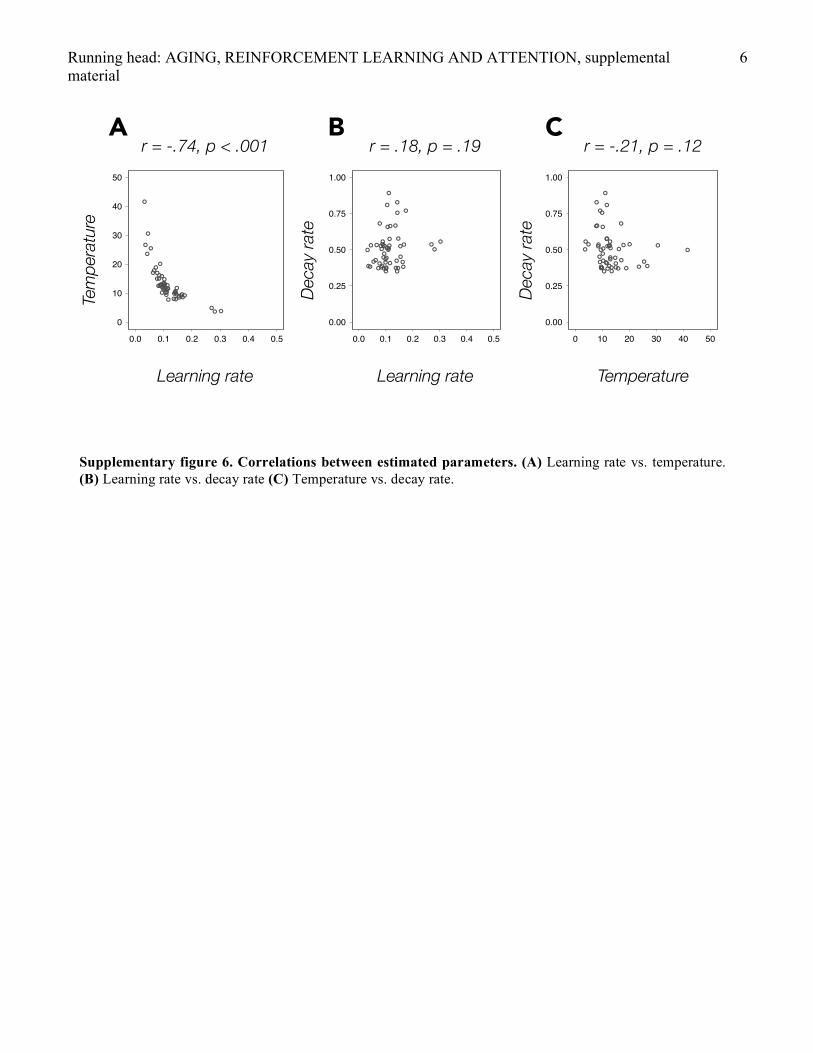
r = -.74, p < .001 r = .18, p = .19 r = -.21, p = .12A B C
Correlations between estimated parameters
Supplementary figure 6. Correlations between estimated parameters. (A) Learning rate vs. temperature. (B) Learning rate vs. decay rate (C) Temperature vs. decay rate.
Running head: AGING, REINFORCEMENT LEARNING AND ATTENTION, supplemental material
7
0 0.1 0.2 0.3 0.40
0.1
0.2
0.3
0.4
True learning rate
Rec
over
ed le
arni
ng ra
te
0 10 20 30 40 50 600
10
20
30
40
50
60
True temperature
Rec
over
ed te
mpe
ratu
re
0 0.2 0.4 0.6 0.8 10
0.2
0.4
0.6
0.8
1
True decay rate
Rec
over
ed d
ecay
rate
A B
C
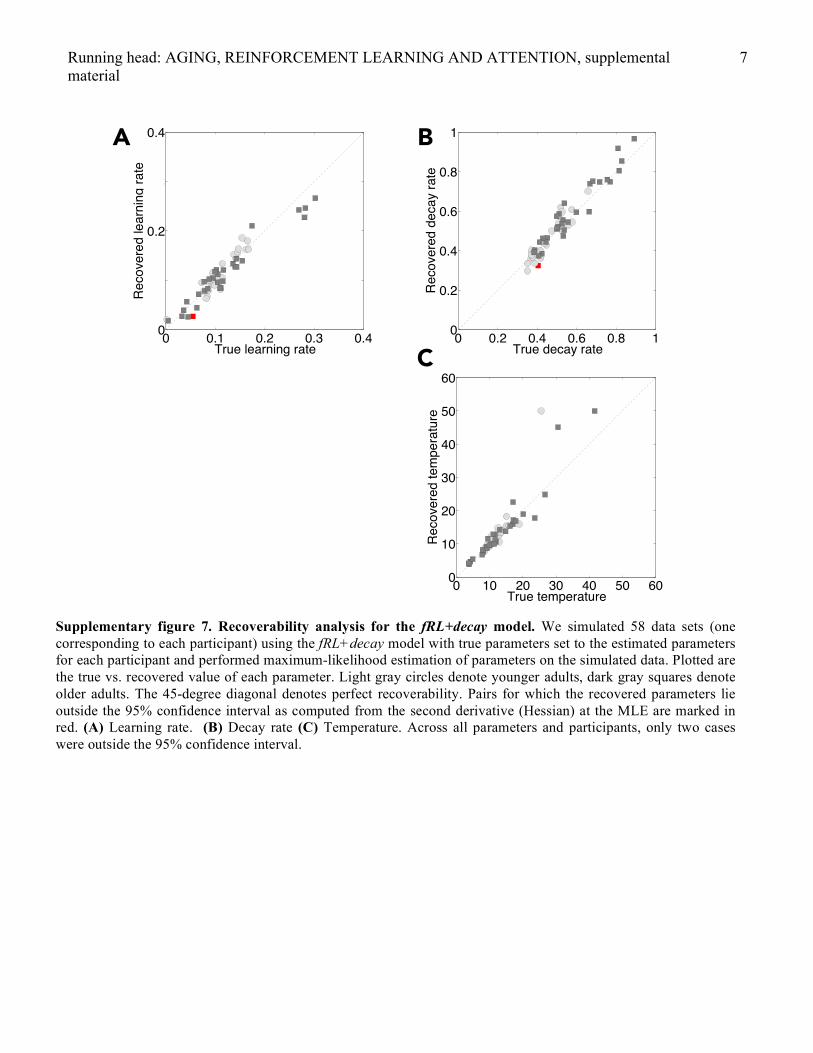
Supplementary figure 7. Recoverability analysis for the fRL+decay model. We simulated 58 data sets (one corresponding to each participant) using the fRL+decay model with true parameters set to the estimated parameters for each participant and performed maximum-likelihood estimation of parameters on the simulated data. Plotted are the true vs. recovered value of each parameter. Light gray circles denote younger adults, dark gray squares denote older adults. The 45-degree diagonal denotes perfect recoverability. Pairs for which the recovered parameters lie outside the 95% confidence interval as computed from the second derivative (Hessian) at the MLE are marked in red. (A) Learning rate. (B) Decay rate (C) Temperature. Across all parameters and participants, only two cases were outside the 95% confidence interval.
Running head: AGING, REINFORCEMENT LEARNING AND ATTENTION, supplemental material
8
0 5 10 15 20 25 30
−200
−100
0
100
200
Younger adults
Subject
log(
Baye
s fa
ctor
)
0 5 10 15 20 25 30
−200
−100
0
100
200
Older adults
Subject
log(
Baye
s fa
ctor
)
fRL+
decay
mod
el
favo
red
fRL m
od
el f
avo
red
A B
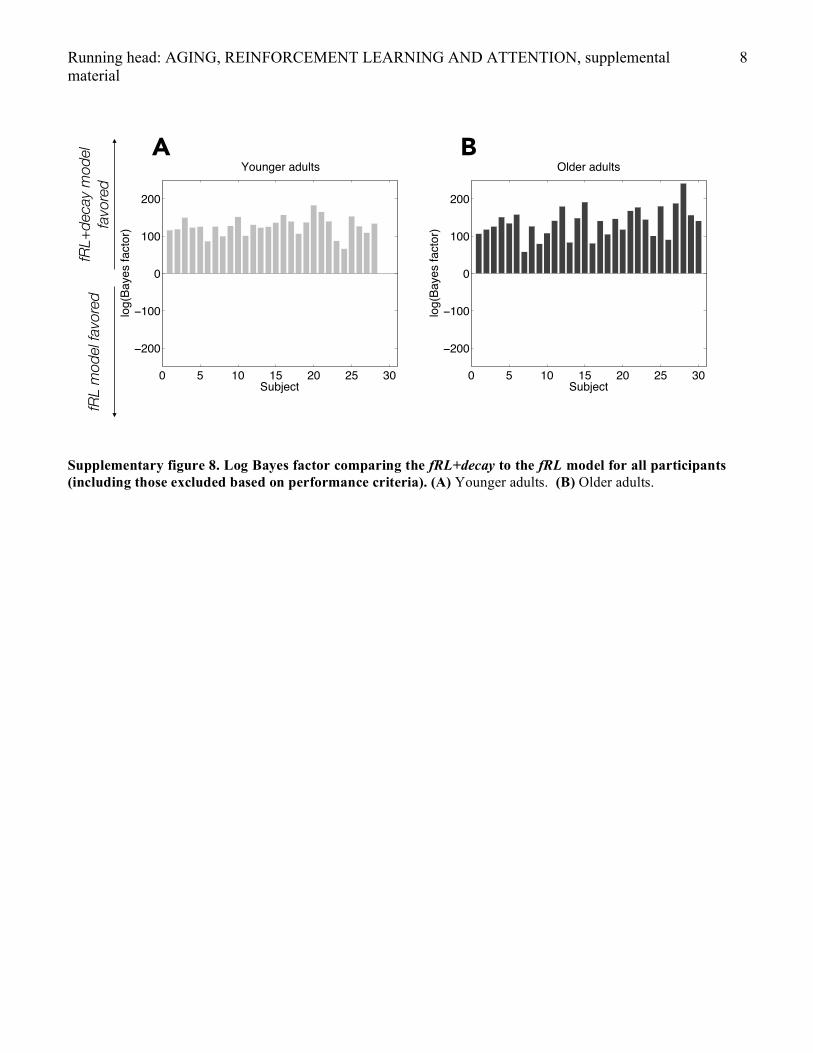
Supplementary figure 8. Log Bayes factor comparing the fRL+decay to the fRL model for all participants (including those excluded based on performance criteria). (A) Younger adults. (B) Older adults.