the influence of supplemental reinforcement in …
TRANSCRIPT
Caliskan, and Fick 2019 PCI/NBC
THE INFLUENCE OF SUPPLEMENTAL REINFORCEMENT IN CONCRETE BREAKOUT ZONES SUBJECTED TO SHEAR
Mert Caliskan, MS, Tema Builders Group, New York, NY Damon Fick, PhD, PE, Department of Civil Engineering, Montana State University, MT
ABSTRACT Preliminary research has been completed to identify concrete breakout strengths for edge-lifting anchors commonly used during erection of thin precast wall panels. Experimental data was collected to document the failure geometry, load displacement response, and shear strength of reinforced concrete wall panels loaded by a commonly used precast edge-lifting anchor. Two groups of specimens were investigated: 1) without supplementary reinforcement, 2) with reinforcement provided by a local PC supplier as a standard practice in their connection detail. Anchorage failure of connections loaded in shear toward a free edge resulted in a larger breakout cone than is assumed by the concrete capacity design (CCD) method. Also, the addition of supplementary reinforcement increased the breakout strength by 30%. The potential to increase the breakout strength for thin precast concrete panels through revised breakout geometries and the use of supplementary reinforcement may significantly reduce additional expenses incurred during fabrication and erection.
Keywords: Specialty Inserts, Supplementary Reinforcement, Concrete Breakout
Caliskan, and Fick 2019 PCI/NBC
1
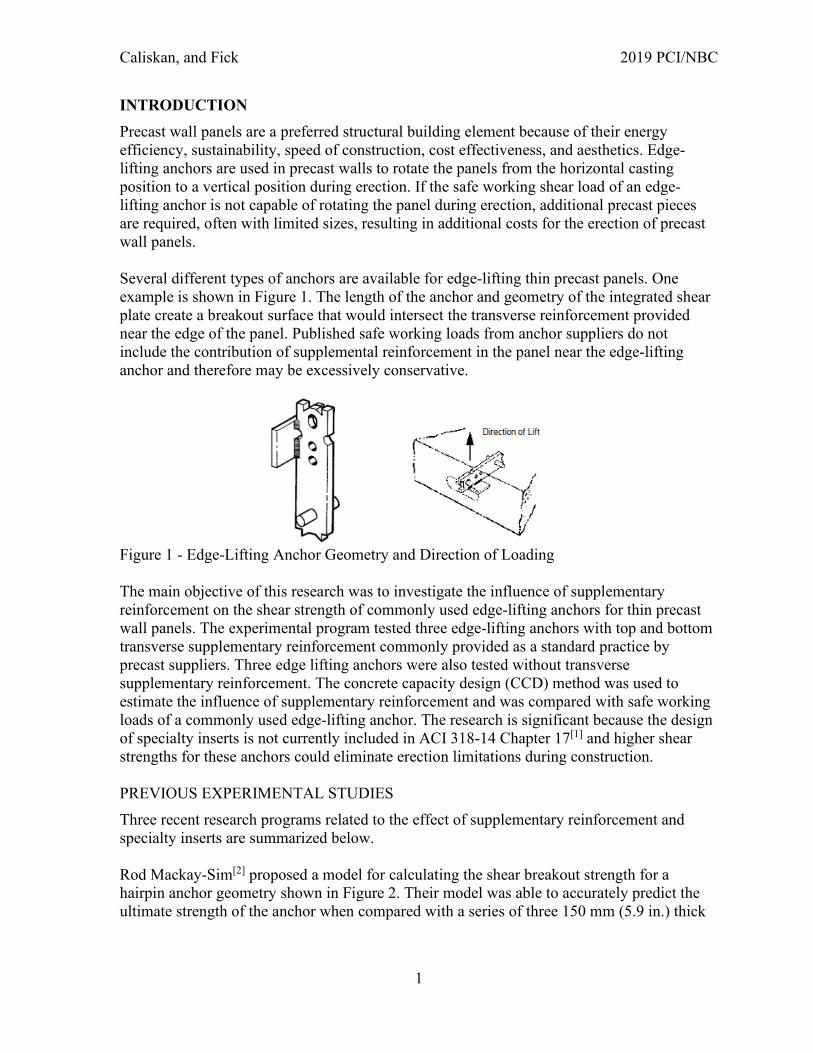
INTRODUCTION Precast wall panels are a preferred structural building element because of their energy efficiency, sustainability, speed of construction, cost effectiveness, and aesthetics. Edge-lifting anchors are used in precast walls to rotate the panels from the horizontal casting position to a vertical position during erection. If the safe working shear load of an edge-lifting anchor is not capable of rotating the panel during erection, additional precast pieces are required, often with limited sizes, resulting in additional costs for the erection of precast wall panels. Several different types of anchors are available for edge-lifting thin precast panels. One example is shown in Figure 1. The length of the anchor and geometry of the integrated shear plate create a breakout surface that would intersect the transverse reinforcement provided near the edge of the panel. Published safe working loads from anchor suppliers do not include the contribution of supplemental reinforcement in the panel near the edge-lifting anchor and therefore may be excessively conservative.
Figure 1 - Edge-Lifting Anchor Geometry and Direction of Loading The main objective of this research was to investigate the influence of supplementary reinforcement on the shear strength of commonly used edge-lifting anchors for thin precast wall panels. The experimental program tested three edge-lifting anchors with top and bottom transverse supplementary reinforcement commonly provided as a standard practice by precast suppliers. Three edge lifting anchors were also tested without transverse supplementary reinforcement. The concrete capacity design (CCD) method was used to estimate the influence of supplementary reinforcement and was compared with safe working loads of a commonly used edge-lifting anchor. The research is significant because the design of specialty inserts is not currently included in ACI 318-14 Chapter 17[1] and higher shear strengths for these anchors could eliminate erection limitations during construction. PREVIOUS EXPERIMENTAL STUDIES Three recent research programs related to the effect of supplementary reinforcement and specialty inserts are summarized below. Rod Mackay-Sim[2] proposed a model for calculating the shear breakout strength for a hairpin anchor geometry shown in Figure 2. Their model was able to accurately predict the ultimate strength of the anchor when compared with a series of three 150 mm (5.9 in.) thick

Caliskan, and Fick 2019 PCI/NBC
2
concrete slabs. The concrete mixture of the slabs was designed to provide a 7-day strength of 25 MPa (3.6 ksi) and included 8 mm (5/16 in.) diameter wire mesh with a 100 mm x 200 mm (3.9 in. x 7.9 in.) grid spacing which was located in the center of the slab. Details of the reinforcement grid direction and location relative to the breakout area were not included. The expression proposed by Mackay-Sim[2] is shown in Equation 1.
Figure 2 – Connection and Loading Condition Investigated by Mackay-Sim[2] (dimensions in mm)
Failure Load = 𝑓𝑓′𝑝𝑝 ∗ 𝐴𝐴𝑠𝑠 Equation 1 Where 𝑓𝑓′𝑝𝑝 = 0.26�𝑓𝑓′𝑐𝑐 𝑓𝑓′𝑐𝑐 = Concrete Compressive Strength (MPa) 𝐴𝐴𝑠𝑠 = 𝑒𝑒 ∗ 𝐿𝐿√2
𝑒𝑒 = Embedment Depth from Top of Slab to Supplementary Reinforcement (mm); 𝑒𝑒 = 𝐷𝐷 − 𝑐𝑐 − 𝑑𝑑𝑏𝑏
𝐿𝐿 = Length of Anchor (mm) More recent research by Sharma et al.[3] was performed to specifically investigate the influence of supplementary reinforcement for multiple headed studs. In this experimental program, a group of four anchors were tested with an effective depth of 155 mm (6.1 in.) and a spacing at 150 mm (5.9 in.) between the anchors. For the shear tests, a concrete mixture with a minimum strength of 20 MPa (2.9 ksi) was used for the two types of reinforcement configurations shown in Figure 3. The supplementary reinforcement shown in Figure 3 had a diameter of 12 mm (#4 rebar). Three test specimens were tested for each configuration. Based on the results from these tests, the failure load increased 63% with the addition of supplementary reinforcement. A second paper by Sharma et al.[4] proposed an analytical model to calculate the strength of anchors with 12 mm diameter (#4 rebar) supplementary reinforcement which agreed well with the test results described above. For the specimens with supplementary reinforcement, the ratio of experimental peak load to the peak load using the proposed model was 1.1, whereas compared to the load calculated using the method from EN1992-4[5], the ratio was 4.4. This suggests that the approach proposed by EN1992-4 is conservative for the geometry of the four-stud group tested by Sharma et al.[3]
e = 108
c = 30
db = 12

Caliskan, and Fick 2019 PCI/NBC
3
Figure 3 - Configuration of supplementary reinforcement used by Sharma et al.[3]
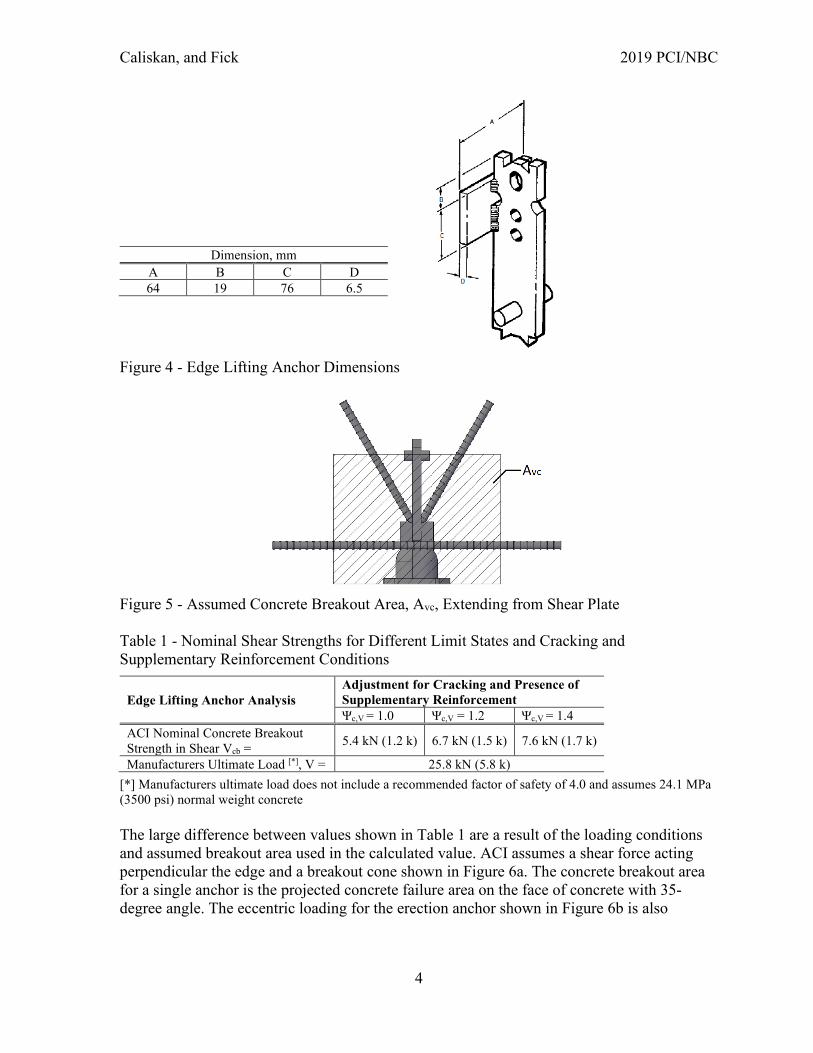
The research described in this paper contributes to the existing literature through an experimental program that investigates the shear breakout strengths of a commonly used edge-lifting anchor for thin precast wall panels. An eccentric shear load was applied to the edge of thin precast wall specimens to create a shear breakout cone, where the influence of supplementary reinforcement was evaluated. ACI 318 CAPACITY DESIGN METHOD ACI-318[1] uses the capacity design method (CCD) to estimate the strength of anchors in concrete. Commentary in Chapter 17 states “The addition of reinforcement in the direction of the load to restrain concrete breakout can greatly enhance the strength and deformation capacity of the anchor connection. Such enhancement is practical with cast-in anchors such as those used in precast sections.” To account for the increased strength and ductility, two adjustments for the presence of supplementary reinforcement crossing the concrete breakout surface are included in ACI 318. The use of a strength reduction factor ϕ = 0.75 compared with ϕ = 0.70 for the absence of supplementary reinforcement accounts for increased deformation capacity. For strength, a modification factor accounting for the presence of cracking and supplementary reinforcement (Ψc,V) varies from 1.0 to 1.4. These are only valid for cast-in anchors and to post installed expansion, undercut, and adhesive anchors. Specialty inserts are not covered by provisions of Chapter 17 of ACI 318-14 and the potential increased strengths due to the presence of supplementary reinforcement are not included with the safe working loads provided for edge lifting anchors. The geometry of the edge-lifting anchor used in this research is shown in Figure 4. A concrete breakout area of Avc = 47,420 mm2 (73.5 in2), shown in Figure 5 was used to calculate the breakout strengths using 24.1 MPa (3,500 psi) concrete strength. Ranges of calculated shear breakout strengths for the presence of supplementary reinforcement and/or cracking are shown in Table 1. The larger ultimate shear load of 25.8 kN (5.8 kips) provided by the manufacturer confirms the ACI method is not applicable to specialty inserts for the assumed breakout geometry (Figure 5).
Caliskan, and Fick 2019 PCI/NBC
4
Figure 4 - Edge Lifting Anchor Dimensions
Figure 5 - Assumed Concrete Breakout Area, Avc, Extending from Shear Plate Table 1 - Nominal Shear Strengths for Different Limit States and Cracking and Supplementary Reinforcement Conditions
Edge Lifting Anchor Analysis Adjustment for Cracking and Presence of Supplementary Reinforcement Ψc,V = 1.0 Ψc,V = 1.2 Ψc,V = 1.4
ACI Nominal Concrete Breakout Strength in Shear Vcb = 5.4 kN (1.2 k) 6.7 kN (1.5 k) 7.6 kN (1.7 k)
Manufacturers Ultimate Load [*], V = 25.8 kN (5.8 k) [*] Manufacturers ultimate load does not include a recommended factor of safety of 4.0 and assumes 24.1 MPa (3500 psi) normal weight concrete The large difference between values shown in Table 1 are a result of the loading conditions and assumed breakout area used in the calculated value. ACI assumes a shear force acting perpendicular the edge and a breakout cone shown in Figure 6a. The concrete breakout area for a single anchor is the projected concrete failure area on the face of concrete with 35-degree angle. The eccentric loading for the erection anchor shown in Figure 6b is also
Dimension, mm A B C D 64 19 76 6.5

Caliskan, and Fick 2019 PCI/NBC
5
perpendicular to the failure surface, however the assumed failure geometry (Figure 5) did not include a breakout area that extended from the end of the 200 mm (8 in.) long by 9.5 mm (3/8-in.) thick edge-lifting anchor.
(a) (b)
Figure 6 - Concrete Breakout Cones for (a) ACI Model and (b) Proposed Model
EXPERIMENTAL PROGRAM An experimental program to test the shear breakout strength of commonly used edge-lifting anchors embedded in thin precast wall panels was completed to identify the shear breakout strength, failure cone, and the effect of supplemental reinforcement. ANCHORING HARDWARE The edge-lifting insert shown in Figure 4 was used with a reusable recess plug attached to the anchoring zone before the concrete was cast. The pocket provided a location to connect the ring clutch, which was fastened to the loading apparatus. The recess plug, and ring clutch are one hardware option used by precast suppliers during construction to move precast panels from the horizontal to vertical position. CONCRETE PANEL SPECIMENS Three 810 mm (32 in.) wide by 1140 mm (45 in.) long by 89 mm (3.5 in.) thick concrete panels were cast to create six edge-lifting anchor tests by using a cantilevered support at approximately midspan of the panel. Three edge-lifting anchor tests included supplementary reinforcement (S1, S2, and S3) and three tests did not have supplementary reinforcement (N1, N2, and N3). The six edge-lifting anchor test specimens are shown in Figure 7.
All reinforcement was 9.5 mm diameter (#3 rebar). The longitudinal bars were spaced at 70 mm (2.8 in.) and were located in the bottom half of the slab with 19 mm (¾ in.) clear cover. The spacing of the longitudinal reinforcement was designed so the cantilevered flexural strength on each side of the panel exceeded the pull-out strength of the edge-lifting anchor. Transverse reinforcement was spaced at 11 in. o.c. and was placed on top of the longitudinal reinforcement. The supplementary reinforcement provided in panel specimens S1-S3 consisted of two transverse bars, one above and one below the edge-lifting anchor. V-shaped hanger bars with

Caliskan, and Fick 2019 PCI/NBC
6
430 mm (17 in.) extensions were provided in all specimens (Figure 7) and are commonly used by precast panel designers as tension reinforcement for supporting precast wall panels in the vertical position. Photographs of the reinforcement (S1-S3 with supplementary reinforcement, N1-N3 without) are shown in Figure 8.
Panel 1 Panel 2 Panel 3
N1 N3 S2
N2 S1 S3
N Indicates No Supplementary Reinforcement S Indicates Supplementary Reinforcement
Figure 7 - Reinforced Concrete Specimen Reinforcement and Plan Dimensions
Without Supplementary Reinforcement With Supplementary Reinforcement
Figure 8 – Panel Reinforcement Configurations
Location of supplementary reinforcements for specimens S1-S3
V-Shaped Hanger Bar
Caliskan, and Fick 2019 PCI/NBC
7
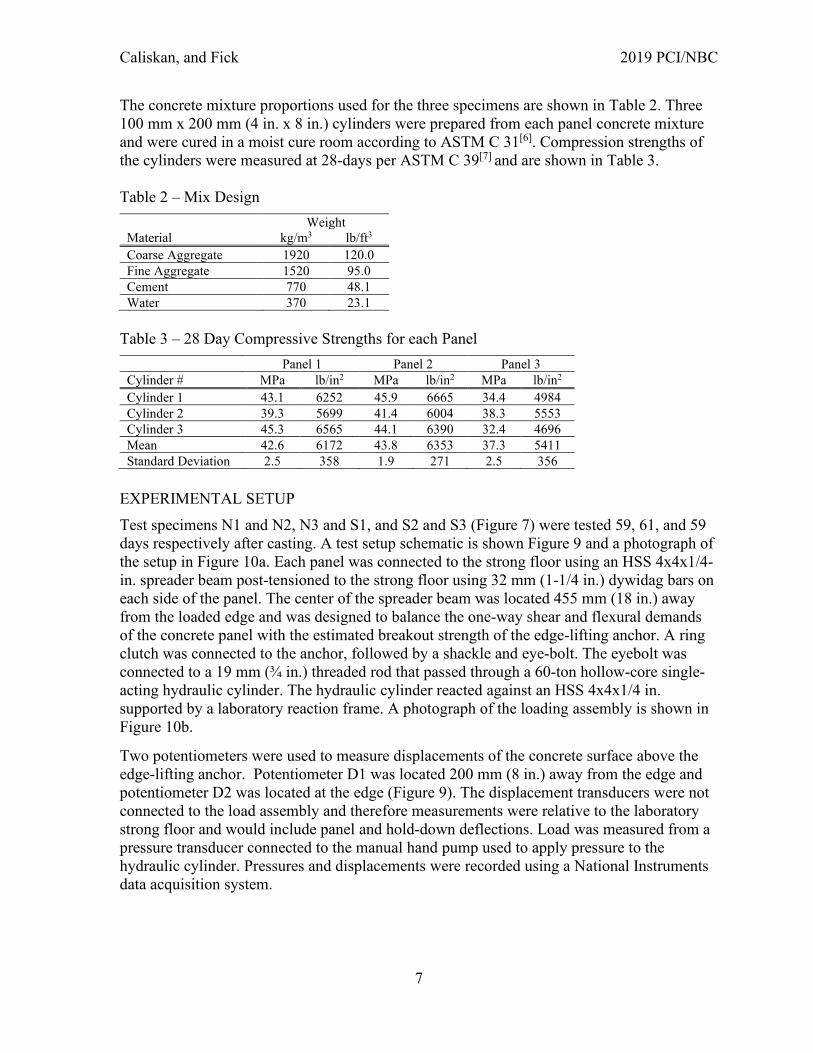
The concrete mixture proportions used for the three specimens are shown in Table 2. Three 100 mm x 200 mm (4 in. x 8 in.) cylinders were prepared from each panel concrete mixture and were cured in a moist cure room according to ASTM C 31[6]. Compression strengths of the cylinders were measured at 28-days per ASTM C 39[7] and are shown in Table 3. Table 2 – Mix Design
Weight Material kg/m3 lb/ft3 Coarse Aggregate 1920 120.0 Fine Aggregate 1520 95.0 Cement 770 48.1 Water 370 23.1
Table 3 – 28 Day Compressive Strengths for each Panel
Panel 1 Panel 2 Panel 3 Cylinder # MPa lb/in2 MPa lb/in2 MPa lb/in2 Cylinder 1 43.1 6252 45.9 6665 34.4 4984 Cylinder 2 39.3 5699 41.4 6004 38.3 5553 Cylinder 3 45.3 6565 44.1 6390 32.4 4696 Mean 42.6 6172 43.8 6353 37.3 5411 Standard Deviation 2.5 358 1.9 271 2.5 356
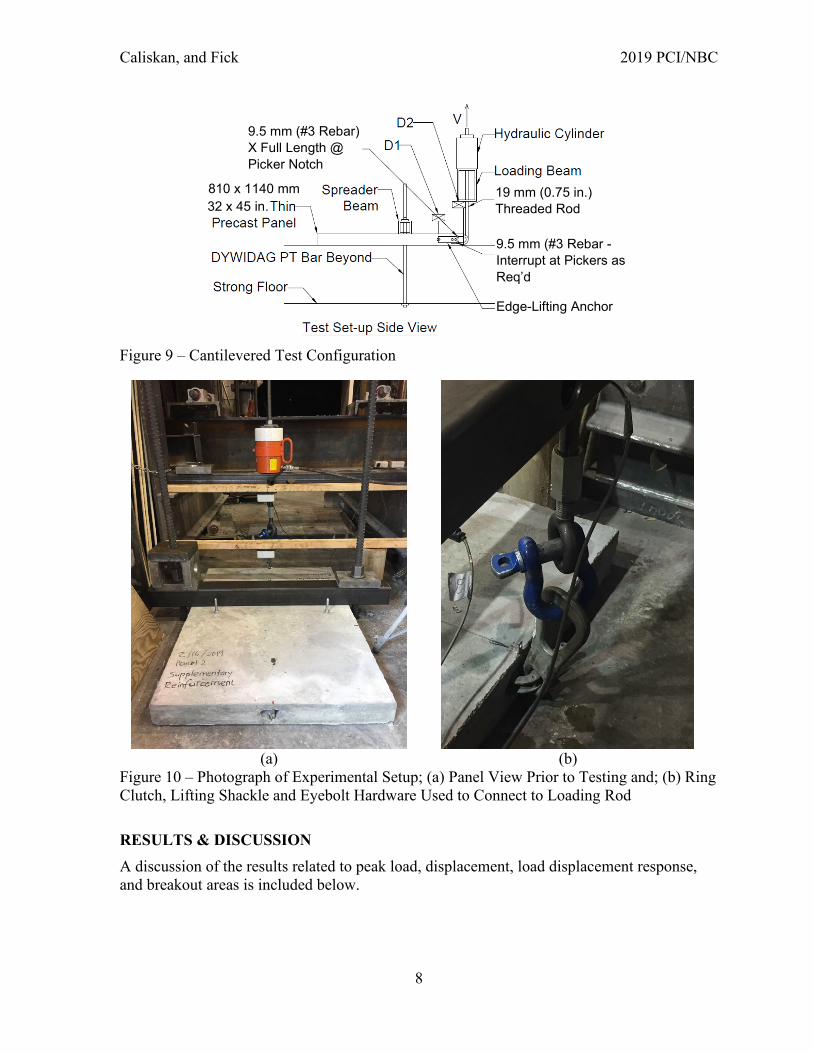
EXPERIMENTAL SETUP Test specimens N1 and N2, N3 and S1, and S2 and S3 (Figure 7) were tested 59, 61, and 59 days respectively after casting. A test setup schematic is shown Figure 9 and a photograph of the setup in Figure 10a. Each panel was connected to the strong floor using an HSS 4x4x1/4-in. spreader beam post-tensioned to the strong floor using 32 mm (1-1/4 in.) dywidag bars on each side of the panel. The center of the spreader beam was located 455 mm (18 in.) away from the loaded edge and was designed to balance the one-way shear and flexural demands of the concrete panel with the estimated breakout strength of the edge-lifting anchor. A ring clutch was connected to the anchor, followed by a shackle and eye-bolt. The eyebolt was connected to a 19 mm (¾ in.) threaded rod that passed through a 60-ton hollow-core single-acting hydraulic cylinder. The hydraulic cylinder reacted against an HSS 4x4x1/4 in. supported by a laboratory reaction frame. A photograph of the loading assembly is shown in Figure 10b.
Two potentiometers were used to measure displacements of the concrete surface above the edge-lifting anchor. Potentiometer D1 was located 200 mm (8 in.) away from the edge and potentiometer D2 was located at the edge (Figure 9). The displacement transducers were not connected to the load assembly and therefore measurements were relative to the laboratory strong floor and would include panel and hold-down deflections. Load was measured from a pressure transducer connected to the manual hand pump used to apply pressure to the hydraulic cylinder. Pressures and displacements were recorded using a National Instruments data acquisition system.
Caliskan, and Fick 2019 PCI/NBC
8
Figure 9 – Cantilevered Test Configuration
(a) (b)
Figure 10 – Photograph of Experimental Setup; (a) Panel View Prior to Testing and; (b) Ring Clutch, Lifting Shackle and Eyebolt Hardware Used to Connect to Loading Rod RESULTS & DISCUSSION A discussion of the results related to peak load, displacement, load displacement response, and breakout areas is included below.
9.5 mm (#3 Rebar) X Full Length @ Picker Notch
810 x 1140 mm 32 x 45 in.
19 mm (0.75 in.) Threaded Rod
9.5 mm (#3 Rebar - Interrupt at Pickers as Req’d
Edge-Lifting Anchor

Caliskan, and Fick 2019 PCI/NBC
9
PEAK LOAD AND DISPLACEMENT The peak load and measured displacements at the peak load for five specimens are shown in Table 4 and Table 5. A data acquisition error occurred during the test of specimen N2 and resulted in unreliable load measurements. The pressure transducer and data acquisition system were subsequently bench tested under an MTS load frame to confirm the pressure transducer and data acquisition were functioning properly. Table 4 – Peak and Average Loads
Table 5 – Displacements Measured at Peak Load
The peak load for specimens that included supplementary reinforcement were on average 30% larger than the panels that did not include supplementary reinforcement. Displacements for the specimens without supplementary reinforcement were 70% larger at location D1 and 46% larger at location D2 than the supplementary reinforced specimen displacements. The smaller displacements are a result of the supplementary reinforcement that intersects the breakout plane.
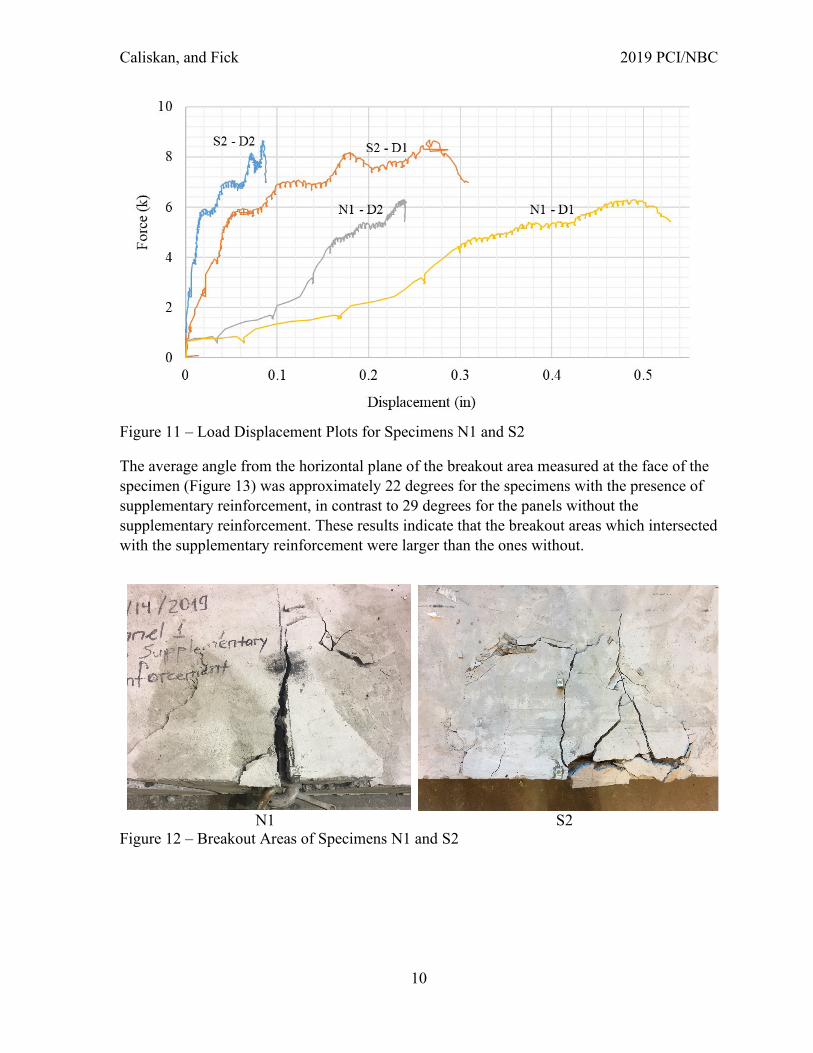
LOAD DISPLACEMENT RESPONSE Representative load-displacement plots for a specimen with (S2) and without supplementary reinforcement (N1) are shown in Figure 11. The difference between displacement D1 and D2 for the specimens with and without supplementary reinforcement was 4.1 mm (0.16 in.) and 6.4 mm (0.25 in.) respectively. The smaller displacement differential for displacement measurement D1 can be attributed to the supplementary reinforcement crossing the breakout area near its location. BREAKOUT AREAS Plan views of the breakout areas for the two specimens plotted in Figure 11 are shown in Figure 12. Elevation views showing the angle of the breakout cones are shown in Figure 13.
Peak Load Average Panel kN kips kN kips
N1 28.0 6.30 28.5 6.40 N3 28.9 6.50 S1 35.6 8.01
37.1 8.33 S2 38.6 8.67 S3 37.0 8.31
D2 D1 Peak Average Peak Average mm in. mm in. mm in. mm in.
N1 12.4 0.49 12.2 0.48 6.1 0.24 4.8 0.19 N3 11.7 0.46 3.6 0.14 S1 9.1 0.36
7.1 0.28 3.8 0.15
3.3 0.13 S2 6.1 0.24 2.0 0.08 S3 6.1 0.24 4.3 0.17
Caliskan, and Fick 2019 PCI/NBC
10
Figure 11 – Load Displacement Plots for Specimens N1 and S2
The average angle from the horizontal plane of the breakout area measured at the face of the specimen (Figure 13) was approximately 22 degrees for the specimens with the presence of supplementary reinforcement, in contrast to 29 degrees for the panels without the supplementary reinforcement. These results indicate that the breakout areas which intersected with the supplementary reinforcement were larger than the ones without.
N1 S2
Figure 12 – Breakout Areas of Specimens N1 and S2

Caliskan, and Fick 2019 PCI/NBC
11
N1 S2
Figure 13 – Elevation Views Showing the Angle of the Breakout Cones
CONCLUSIONS The objective of the experimental study was to identify the influence of supplementary reinforcement on the strength, load displacement response, and breakout area of edge-lifting anchors commonly used to lift thin precast wall panels from the horizontal to vertical position. Six specimens were tested; three included supplementary reinforcement and three did not. Based on the results of the experimental study, the following observations were made:
• Supplementary reinforcement increased the breakout strength by 30%. The maximum displacement measured at the peak load was 70% larger for the specimens without supplementary reinforcement.
• Larger breakout areas were observed for the panels with supplementary reinforcement than those without.
ACKNOWLEDGMENTS The authors would like to acknowledge the support of Missoula Concrete Construction, Missoula, MT, for providing design and construction information in addition to the erection anchors and hardware used in this study. Support from the Civil Engineering Department at Montana State University is also gratefully acknowledged. REFERENCES 1. ACI Committee 318, Building Code Requirements for Structural Concrete (ACI 318-14) and
Commentary. 2014, Farmington Hills, MI: American Concrete Institute. 2. Mackay-Sim, R., Design for edge lifting of precast concrete panels. Proceedings of Concrete
Solutions, 2009. 9: p. 17-19. 3. Sharma, A., et al., Behavior of Anchorages with Supplementary Reinforcement Under
Tension or Shear Forces, in High Tech Concrete: Where Technology and Engineering Meet. 2018, Springer. p. 965-973.
Caliskan, and Fick 2019 PCI/NBC
12
4. Sharma, A., et al., Analytical model for anchorages with supplementary reinforcement under tension or shear forces, in High Tech Concrete: Where Technology and Engineering Meet. 2018, Springer. p. 974-982.
5. CEN/TC 250 (European Committee for Standardization), Eurocode 2: Design of concrete structures - Part 4: Design of fastenings for use in concrete. 2016.
6. ASTM Standard C31, Standard Test Method for Making and Curing Concrete Test Specimens in the Field. 2012, ASTM International, West Conshohocken, PA.
7. ASTM Standard C39, Standard Test Method for Compressive Strength of Cylindrical Concrete Specimens. 2012, ASTM International, West Conshohocken, PA.