russian steel market developments oecd steel committee5)_russian-steel_30nov2015.pdf ·...
TRANSCRIPT

Russian Steel Market DevelopmentsOECD Steel Committee
Focus on the domestic market prompting future capacity optimization
Russian Steel Organization Nikita Vorobyev, NLMK
Paris, France 30 November 2015
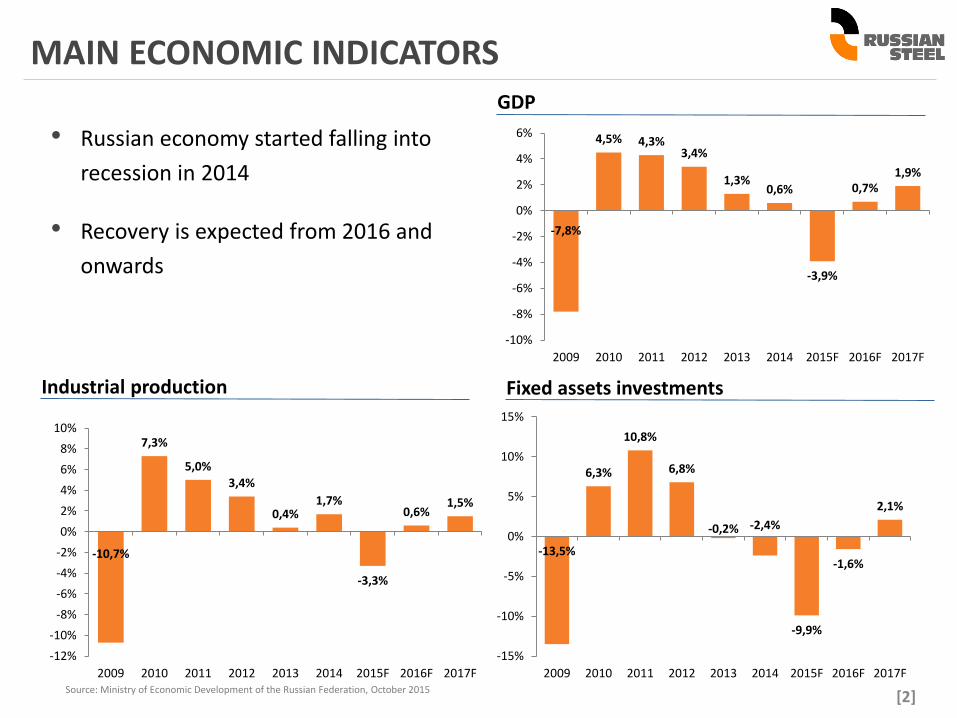
MAIN ECONOMIC INDICATORS
[2]Source: Ministry of Economic Development of the Russian Federation, October 2015
• Russian economy started falling into
recession in 2014
• Recovery is expected from 2016 and
onwards
GDP
Industrial production Fixed assets investments
-7,8%
4,5% 4,3%3,4%
1,3%0,6%
-3,9%
0,7%1,9%
-10%
-8%
-6%
-4%
-2%
0%
2%
4%
6%
2009 2010 2011 2012 2013 2014 2015F 2016F 2017F
-10,7%
7,3%
5,0%
3,4%
0,4%1,7%
-3,3%
0,6%1,5%
-12%
-10%
-8%
-6%
-4%
-2%
0%
2%
4%
6%
8%
10%
2009 2010 2011 2012 2013 2014 2015F 2016F 2017F
-13,5%
6,3%
10,8%
6,8%
-0,2% -2,4%
-9,9%
-1,6%
2,1%
-15%
-10%
-5%
0%
5%
10%
15%
2009 2010 2011 2012 2013 2014 2015F 2016F 2017F
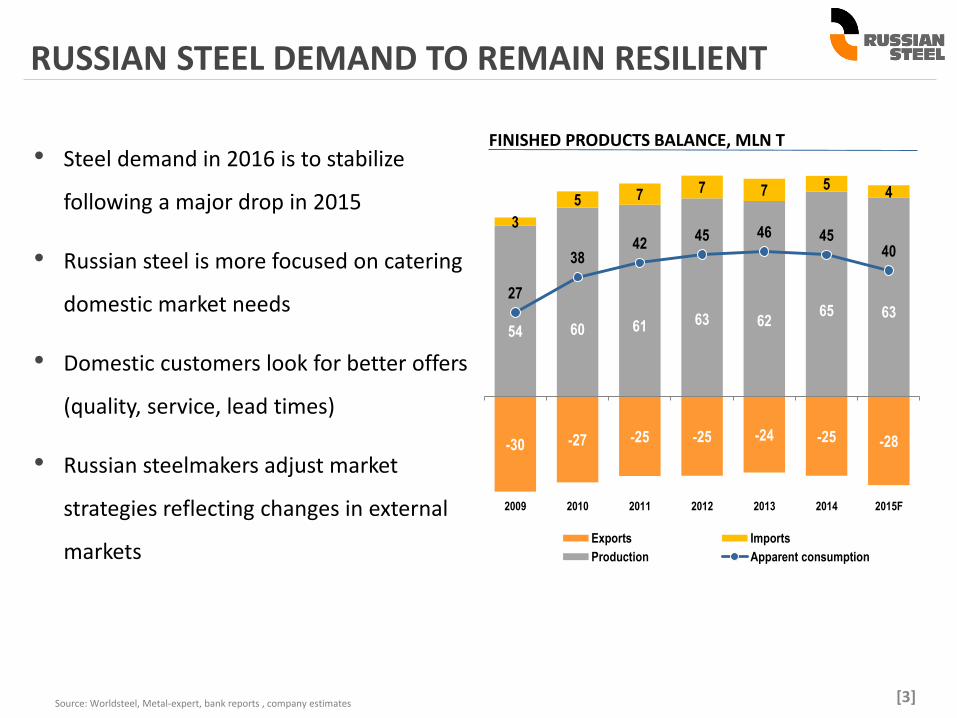
RUSSIAN STEEL DEMAND TO REMAIN RESILIENT
[3]Source: Worldsteel, Metal-expert, bank reports , company estimates
• Steel demand in 2016 is to stabilize
following a major drop in 2015
• Russian steel is more focused on catering
domestic market needs
• Domestic customers look for better offers
(quality, service, lead times)
• Russian steelmakers adjust market
strategies reflecting changes in external
markets
FINISHED PRODUCTS BALANCE, MLN T
54 60 61 63 6265 63
3
5 7 7 7 54
-30 -27 -25 -25 -24 -25 -28
27
3842
45 46 4540
2009 2010 2011 2012 2013 2014 2015F
Exports Imports
Production Apparent consumption
-
100
200
300
400
500
600
700
Jan
Fe
b
Ma
r
Ap
r
Ma
y
Jun
Jul
Au
g
Se
p
Oct
Nov
Dec
Jan
Fe
b
Ma
r
Ap
r
Ma
y
Jun
Jul
Au
g
Se
p
Q1 Q2 Q3 Q4 Q1 Q2 Q3
2014 2015
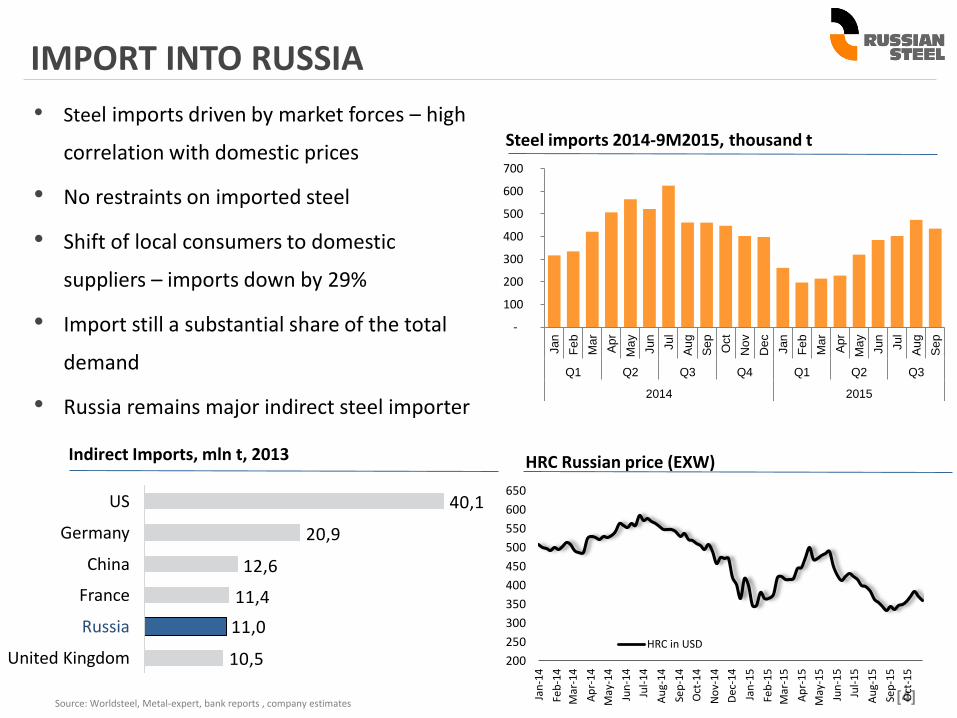
IMPORT INTO RUSSIA
[4]Source: Worldsteel, Metal-expert, bank reports , company estimates
• Steel imports driven by market forces – high
correlation with domestic prices
• No restraints on imported steel
• Shift of local consumers to domestic
suppliers – imports down by 29%
• Import still a substantial share of the total
demand
• Russia remains major indirect steel importer
Steel imports 2014-9M2015, thousand t
200
250
300
350
400
450
500
550
600
650
Jan
-14
Feb
-14
Mar
-14
Ap
r-1
4
May
-14
Jun
-14
Jul-
14
Au
g-1
4
Sep
-14
Oct
-14
No
v-1
4
Dec
-14
Jan
-15
Feb
-15
Mar
-15
Ap
r-1
5
May
-15
Jun
-15
Jul-
15
Au
g-1
5
Sep
-15
Oct
-15
HRC in USD
HRC Russian price (EXW)
10,5
11,0
11,4
12,6
20,9
40,1
France
US
Germany
China
United Kingdom
Russia
Indirect Imports, mln t, 2013

EXPORT CAPABILITIES DETERIORATE
Источник: Russian steel, Metal Bulletin
Export from Russia is set to decline
• Export price pressure (down by 50%
since 2014) due to stiff competition
from China and CIS
• Average costs of production inflated by
tariffs and doubled capital costs
• Industrial inflation boosted
• Demand in key importing regions
declined / shifted to Chinese imports
• Russian exports started to halt (e.g. pig
iron)
[5]
6,4 5,9 5,9 6,6 7,1 6,9
6,0
-
1,0
2,0
3,0
4,0
5,0
6,0
7,0
8,0
Q1 Q2 Q3 Q4 Q1 Q2 Q3
2014 2015
Steel exports 2014-2015, mln t
Steel exports structure, 2014-10M2015
57%
31%
12%
56%
32%
12%
Semis Flat products Long products
2014
10M2015
34 41 42 48 48
911
1822 20
1615
72 159
66 6771 69
2000 2005 2010 2014 2015F
BOF EAF OHF
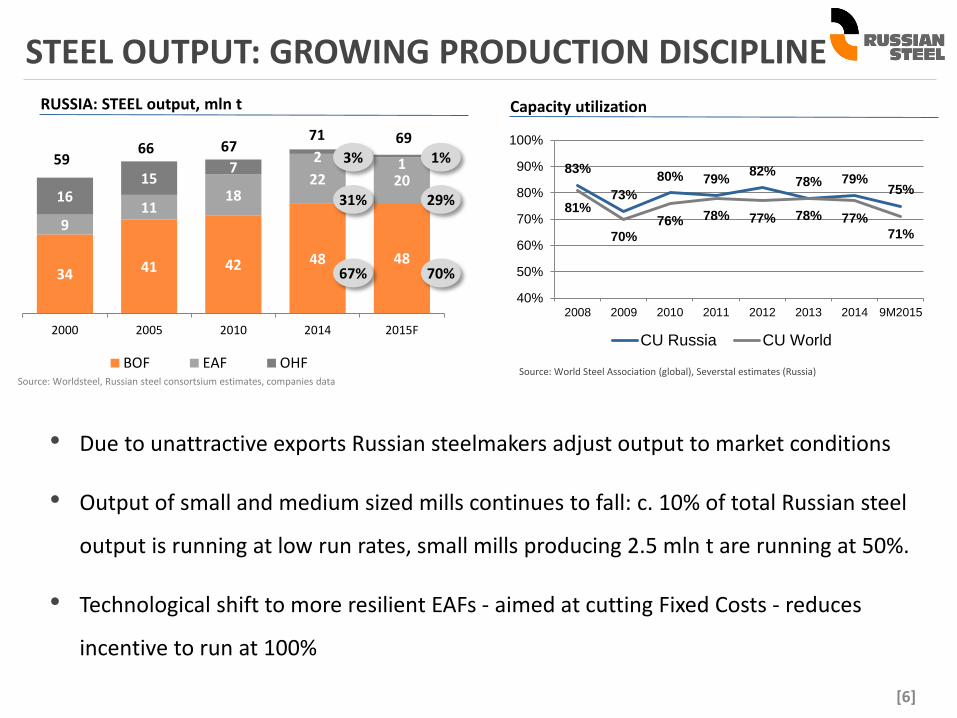
STEEL OUTPUT: GROWING PRODUCTION DISCIPLINE
[6]
3%
31%
67%
Source: Worldsteel, Russian steel consortsium estimates, companies data
• Due to unattractive exports Russian steelmakers adjust output to market conditions
• Output of small and medium sized mills continues to fall: c. 10% of total Russian steel
output is running at low run rates, small mills producing 2.5 mln t are running at 50%.
• Technological shift to more resilient EAFs - aimed at cutting Fixed Costs - reduces
incentive to run at 100%
RUSSIA: STEEL output, mln t Capacity utilization
Source: World Steel Association (global), Severstal estimates (Russia)
1%
29%
70%
83%
73%
80% 79%82%
78% 79%75%
81%
70%
76% 78% 77% 78% 77%
71%
40%
50%
60%
70%
80%
90%
100%
2008 2009 2010 2011 2012 2013 2014 9M2015
CU Russia CU World
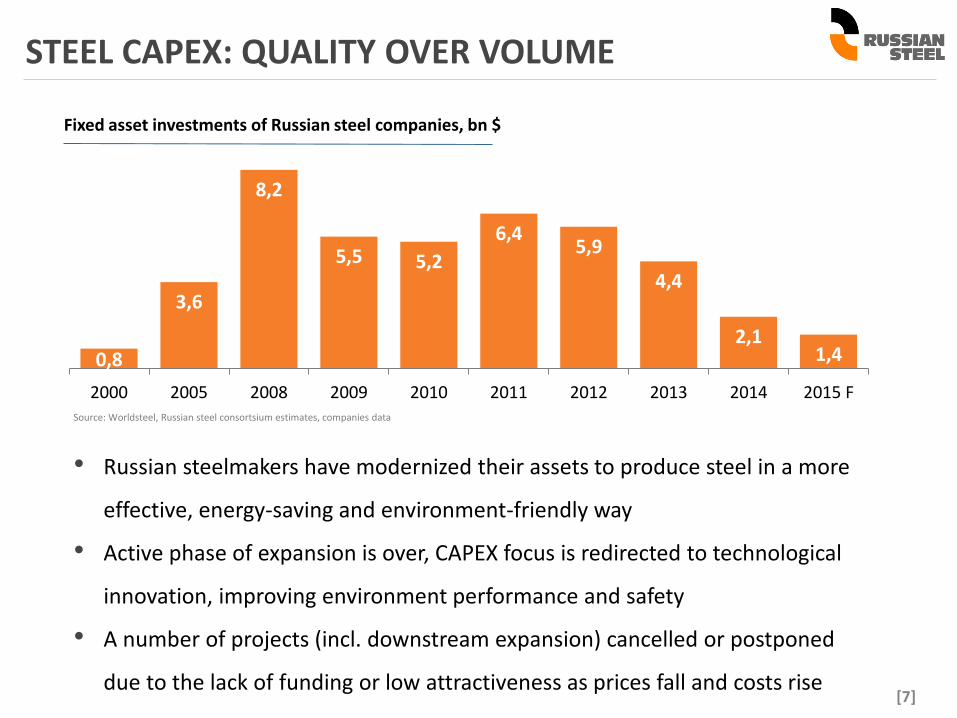
• Russian steelmakers have modernized their assets to produce steel in a more
effective, energy-saving and environment-friendly way
• Active phase of expansion is over, CAPEX focus is redirected to technological
innovation, improving environment performance and safety
• A number of projects (incl. downstream expansion) cancelled or postponed
due to the lack of funding or low attractiveness as prices fall and costs rise
STEEL CAPEX: QUALITY OVER VOLUME
[7]
Source: Worldsteel, Russian steel consortsium estimates, companies data
0,8
3,6
8,2
5,5 5,2
6,45,9
4,4
2,11,4
2000 2005 2008 2009 2010 2011 2012 2013 2014 2015 F
Fixed asset investments of Russian steel companies, bn $
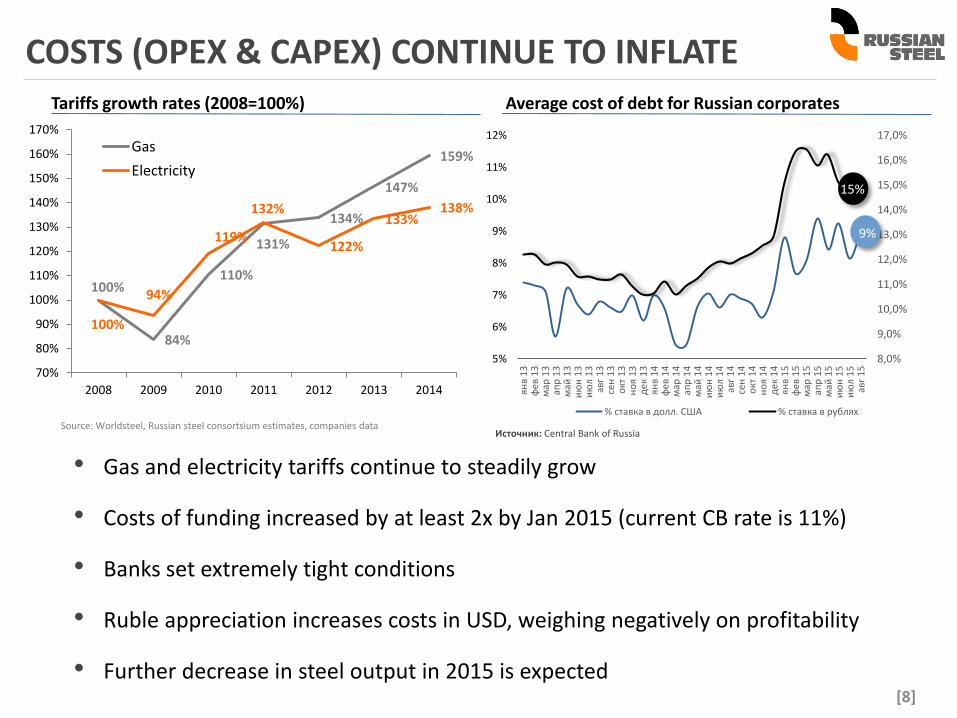
COSTS (OPEX & CAPEX) CONTINUE TO INFLATE
[8]
Source: Worldsteel, Russian steel consortsium estimates, companies data
• Gas and electricity tariffs continue to steadily grow
• Costs of funding increased by at least 2x by Jan 2015 (current CB rate is 11%)
• Banks set extremely tight conditions
• Ruble appreciation increases costs in USD, weighing negatively on profitability
• Further decrease in steel output in 2015 is expected
Average cost of debt for Russian corporates
100%
84%
110%
131%
134%
147%
159%
100%
94%
119%
132%
122%
133%138%
70%
80%
90%
100%
110%
120%
130%
140%
150%
160%
170%
2008 2009 2010 2011 2012 2013 2014
Gas
Electricity
Tariffs growth rates (2008=100%)
8,0%
9,0%
10,0%
11,0%
12,0%
13,0%
14,0%
15,0%
16,0%
17,0%
5%
6%
7%
8%
9%
10%
11%
12%
янв
13
фев
13
мар
13
апр
13
май
13
ию
н 1
3и
юл
13
авг
13
сен
13
окт
13
но
я 1
3д
ек 1
3ян
в 1
4ф
ев 1
4м
ар 1
4ап
р 1
4м
ай 1
4и
юн
14
ию
л 1
4ав
г 1
4се
н 1
4о
кт 1
4н
оя
14
дек
14
янв
15
фев
15
мар
15
апр
15
май
15
ию
н 1
5и
юл
15
авг
15
% ставка в долл. США % ставка в рублях
Источник: Central Bank of Russia
15%
9%
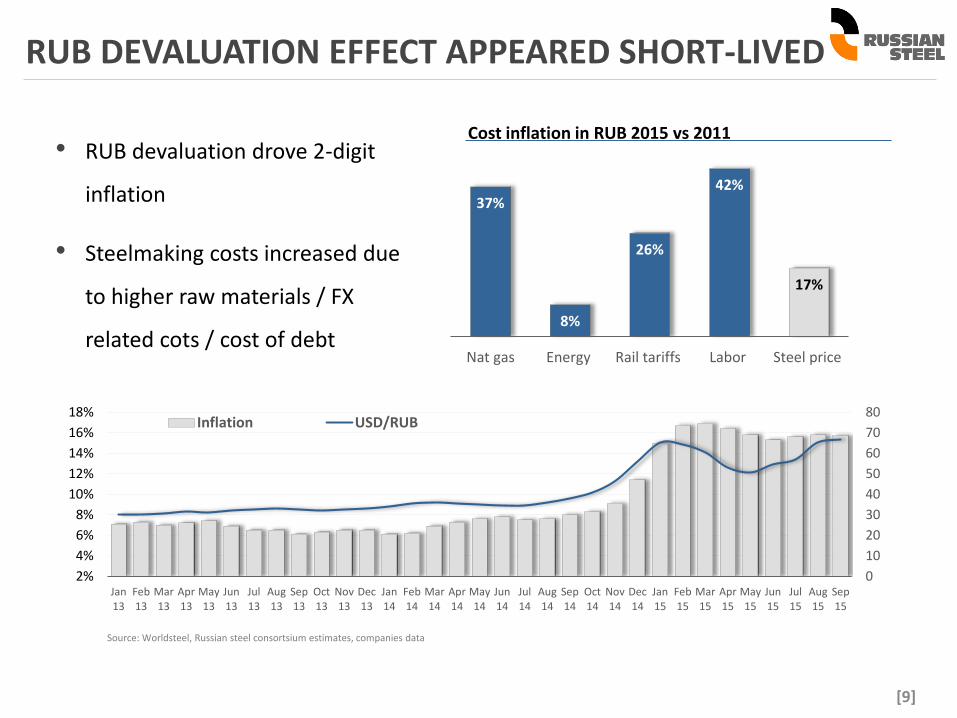
RUB DEVALUATION EFFECT APPEARED SHORT-LIVED
[9]
Source: Worldsteel, Russian steel consortsium estimates, companies data
• RUB devaluation drove 2-digit
inflation
• Steelmaking costs increased due
to higher raw materials / FX
related cots / cost of debt
0
10
20
30
40
50
60
70
80
2%
4%
6%
8%
10%
12%
14%
16%
18%
Jan13
Feb13
Mar13
Apr13
May13
Jun13
Jul13
Aug13
Sep13
Oct13
Nov13
Dec13
Jan14
Feb14
Mar14
Apr14
May14
Jun14
Jul14
Aug14
Sep14
Oct14
Nov14
Dec14
Jan15
Feb15
Mar15
Apr15
May15
Jun15
Jul15
Aug15
Sep15
Inflation USD/RUB
37%
8%
26%
42%
17%
0%
5%
10%
15%
20%
25%
30%
35%
40%
45%
Nat gas Energy Rail tariffs Labor Steel price
Cost inflation in RUB 2015 vs 2011
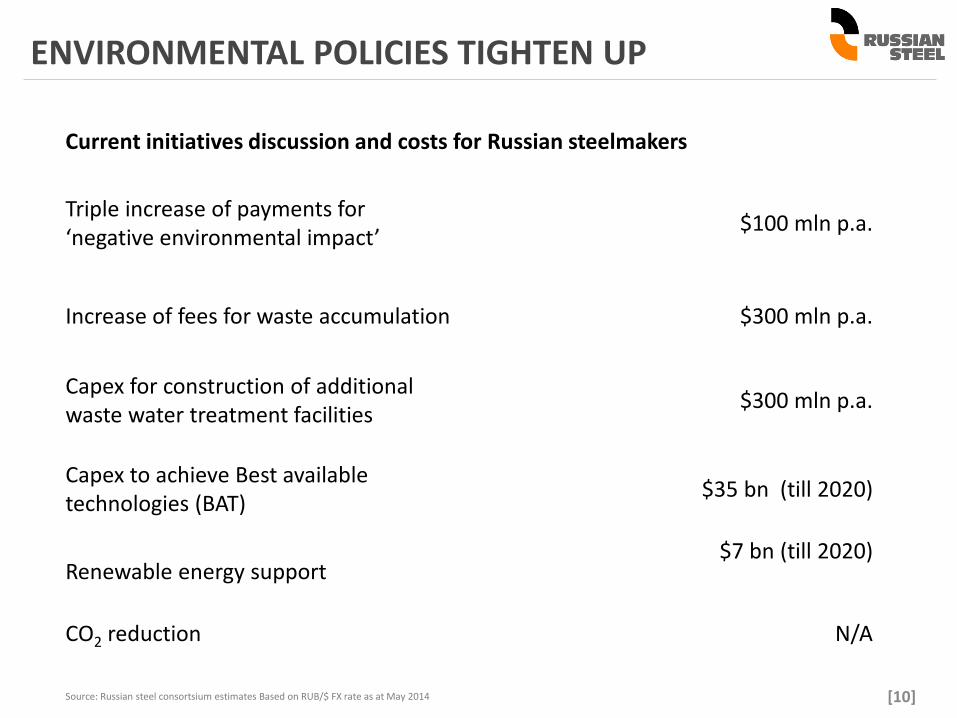
ENVIRONMENTAL POLICIES TIGHTEN UP
[10]Source: Russian steel consortsium estimates Based on RUB/$ FX rate as at May 2014
Current initiatives discussion and costs for Russian steelmakers
Triple increase of payments for ‘negative environmental impact’
$100 mln p.a.
Increase of fees for waste accumulation $300 mln p.a.
Capex for construction of additional waste water treatment facilities
$300 mln p.a.
Capex to achieve Best available technologies (BAT)
$35 bn (till 2020)
Renewable energy support$7 bn (till 2020)
CO2 reduction N/A
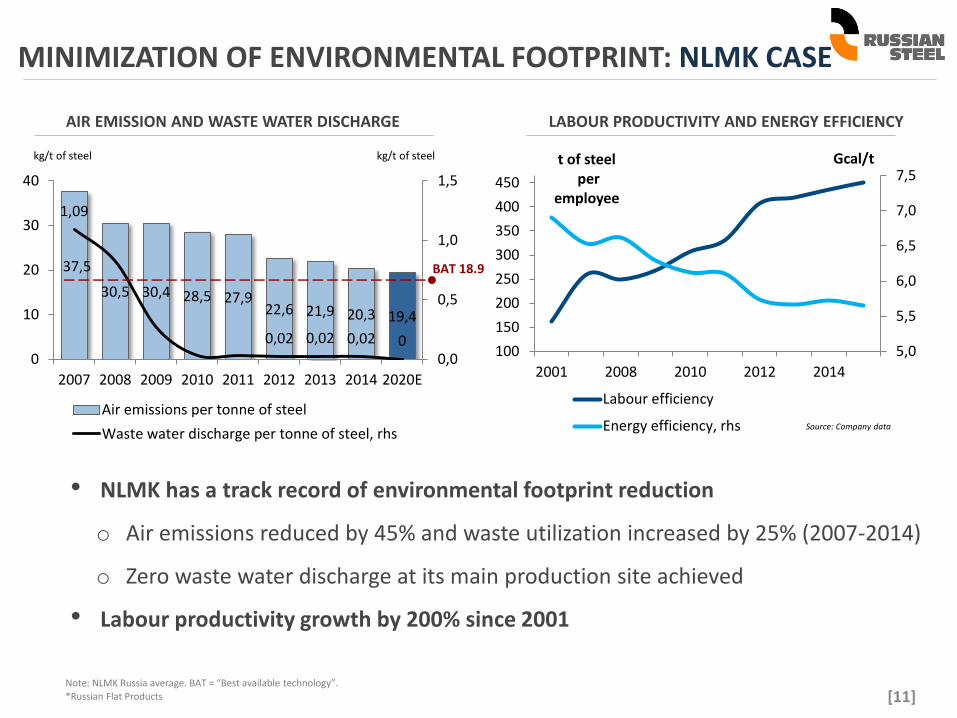
MINIMIZATION OF ENVIRONMENTAL FOOTPRINT: NLMK CASE
[11]
• NLMK has a track record of environmental footprint reduction
o Air emissions reduced by 45% and waste utilization increased by 25% (2007-2014)
o Zero waste water discharge at its main production site achieved
• Labour productivity growth by 200% since 2001
AIR EMISSION AND WASTE WATER DISCHARGE
37,5
30,5 30,4 28,5 27,922,6 21,9 20,3 19,4
1,09
0,02 0,02 0,02 00,0
0,5
1,0
1,5
0
10
20
30
40
2007 2008 2009 2010 2011 2012 2013 2014 2020E
Air emissions per tonne of steel
Waste water discharge per tonne of steel, rhs
Note: NLMK Russia average. BAT = “Best available technology”.
kg/t of steel kg/t of steel
BAT 18.9
*Russian Flat Products
LABOUR PRODUCTIVITY AND ENERGY EFFICIENCY
5,0
5,5
6,0
6,5
7,0
7,5
100
150
200
250
300
350
400
450
2001 2008 2010 2012 2014
Gcal/tt of steelper
employee
Labour efficiency
Energy efficiency, rhs Source: Company data
SUMMARY
[12]
779
• 2015 is challenging for the Russian economy, but stabilization is expected in 2016
• Contraction in machinery and construction sectors will negatively affect domestic
steel consumption
• Russian steel sector used super cycle profits to modernize production and improve
quality. Active phase of expansion is over. Next – shift towards efficiency
• Debt and fiscal pressure as well as unattractive exports lead to shutting down of
least effective capacities
• Ruble devaluation effect was short-lived and translated into cost inflation
• Steelmaking costs in Rub inflated, making the sector more vulnerable to FX swings
• Government policies tighten up, increasing administrative burden and private
expenses on regulation compliance

[13]
779
Thank You!