rutger s for green bui lding
TRANSCRIPT

M
Phone: 7
MAPLEW
A P
732/932-4101
WOOD
POST O
1 x520 gre
Edwar
POLIC
OCCUP
enbuilding.rut
Rutgrd J. Blouste
CE AND
PANCY
IM
tgers.edu Fa
Rutgerers, The Staein School o
Web
COUR
EVALU
MAGE SOURCE: IMA
ax: 732/932-0
rs Center forate Universit of Planning a
33 LivNew Brun
Phone: 732Fa
b: greenbuild
RT BUIL
UATION
AGE UP STUDIO, M
0934
r Green Buity of New Je and Public Pvingston Avnswick, NJ 0
2‐932‐4101, xax: 732‐932‐ding.rutgers
LDING:N
METUCHEN, NJ
1
lding ersey Policy enue 08901
x 520 0934 s.edu
:

Phone: 732/932-4101 x520 greenbuilding.rutgers.edu Fax: 732/932-0934 2
MAPLEWOOD POLICE AND COURT BUILDING: A POST OCCUPANCY EVALUATION
December 2010
IMAGE SOURCE: IMAGE UP STUDIO, METUCHEN, NJ
Prepared by Rutgers Center for Green Building & Associates: Jennifer Senick, Executive Director, Rutgers Center for Green Building Clinton J. Andrews, Director, Rutgers Center for Green Building Maren L. Haus, Research Project Manager, Rutgers Center for Green Building Richard Wener, Environmental Psychologist, Polytechnic Institute of NYU Michael Kornitas, Energy Conservation Manger, Rutgers University Mark Bolen, Graduate Assistant, Rutgers Center for Green Building Pinky Samat, Research Architect, Rutgers Center for Green Building Francis Jordan, Graduate Assistant, Department of Environmental Sciences,
Rutgers University Deborah Plotnik, Program Coordinator, Rutgers Center for Green Building Gavin Kwak, Research Assistant, Polytechnic Institute of New York University
Prepared for: U.S. Green Building Council – NJ Chapter

Phone: 732/932-4101 x520 greenbuilding.rutgers.edu Fax: 732/932-0934 3
TABLE OF CONTENTS
TABLE OF CONTENTS ............................................................................................................................. 3 TABLES, FIGURES, IMAGES .................................................................................................................... 4 EXECUTIVE SUMMARY .......................................................................................................................... 5
OVERVIEW AND SCOPE .................................................................................................................................... 5 KEY FINDINGS ................................................................................................................................................ 6
INTRODUCTION..................................................................................................................................... 7 BACKGROUND ...................................................................................................................................... 8 BUILDING DESCRIPTION ........................................................................................................................ 9
BUILDING OVERVIEW ....................................................................................................................................... 9 BUILDING TEAM ........................................................................................................................................... 10 BUILDING LAYOUT ......................................................................................................................................... 11 GREEN BUILDING STRATEGIES AND TECHNOLOGIES .............................................................................................. 12
What makes this a green building? 12 Site Selection & Planning 14 Construction and Waste Management 14 Landscaping 14 Building Design 14 Building Materials 15 Building Systems 15 Commisioning 15
POST OCCUPANCY EVALUATION (POE) ................................................................................................ 16 GREEN STRATEGY PERFORMANCE .................................................................................................................... 16 GREEN BUILDING AND SECURITY OBJECTIVES ..................................................................................................... 18 BUILDING WATER CONSUMPTION PERFORMANCE ............................................................................................... 19 BUILDING ENERGY CONSUMPTION PERFORMANCE .............................................................................................. 19
Introduction 19 Methodology 20 Results and Discussion 22 Conclusions and Recommendations for Future Research 24
LIFE CYCLE PERFORMANCE ‐ LIFE CYCLE COST (LCC) ANALYSIS .............................................................................. 32 Introduction 32 Methodology 32 Results and Discussion 33 Conclusions 34
OCCUPANCY SATISFACTION & PERFORMANCE – OCCUPANT SURVEY ...................................................................... 38 Introduction 38 Methodology 38 Results and Discussion 41
CONCLUSIONS AND NEXT STEPS .......................................................................................................... 48 APPENDIX A – LEED CREDITS ......................................................................................................................... 49 [INSERT MAPLEWOODPOLICESTNLEEDCREDITS.PDF HERE]APPENDIX B – LANDSCAPING PLANTINGS LIST ..................... 50 APPENDIX B – LANDSCAPING PLANTINGS LIST .................................................................................................... 50
Phone: 732/932-4101 x520 greenbuilding.rutgers.edu Fax: 732/932-0934 4
TABLES, FIGURES, IMAGES
TABLE 1: DIFFERENCES BETWEEN THE DESIGN AND CONVENTIONAL CASES. 21 TABLE 2: NET PRESENT VALUE (NPV) ANALYSIS . 33 FIGURE 1: MONTHLY SOLAR PANEL ENERGY GENERATION 17 FIGURE 2: HEATING DEGREE DAYS 25 FIGURE 3: COOLING DEGREE DAYS 25 FIGURE 4: PEAK ELECTRIC POWER DEMAND 26 FIGURE 5: MONTHLY ELECTRICITY USAGE 26 FIGURE 6: NATURAL GAS USE 27 FIGURE 7: MONTHLY ENERGY COSTS 27 FIGURE 8: ANNUAL HEATING DEGREE DAYS COMPARISON 28 FIGURE 9: ANNUAL COOLING DAYS COMPARISON 28 FIGURE 10: ANNUAL ELECTRICITY USE COMPARISON 29 FIGURE 11: PEAK ELECTRICITY DEMAND COMPARISON 29 FIGURE 12: ANNUAL NATURAL GAS USAGE COMPARISON 30 FIGURE 13: ELECTRICITY INTENSITY COMPARISON 30 FIGURE 14: NATURAL GAS INTENSITY COMPARISON 31 FIGURE 15: ELECTRICITY GENERATION FROM ROOFTOP SOLAR ARRAY 31 FIGURE 16: ANNUAL END‐USE ELECTRICITY CONSUMPTION 35 FIGURE 17: ANNUAL END‐USENATURAL GAS CONSUMPTION 35 FIGURE 18: NET PRESENT VALUE PER SQUARE FOOT RELATIVE TO THE BUDGET CASE 36 FIGURE 19: SENSITIVITY TO ENERGY PRICES OF NPV/SF OF ACTUAL BUILDING RELATIVE TO BUDGET CASE 36 FIGURE 20: SENSITIVITY TO DISCOUNT RATES OF NPV/SF OF ACTUAL BUILDING RELATIVE TO BUDGET CASE 37 FIGURE 21: SENSITIVITY TO BUILDING LIFETIMES OF NPV/SF OF ACTUAL BUILDING RELATIVE TO BUDGET CASE 37 FIGURE 22: YEARS IN ORGANIZATION 39 FIGURE 23: RESPONDETNS' JOBS 39 FIGURE 24: RESPONDENTS' AGES 40 FIGURE 25: RESPONDENTS' GENDERS 40 FIGURE 26: LEVEL OF SATISFACTION WITH BUILDING 43 FIGURE 27: LEVEL OF SATISFACTION WITH BUILDING BY JOB 43 FIGURE 28: SATISFACTION WITH OVERALL DESIGN 44 FIGURE 29: SATISFACTION WITH WORKSPACE BY JOB 44 FIGURE 30: SATISFACTION WITH WORKSPACE PRIVACY BY JOB 45 FIGURE 31: SATISFACTION WITH WORKSPACE DAYLIGHTING 45 FIGURE 32: "HOW OFTEN..." 46 FIGURE 33: "HOW ENVIRONMENTALLY FRIENDLY IS THIS BUILDING?" 46 IMAGE 1: MAPLEWOOD POLICE AND COURT BUILDING EXTERIOR 7 IMAGE 2: SPRINGFIELD AVENUE REDEVELOPMENT PLAN 8 IMAGE 3: AERIAL VIEW OF BUILDING AND SURROUNDING AREA 10 IMAGE 4: INTERIOR OF COURTHOUSE 11 IMAGE 5: ROOFTOP PV ARRAY 11 IMAGE 6: GROUND‐MOUNTED COOLING TOWER 11 IMAGE 7: BUILDING FOYER AND ATRIUM 12 IMAGE 8: GLASS TILES IN FOYER FLOOR ALLOW DAYLIGHT TO PENETRATE INTO BASEMENT 13 IMAGE 9: BASEMENT EXERCISE ROOM WITH DAYLIGHT PROVIDED BY GLASS TILES IN FLOOR ABOVE. 13 IMAGE 10: BUILDING EXTERIOR SHOWING CLERESTORY WINDOWS 15 IMAGE 11: OFFICES WITH SHADES DRAWN 16
Phone: 732/932-4101 x520 greenbuilding.rutgers.edu Fax: 732/932-0934 5
EXECUTIVE SUMMARY
Overview and Scope
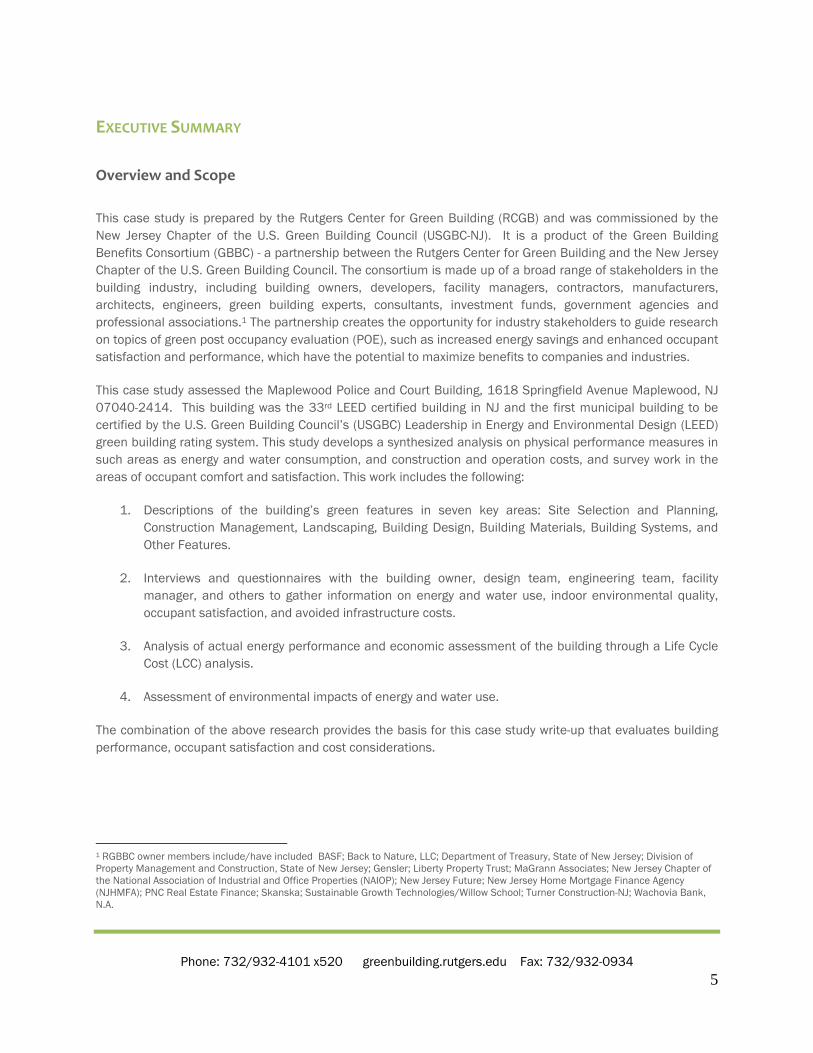
This case study is prepared by the Rutgers Center for Green Building (RCGB) and was commissioned by the New Jersey Chapter of the U.S. Green Building Council (USGBC-NJ). It is a product of the Green Building Benefits Consortium (GBBC) - a partnership between the Rutgers Center for Green Building and the New Jersey Chapter of the U.S. Green Building Council. The consortium is made up of a broad range of stakeholders in the building industry, including building owners, developers, facility managers, contractors, manufacturers, architects, engineers, green building experts, consultants, investment funds, government agencies and professional associations.1 The partnership creates the opportunity for industry stakeholders to guide research on topics of green post occupancy evaluation (POE), such as increased energy savings and enhanced occupant satisfaction and performance, which have the potential to maximize benefits to companies and industries.
This case study assessed the Maplewood Police and Court Building, 1618 Springfield Avenue Maplewood, NJ 07040-2414. This building was the 33rd LEED certified building in NJ and the first municipal building to be certified by the U.S. Green Building Council’s (USGBC) Leadership in Energy and Environmental Design (LEED) green building rating system. This study develops a synthesized analysis on physical performance measures in such areas as energy and water consumption, and construction and operation costs, and survey work in the areas of occupant comfort and satisfaction. This work includes the following:
1. Descriptions of the building’s green features in seven key areas: Site Selection and Planning, Construction Management, Landscaping, Building Design, Building Materials, Building Systems, and Other Features.
2. Interviews and questionnaires with the building owner, design team, engineering team, facility manager, and others to gather information on energy and water use, indoor environmental quality, occupant satisfaction, and avoided infrastructure costs.
3. Analysis of actual energy performance and economic assessment of the building through a Life Cycle Cost (LCC) analysis.
4. Assessment of environmental impacts of energy and water use.
The combination of the above research provides the basis for this case study write-up that evaluates building performance, occupant satisfaction and cost considerations.
1 RGBBC owner members include/have included BASF; Back to Nature, LLC; Department of Treasury, State of New Jersey; Division of Property Management and Construction, State of New Jersey; Gensler; Liberty Property Trust; MaGrann Associates; New Jersey Chapter of the National Association of Industrial and Office Properties (NAIOP); New Jersey Future; New Jersey Home Mortgage Finance Agency (NJHMFA); PNC Real Estate Finance; Skanska; Sustainable Growth Technologies/Willow School; Turner Construction-NJ; Wachovia Bank, N.A.

Phone: 732/932-4101 x520 greenbuilding.rutgers.edu Fax: 732/932-0934 6
Key Findings
The building is largely successful but has yet to reach its full potential for energy savings because of recurring HVAC issues. It generally works well and has been well received. Occupants and visitors are pleased with the building although there are complaints about thermal comfort and adjustability. Passive systems, such as the use of daylighting to reduce the level of use of electric lighting function well, although there have been issues with glare on computer screens that have resulted in building adjustments.
Heating and cooling systems have not been operating at optimal levels even after several years of operation and extended attempts at balancing. Energy use is better than or comparable to other similar buildings (non-LEED certified) in this region. Water use appears to be in the low normal range for a building of this type. The photovoltaic system is working well and performing in line with design projections.
Our Life Cycle Cost analysis shows that the as-built building is slightly less expensive on a life-cycle basis than the conventional, budget alternative as modeled in the LEED submittal. The net economic benefits of the green features in the design are marginal, although this conclusion varies greatly depending on assumptions about future energy prices, discount rates, and building lifetime. Improved HVAC performance resulting from current (Fall 2010) efforts to adjust systems also could significantly improve net economic benefit. Solar Renewable Energy Certificates (SRECs) are a crucial element in the positive economic performance of the building
Green and security requirements do not seem to be in conflict in this building although the potential for differing design needs exists, and in some ways these requirements support each other. The design of this facility has minimized the potential conflict, although more focused attention on these issues could lead to greater synergies for future buildings.
There are several lessons presented by this building:
‐ Daylighting is a valuable and appreciated feature but issues relating to glare that can impact productivity need to be addressed in architecture and interior design;
‐ Decisions to make use of sophisticated HVAC and control systems need to consider the skill/training level, availability and cost of personnel needed to adequately maintain these systems;
‐ There are concerns about the accuracy of energy use predictions that were part of the LEED submittal, which may suggest a broader issue about reliance on such models;
‐ The life-cycle cost effectiveness of a green building is diminished if it suffers from an extended startup period of suboptimal performance; designing for partial and widely variable loads is a challenge of buildings like this and needs to be better addressed;
‐ The financial viability of adding green features is not a given and in some cases depends heavily on financial subsidies, such as SRECs.
Phone: 732/932-4101 x520 greenbuilding.rutgers.edu Fax: 732/932-0934 7
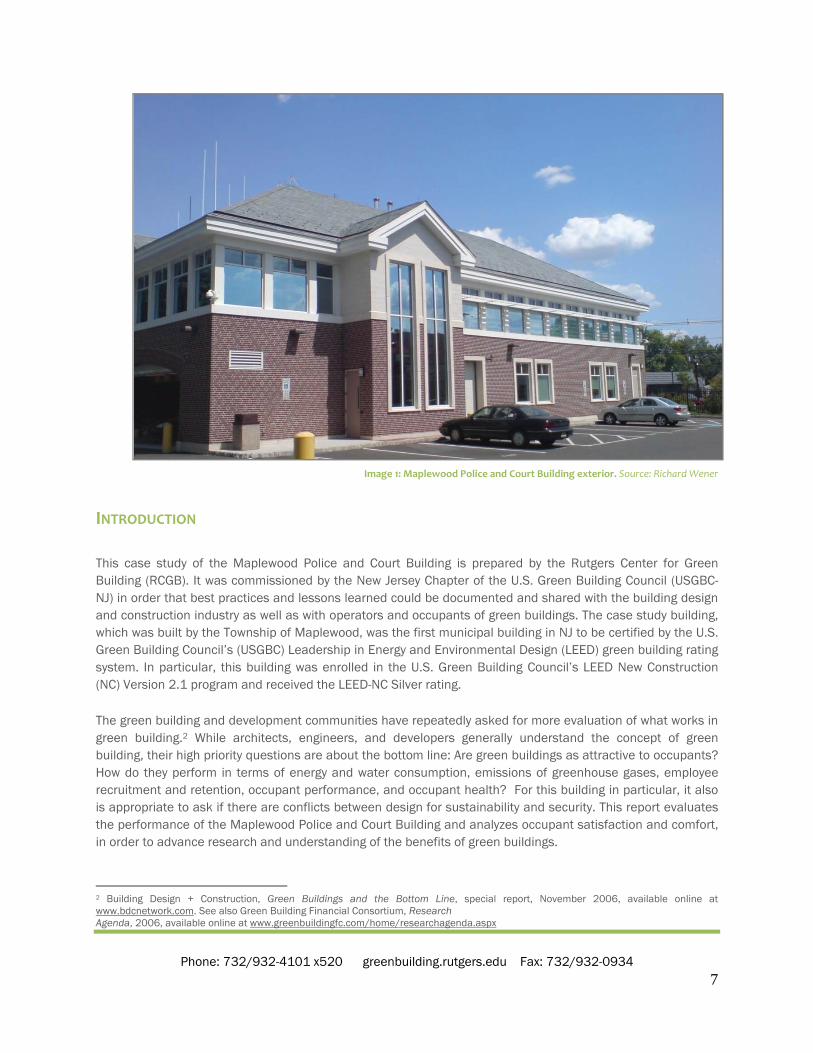
Image 1: Maplewood Police and Court Building exterior. Source: Richard Wener
INTRODUCTION
This case study of the Maplewood Police and Court Building is prepared by the Rutgers Center for Green Building (RCGB). It was commissioned by the New Jersey Chapter of the U.S. Green Building Council (USGBC-NJ) in order that best practices and lessons learned could be documented and shared with the building design and construction industry as well as with operators and occupants of green buildings. The case study building, which was built by the Township of Maplewood, was the first municipal building in NJ to be certified by the U.S. Green Building Council’s (USGBC) Leadership in Energy and Environmental Design (LEED) green building rating system. In particular, this building was enrolled in the U.S. Green Building Council’s LEED New Construction (NC) Version 2.1 program and received the LEED-NC Silver rating.
The green building and development communities have repeatedly asked for more evaluation of what works in green building.2 While architects, engineers, and developers generally understand the concept of green building, their high priority questions are about the bottom line: Are green buildings as attractive to occupants? How do they perform in terms of energy and water consumption, emissions of greenhouse gases, employee recruitment and retention, occupant performance, and occupant health? For this building in particular, it also is appropriate to ask if there are conflicts between design for sustainability and security. This report evaluates the performance of the Maplewood Police and Court Building and analyzes occupant satisfaction and comfort, in order to advance research and understanding of the benefits of green buildings.
2 Building Design + Construction, Green Buildings and the Bottom Line, special report, November 2006, available online at www.bdcnetwork.com. See also Green Building Financial Consortium, Research Agenda, 2006, available online at www.greenbuildingfc.com/home/researchagenda.aspx

Phone: 732/932-4101 x520 greenbuilding.rutgers.edu Fax: 732/932-0934 8
BACKGROUND
The Maplewood Police and Court Building was built as a response to a longstanding need for increased and improved space for police and court functions. The original Maplewood Police and Court Building is on Dunnell Road. It stands among a group of municipal buildings that surround Memorial Park; this design was envisioned in the original Olmstead brothers' plan for a central town green enveloped in municipal services. The original facility was considered state-of-the-art when it opened in 1930 and an addition was constructed in 1985; however, by the end of the 20th century the building did not serve its contemporary functions adequately enough. In addition to persistent flooding problems (due to its location within a flood plain of the east branch of the Rahway River), it was too small for the number of personnel and services in the police and court systems, did not sufficiently accommodate the integration of females into the police force, and had difficulty with the infrastructure necessary for modern telecommunication systems.3
Once the decision was made to build a new facility, location was a primary concern. A site along Springfield Avenue – the commercial district on the eastern end of Maplewood, away from the traditional town center “village” - was chosen to support redevelopment (the new facility is in a designated redevelopment zone) and help alleviate crime in that area.
3 Report for proposed Memorial Park Historic District, Maplewood Historic Commission, 2008.
Image 2: Springfield Avenue Redevelopment Plan. Source: Springfield Avenue Redevelop0ment Plan, Township of Maplewood, New Jersey

Phone: 732/932-4101 x520 greenbuilding.rutgers.edu Fax: 732/932-0934 9
The Goldstein Partnership, an architectural firm with experience designing municipal and public safety buildings, was chosen to design the facility. The original discussions between township officials and the designer did not require a LEED-certified facility. That decision came later when it became clear that initial design plans approximated LEED criteria sufficiently enough to obtain LEED certification with only minor additional design features. Seeking green building status also fit the stated goals of township officials to make Maplewood an example of a green community. Maplewood was a 2008 EPA Environmental Quality Award Winner, a partner in the Cities for Climate Protection campaign of ICLEI Local Governments for Sustainability, and in 2009 was named winner of the Sustainable New Jersey™ award for leadership.
BUILDING DESCRIPTION
The primary goal of this facility was to provide increased and better quality space for police and court functions, including infrastructure to support advanced telecommunications technology. In addition, the space was intended to provide facilities for public meetings as well as a presence on Springfield Avenue to support redevelopment in that area of town.
The facility program contained a number of elements including a public foyer with public meeting rooms, secure offices, a courtroom and offices for related court functions, conference rooms, jail cells, an exercise room, locker and shower rooms, an indoor shooting range, and a police command center with computers and advanced telecommunications equipment.
The 5,000 square feet of the 3rd floor of the building was designed as overflow or future growth space. It currently is vacant and therefore is conditioned minimally. Since the court is in session only one night a week and most of the uniformed police officers spend the bulk of their shifts on patrol, the rest of the building normally has a relatively low occupancy level (often only 20 to 30 people are in the building). However, the building is designed to accommodate regular periods of high use (more than 200 people) when court is in session and police shifts change.
The final construction cost of the Maplewood Police and Court Building was $16,258,000. Bonds sold by the Township of Maplewood primarily financed these costs. $1,250,000 was provided by State of New Jersey grants, including a rebate for the photovoltaic panels.
Building Overview
Location: 1618 Springfield Avenue, Maplewood, NJ 07040
Building Type: Governmental building, including court, police, detention, office, public meeting areas and other facilities
New Construction Four-story building, including basement
Program: Use as police and court center
Total Cost (land purchase excluded): $16.2m
Area / Building Footprint: 41,850 SF / 12,950 GSF
Phone: 732/932-4101 x520 greenbuilding.rutgers.edu Fax: 732/932-0934 10
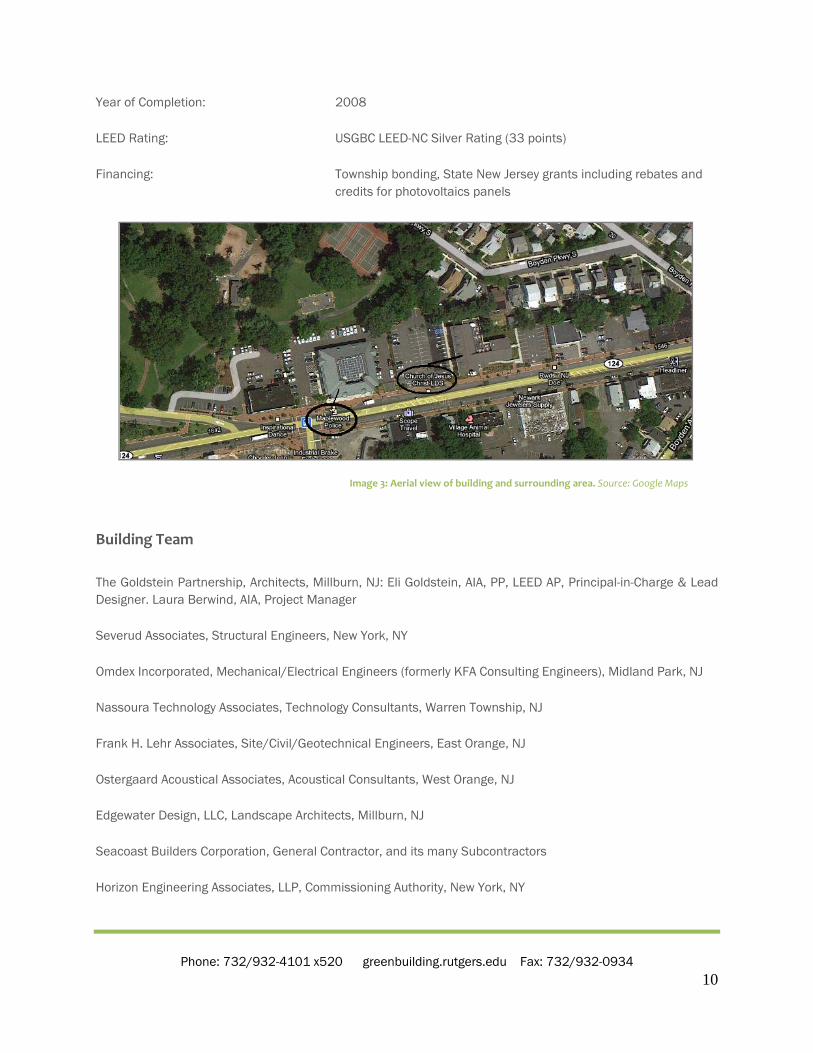
Year of Completion: 2008
LEED Rating: USGBC LEED-NC Silver Rating (33 points)
Financing: Township bonding, State New Jersey grants including rebates and credits for photovoltaics panels
Building Team
The Goldstein Partnership, Architects, Millburn, NJ: Eli Goldstein, AIA, PP, LEED AP, Principal-in-Charge & Lead Designer. Laura Berwind, AIA, Project Manager
Severud Associates, Structural Engineers, New York, NY
Omdex Incorporated, Mechanical/Electrical Engineers (formerly KFA Consulting Engineers), Midland Park, NJ
Nassoura Technology Associates, Technology Consultants, Warren Township, NJ
Frank H. Lehr Associates, Site/Civil/Geotechnical Engineers, East Orange, NJ
Ostergaard Acoustical Associates, Acoustical Consultants, West Orange, NJ
Edgewater Design, LLC, Landscape Architects, Millburn, NJ
Seacoast Builders Corporation, General Contractor, and its many Subcontractors
Horizon Engineering Associates, LLP, Commissioning Authority, New York, NY
Image 3: Aerial view of building and surrounding area. Source: Google Maps
Phone: 732/932-4101 x520 greenbuilding.rutgers.edu Fax: 732/932-0934 11
Building Layout
The new Maplewood Police and Court Building has a symmetrical façade that faces onto the busy commercial street of Springfield Avenue. The eastern end of the site abuts the large parking lot of a new Mormon Church. Through an agreement with the town, visitors to the station can use this lot on weekdays saving the need to create additional surface parking. The north end of the site overlooks Maplecrest Park, providing views to a verdant exterior on that side of the building and adding additional security for park users.
The facility consists of a basement and three stories. The basement includes holding cells, equipment, a shooting range, locker room, the primary mechanical and electrical equipment rooms, several large storage rooms, and exercise room for staff. In order to meet indoor air quality standards (which have caused many shooting ranges in the region to shut down), the air quality issue is addressed by providing ventilation with high levels of air exchange in the shooting range (9600 cfm).
The first floor has two conference rooms that are available for public meetings, a courtroom and court facilities, and 9-bay garage and controlled entry to the secure section of the building which contains the command center and several meeting rooms and offices.
The second floor contains the training room, most police offices, the police conference room, two public meeting rooms, and a small break room. The third floor is set as space for future expansion and currently is vacant. The roof holds the photovoltaic array and the air handling units, including their air intakes.
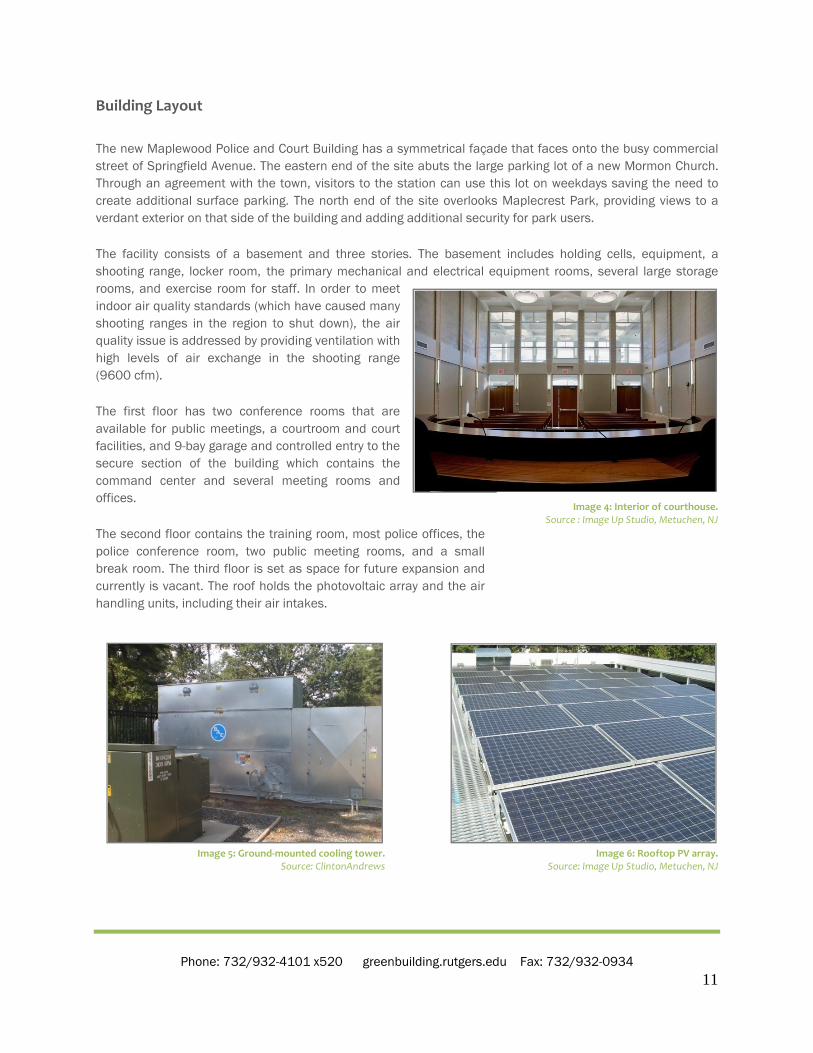
Image 4: Interior of courthouse.Source : Image Up Studio, Metuchen, NJ
Image 6: Rooftop PV array.Source: Image Up Studio, Metuchen, NJ
Image 5: Ground‐mounted cooling tower.Source: ClintonAndrews

Phone: 732/932-4101 x520 greenbuilding.rutgers.edu Fax: 732/932-0934 12
Green Building Strategies and Technologies
What makes this a green building?
The Maplewood Police and Court Building was registered and subsequently certified under LEED-NC 2.1, achieving 33 points (see Appendix A) and earning a Silver rating. It received Sustainable Sites credits for its infill site selection, access to public transportation, bike racks and changing rooms, and storm water management. It earned Water Efficiency credits for water-efficient landscaping and efficient plumbing fixtures. It earned Energy & Atmosphere points for energy-efficient lights and HVAC, a solar photovoltaic array, green power purchases, additional commissioning, and use of non-ozone depleting refrigerants. It earned Materials & Resources credits for diverting construction waste from the landfill, specifying materials with a high recycled content, and buying locally. Indoor Environmental Quality credits included carbon dioxide monitoring and control, use of low-emitting materials, and extensive daylighting and views.
Image 7: Building foyer and atrium. Source: Image Up Studio, Metuchen, NJ
Phone: 732/932-4101 x520 greenbuilding.rutgers.edu Fax: 732/932-0934 13
Daylighting design perhaps is the most noticeable green feature. The foyer includes an atrium brightly lit by first-and second-floor windows. The floor of the foyer includes a section made of glass block to allow daylight into the basement exercise room below. Transparent upper walls at one end of the courtroom allow daylight from the atrium to penetrate deep into the sizable interior space. Exterior offices and conference rooms enjoy large windows equipped with adjustable shades, and feature upper windows that use more highly transparent glass than the eye-level windows to reduce glare and allow deeper penetration of daylight. A single row of windows surrounds the entire second floor, allowing an abundance of natural light into the offices, conference rooms, and main lobby. These windows feature exterior light shelves to reduce glare. The third floor has clerestory windows for natural light. Stairwells also have windows, providing light and visibility for safety. Electrical lights are equipped with daylight sensors.
The solar photovoltaic (PV) array is another major green feature; however, because it is located on the roof it is not visible to casual observers. To help make the use of this technology visible to the public, there is a live display in the front lobby of the building that reports in real time how much electricity the PV system is generating.
The basement-level shooting range has a high-volume ventilation system for removal of smoke, gun powder and particulate matter during use. This 100% outside air system provides ventilation and heating, but no cooling. To recapture heat, there is a heat reclaim system consisting of a cooling coil in the exhaust duct that is connected by a pumped water loop to a heating coil in the supply air duct.
Temperature control is maintained by supplying varying amounts of heated or cooled air through variable air volume (VAV) boxes. VAV boxes serving rooms with wide hour-to-hour variations in occupancy (courtroom, conference rooms) rely on carbon dioxide (CO2) sensors as well as temperature sensors to control the rate of air flow. This should save energy by reducing airflows when fewer people are present.
Building air is highly filtered. The rooftop air handling units include two-stage filtration systems. The building management system alerts the building manager when the filters need changing. One-gallon-flush toilets, low-flush urinals, low-flow showerheads, and sensor-activated lavatories were installed to reduce use of potable water.
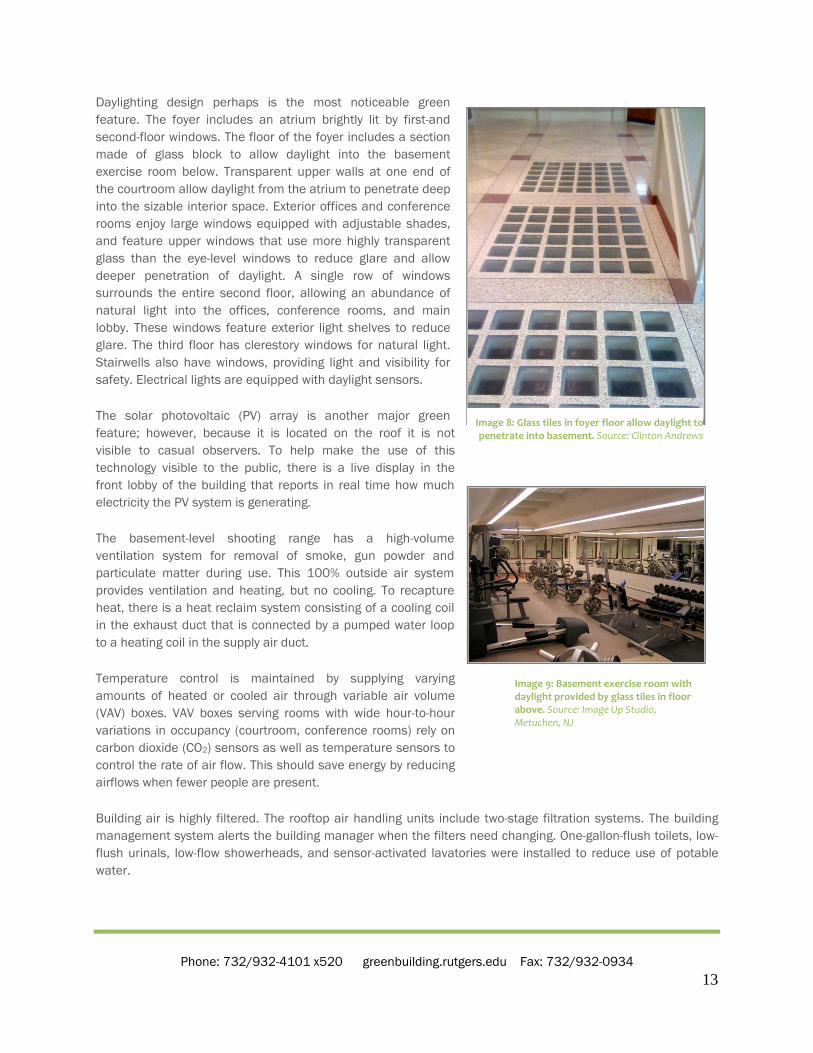
Image 8: Glass tiles in foyer floor allow daylight topenetrate into basement. Source: Clinton Andrews
Image 9: Basement exercise room with daylight provided by glass tiles in floor above. Source: Image Up Studio, Metuchen, NJ

Phone: 732/932-4101 x520 greenbuilding.rutgers.edu Fax: 732/932-0934 14
Site Selection & Planning
Sustainable site planning requires a holistic approach that aims to reuse and restore existing site systems via the adoption of ecologically based strategies. The Maplewood Police and Court Building site is approximately 1.5 miles from the Maplewood NJ Transit Train Station which features frequent trains to Hoboken and New York Penn Station; a jitney service provides bus access to and from the station during morning and evening weekday rush hours. There are nearby NJ Transit bus stops for buses that run along Springfield Avenue east to Irvington and Newark and west towards Millburn. The station has a public bike rack space for 10 bikes. The site plan provided a reduced number of new surface parking spaces through the shared parking arrangement with the neighboring church. A smaller separate lot within a secure fence is provided for staff.
Construction and Waste Management
For the building construction, 20% of the materials were sourced and manufactured in Vermont and Pennsylvania. The steel was produced locally in New Jersey. Under the supervision of the contractor, a waste management plan was implemented during construction. This plan diverted 75% of the construction waste material from landfill through reuse or recycling, earning 2 LEED credits. Materials used with recycled content included recycled rubber floor tiles in the fitness area.
Landscaping
Due to its location in a compact urban site, there is a relatively small amount of landscaping. The vegetation used is indigenous to the area, comprised of groundcovers, shrubs and trees that would require little to no watering nor pesticides and fertilizers. The fact that the plants will only need to be watered after they are established, and that there will be no need for automatic sprinklers, translates into energy and water conservation for the project. (see Appendix B for the plantings chart).
Building Design
The building faces south onto Springfield Avenue. Offices on the north side, including the main conference room, have a view overlooking Maplecrest Park, which not only offers attractive green vistas for those inside the building but also provides added security for park users. This steel-framed brick-faced building includes three floors above grade and one below. Its 114 ft x 111 ft footprint totals 41,850 square feet of conditioned space, broken down as follows:
Basement: 12,950 GSF 1st Floor: 12,950 GSF 2nd Floor: 10,950 GSF (less than the 1st floor due to floor openings for courtroom and lobby) 3rd Floor (unfinished): 5,000 GSF

Phone: 732/932-4101 x520 greenbuilding.rutgers.edu Fax: 732/932-0934 15
The police building is constructed of red brick with white cast-stone trim. It features a broad round-arched central entranceway trimmed with cast stone. The red brick, archways, and Flemish detail were chosen for
similarity to other Maplewood municipal buildings. Clerestory windows (faced with a brise-soleil) form a ribbon around the building just under the cornice. The roof consists of a series of hipped sections with two small polygonal dormers near the front. The design intended for the building to be consistent with the 1920s historical revival style of other township buildings.
Building Materials
The building uses steel-frame construction. Eight-inch steel stud walls are filled with 8” fiberglass insulation
blankets. The insulation value for the walls is R-21 with a U-factor of 0.097 (R-13, U-factor = 0.124 was required by ASHRAE-90.1-1999). The roof insulation has an R-30 value with a U-Factor of 0.034 (compared to ASHRAE-90.1-1999 minimum R-15, U-factor 0.063).
The building uses double-pane solar control low-e glazing with a U-value of 0.27 to 0.29 (ASHRAE 90.1 U = 0.57). The solar heat gain coefficient (SHGC) ranges from 0.24 for vision glass and 0.38 for daylighting glass (compared to 0.39 allowed by ASHRAE 90.1).
Building Systems
The building is heated by natural gas-fired boilers that deliver hot water to coils in rooftop air handling units and a variable air-volume (VAV) air distribution system. The cooling plant includes a wet cooling tower to discharge heat outside the building, a condensing water loop connecting the cooling tower to two multi-stage reciprocating chillers, and a chilled water piping system that connects the chillers to cooling coils in the rooftop air handling units.
The boilers are both modulating (each from 100% to 20% in sequence) and the two two-stage chillers were designed to come on in a total of four stages so that overall output can be scaled according to need. The cooling plant has a total cooling capacity of 100 tons (400 sq. ft./ton) for the purpose of reliability. It is programmed to run variable loads from 0 to 100%.
Commisioning
Both initial and enhanced commissioning were conducted at the Maplewood Police and Court Building. Commissioning involves reviewing design documents, performing field visits to the building, operating building systems in their various modes, and monitoring the resulting performance of the building. Initial commissioning is intended to confirm that building systems are performing as designed. Following operator reports of mixed performance for the heating and cooling systems, enhanced commissioning was undertaken to see if performance could be improved. Continued efforts to fine-tune the building are clearly warranted.
Image 10: Building exterior showing clerestory windows. Source: Image Up Studio, Metuchen, NJ
POST OC
This studyenvironmeCollectivelthese elemextent to wto inform fthe objectoccupant
Green St
The dayligthe daytimHowever, w
The solar system asamounts oannually.
The shootthat extracsound but
Figure 1: M
Phone: 7
CCUPANCY E
y evaluates thental and ecy, this researc
ments. POE of which these afuture design tives and out– user and op
trategy Perf
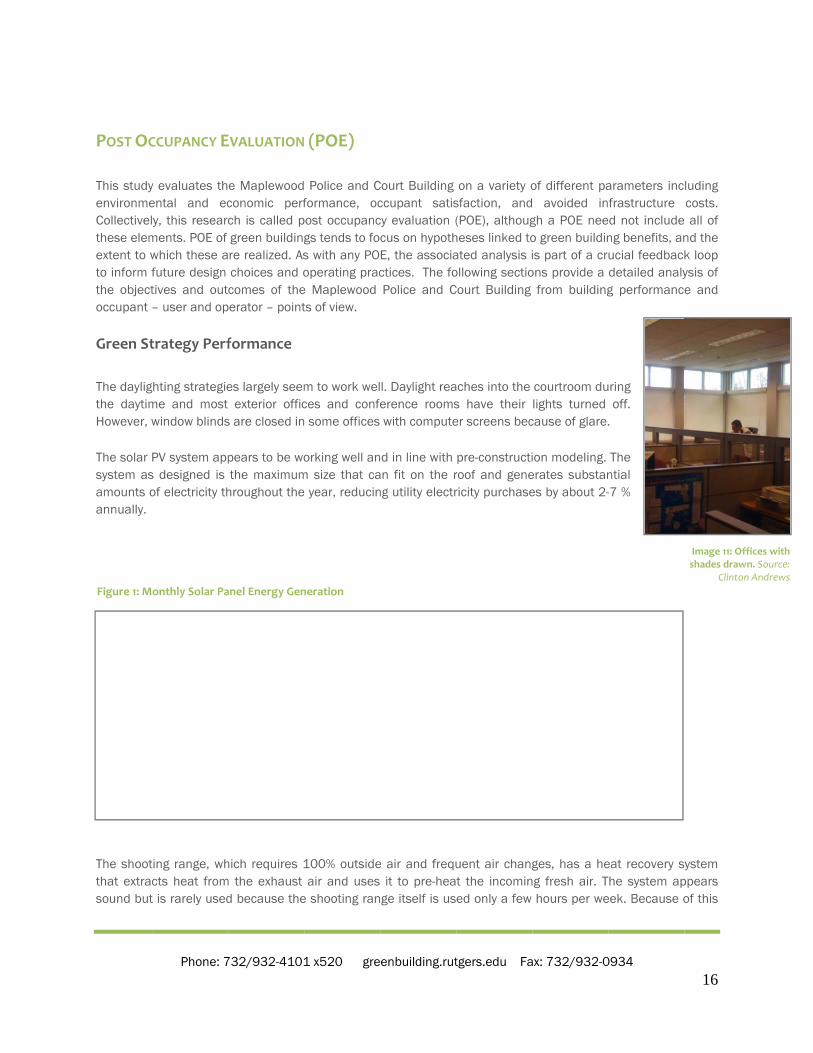
ghting strategieme and most window blinds
PV system apps designed is of electricity th
ting range, whcts heat fromt is rarely used
onthly Solar Pa
732/932-4101
EVALUATION
e Maplewoodconomic perfch is called p green buildingre realized. As choices and ocomes of the
perator – point
formance
es largely seem exterior offic
s are closed in
pears to be wothe maximum
hroughout the
hich requires 1m the exhaust
d because the
anel Energy Gen
1 x520 gre
(POE)
Police and Cformance, oc
post occupancgs tends to fos with any POoperating prac
e Maplewood ts of view.
m to work welces and confe some offices
orking well anm size that cae year, reducin
100% outside air and uses e shooting ran
neration
enbuilding.rut
Court Building ccupant satiscy evaluation (cus on hypothE, the associactices. The foPolice and C
l. Daylight reaerence rooms with compute
d in line with an fit on the rng utility electr
e air and frequ it to pre-heage itself is us
tgers.edu Fa
on a variety osfaction, and(POE), althoug
heses linked toated analysis iollowing sectioCourt Building
aches into the s have their er screens bec
pre-constructiroof and genericity purchase
uent air changt the incomined only a few
ax: 732/932-0
of different pa avoided in
gh a POE neeo green buildinis part of a cr
ons provide a from building
courtroom dulights turned
cause of glare.
ion modeling. erates substanes by about 2-
ges, has a heng fresh air. T hours per we
0934
arameters incfrastructure d not includeng benefits, anucial feedbackdetailed analyg performanc
uring off. .
The ntial -7 %
eat recovery she system ap
eek. Because o
16
luding costs. all of nd the k loop ysis of e and
ystem ppears of this
Image 11: Officeshades drawn. S
Clinton An
es withSource: ndrews

Phone: 732/932-4101 x520 greenbuilding.rutgers.edu Fax: 732/932-0934 17
infrequent use the heat recovery system will take a long time to pay off. The town intends to recover costs by renting out use of the range to other jurisdictions, but so far no clients have been found.
The CO2 sensors in the courtroom and conference rooms appear to function well based on multiple visits to the building, the building manager does not report any “stuffiness” complaints in these rooms. However, the architect suspects that the system is not responding properly to the sensor readings, resulting in substantially more fresh air exchange than called for by occupant load.
The air filtration system seems to work well, as does the notification feature that alerts the building manager to replace filters.
There are several issues affecting the startup period of this building that are worth mentioning. These are not related to the green elements per se, but they may affect the building’s overall performance along key sustainability metrics such as energy use per square foot. Key observations follow:
There appears to be a cycling problem with the chilled water system4. Chilled water is supplied by two two-stage reciprocating chillers cooled by a wet cooling tower located in the parking lot. The four-stage design accomplishes two things, first, it allows efficient part-load operation, and second, it provides redundant, backup capacity for cooling the police station, which is a 24/7 activity. The building management system (BMS) shows that most of the time just a single stage of one chiller needs to run to satisfy the cooling load, confirming the value of the multi-stage technology.
However, that single stage cycles on and off quite frequently, and the temperature rise across the cooling coils is smaller than they were designed for, leading the control system to throttle down the amount of chilled water going to the cooling coils and open a bypass valve to shunt the excess chilled water back to the chiller. Some possible reasons for the cycling problem include operational decisions, the low capacity factor of the building (i.e. the demand for cooling fluctuates widely between low occupancy for most hours and large crowds during a few hours), the third floor of the building is currently unoccupied and uncooled, the server room in the operations center might once have been designated to be air conditioned from the central system (it instead has its own dedicated AC system), or the building envelope is tighter than expected so that the cooling load is lower than planned. The minimum time for a cycle for the chiller is three minutes to either turn on or off; this is set by the manufacturer to prevent rapid cycling to burn out the relays in the system. The BMS shows that the chiller is often cycling exactly at this six-minute rate. The owner should undertake further efforts to fine-tune this system.
It is worth noting that even with this problem causing inefficiencies in use of the chiller (and similar issues with the boiler that were addressed in the summer of 2009), the analysis of energy bills below, particularly for electrical usage, suggest that electricity use still was at or below predicted levels for most of the life of the building to date, and natural gas use is in line with similar buildings in this geographic region.
The control system is divided into three parts provided by three vendors: major equipment auto-controls are from the manufacturer of the mechanical equipment; some local controls within the boiler room are provided by another vendor; and the building management system came from a third vendor. Either these systems are not fully interoperable or the building management system is not performing properly.
4 A detailed independent engineering study and re-commissioning of HVAC systems was underway at the time this report was completed. These comments do not attempt to anticipate the results of that more detailed effort.

Phone: 732/932-4101 x520 greenbuilding.rutgers.edu Fax: 732/932-0934 18
Domestic hot water for hand-washing and showers comes from one of the boilers rather than a dedicated water heater. Thus, one of the boilers has to run all summer. It is possible that a dedicated water heater might save money and reduce greenhouse gas emissions. The current configuration is the result of modeling during the design phase, which rejected use of a separate domestic hot water boiler.
The cooling tower, located in the parking lot because of the expanse of solar collectors on the roof, is positioned to be as far as possible from neighboring buildings because of the noise it generates. Its current position, however, is underneath several oak trees, and leaves and twigs from these trees get entrained into the water that circulates between the chillers and cooling tower, thereby causing clogging problems. The building manager has added a screen on the blower intake and plans to add a cap to mitigate this problem.
Green Building and Security Objectives
Do the green and security objectives of the building program conflict with or complement one another? The best way to answer to this question is on a feature-by-feature basis. Some conflict, others are complementary.
Solar PV array: The PV array could provide a small measure of energy self-sufficiency to the building while also reducing greenhouse gas emissions and local air pollution. However, such a secure arrangement would require circuitry and battery storage to allow the output of the PV array to be dedicated to the police operations center in case of an emergency that might cause both the electric grid and the building’s emergency generator to fail. Nevertheless, the PV array would only be able to supply a small fraction of the control room's power needs..
Air filtration: The two-stage filtration of air hinders the infiltration of not only regular pollutants but also some types of airborne chemical and biological threats. Additionally, by locating the fresh air intakes on the roof, the building avoids ground-level contaminants such as automobile exhaust while also making it much more difficult to purposefully introduce noxious substances into the HVAC system. It may be worthwhile for emergency planning purposes to examine the efficacy of the current filters in removing specific types of chemical and biological threats.
Daylighting: The many windows provide access to views, which increase occupant satisfaction and allow surveillance of nearby areas and promote both green and security objectives. The high glazing percentage may make the building more vulnerable to a concerted attack, although this threat is minimized by the strategic locations of windows and the placement of highly secure areas (operations center, jail cells) in interior spaces. The windows help reduce the demand for electricity for lighting purposes but simultaneously increase heating and cooling loads, which increase the demand for electricity and natural gas and detract from both the green and security objectives. Finally, the windows allow much of the building to remain usable during daylight hours even if there is an electricity outage.
The net effect is arguable: windows are both green and non-green, secure and not secure. Their aesthetic and psychological benefits are large, and for many people these trump the economic considerations. Security considerations can be managed with careful design.
Energy and water efficiency: The green and security aspects of efficient utilities are clearly complementary. They reduce environmental impacts and reduce the level of service required for minimum secure functioning of the building.
Phone: 732/932-4101 x520 greenbuilding.rutgers.edu Fax: 732/932-0934 19
Operations center: The 24/7 schedule and energy-intensive activities that take place in the operations center make it an area where green and security objectives conflict. It becomes a security objective that the green building’s program must accommodate.
Shooting range: Much like the operations center, the shooting range is a difficult programmatic element to include in a green building. The heat reclaim system is an innovative solution, but it is unlikely to be cost-effective.
Building Water Consumption Performance
Water bills for the Maplewood Police Department and Court House provide a snapshot of water use. Billed monthly usage varies both due to changes in actual water usage, and because of inconsistencies in the timing of meter reading. However, the 334,000 total gallons consumed over the 322 days give us a basis for estimating average daily usage at 1037 gallons per day.
The literature usually reports water consumption on a normalized, per square foot or per capita basis. Therefore, it is necessary to divide the average daily usage by the floor area or the average number of employees. Dziegielewski et al (2000) summarize field studies of 74 office buildings and find that water usage including landscaping ranges from 0 - 3 GPD per square foot of building area (mean is 0.2), or, normalized by employee, it ranges from 4 - 3636 GPD per employee (mean is 137). In a closer look at five office buildings, Dziegielewski et al (2000) are able to exclude landscaping uses and report only indoor uses. This analysis yields a range of water use of 0.03 - 0.16 GPD per square foot of building area. For the subset of buildings with employee counts, the range of water usage is from 9 to 42 GPD per employee for indoor uses. The Maplewood Police Department and Court House has 41,850 square feet of floor area, so its normalized usage is 1037 GPD / 41,850 SF = 0.025 GPD per square foot, putting it at the low end of the range reported in Dziegielewski et al (2000). Gauging water usage on gallons per square foot may overstate efficiency, since this facility is large for its typical number of users. Assuming 30 users (the number of people most commonly in the building during a typical work day) water usage is 1037 GPD / 30 persons = 35 GPD/person, putting it within the range reported by Dziegielewski et al (2000). Thus, depending on the normalization method, water usage at the Maplewood Police Department and Court House is in the low to normal range. If we expand the number of users to account for the times of day when there are many more persons in the building, the usage levels approach the low end of range in buildings presented in Dziegielewski et al (2000).
Building Energy Consumption Performance
Introduction
A public safety building generally is more energy intensive than a typical commercial building because of its schedule and equipment requirements. In a nationwide sample, annual delivered energy use, including electricity, natural gas, and other fuels, averaged 115.8 kBtu/SF in public safety buildings and only 89.8 kBtu/SF in typical commercial buildings, a difference of 29%.5
5 Energy Information Administration (EIA), U.S. Department of Energy. 2006. Commercial Buildings Energy Consumption Survey 2003, Table C3. Retrieved on January 31, 2010 from http://www.eia.doe.gov/emeu/cbecs/cbecs2003/detailed_tables_2003/2003set9/2003html/c3.html
Phone: 732/932-4101 x520 greenbuilding.rutgers.edu Fax: 732/932-0934 20
Making the Maplewood Police Department and Court House energy efficient is therefore both a significant design challenge and a high priority. The building includes several features designed to reduce utility bills, notably a photovoltaic array to generate electricity from sunlight, a tight building envelope, extensive reliance on daylighting, a heat recovery system, high-efficiency mechanical and electrical system components, and a sophisticated building management and control system. This section evaluates the building’s energy performance since the time it was built.
Methodology
This study analyzes utility billing data for the building, examining patterns of electricity and natural gas usage over time and comparing this building’s energy use to several benchmarks. The research team also visited the site several times and conducted multiple interviews with key actors, including the architect, building manager, building users, and township representatives. The team reviewed archival data including building plans and LEED submittals. Working with the building manager, the team was also able to review trend logs generated by the building management system. Finally, the team used industry-standard data for climate, energy prices, and typical commercial building energy performance to complete the analysis.
Township representatives provided monthly electricity and natural gas bills from PSE&G for the building from January 2008 forward. The electricity generated by the solar array was tracked separately by Solar Energy Systems from March 2008 forward and their website provided access to those data.
One point of comparison is to the old police building in Maplewood. Utility bills for this building have been lost, so it was necessary to convert accounting entries (in dollars) into kWh of electricity and therms of natural gas. This was done by dividing the total billing amount by historical monthly average electricity and gas prices for commercial customers in New Jersey6 to yield kWh and therm usage estimates. We should note, though, that while use and function is similar in the old and new police building, amenities and equipment differ significantly. The new building is, by intent, significantly larger and will use significantly more energy than the previous one, even if more efficiently per square foot.
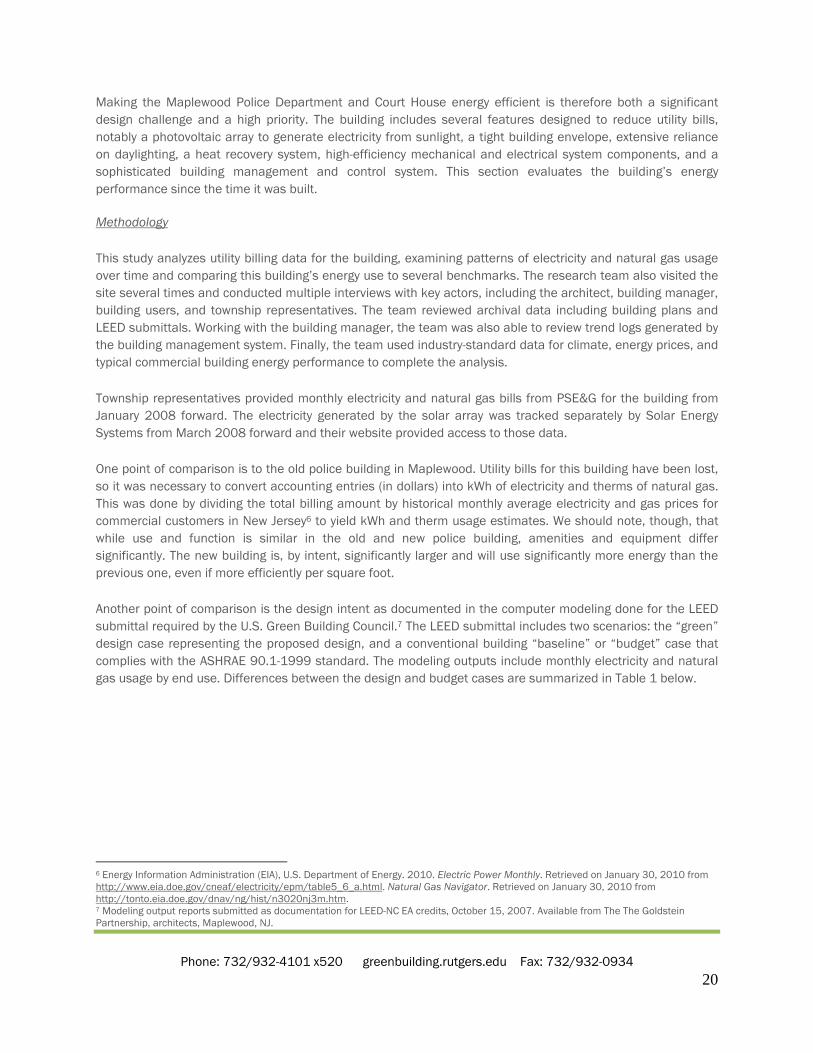
Another point of comparison is the design intent as documented in the computer modeling done for the LEED submittal required by the U.S. Green Building Council.7 The LEED submittal includes two scenarios: the “green” design case representing the proposed design, and a conventional building “baseline” or “budget” case that complies with the ASHRAE 90.1-1999 standard. The modeling outputs include monthly electricity and natural gas usage by end use. Differences between the design and budget cases are summarized in Table 1 below.
6 Energy Information Administration (EIA), U.S. Department of Energy. 2010. Electric Power Monthly. Retrieved on January 30, 2010 from http://www.eia.doe.gov/cneaf/electricity/epm/table5_6_a.html. Natural Gas Navigator. Retrieved on January 30, 2010 from http://tonto.eia.doe.gov/dnav/ng/hist/n3020nj3m.htm. 7 Modeling output reports submitted as documentation for LEED-NC EA credits, October 15, 2007. Available from The The Goldstein Partnership, architects, Maplewood, NJ.
Phone: 732/932-4101 x520 greenbuilding.rutgers.edu Fax: 732/932-0934 21
Table 1: Differences between the Design and Conventional Cases. Source: LEED submittal, Energy Credit Document 5
Building M&P Element Building Design Conventional “Budget” Case HVAC System Type • AHU-1, AHU-2 VAV with HW
reheat • Chilled water for AHU's provided by water cooled chillers in building • Heating hot water for AHU's and VAV's is provided by a boiler in the building
• Same as Design Energy Case per Figure 11.4.3 and Table 11.4.3a in ASHRAE 90.1-1999. System types selected from Table 11.4.3a include: • LEED EMP Exception System 4: AHU-1, AHU-2 & DX cooling under 150 tons
Air-Side Economizer Controls • Enthalpy-based air-side economizers
• Dry Bulb Air-Side economizers
AHU Fan Properties All AHU's • 3.5" total fan static pressure • Mechanical efficiency: 72% AHU-1 & AHU-2 • Motor efficiency:93% • Variable Speed Drive • Supply Air Flow: 17,500 cfm
All AHU's • 3.5" total fan static pressure • Mechanical efficiency: 72% AHU-1 & AHU-2 • Motor efficiency:93% • Forward-curve fan with inlet vanes • Supply Air Flow: 17,500 cfm
Boiler Efficiency • 87.5% • 80%
Cooling • 0.660 kW/ton • 10.0 EER
HVAC Circulation Loop Properties • Water loop is variable flow • CHW Pump Head: 75 feet • CHW Pump Efficiency: 70.6% (motor + impeller) • Hot Water loop is variable flow • HW Pump Head: 60 feet • HW Pump Efficiency: 65.8% (motor + impeller)
• Water loop is variable flow • CHW Pump Head: 75 feet • CHW Pump Efficiency: 70.6% (motor + impeller) • Hot Water loop is a constant flow • HW Pump Head: 60 feet • HW Pump Efficiency: 65.8% (motor + impeller)
Domestic Water Heating • One 225-gallon storage water heater with 87.5% efficiency
• One 100-gallon natural gas storage water heater with 80% thermal efficiency
Firing range Ventilation System • 9600 cfm exhaust and makeup air handlers with heat recovery coil in each connected by refrigerant piping and hot water heating coil in makeup air from 87.5 EFF boiler
• 9600 cfm exhaust and makeup air handlers with hot water heating coil in makeup air from 80% EFF boiler
The average performance of similar buildings is based on the U.S. Department of Energy’s Commercial Buildings Energy Consumption Survey (CBECS) 2003, which surveyed a sample of 5,215 U.S. commercial buildings about their design characteristics and measured energy consumption.8 The CBECS micro-data set is used here to identify the 17 buildings in the sample that are located in the Mid-Atlantic region and where Public Safety is the principal activity. The weighted average (CBECS uses weights to adjust the sample to
8 Energy Information Administration, U.S. Department of Energy, Commercial Buildings Energy Consumption Survey (CBECS) 2003. Retrieved on January 4, 2010 from http://www.eia.doe.gov/emeu/cbecs/contents.html.
Phone: 732/932-4101 x520 greenbuilding.rutgers.edu Fax: 732/932-0934 22
reflect the prevalence of similar buildings in the overall population) electricity and natural gas energy intensities (energy use/square foot-year) provide a basis for comparing the Maplewood Police Department and Court House to similar buildings in the region. One concern about using CBECS for comparative purposes is that it contains a sample of existing buildings that may have different amenities and economic value than the newly-built structure in Maplewood.
To understand better how the building is performing, we look at monthly energy-use data alongside weather data (heating degree days, cooling degree days)9 to help explain the pattern of observed energy use. Annual energy-intensity comparisons complete the picture.
Results and Discussion
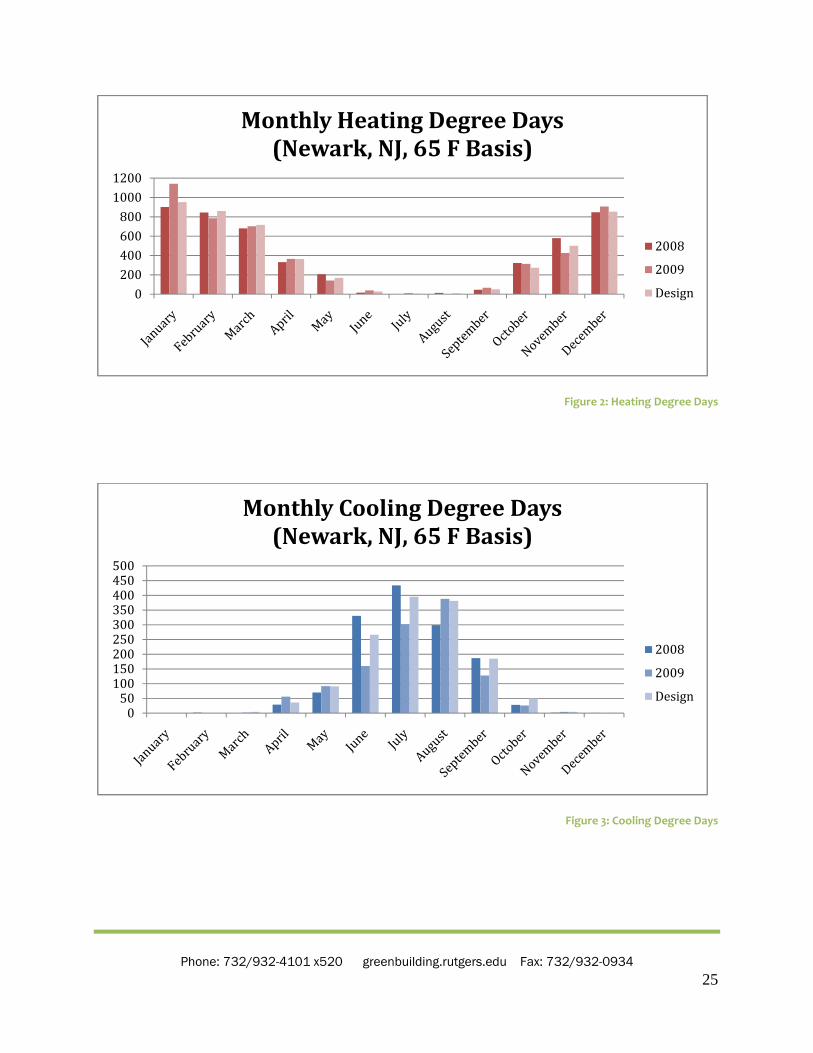
The following pages show figures that summarize the monthly climatic conditions and energy use at the Maplewood Police Department and Courthouse. Figure 2 shows the pattern of Heating Degree Days (HDD), which indicates the months that make up Maplewood’s heating season. The years 2008 and 2009 do not differ dramatically from the long-term average values typically used during design, although there are minor excursions (January 2009 was cooler than average, for example). Figure 3 shows Cooling Degree Days (CDD), which define Maplewood’s cooling season. There are some visible differences across years, with 2009 having a particularly cool summer.
Electricity consumption at the Maplewood Police Department and Courthouse weakly echoes the monthly pattern of cooling degree days, as shown in Figure 5. A plot of peak electricity demand in Figure 4 also shows modest seasonality. Seasonality is much more pronounced in natural gas consumption, which closely tracks heating degree days as can be seen in Figure 6.
The total cost of energy at the Maplewood Police Department and Courthouse has distinct summer and winter peaks driven by electricity use in the summer and natural gas use in the winter. Figure 7 shows the month-by-month pattern. Electricity accounts for two thirds of the energy costs on an annual basis.
There are complete years of utility billing data for 2008 and 2009, so that annual comparisons against benchmarks are possible. Figures 8 and 9 show that 2008 does not have an anomalous number of heating or cooling degree days, making it a reasonable year for these comparisons. Heating degree days in 2008 are nearly identical to the design conditions, and cooling degrees in 2008 are within 2% of design conditions. 2009 heating degree days are 3% above average, and the cooling degree days are 18% below average.
Annual energy intensity comparisons show that the Maplewood Police Department and Courthouse is using about the same amount of electricity as expected during design. Figure 10 shows that 2008 electricity usage is within 2% of the design prediction and 2009 usage matches the design prediction. The 2008 and 2009 electrical energy (kWh) usage in the building as built are substantially lower (indicating better performance) than the modeled conventional building. The peak demand for electric power in 2008 is 12% higher than expected, as shown in Figure 11. This can be attributed to building startup activities such as equipment testing that took place early in the year, because all other months fall within the predicted range and 2009 is within one percent of the target.
9 Degree day data are from www.degreedays.net (using temperature data from www.wunderground.com) for Newark International Airport, NJ, USA. Retrieved on January 30, 2010 from http://www.degreedays.net.

Phone: 732/932-4101 x520 greenbuilding.rutgers.edu Fax: 732/932-0934 23
Figure 12 shows annual natural gas usage for the building in 2008 and 2009, and in the two modeled scenarios (design case, conventional building case). Here we encounter an unexpected result: actual natural gas usage appears to be several times higher than predicted. It is even higher than what was predicted for a conventional building. There are several possible explanations for this apparent high natural gas usage: the Maplewood Police Department and Courthouse may be experiencing operational challenges during its startup period; the building may be operating under dramatically different conditions (especially regarding climate or schedule) than the modeling performed during the design process assumed; the modeling results included in the LEED submission incorporate unusual or inappropriate assumptions; or some combination of these factors has affected the results.
To address these questions, we extended our comparisons to include other buildings for which comparable data is available, normalizing the comparisons on a square foot basis to account for different building sizes. Figure 13 shows electricity intensities (annual kWh per square foot) and Figure 14 shows natural gas intensities (annual thousand Btu (kBtu) of natural gas per square foot). The comparisons include the measured 2008 and 2009 values based on utility bills for the building as built, the modeled design case, the modeled conventional building case, the old police station building in Maplewood, and the average values for 17 public safety buildings located in the Mid-Atlantic region (based on the 2003 CBECS survey).
Figure 13 confirms that electricity consumption at the Maplewood Police Department and Courthouse in 2008 and 2009 matches the design intent, and that this represents good, energy-efficient performance relative to the modeled conventional building, the old police station, and it is at the regional average for existing similar buildings.
Figure 14 shows that while actual 2008 and 2009 natural gas consumption of the new police and court building is much higher than predicted in design modeling figures and is higher than the per square foot usage in a modeled conventional building, it is not out of line when compared to buildings of similar use. On a per square foot basis, the new police station used 16% less natural gas in 2008 and 39% less in 2009 than the old Maplewood Police and Court Building. It also used 3% less in 2008 and 29% less in 2009 than the average of other public safety buildings in the region.
This suggests that part of the anomaly lies in the modeling done for the LEED submittal which may have included unusual assumptions. Possible candidates include assumed operating hours, climatic conditions, and HVAC system operational performance. In discussions with members of the design team, it also was noted that many modeling runs were performed, so it is possible that something was lost in translation between the preliminary and final runs.
Startup problems could also play a role in increasing natural gas usage above expected amounts. For example, if the economizer controls are not operating properly (perhaps because items such as carbon dioxide sensors need calibration or an improved control logic), much more outside air than needed might coming into the building during the winter, requiring heating.
The firing range also may play a role in the natural gas story. The indoor firing range requires 100% outside air whenever it operates. It is a very large room and its ventilation system is sized to change the air many times per hour to maintain air quality by minimizing residue of weapons firing, including gun powder, smoke, and particulate matter resulting from bullet impact. Thus, assumptions about the number of hours per year it operates will affect estimates of natural gas usage in both the baseline and as-designed cases. As built, the firing range incorporates a dedicated heat reclaim system designed to reduce natural gas usage. If the heat
Phone: 732/932-4101 x520 greenbuilding.rutgers.edu Fax: 732/932-0934 24
reclaim system is not operating as intended, or the backup natural gas-fired hot water heating system is not performing as intended, then the firing range may use more natural gas than expected.
Regardless of modeling and startup issues, the actual natural gas consumption of the Maplewood Police Department and Courthouse, per square foot, is better than the previous police building, and somewhat better than other public safety buildings, suggesting reasonably energy-efficient performance, though not up to expectations, Improvements between 2008 and 2010 suggest that startup issues are being resolved.
A special feature of the Maplewood Police Department and Courthouse is the solar photovoltaic array mounted on the roof that generates electricity. This 19 kW system produces between one and three thousand kWh per month (see Figure 15), offsetting between two and seven percent of the building’s monthly electricity consumption.
Conclusions and Recommendations for Future Research
Overall, it appears that the Maplewood Police Department and Courthouse is performing adequately in terms of energy efficiency, with room for improvement. It is less electricity and natural gas intensive than existing public service buildings in the region, including Maplewood’s old police station. Its electricity use meets design targets. Its natural gas use does not, but that may in part be due mostly to unusual assumptions in the target-setting calculations or their reporting.
The solar PV system is performing as specified, producing electricity consistently as predicted, even though it only provides a small percentage of the building’s electricity consumption.
Future research should investigate the actual usage and performance of unusual features such as the indoor firing range, and assess the extent to which startup challenges have affected the energy performance of this building. It appears that most problems have been with localized occupant discomfort rather than poor energy efficiency, but it may be that getting better control of the HVAC will lead to both better comfort and even better energy efficiency.
Phone: 732/932-4101 x520 greenbuilding.rutgers.edu Fax: 732/932-0934 25
Figure 2: Heating Degree Days
Figure 3: Cooling Degree Days
020040060080010001200
Monthly Heating Degree Days (Newark, NJ, 65 F Basis)
2008
2009
Design
050100150200250300350400450500
Monthly Cooling Degree Days (Newark, NJ, 65 F Basis)
2008
2009
Design

Phone: 7
732/932-4101
1 x520 gre
enbuilding.rut
tgers.edu Fa
Figure 5: Month
Fig
ax: 732/932-0
hly Electricity Us
gure 4: Peak Ele
0934
sage
ectricity Deman
26
d

0
1000
2000
3000
4000
5000
6000
$$2,00$4,00$6,00$8,00$10,00$12,00$14,00
Phone: 7
M
00000000
Jan‐08
Feb‐08
Mar‐08
732/932-4101
Monthly
Mar08
Apr‐08
May‐08
Jun‐08
M
1 x520 gre
y Natura
Jul‐08
Aug‐08
Sep‐08
Oct‐08
Monthly
Natural
enbuilding.rut
al Gas U
Oct‐08
Nov‐08
Dec‐08
Jan‐09
Energy
l Gas Elect
tgers.edu Fa
Use (The
Feb‐09
Mar‐09
Apr‐09
May
09y Costs
tricity
ax: 732/932-0
Figure
Figure 7: Mo
erms)
May‐09
Jun‐09
Jul‐09
Aug‐09
0934
e 6: Natural Gas
onthly Energy Co
200
200
Sep‐09
Oct‐09
Nov‐09
Dec09
27
s Use
osts
08
09
Dec‐09

0
1000
2000
3000
4000
5000
6000
0
200
400
600
800
1000
1200
1400
1600
Phone: 7
Actu
Actu
732/932-4101
4788
ual 2008
Annua(Ne
1382
ual 2008
Annua(Ne
1 x520 gre
al Heatiewark, N
al Cooliewark, N
enbuilding.rut
Fig
4903
Actual 2009
ing Deg NJ, 65 F
1158
Actual 2009
ing Deg NJ, 65 F
tgers.edu Fa
gure 8: Annual H
Figure 9: A
gree Day Basis)
gree Day Basis)
ax: 732/932-0
Heating Degree
nnual Cooling D
4782
Desig
ys
1413
Desig
ys
0934
Days Compariso
Days Compariso
2
n
3
n
28
on
n

0100200300400500600700800900
0
50
100
150
200
250
Phone: 7
649
Actual 20
An
204
Actual 2
732/932-4101
008
nnual E
008
Peak E
1 x520 gre
657
Actual 2009
Electrici
138
Actual 200
Electric
enbuilding.rut
9
ity Use
09
city Dem
tgers.edu Fa
Figure 10: An
Figure 11: P
659
Design
(1000 k
137
Design
mand (k
ax: 732/932-0
nnual Electricity
Peak Electricity
8
Conv
kWh)
Co
kW)
0934
Use Compariso
Demand Comp
800
entional
199
onventional
29
on
parison

0
5000
10000
15000
20000
25000
0
5
10
15
20
25
Phone: 7
222
Actua
A
16
Actual 2008
Elec
732/932-4101
255
l 2008
Annual
16
Actual 200
ctricity
1 x520 gre
16301
Actual 2
l Natura
16
09 Des
IntensikW
enbuilding.rut
1
009
al Gas U
6
sign Con
ity ComWh/SF)
tgers.edu Fa
Figure 12: An
Figur
3847
Design
Use (The
19
nventional
mparison)
ax: 732/932-0
nnual Natural G
re 13: Electricity
C
erms)
19
Old Building
n (Annu
0934
Gas Usage Comp
Intensity Comp
11930
Conventional
16
Mid‐AtlanStates Ave
ual
30
parison
parison
ntic rage

Phone: 732/932-4101 x520 greenbuilding.rutgers.edu Fax: 732/932-0934 31
Figure14: Natural Gas Intensity Comparison
53
39
9
29
6455
010203040506070
Actual 2008 Actual 2009 Design Conventional Old Building Mid‐Atlantic States Average
Natural Gas Intensity Comparison (Annual kBtu/SF)
0500100015002000250030003500
Mar‐08
Apr‐08
May‐08
Jun‐08
Jul‐08
Aug‐08
Sep‐08
Oct‐08
Nov‐08
Dec‐08
Jan‐09
Feb‐09
Mar‐09
Apr‐09
May‐09
Jun‐09
Jul‐09
Aug‐09
Sep‐09
Oct‐09
Nov‐09
Dec‐09
Jan‐10
Electricity Generation by Solar Array (kWh)
Figure 15: Electricity Generation from Rooftop Solar Array

Phone: 732/932-4101 x520 greenbuilding.rutgers.edu Fax: 732/932-0934 32
Life Cycle Performance ‐ Life Cycle Cost (LCC) Analysis
Introduction
To better understand the cost-effectiveness of the new Maplewood Police Station’s green features, we performed a Life Cycle Cost (LCC) analysis for the energy-related characteristics and equipment. LCC analysis considers the total costs associated with a building from its construction to its demolition. This “cradle-to-grave” perspective incorporates not only initial costs but also the operating costs over the building’s lifetime, yielding a more complete picture of total costs. LCC analysis is especially useful in the context of green building because energy-efficient features characteristically have higher up-front costs but recover some or all of those costs through lower utility bills. The LCC therefore helps to quantify the initial cost – operating cost tradeoff and any associated net benefits.
Methodology
An LCC analysis is usually comparative, contrasting the as-built, green building with a conventional building or “budget” case. For each scenario, we collected utility consumption data and the capital costs for building features relating to energy consumption (electrical, HVAC, exterior walls, glazing, roof). For the Maplewood Police Station, utility data and capital cost data were acquired from the township government and the architect, respectively. The costs for the budget case building are modeled using RSMeans CostWorks Online as well as industry-standard building costs, and have been reviewed by engineers and building consultants. Utility consumption estimates for the budget case building come from the energy modeling performed for the LEED submission.
The heart of an LCC is a financial calculation known as a Net Present Value (NPV) analysis. Net present value refers to the discounted difference between (net) the total costs and benefits from each time period of the building’s lifetime, brought back to the present and aggregated into a single number. Lower operational costs over a building’s lifetime can help mitigate any higher up-front costs associated with energy-efficient green buildings. A positive NPV relative to the budget case represents a net savings by the energy-efficient building over its lifetime.
Once initial costs and energy consumption costs were obtained for the as-built and budget building designs, they were tabulated in an LCC spreadsheet adapted from one developed by the Rutgers Center for Green Building for prior projects. The budget case building was used as the “base” model for comparison purposes. All analyses are reported on a per-square-foot basis.
Finally, we performed several sensitivity analyses. A sensitivity analysis examines the effect that different factors have on the relative NPVs of the represented projects. In this LCC analysis, there are three factors for which we ascribe variable values: future energy costs, the discount rate, and building lifespan. Future energy costs were set to 75% and 150% of their projections from the DOE Annual Energy Outlook 2009.10 We use three different values for the discount rate. The primary NPV analysis uses a 7% discount rate – arguably pretty generous in today’s economic climate, while the low discount rate of 4% represents the low point of the 30-year average mortgage rate with points from Freddie Mac during the recent recession. A more aggressive discount rate of 12% was also employed. Building lifespan for the primary NPV analysis is assumed to be 30 years, and 15-year and 50-year lifespans are considered in the sensitivity analyses.
10 DOE Energy Outlook Handbook 2009, Tables A8 and A13, pp. 127 and 136.

Phone: 732/932-4101 x520 greenbuilding.rutgers.edu Fax: 732/932-0934 33
Results and Discussion
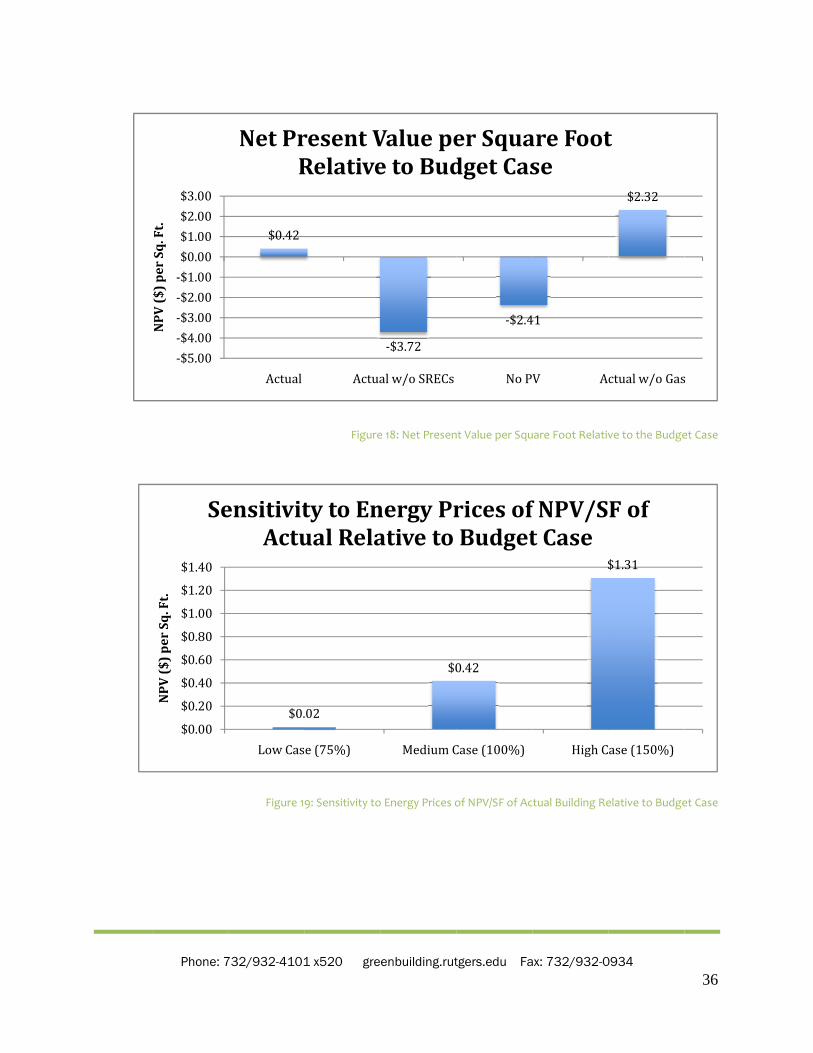
Table 2 and Figures 16-21 summarize the key findings of the LCC analysis. The initial cost of the green, as-built building is higher than the conventional, budget-case building. However, its operating costs are substantially lower. On a life-cycle basis, the lower operating costs fully offset the higher construction costs, yielding a small, positive net benefit of $0.42 per square foot.
Building Initial Cost (Selected Features) per Square Foot (SF)
Initial Cost per SF Relative to Budget Case
Discounted Operating Cost per SF
Discounted Operating Cost per SF Relative to Budget Case
Net Present Value (NPV) per SF
NPV Relative to Budget Case
As Built -$7.48 -$7.48 -$33.85 $7.90 -$41.32 $0.42 Budget Case
$0.00 -$41.74 -$41.74
Table 2: Net Present Value (NPV) Analysis Figure 16 shows that the electricity usage of the as-built building is 15% lower than that estimated for the conventional, budget alternative. Figure 17 shows that natural gas usage goes the other direction, with the as-built building consuming 37% more natural gas than its conventional alternative. However, as noted in an earlier section of this report, the natural gas modeling numbers are suspect, and, in any case, the electricity costs are far larger than the natural gas costs on an annual basis. Based on the primary NPV analysis (using current energy prices, a building lifespan of thirty years, and a discount rate of 7%) the as-built Police Station has a small positive NPV relative to the budget case. Figure 17 shows how the NPV varies with changes in project scope. If Solar Renewable Energy Certificates (SRECs) were not being awarded for the clean, solar energy production of the photovoltaic array, the NPV of the as-built building would turn negative, costing $3.72 per square foot more than the budget case. If the photovoltaic array had not been built at all, the NPV of the as-building would remain negative, costing $2.41 per square foot more than the budget case. However, given the uncertainty about the actual natural gas costs associated with the modeled budget case, it might be better to take natural gas consumption out of the calculation altogether. In that case, the NPV of the as-built building becomes positive, costing $2.32 per square foot less than the budget case. The NPV of the as-built building relative to the budget case building is sensitive to assumptions regarding future energy prices, discount rates, and building lifetimes. Energy escalation rate (Figure 19) does not change the direction of the relative NPV of the as-built building, and in every case the as-built building performs better than the budget case, increasingly so at higher energy prices. This makes sense, because the more energy a building consumes, the more it will be affected by changes in energy prices. Changes in the discount rate (Figure 20) changed the direction of the relative NPVs of the buildings in one out of three sensitivity cases. The as-built building remained more attractive than the budget case under low and normal discount rates, but not at the higher discount rate.

Phone: 732/932-4101 x520 greenbuilding.rutgers.edu Fax: 732/932-0934 34
Projected lifespan of the buildings (Figure 21) also had a significant impact on the relative NPVs. Here, the relative NPV of the as-built building was worse than that for the budget case for a 15-year lifespan and better for 30-year and 50-year lifespans. This emphasizes the importance of ensuring that the building lasts long enough to pay off its increased construction cost.
Conclusions
This life cycle cost analysis shows that, when compared to the budget case modeled building, the reduced energy consumption of the as-built Maplewood Police Station results in a small, positive relative NPV; that is, the as-built building has relatively lower life-cycle costs than the budget alternative. This small advantage is robust across a range of plausible assumptions about future energy prices, but not across a reasonable range of discount rates and building lifetimes. The net benefits of the green design are thus marginal in life-cycle cost terms. These numbers are likely to improve if the natural gas usage of the building drops and the building enjoys a long useful life. New Jersey’s SRECs policy is clearly a crucial factor in making the Maplewood Police Station’s green design cost-effective.

Phone: 7
14.0
15.0
16.0
17.0
18.0
19.0
kWh per sq. ft.
0.000
0.010
0.020
0.030
0.040
0.050
MCF per sq. ft.
732/932-4101
AnCons
AnnCons
1 x520 gre
Figure 16
Figure 17:
18.6
Budget Case
nnual Elsumptio
0.029
Budget Case
nual Nasumptio
enbuilding.rut
6: Annual End‐U
Annual End‐Use
Electr
lectriciton (kW
Natur
atural Gon (MCF
tgers.edu Fa
Use Electricity C
e Natural Gas Co
ricity
ty End‐UWh per s
ral Gas
as End‐F per sq
ax: 732/932-0
onsumption (kW
onsumption (M
15.7
Actual
Use q. ft.)
0.039
Actual
‐Use q. ft.)
0934
Wh per square f
CF per square f
35
foot)
oot)
Phone: 7
‐$5.00‐$4.00‐$3.00‐$2.00‐$1.00$0.00$1.00$2.00$3.00
NPV ($) per Sq. Ft.
$0.00
$0.20
$0.40
$0.60
$0.80
$1.00
$1.20
$1.40
NPV ($) per Sq. Ft.
Se
732/932-4101
Figure 1
$0.42
Actual
Net PrR
$0.
Low Cas
ensitivitActu
1 x520 gre
Figure
9: Sensitivity to
Actua
resent VRelative
.02
e (75%)
ty to Enual Rela
enbuilding.rut
e 18: Net Presen
o Energy Prices o
‐$3.72
al w/o SRECs
Value pee to Bud
$0
Medium C
nergy Prative to
tgers.edu Fa
nt Value per Squ
of NPV/SF of Ac
‐$2.4
No P
er Squadget Cas
0.42
Case (100%)
rices of Budget
ax: 732/932-0
uare Foot Relativ
ctual Building Re
41
V A
are Footse
$
High C
f NPV/St Case
0934
ve to the Budge
elative to Budge
$2.32
ctual w/o Gas
t
$1.31
ase (150%)
F of
36
et Case
et Case
s

Phone: 7
‐$3.00‐$2.00‐$1.00$0.00$1.00$2.00$3.00$4.00$5.00
NPV ($) per Sq. Ft.
S
‐$2.50‐$2.00‐$1.50‐$1.00‐$0.50$0.00$0.50$1.00$1.50$2.00$2.50
NPV ($) per Sq. Ft.
NP
732/932-4101
Figure 20:
Fi
$3
Low Ca
ensitiviof Ac
‐$Low Ca
SensitPV/SF o
1 x520 gre
: Sensitivity to D
igure 21: Sensitiv
3.91
ase (4%)
ity to Dctual Re
$2.12ase (15 yrs)
tivity to of Actua
enbuilding.rut
Discount Rates o
vity to Building
$
Medium
Discountelative t
$
Medium
o Buildial Relat
tgers.edu Fa
of NPV/SF of Ac
Lifetimes of Ac
$0.42
m Case (7%)
t Rates to Budg
$0.42
Case (30 yrs)
ing Lifetive to B
ax: 732/932-0
ctual Building Re
tual Building Re
‐High C
of NPV/et Case
High C
times oBudget C
0934
elative to Budge
elative to Budge
‐$2.58Case (12%)
/SF
$1.81
Case (50 yrs)
of Case
37
et Case
et Case

Phone: 732/932-4101 x520 greenbuilding.rutgers.edu Fax: 732/932-0934 38
Occupancy Satisfaction & Performance – Occupant Survey
Introduction
Occupancy data is an integral component of developing an explanation of building performance. Surveys of building occupants can help to confirm and clarify findings in the areas of energy and water usage and occupant satisfaction.
Methodology
Information on occupant responses to this building come from a walk-through tour of the facility, individual and group interviews with key personnel including architect, facilities staff, police and court administrators, and patrol officers, and from a self administered questionnaire distributed to all building personnel. Completed surveys were received from 25 persons representing both the police department and court personnel. This sample represents a cross-section of court and police staff, administrative, clerical and patrol officers, across all shifts, males and females, predominantly between 30 and 50 years of age, most of whom have been on the job for 4 years or more (see Figures 22 through 25). That said, it is important to note that is a small self-selected sample and therefore must be viewed as suggestive only; the results are most valuable when viewed in context of other observations.

Phone: 732/932-4101 x520 greenbuilding.rutgers.edu Fax: 732/932-0934 39
Survey Respondent Characteristics
Figure 22: Years in Organization
Figure 23: Respondents' Jobs
0 10 20 30 40 50 60
less than 1 yr
1‐3 yrd
4‐10 yrs
11‐20 yrs
>20 yrs
percent responding
0 10 20 30 40 50 60
less than 1 yr
1‐3 yrd
4‐10 yrs
11‐20 yrs
>20 yrs
percent responding
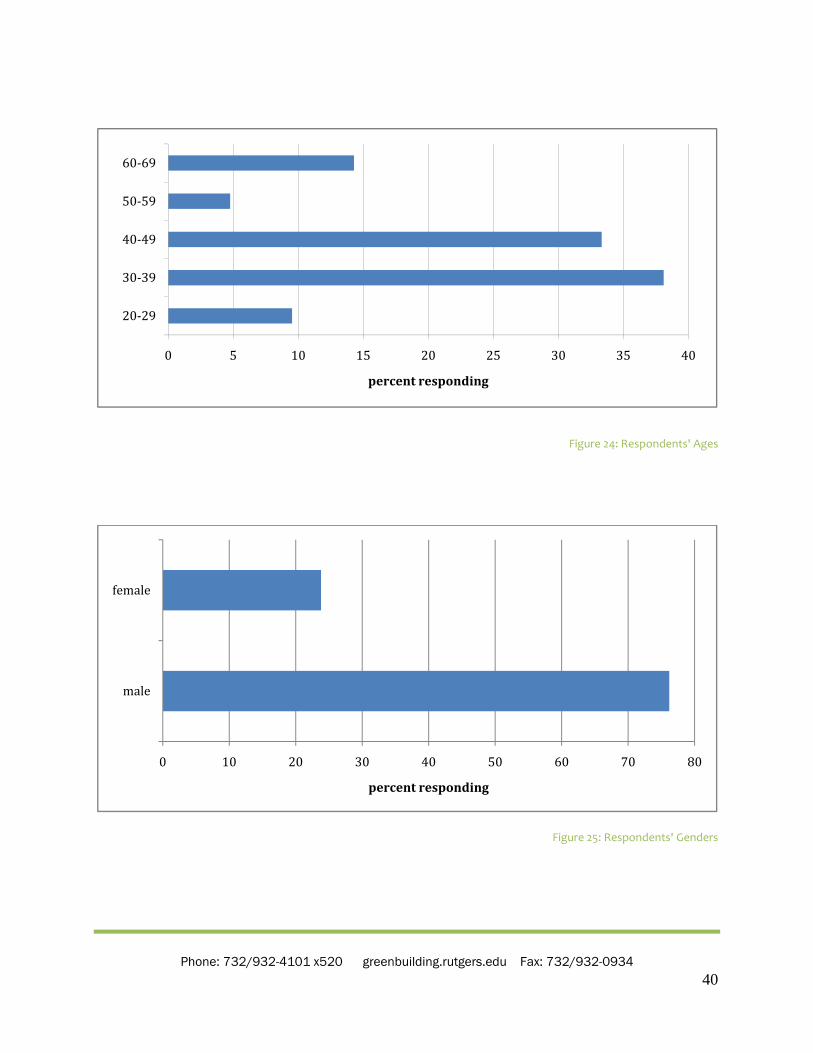
Phone: 732/932-4101 x520 greenbuilding.rutgers.edu Fax: 732/932-0934 40
Figure 24: Respondents' Ages
Figure 25: Respondents' Genders
0 5 10 15 20 25 30 35 40
20‐29
30‐39
40‐49
50‐59
60‐69
percent responding
0 10 20 30 40 50 60 70 80
male
female
percent responding

Phone: 732/932-4101 x520 greenbuilding.rutgers.edu Fax: 732/932-0934 41
Results and Discussion
Based on individual and group interviews, supported by surveys, buildings occupants seem pleased with this facility, although with some concerns about specific systems (see figure 26). They generally are happy to be in a bright, attractive, and spacious new facility. This appears to be in large part because of the quality of the new facility, but the positive feelings are also attributable in significant measure to the contrast with the previous police and court building, which was widely perceived as dated and too small for the number of people and functions. This building is considered a huge improvement over working in the old facility on all counts.
In addition to the quality, appearance, and amount of space in the new building, occupants were particularly pleased with the availability of the exercise/weight room, locker room with showers, and shooting range. Many were appreciative of the appearance, with particular emphasis on natural lighting and views. Most visitors were reported to see the building as very attractive; a court employee told us that even people coming in for less-than-pleasant reasons (such as to appear in court or pay a fine) often comment on how nice a facility it is. One employee said that “it is a privilege to work here.”
Occupants have a mixed perspective on the daylighting. On the one hand, as noted above, people like the availability of daylight, and we noticed that during daytime hours exterior room electric lights were left off, suggesting that the daylight provided sufficient illumination for work. Aesthetically speaking, it is a highly valued feature that seems to affect occupant mood positively. On the other hand, the satisfaction scores for work area daylighting are not uniformly high. This could be for several reasons. First, in spite of the use of light shelves and shades, glare has been a problem in some areas. Workers in a detective’s room on the east side of the building, for instance, had so much difficulty viewing computer screens that a solar film to was added to the highest area of the clerestory windows to reduce glare. During one morning interview in the first floor east conference room, a laptop screen was very difficult to read even with the blinds drawn.
When broken down by job it becomes clear that ratings from patrol officers are more negative on this and other workspace issues (see Figures 28-33). This relates to the nature of their workspace: an interior space with little privacy or windows and views. The other staff members in this building who had more private office space with exterior windows were much more pleased and satisfied with most building features than were those with open office space.
The choice of workspace assignment makes sense in that most patrol officers are in the building for only a small part of the day (for shift change meetings, court appearances, etc.), while other staff members are in the building for most or all of their work day. On the other hand, patrol officers make up the largest single group of staff in this building, so their concerns are magnified and deserving of attention.
The most common complaint we heard was concerning the functioning of the HVAC systems. The operation of these systems has been problematic since opening, and remains an issue two years after opening. Patience with attempts to fix heating and cooling systems is wearing thin. From the perspective of the building’s users, the problems are:
Poor temperature control (“it’s often too hot or too cold”);
Variability in rooms on the same thermostat (with the thermostat set at 69oF one room can indeed be at 69oF while another room a short distance away, on the same thermostat, is 80oF);

Phone: 732/932-4101 x520 greenbuilding.rutgers.edu Fax: 732/932-0934 42
Difficulty making adjustments in order to increase thermal comfort. New thermostats are perceived to be irresponsive and windows do not open. The only recourse is to contact the building manager. Building managers are constantly trying to address HVAC issues. A previous building manager “made adjustments daily,” said one administrator, but with cuts in staff there is not a full-time person in that position. The current staff member in charge has many other buildings to supervise, has less time to focus on HVAC issues in this facility, and less experience with these control systems.
Still, some of the attempted fixes, such as modifying the control programs for the heating systems, seem to have had a positive effect. Several people indicated that the heating was less problematic in Winter 2009-10 than in the previous winter. Cooling remains a problem, however, with common staff complaints that rooms are too cold or not cold enough.
The HVAC system is sufficiently complex as to require significant training time and oversight, something that is hard to provide in this budgetary environment. For instance, in January a new “program patch” was installed for the HVAC software which resulted in over 75,000 alert messages being sent to the facilities staff in a few days. In such situations, of course, alert messages lose their value.
Occupant concern with the level of adjustability of thermal comfort seems related both to perception of lack of responsiveness of thermostats and the inability to open windows. The absence of operable windows makes everyone more sensitive to temperature and ventilation issues. It was noted that one of the major discussions and points of contention during the programming process prior to design was over the presence or absence of operable windows – user representatives wanted windows they could open, but eventually engineering concerns for HVAC efficiency won out.
Staff and administrators we interviewed indicated that the building appeared to be designed as if every space was in use 24/7 since unused spaces remain heated and cooled in off-hours. Though this is not the case (both heating and cooling were designed to be fully adjustable in every zone and intended every zone should be able to be conditioned or not, as needed) the fact that this perception persists is a response to current difficulties in adjusting and maintaining temperature. Although heating has improved, temperature comfort remains a big issue in the eyes of the occupants and some of the building occupants say that it negatively affects their productivity. Administrative personnel indicate that they adjust clothing as a way to deal with temperature variation and individual preferences; patrol officers, who are only in the building for limited hours a day, are less likely to do so. Some staff also noted that the shooting range was heated but not cooled, making its use in summer uncomfortable.
There were a few other less critical but commonly cited concerns. A number of respondents noted that the water-saving power flush 1.2 gallon toilets consistently need to be flushed two times or more, negating intended potable water savings. Another common complaint was that the water pressure in sinks is too high and aerators on faucets insufficient, causing water to splash on clothes when washing hands. There also has been some water damage in ceiling tiles that appears to have been caused by condensation drips from water pipes.
Occupants, in general, rate this building as “somewhat environmentally friendly” (see Figure 33). The fact that these ratings are not higher, given the attention to and frequent discussion of green design of this building in Maplewood, likely is due to the aforementioned issues related to heating, cooling, and water use.
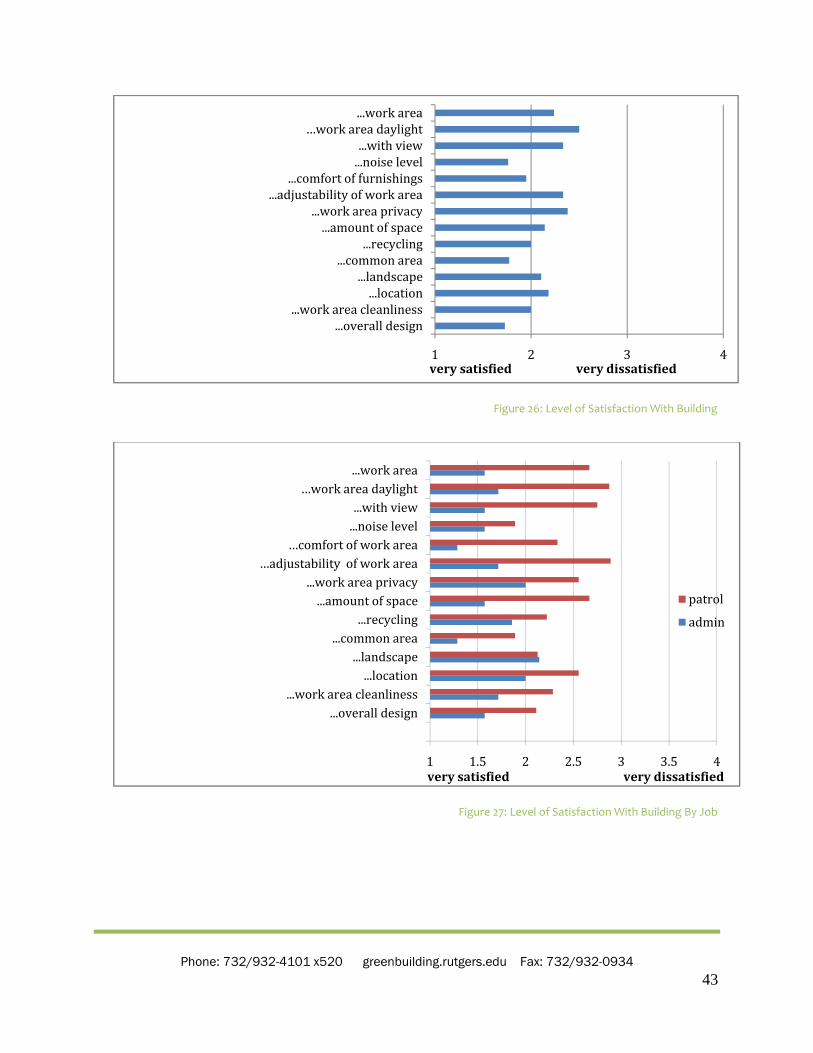
Phone: 732/932-4101 x520 greenbuilding.rutgers.edu Fax: 732/932-0934 43
Figure 26: Level of Satisfaction With Building
Figure 27: Level of Satisfaction With Building By Job
1 2 3 4
...overall design...work area cleanliness
...location...landscape
...common area...recycling
...amount of space...work area privacy
...adjustability of work area...comfort of furnishings
...noise level...with view
…work area daylight...work area
very satisfied very dissatisfied
1 1.5 2 2.5 3 3.5 4
...overall design...work area cleanliness
...location...landscape
...common area...recycling
...amount of space...work area privacy
…adjustability of work area…comfort of work area
...noise level...with view
…work area daylight...work area
very satisfied very dissatisfied
patrol
admin

Phone: 732/932-4101 x520 greenbuilding.rutgers.edu Fax: 732/932-0934 44
Figure 28: Satisfaction With Overall Design
Figure 29: Satisfaction With Workspace By Job
0 10 20 30 40 50 60
very satis.
satis.
dissatis.
very dissatis.
Percent responding

Phone: 732/932-4101 x520 greenbuilding.rutgers.edu Fax: 732/932-0934 45
Figure 30: Satisfaction With Workspace Privacy By Job
Figure 31: Satisfaction With Workspace Daylighting
0 10 20 30 40 50 60
very satis.
satis.
dissatis.
very dissatis.
Percent responding
0 1 2 3 4 5
very satis.
satis.
dissatis.
very dissatis.
number of respondents
open
priv enclosed off
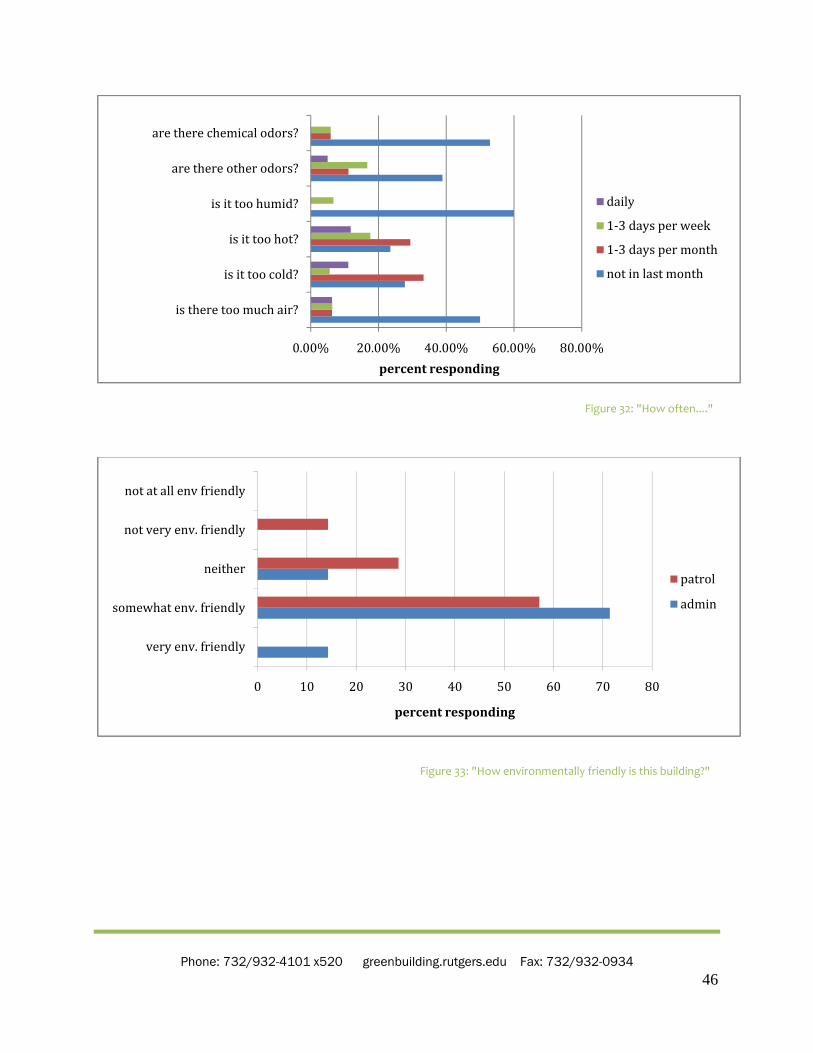
Phone: 732/932-4101 x520 greenbuilding.rutgers.edu Fax: 732/932-0934 46
Figure 32: "How often...."
Figure 33: "How environmentally friendly is this building?"
0.00% 20.00% 40.00% 60.00% 80.00%
is there too much air?
is it too cold?
is it too hot?
is it too humid?
are there other odors?
are there chemical odors?
percent responding
daily
1‐3 days per week
1‐3 days per month
not in last month
0 10 20 30 40 50 60 70 80
very env. friendly
somewhat env. friendly
neither
not very env. friendly
not at all env friendly
percent responding
patrol
admin
Phone: 732/932-4101 x520 greenbuilding.rutgers.edu Fax: 732/932-0934 47
Key Findings
Building Operating Performance
The building generally works well and is well received. Passive systems, such as the use of daylighting to reduce the level of use of electric lighting functions well, although there have been issues with glare on computer screens that have resulted in building adjustments. Daylighting is one of this building’s most noticeable feature and the one receiving the most positive comments.
However, active systems, however, for heating and cooling, have not been operating at optimal levels even after several years of operation, an extended shakedown period and numerous attempts at balancing. These seem to relate to rapid cycling on and off of the boiler and chiller systems. Although some of the boiler issues have been addressed, chiller issues are not yet resolved. The cooling load does not seem to be spread evenly among the four subunits and cycling is still an issue.
Green and security requirements do not seem to be in conflict in this building although the potential for differing design needs exists. The design of this facility has in some ways minimized potential conflict, although more focused attention on these issues could lead to greater synergies for future buildings.
Energy Use
In spite of the problems in fine tuning HVAC systems, energy use seems reasonable as compared to other similar buildings in available databases. Energy savings have not reached the projected levels, however, especially for natural gas usage, which could be related to the modeled projections that were included in the LEED submittal, actual system problems, unused 3rd floor space, additional power-using and heat-generating equipment, and operational choices. Additional savings may be possible when the remaining HVAC issues are addressed. The photovoltaic system is working well and performing in line with design projections.
Water Use
Water use appears to be in the low normal range for a building of this type. Complaints suggest excessive double and triple flushing which would reduce any advantage of 1.2 g toilets.
High water pressure and splash in sinks related to user dissatisfaction and may indicate waste of water.
Life Cycle Costing (LCC) Analysis
The Life Cycle Cost analysis shows that the as-built building is slightly less expensive on a life-cycle basis than the conventional, budget alternative. However, the net economic benefits for the green features in the design are marginal, at best, although this conclusion varies greatly depending on assumptions about future energy prices, discount rates, and building lifetimes. SRECs are a crucial element in any positive economic performance of the building at this point.
Occupants and visitors are generally pleased with the building though patrol officers, who are usually out of the building, are less happy with their workspace. The facility is seen as modern and attractive and many are especially impressed with the level of daylighting. Their primary complaints are concerning thermal comfort for heating and cooling, and sunlight glare on computers. Respondents indicated feeling little ability to control temperature levels because of what they saw as unresponsive thermostats and lack of operable windows.

Phone: 732/932-4101 x520 greenbuilding.rutgers.edu Fax: 732/932-0934 48
CONCLUSIONS AND NEXT STEPS
Overall functioning. This is a largely successful building though one that has not yet reached its full potential for energy savings because of recurring HVAC issues. There do not appear to be inherent problems in using public safety buildings as green building sites. Since public safety buildings are 24 hour settings with significant power consumption, such buildings may, in fact, be especially appropriate for green design. The building’s users appreciate the new facility particularly in comparison to the previous site that was too small and out-of-date for current technology and operational needs. It is seen as spacious, bright, attractive and as providing areas that support needed functions that were previously inadequately handled such as training rooms, a shooting range, exercise space and room for community meetings. Concerns about heating and cooling continue.
Daylighting issues. Designing for daylighting is important and requires care. Ample daylight is highly valued for light and view, reduces use of electric lighting and is easily noticeable as a green feature, but increased use of windows for daylight increases the potential for glare that interferes with computer work. In Maplewood one can see adjustments made on site (in use of shades, anti-glare film added to windows) to address these concerns. Design making use of daylighting needs to better coordinate with furniture choices and layout to reduce glare issues.
Match of sophistication and care needed in maintenance and control of systems to skills available. Any building with sophisticated systems requires time – perhaps four full seasons – for the HVAC systems to be adjusted and balanced. The use of sophisticated and complex systems, however, in buildings without full time, specialized building managers has the potential for significant short and long term problems. One lesson that has emerged from this evaluation involves the need to be aware of and take into account the likely budget and staffing available to manage sophisticated active systems in green buildings. While the length of time needed to tune the HVAC is this building is unusually long and makes this an atypical situation, there remain ongoing issues in building management. Problems understanding and maintaining sophisticated HVAC systems appear even in green buildings in corporate settings which have greater resources in facilities management staff time and experience. Currently, Maplewood does not have a budget for dedicated facilities staff and the maintenance is undertaken by staff from the Department of Public Works which has many other responsibilities, and which took over responsibility for this building needing training in these systems.
Energy Modeling. The energy modeling figures that were part of the LEED submittal appear to be flawed and may reflect on-going issues concerning the modeling. These calculations appear to be of uneven quality and unreliable as predictors of energy use. There is a need for work to validate these modeling assumptions to real life performance, and to improve training for modelers (such as through ASHRAE certification).
Cost Effectiveness. The building is not performing badly in terms of energy use, and costs are not out of line with what would be expected for a 24 hour public safety building. Performance may be surprisingly good given adjustment issues but even so savings are not as strong as had been projected, particularly for natural gas systems. One would expect energy and cost performance to be better when the HVAC is operating as designed and may well hit the original energy use projection, but even so a several year delay in achieving savings clearly affects LCC calculations.

Phone: 732/932-4101 x520 greenbuilding.rutgers.edu Fax: 732/932-0934 49
Appendices
Appendix A – LEED Credits
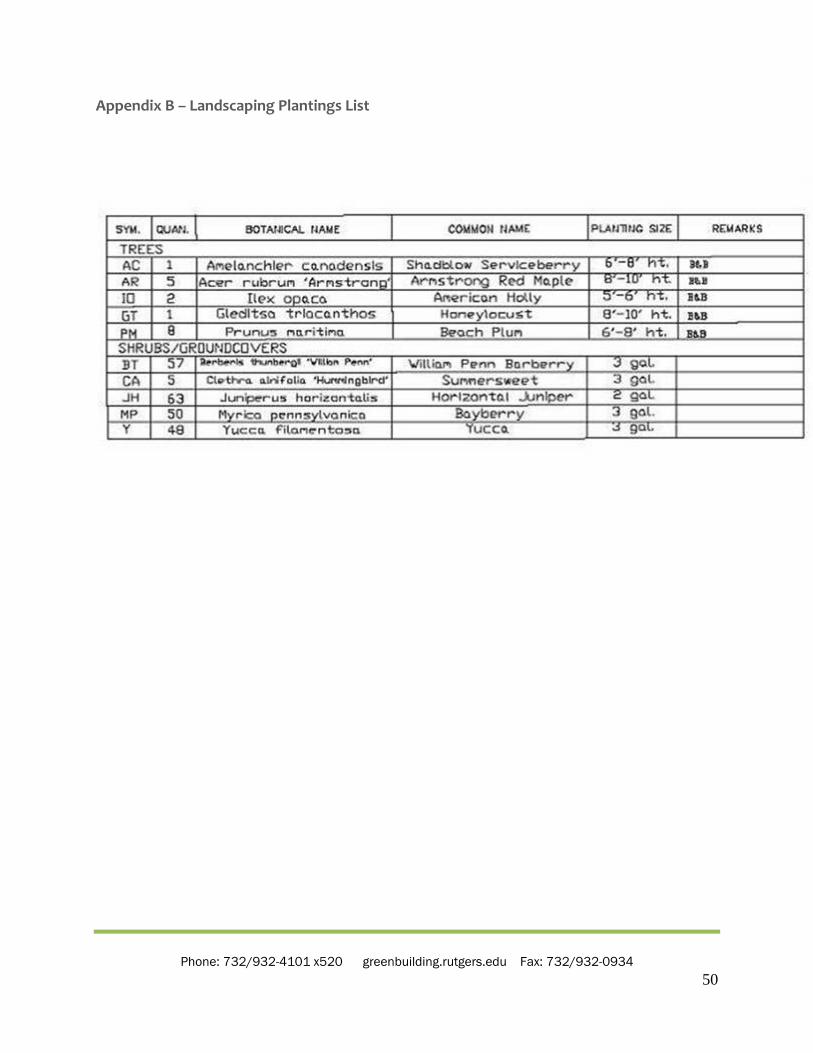
Phone: 732/932-4101 x520 greenbuilding.rutgers.edu Fax: 732/932-0934 50
Appendix B – Landscaping Plantings List