rxstat program: pooling data - pdmpassist.org parker_paone...rxstat program: pooling data ... opioid...
TRANSCRIPT
RxStat Program: Pooling Data
to Impact New York City’s
Prescription Problem
Bureau of Justice Assistance Harold Rogers Prescription Drug Monitoring Program National
Meeting
Washington D.C.
September 25, 2013

Outline
• Opioid Analgesics in New York City
(Dr. Denise Paone, NYC DOHMH)
• Mayor’s Task Force on Prescription Painkiller Abuse
(Ian Hartman-O’Connell, New York City’s Mayor’s Office)
• Public Safety/Public Health Initiatives-RxStat
– Public Safety (Chauncey Parker, NY/NJ HIDTA)
– Public Health (Dr. Denise Paone, NYC DOHMH)
• Data driven policy (Dr. Denise Paone, NYC DOHMH)
2

OPIOID ANALGESICS IN NEW
YORK CITY
Dr. Denise Paone, Director of Research and Surveillance
New York City Department of Health and Mental Hygiene

Opioid analgesic misuse and
the associated consequences
have led to a public health
crisis in
New York City.
4

• From 2005-2012, the rate of opioid analgesic overdose deaths increased 45%, heroin overdose deaths decreased 9%.
• In 2012, more than one fatal opioid analgesic overdose occurred every other day in New York City.
• In 2005, opioid analgesics were involved in 16% of overdose deaths; in 2012, they were involved in 28%.
5
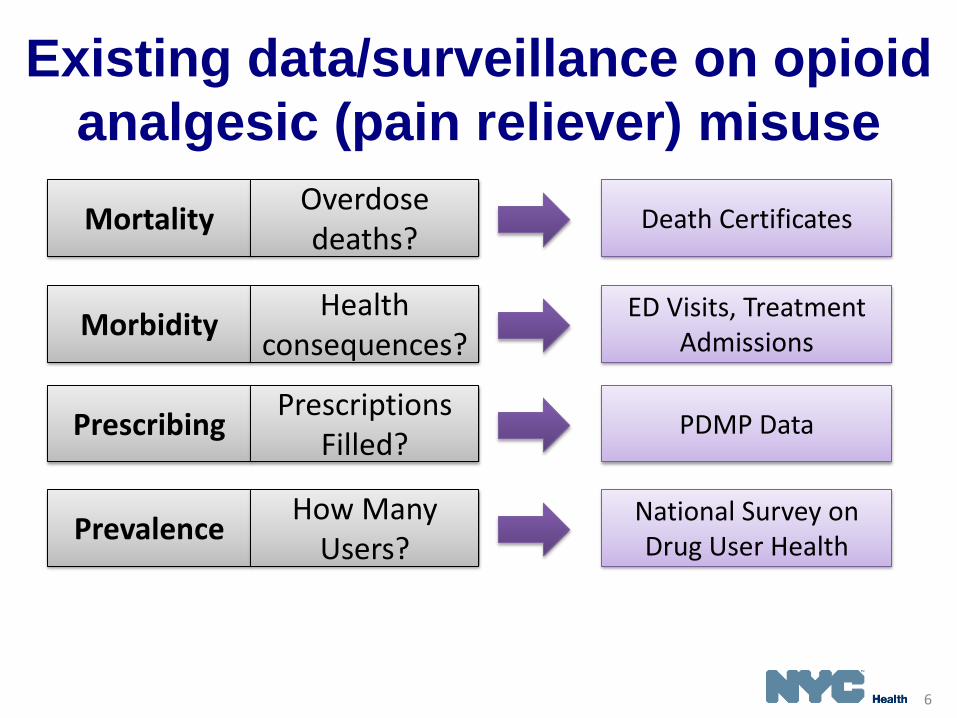
Existing data/surveillance on opioid
analgesic (pain reliever) misuse
Prescribing Prescriptions
Filled? PDMP Data
Morbidity Health
consequences? ED Visits, Treatment
Admissions
Prevalence How Many
Users? National Survey on Drug User Health
Mortality Overdose deaths?
Death Certificates
6

0
100
200
300
400
500
2005 2006 2007 2008 2009 2010 2011 2012
Nu
mb
er
Year
Cocaine
Heroin
Methadone
Benzodiazepines
Opioid Analgesics
Drugs are not mutually exclusive
Source: New York City Office of the Chief Medical Examiner &
New York City Department of Health and Mental Hygiene 2005-2012
Overdose death rate decreased
17% in NYC
7

Opioid analgesic overdose death rate increased 45%
between 2005 and 2012
Opioid analgesic overdose deaths, NYC, 2005-2012
Source: New York City Office of the Chief Medical Examiner &
New York City Department of Health and Mental Hygiene 2005-2012
130 152 131 137 151 173 220 190
2.0
2.4
2.0
2.1 2.3
2.6
3.3
2.9
0
0.5
1
1.5
2
2.5
3
3.5
0
50
100
150
200
250
2005 2006 2007 2008 2009 2010 2011 2012
Ag
e-A
dju
ste
d R
ate
per
100,0
00
Nu
mb
er
Number of opioid analgesic overdose deaths
Age-adjusted opioid analgesic rates per 100,000 population
8
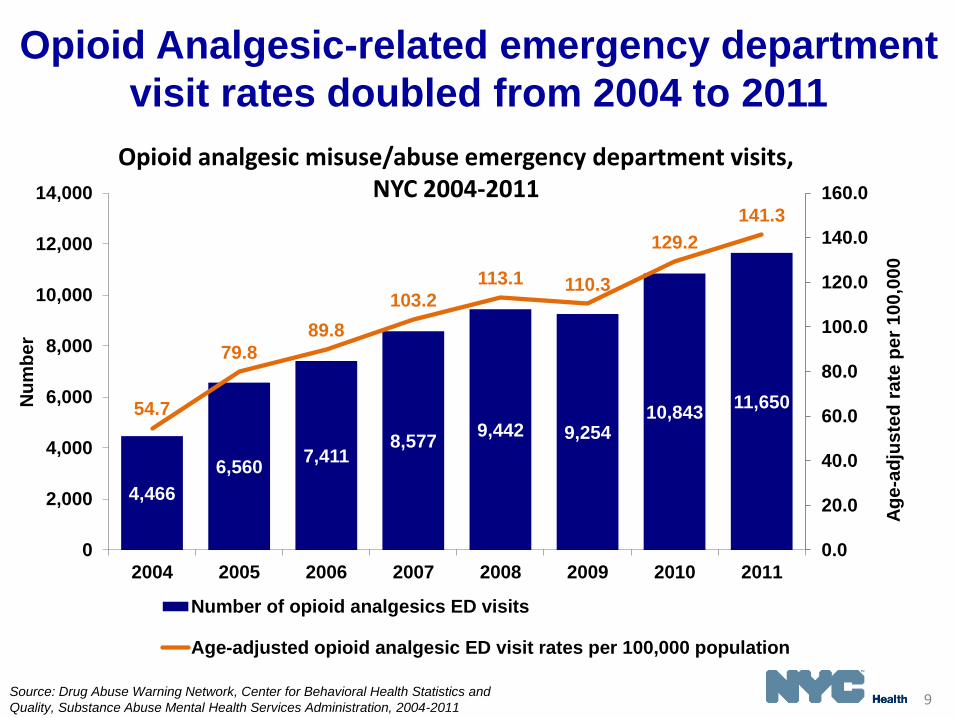
4,466
6,560 7,411
8,577 9,442 9,254
10,843 11,650 54.7
79.8
89.8
103.2
113.1 110.3
129.2
141.3
0.0
20.0
40.0
60.0
80.0
100.0
120.0
140.0
160.0
0
2,000
4,000
6,000
8,000
10,000
12,000
14,000
2004 2005 2006 2007 2008 2009 2010 2011
Ag
e-a
dju
ste
d r
ate
pe
r 1
00
,00
0
Nu
mb
er
Number of opioid analgesics ED visits
Age-adjusted opioid analgesic ED visit rates per 100,000 population
Source: Drug Abuse Warning Network, Center for Behavioral Health Statistics and
Quality, Substance Abuse Mental Health Services Administration, 2004-2011
Opioid Analgesic-related emergency department
visit rates doubled from 2004 to 2011
Opioid analgesic misuse/abuse emergency department visits, NYC 2004-2011
9

Prescriptions for opioids
increased 31% from 2008-2012
0
500,000
1,000,000
1,500,000
2,000,000
2,500,000
2008 2009 2010 2011 2012
Nu
mb
er
of
Pre
sc
rip
tio
ns
Year
Total RXs
Oxycodone
Hydrocodone
Source: New York State Department of Health, Bureau of Narcotic
Enforcement, Prescription Drug Monitoring Program, 2008-2012

15% of prescribers write 83% of
opioid analgesic prescriptions
48%
2%
37%
15%
14%
49%
1%
34%
0%
10%
20%
30%
40%
50%
60%
70%
80%
90%
100%
Prescribers Prescriptions
Prescribing frequency
Very FrequentPrescribers530-10,185 RX/year
FrequentPrescribers50-529 RX/year
OccasionalPrescribers4-49 RX/year
Rare Prescribers1-3 RX/year
Prescriptions filled by NYC residents, 2012
15%
83%
Perc
en
t
Source: New York State Department of Health, Bureau of Narcotic
Enforcement, Prescription Drug Monitoring Program, 2012 11

0%
1%
2%
3%
4%
5%
2002-03 2004-05 2006-07 2008-09 2010-11
Perc
en
t
Self-reported year of use (two year average)
Opioid Analgesics
Cocaine
Heroin
Benzodiazepines
Self-reported drug use in past 12 months, NYC, aged 12+
Most Commonly Used Drugs Are
Opioid Analgesics
Source: Substance Abuse Mental Health Services Administration, Office of
Applied Studies, National Surveys on Drug Use and Health, 2002-2009 12

NYC MAYOR’S TASK FORCE ON
PRESCRIPTION PAINKILLER
ABUSE
Ian Hartman-O’Connell, Senior Advisor for Health Policy
New York City Office of the Mayor

NYC Mayor’s Task Force on
Prescription Painkiller Abuse • Multi-agency task force co-chaired by Deputy Mayor for Health
and Human Services and Criminal Justice Coordinator
• Mission: Implement coordinated strategies for responding to the
growth of opioid painkiller misuse and diversion in NYC
• Representatives from public health, law enforcement, and
criminal justice agencies including:
• NYC Department of Health and Mental Hygiene
• NYC Police Department
• NYC Health and Hospitals Corporation
• Human Resources Administration (City’s Medicaid agency)
• Richmond County District Attorney’s Office
• Drug Enforcement Administration
• Office of the Special Narcotics Prosecutor
• NY/NJ HIDTA

Task Force Work Groups
• January 2013 report
• PDMP Reform: I-STOP
• Provider Trainings
– ED prescribing guidelines
• Public Education
15

PUBLIC HEALTH/PUBLIC
SAFETY INITIATIVES-RXSTAT
Chauncey Parker, Director
New York/New Jersey High Intensity Drug Trafficking Area
Dr. Denise Paone, Director of Research and Surveillance
New York City Department of Health and Mental Hygiene

• Facilitating accurate and timely analysis of
public health and public safety data
• Targeting resources and coordinating
efforts to provide the most effective and
efficient City response
• Providing measures to track strategies
Reduce prescription drug misuse in NYC and associated health and safety consequences by:
RxStat Goals “COMPSTAT for Prescription Drug Abuse”
17

RxStat “COMPSTAT for Prescription Drug Abuse”
• Public Health & Public Safety Collaboration
• “Real-time” (enhanced) surveillance
• Participants and stakeholders at city, state,
and federal organizations
• Monthly RxStat meetings with key
stakeholders
18

Enhanced Surveillance Efforts
Prescribing Quarterly PMP data*, Quarterly DEA
Data
Morbidity Daily ED Visits, Daily NYC PCC Calls,
Quarterly Treatment Admissions
Mortality Monthly Monitoring, OCME Bottle
Project
Crime & Diversion
Monthly Prosecutions*, NYPD Data, Quarterly DEA Losses, Rx Crimes*
*Discussed in more detail later in the presentation.
Prevalence & Intelligence
Qualitative Component, Data Analytics/Mapping
19

APPLICATION IN PUBLIC
SAFETY
Chauncey Parker, Director
New York/New Jersey High Intensity Drug Trafficking Area

New York County 2012 Drug
Prosecutions by Drug Type (reflecting 11,712 instances of drugs in 10,559 prosecutions)
“Benzodiazepines” includes Alprazolam, Clonazepam, Diazepam, etc. “Opioid Analgesics” includes pure & compound versions of Oxycodone, Hydrocodone, Oxymorphone, Morphine, etc. (excludes Methadone) . 21

Rx Crimes
22
• Central repository for Rx-related Robberies/Burglaries, direct LEA access to police reports.
• Fill cross-border/interagency sharing gap.
• Allow proactive analysis: — Emerging crime patterns
(e.g., through the roof) — Security alerts — Sources of drugs — Targeted drugs

APPLICATION IN PUBLIC
HEALTH-HIGHLIGHTING PMP
Dr. Denise Paone, Director of Research and Surveillance
New York City Department of Health and Mental Hygiene

PMP: Background • Tool utilized for reducing prescription drug misuse and diversion
– Drug Epidemic Warning System
– Drug Diversion & Fraud Investigative Tool
• Collect, monitor, and analyze dispensing data – Avoidance of Drug Interactions
– Patient Care Tool
– Identification & Prevention of “Doctor Shopping”*
• Data used to support states’ efforts in education, research, enforcement and abuse prevention
• Not meant to infringe on the legitimate prescribing of controlled substances
• Public Health surveillance tool
*Doctor Shopping: Practice of obtaining multiple controlled substance prescriptions from multiple doctors
Source: http://www.pmpalliance.org/content/prescription-monitoring-frequently-asked-questions-faq

A State Law Called I-STOP • I-STOP = Internet System for Tracking Over-
Prescribing Act
• New state legislation went into effect August 27, 2013 to re-vamp NYS PMP
– Can access all controlled substances during previous 6 months or more (exact time period TBA)
– Providers required to check when prescribing controlled substance
– Can authorize qualified designee to check on their behalf
– Pharmacists can now view
– Real-time data

Rate of opioid analgesic
prescriptions by borough, NYC 2012
0
10,000
20,000
30,000
40,000
50,000
60,000
NYC Bronx Brooklyn Manhattan Queens Staten Island
Pre
sc
rip
tio
ns
fille
d a
nn
ua
lly p
er
10
0,0
00
po
pu
lati
on
Note: Schedule II opioids + hydrocodone
Source: New York State Department of Health, Bureau of Narcotic
Enforcement, Prescription Drug Monitoring Program, 2012
27

Residents of Manhattan have the
lowest median days supply of all
New Yorkers, 2012
0
5
10
15
20
25
30
NYC Bronx Brooklyn Manhattan Queens Staten Island
Me
dia
n D
ays
Su
pp
ly,
Note: Schedule II opioids + hydrocodone
Source: New York State Department of Health, Bureau of Narcotic
Enforcement, Prescription Drug Monitoring Program, 2012

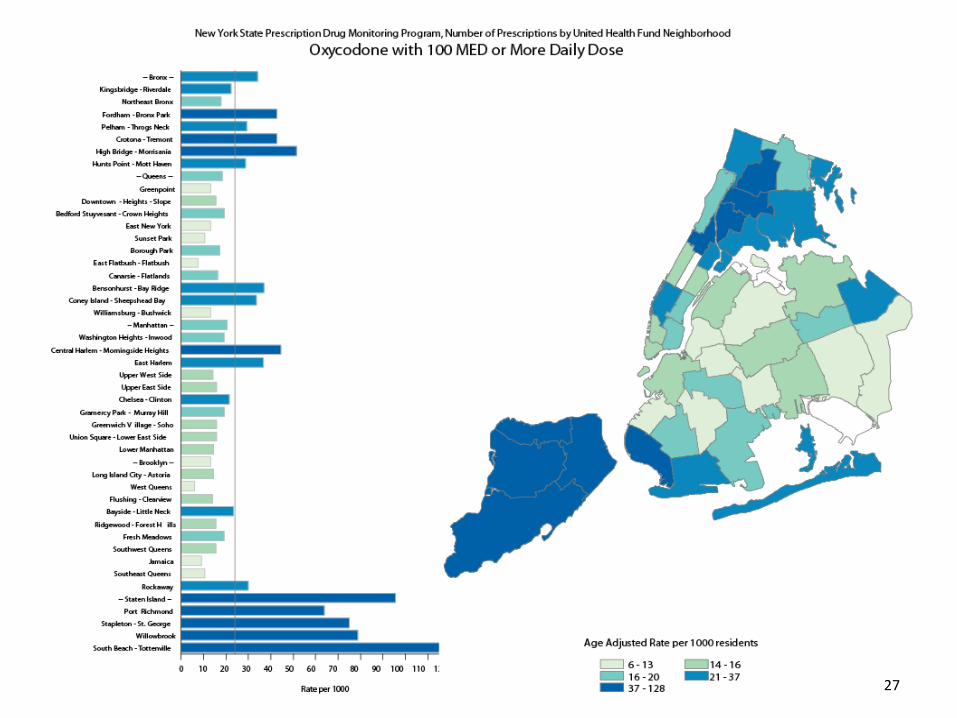
Residents of Staten Island and the
Bronx have the highest proportion
of prescription >100 MED
0%
5%
10%
15%
20%
25%
NYC Bronx Brooklyn Manhattan Queens Staten Island
% o
f o
pio
id p
res
cri
pti
on
s t
ha
t are
fo
r >
10
0 m
orp
hin
e
eq
uiv
ale
nt
mg
s o
f o
pio
ids
Source: New York State Department of Health, Bureau of Narcotic
Enforcement, Prescription Drug Monitoring Program, 2012
Note: Schedule II opioids + hydrocodone

Doctor Shopper
• Defined as patients with prescriptions from 4 prescribers and filled at 4 pharmacies in 20101
• 2 million prescriptions filled by 723,915 unique patients
– 1.1%, or 7,915 patients were defined as doctor shoppers
– Filled 153,566 prescriptions (7.6% of all prescription in 2010)
– Visited 4,127 unique prescribers
– Visited 1,711 unique pharmacies
1Katz, N, Panas, L, Kim, M et al. (2010). Usefulness of prescription monitoring programs for surveillance—analysis of schedule II opioid prescription data in Massachusetts, 1996-2006. Pharmacoepidemiology and Drug Safety, 19, 115-123
Source: New York State Department of Health, Bureau of Narcotic Enforcement, Prescription Drug Monitoring Program, 2012
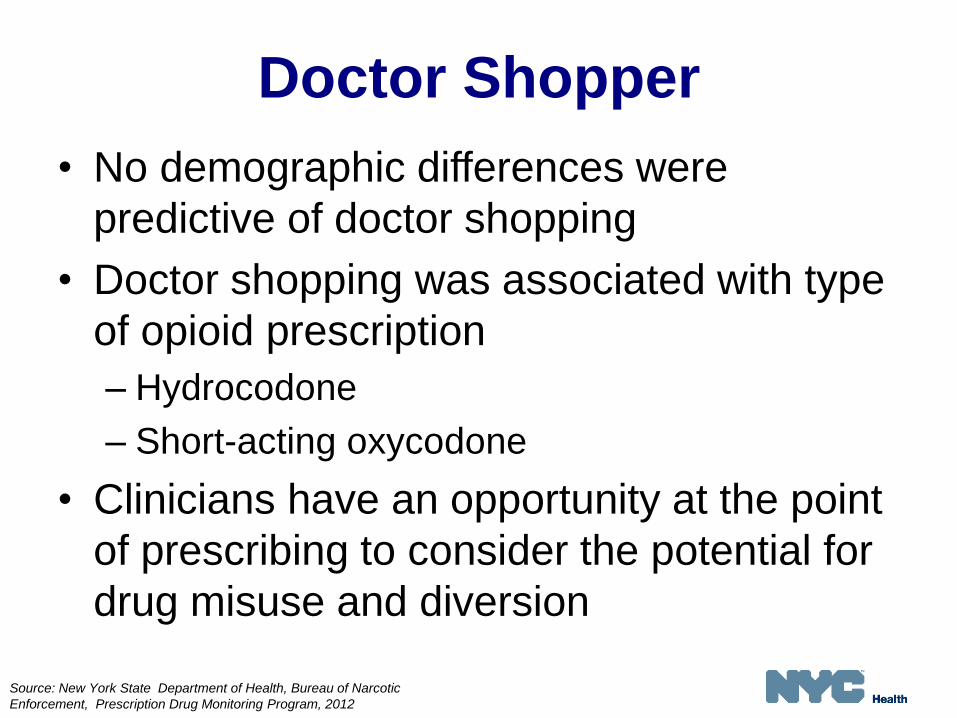
Doctor Shopper
• No demographic differences were
predictive of doctor shopping
• Doctor shopping was associated with type
of opioid prescription
– Hydrocodone
– Short-acting oxycodone
• Clinicians have an opportunity at the point
of prescribing to consider the potential for
drug misuse and diversion
Source: New York State Department of Health, Bureau of Narcotic
Enforcement, Prescription Drug Monitoring Program, 2012

Neighborhoods with High Rates of
Opioid Prescription Fills Also Have
High Rates of Opioid Overdose Death
*Paone D, Bradley O’Brien D, Shah S, Heller D. Opioid analgesics in New York City: misuse, morbidity and mortality update. Epi Data Brief. April 2011. Available at http://www.nyc.gov/html/doh/downloads/pdf/epi/epi-data-brief.pdf .

RxStat “COMPSTAT for Prescription Drug Abuse”
• RxStat creates a platform for collaborative
problem solving to reduce prescription
drug abuse
• RxStat uses PMP in conjunction with other
data sources to reduce the public health
and public safety consequences of opioid
analgesic misuse

DATA DRIVEN POLICY IN NYC
Dr. Denise Paone, Director of Research and Surveillance
New York City Department of Health and Mental Hygiene

Opioid Prescribing Guidelines
35

Emergency Department (ED) Opioid
Prescribing Guidelines: Goal and
Rationale • Establish standards for prescribing.
• Balance pain treatment with reducing
opioid analgesic misuse.
• Why Emergency Departments?
– Pain is a common presentation in EDs.
– Opioid analgesics are commonly prescribed in
EDs, although EDs not the main source.
– One component of a multi-pronged
approach.
36
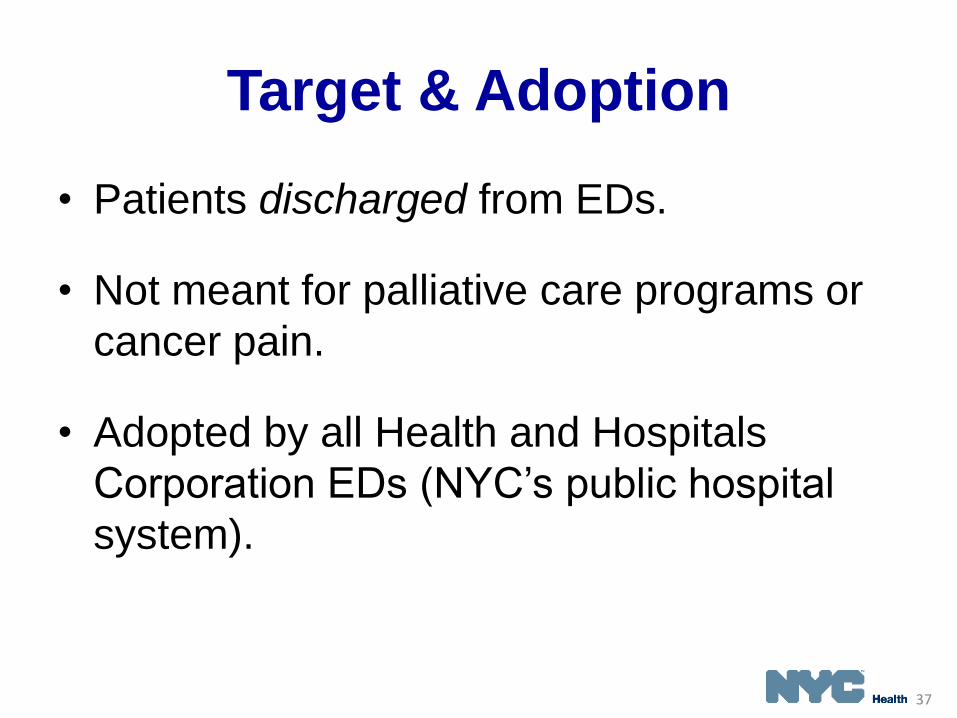
Target & Adoption
• Patients discharged from EDs.
• Not meant for palliative care programs or
cancer pain.
• Adopted by all Health and Hospitals
Corporation EDs (NYC’s public hospital
system).
37

ED Opioid Prescribing Guidelines
38

Staten Island public health detailing
campaign on opioid analgesics • 1-on-1 “detailing” visits
from DOHMH representatives
• Deliver key prescribing recommendations, clinical tools, patient education materials
• Aim to reach ~1,000 Staten Island physicians, NPs, PAs
• June–August 2013
Naloxone

Naloxone (or Narcan)
• An opioid antagonist: temporarily reverses opioid-induced sedation and respiratory depression
• Takes effect within 2 - 8 minutes
• Causes sudden withdrawal in the opioid-dependent person – an unpleasant experience
• Can’t get high from it
• Has no effect if an opiate is not present
• Routinely used by EMS (but in larger doses)

“Opioid Overdose Prevention Program” NYS Public Health Law
(April 1, 2006)
“The purchase, acquisition, possession or use of
an opioid antagonist … shall not constitute the
unlawful practice of a profession.
Use of an opioid antagonist pursuant to this
section shall be considered first aid or
emergency treatment for the purpose of any
statute relating to liability…”
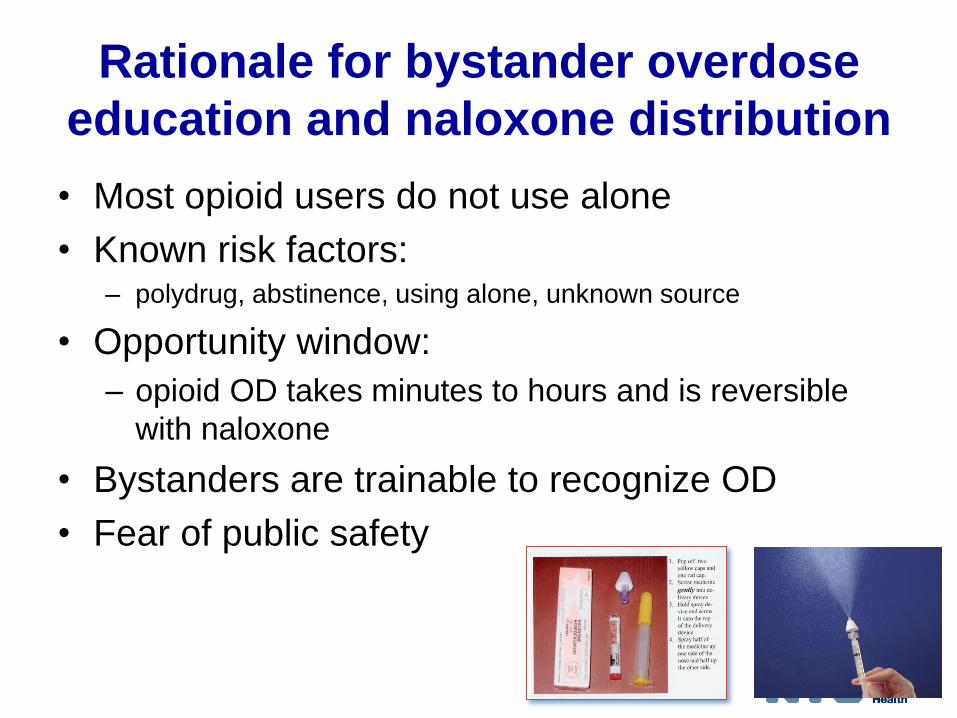
Rationale for bystander overdose
education and naloxone distribution
• Most opioid users do not use alone
• Known risk factors: – polydrug, abstinence, using alone, unknown source
• Opportunity window:
– opioid OD takes minutes to hours and is reversible
with naloxone
• Bystanders are trainable to recognize OD
• Fear of public safety

Overview of OD Prevention
Programs in New York City and State
• 80+ programs registered in New York State
– 51 of them are in NYC
• Programs that dispense naloxone provide:
– OD prevention trainings
– Trained participants receive a prescription and OD prevention kit
including naloxone
• In 2009, NYC DOHMH began dispensing intranasal
naloxone
• In 2013, New York State Pilot program of EMT carrying
and administering naloxone in the field

• Face mask for rescue breathing
• 2 doses of naloxone
• 2 intranasal devices
• Brochure reviewing OD and rescue steps
Intranasal Naloxone Kit:

NYC-Funded Programs
Providing Naloxone:
• 16 Syringe Access Programs in NYC required to
provide overdose prevention with naloxone
• Department of Homeless Services supports
naloxone provision on-site at targeted homeless
shelters
– 930 shelter staff, street outreach staff and Peace
Officers trained

Program Successes in NYC
• 10,659 IN kits (2x naloxone doses) distributed since January 1, 2009
• 243 reversals reported to DOHMH using IN naloxone since January 1, 2010
• > 500 IM reversals reported by trained overdose responders

Next Steps
• Testimonials – new media campaign
• High-dose prescriber education
• Assessment of buprenorphine availability
• Consider co-prescribing – opioids and
naloxone
• Prospective study: naloxone
• Evaluation of Clinical guidelines

PUBLIC HEALTH & PUBLIC
SAFETY PARTNERSHIPS
Ian Hartman-O’Connell, Senior Advisor for Health Policy
New York City Office of the Mayor

Challenges & Conclusions • Legality of prescription drugs
• Complexities of regulation
• Data availability/data silos
• Terminology across fields
• Addressing misinformation
• Developing collaborative approaches
Common Goal - Reduce prescription drug abuse and the associated public health and public safety consequences.
50

Questions
51