s : s - home | village of downers grove 2016-6723... · industry statistics) ... ogden avenue...
TRANSCRIPT

VILLAGE OF DOWNERS GROVEReport for the Village Council Meeting
SUBJECT: SUBMITTED BY:
Economic Development Corporation Report on Enhancing Sales Tax Base
David FieldmanVillage Manager
SYNOPSIS
A report from the Economic Development Corporation regarding the enhancement of the sales tax base
STRATEGIC PLAN ALIGNMENT
The goals for 2015-2017 include Diverse Local Economy. Create an Economic Development Plan to Enhance the Sales Tax Base is a Top Priority Action Item.
FISCAL IMPACT
N/A
RECOMMENDATION
Discussion by the Village Council
BACKGROUND
In 2015, the Village Council identified Create an Economic Development Plan to Enhance the Sales Tax Base as a Top Priority Action Item. The goal of the plan is to increase the Village’s sales tax base (gross annual retail sales measured in dollars) and total sales tax revenue. The plan is scheduled to be completed no later than March 31, 2016.
To prepare the plan, the Village requested the assistance of the Downers Grove Economic Development Corporation (EDC), a non-profit partner of the Village whose mission is to enhance the economy of Downers Grove through the retention, expansion and attraction of business.
This plan is based on an AECOM Competitive Retail Alignment Study commissioned by the EDC. AECOM completed a retail market analysis and assessment of Downers Grove’s performance in the trade area. The complete report is attached. In addition, staff prepared and has attached a report on the 2015 sales tax performance.
This plan includes the following: Key Takeaways and Conclusions from the AECOM Report Recommended Retail Segments for Attraction and Retention Strategies for Attraction and Retention Recommended Tools for Attraction and Retention
3/22/20163/22/20163/22/20163/22/2016
REP 2016-6723 Page 1 of 59

Locations for Retail Development
ATTACHMENTS
EDC PlanAECOM ReportSales Tax Report
REP 2016-6723 Page 2 of 59

Economic Development Plan to Enhance the Sales Tax Base
March 22, 2016
REP 2016-6723 Page 3 of 59
Introduction and Background In 2015, the Village Council identified Create an Economic Development Plan to Enhance the Sales Tax Base as a Top Priority Action Item. The goal of the plan is to increase the Village’s sales tax base (gross annual retail sales measured in dollars) and total sales tax revenue. The plan is scheduled to be completed no later than March 31, 2016. To prepare the plan, the Village requested the assistance of the Downers Grove Economic Development Corporation (EDC), a nonprofit partner of the Village whose mission is to enhance the economy of Downers Grove through the retention, expansion and attraction of business. This plan is based on an AECOM Competitive Retail Alignment Study commissioned by the EDC. AECOM completed a retail market analysis and assessment of Downers Grove’s performance in the trade area. The complete report is included in the appendix. This plan includes the following:
Key Takeaways and Conclusions from the AECOM Report Recommended Retail Segments for Attraction and Retention Strategies for Attraction and Retention Recommended Tools for Attraction and Retention Locations for Retail Development
EDC Strategic Plan Alignment This plan is consistent with and furthers several high priorities regarding commercial development identified in the EDC’s strategic plan.
Implement a strategy for the attraction of national tenants, and the redevelopment of catalyst sites, on Butterfield Road.
Implement a strategy for the attraction of tenants, and the redevelopment of catalyst sites, on Ogden Avenue
Implement a strategy for the attraction of tenants, and the redevelopment of commercial centers on 75th and 63rd Streets
Downers Grove Comprehensive Plan Alignment In 2016 the Village will also complete a fiveyear update to its Comprehensive Plan. This Economic Development Plan to Enhance the Sales Tax Base supports the primary goal of the Commercial Areas Plan in the Comprehensive Plan to “retain, attract and expand highquality commercial retailers, service providers and employers by addressing the location, size and appearance of commercial area.” The Comprehensive Plan encourages revitalization and modernization of the Village’s commercial corridors.
2
REP 2016-6723 Page 4 of 59

The Economic Development Plan to Enhance the Sales Tax Base will:
Direct the Village’s and DGEDC’s retail business attraction and retention efforts Be reflected in the update to the Village’s Comprehensive Plan
The Art Van furniture store on Butterfield Road opened in 2015. Funds from a sales tax rebate were used to help pay for a complete renovation of the vacant former Home Depot Expo building.
3
REP 2016-6723 Page 5 of 59

Key Takeaways and Conclusions from the AECOM Report AECOM conducted its analysis using available quantitative data (national economic data, real estate and industry statistics) and qualitative stakeholder interviews. The full report is included as an appendix to this document. The Village and EDC have identified the following key takeaways:
Downers Grove is in a strong retail trade area where retailers want to be located. The existing inventory of retail space (buildings and centers) is reaching obsolescence. Future improvements will be infill or redevelopment (Downer Grove does not have a significant
number of vacant or undeveloped parcels). Infill and redevelopment is more costly and and carries a higher risk for developers. The Village
and the EDC can play a role in attracting and retaining retailers by reducing the risk and cost to developers.
The key conclusion of the report is that retailers want to locate in Downers Grove, but appropriate, easytodevelop sites are not available.
An existing older shopping center in Downers Grove
4
REP 2016-6723 Page 6 of 59

AECOM Competitive Retail Alignment Study Selected Core Findings
The Core Trade area around Downers Grove represents one of the key concentrations of
income in the Chicago Metropolitan Area; in 2014 this area generated more than $7 billion in retail sales.
Downers Grove is located within the larger East / West submarket defined by CoStar, a
submarket that supports more than 76 million square feet of retail space, representing about 15% of total regional retail inventory (about 525 million square feet). It is the third largest retail Submarket in the entire region by inventory.
Reflective of lower vacancy levels, Downers Grove has seen strong net absorption since
2009, above 200,000 square feet, second only to Bolingbrook since 2009.
While retail vacancy levels in Downers Grove (5%) are well below regional averages, the community is increasingly built out, with little vacant land remaining and a large inventory of older (1970 to 1990) and arguably obsolete commercial buildings located along corridors such as Ogden Avenue that are not up to current national chain expectations; Corridors such as 75th Street face similar challenges.
Put another way, while retail markets have changed dramatically, Downers Grove retail
centers remain locked in an earlier time period as compared to neighboring communities.
For Downers Grove, Automotive has seen the strongest rate of growth in retail sales since 2009, faster than the trade area.
In Downers Grove, retail sectors with above average sales capture include Food, Building
Materials, Automotive, Drugs & Miscellaneous Retail, Furniture & Household Furnishings, and Drinking & Eating Places. Apparel and General Merchandise sales are under represented.
5
REP 2016-6723 Page 7 of 59

The Village’s current sales tax base, or total annual retail sales, is just over $1.24 billion. Downers Grove is located in a trade area consisting of Bolingbrook, Darien, Hinsdale, Lisle, Lombard, Oak Brook, Westmont and Woodridge. Total annual retail sales in this trade area is approximately $7.3 billion. Therefore, Downers Grove captures about 17% of the total trade area sales. Downers Grove Trade Area
6
REP 2016-6723 Page 8 of 59

These municipalities compete for retail sales that occur within the trade area. Downers Grove has about a 17% share of the retail sales within the trade area.
Retail Sales By Store Type, Trade Area / Downers Grove Market Share
Retail Category Trade Area Downers Grove Downers Grove Market Share
General Merchandise $793,700,445 $44,570,147 5.6%
Food $561,253,344 $134,094,401 23.9%
Drinking and Eating Places $798,502,921 $137,168,211 17.2%
Apparel $454,521,738 $29,117,830 6.4%
Furniture & H.H. & Radio $593,954,630 $102,900,471 17.3%
Lumber, Bldg, Hardware $245,684,965 $56,928,114 23.2%
Automotive & Filling Stations
$1,774,235,223
$328,130,391 18.5%
Drugs & Misc. Retail $1,136,964,630
$269,609,365 23.7%
Agriculture & All Others $733,713,839 $128,014,318 17.4%
Manufacturers $141,761,390 $10,473,620 7.4%
Totals $7,300,343,855
$1,241,006,868
17%
Source: Illinois Department of Revenue
Competing for Retail Sales The municipalities in the trade area are competing for their share of the total retail sales. Downers Grove’s retail attraction and retention efforts should enhance and improve the Village’s competitive advantages and address any disadvantages.
7
REP 2016-6723 Page 9 of 59

A municipality’s performance can be measured by a pull factor. A pull factor greater than 1.0 indicates that the municipality is generating more than its fair share of retail sales . A pull factor less than 1.0 indicates the municipality is generating less than its fair share of retail sales. Downers Grove has pull factors above one in all retail sectors except General Merchandise and Apparel. Downers Grove Pull Factors, 2000 to 2014
8
REP 2016-6723 Page 10 of 59
Recommended Retail Segments for Attraction and Retention The trade area in which Downers Grove is located (from Bolingbrook northeast to Oak Brook) is a $7.3 billion annual market. The Village should attract retailers in the following segments:
Automobile Dealerships: This category (Automotive and Filling Stations) is the Village’s strongest generator of sales tax revenue and is the trade area’s largest category. The Village holds an 18.5% share of the $1.8 billion market in the trade area. Ogden Avenue remains a desirable location and the market is trending upward. The Village and EDC should identify opportunities for auto dealers to work collectively to enhance Ogden Avenue as a destination for dealerships.
General Merchandise: General Merchandise retailers are commonly known as ‘Big Box’
retailers, like WalMart, Target and Meijer. This category generates nearly $800 million in sales annually and the Downers Grove share is disproportionately small (5.6% or $44.6 million). The weak performance shows that Downers Grove is ‘leaking’ in this category, which means that residents are going to other towns for General Merchandise.
Furniture and Household Goods: This category encompasses furniture and electronics. The
Village’s performance in this category slid after major retailers closed (Expo Design Center, Circuit City) but recent sales tax returns show that the addition of Art Van has bolstered the performance. This category presents an opportunity for ‘clustering’ of multiple complementary retailers.
Drinking and Eating: Retail sales related to restaurants remained relatively steady during the
recession and continue to perform well in Downers Grove (17.2% market share). This category works for infill development because restaurants can locate in all types of commercial areas.
Drugs and Miscellaneous Retail: After the automotive category, Downers Grove’s secondbest
performing category is Drugs and Miscellaneous Retail. The market is trending upward and Downers Grove has a 23.7% share of $1.13 billion market. This category is also attractive for infill development because it can be located in all commercial areas.
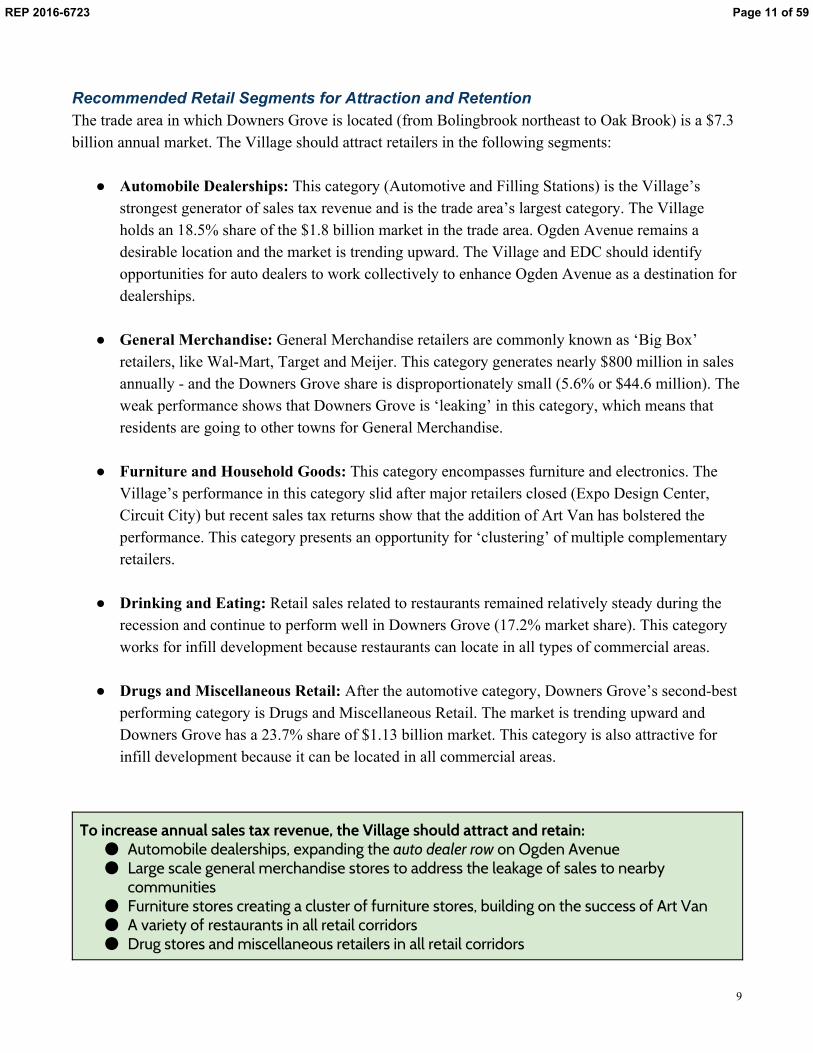
To increase annual sales tax revenue, the Village should attract and retain: Automobile dealerships, expanding the auto dealer row on Ogden Avenue Large scale general merchandise stores to address the leakage of sales to nearby
communities Furniture stores creating a cluster of furniture stores, building on the success of Art Van A variety of restaurants in all retail corridors Drug stores and miscellaneous retailers in all retail corridors
9
REP 2016-6723 Page 11 of 59

Strategies for Attraction and Retention This section presents recommended strategies for attracting and retaining the retail segments described above, given the key obstacles and challenges to infill development in the AECOM report.
Overcoming obstacles and risk that currently deter large-scale change along the Village’s commercial corridors will require additional actions by the Village. Actions should enhance and create competitive advantages, recognizing that municipalities within the retail trade area are competing for limited sales.
1. Facilitate Aggregation of Land to Create Sites that Meet Retailer Needs: The Village should
take an active role in overcoming the challenges of small and obsolete sites in major retail corridors. Many of these challenges are identified in the SWOT analysis in the AECOM report. This can be done by identifying areas where land could be acquired and then working with developers and landowners to facilitate the acquisition or by actively buying, assembling and selling land.
Identify parcels that could be acquired for retail redevelopments Conduct an inventory/analysis of parcels along Ogden Avenue Ensure that the proposed retail use of these parcels is accurately reflected in
official documents including the Comprehensive Plan and Zoning Ordinance Communicate with current property owners and facilitate the sale to retail developers
Private sector transactions are the preferred option Acquire land and assemble parcels that meet retailers’ size and location requirements
Create large scale redevelopment sites at street intersections or with direct access to intersections (creating “hard corner” developments)
Assemble and sell the land for redevelopment quickly to avoid being a landlord Village acquisition of land should be used as a secondary option (private sector
transactions are the preferred option) 2. Make Building and Zoning Entitlement Process Easy and Predictable: Developers and
retailers should feel confident that building and zoning review and approval process will be predictable and easy to understand. This does not mean that the building and zoning code requirements should be reduced. The code requirements and the likely outcome of seeking building and zoning permits should be known in advance of starting a project. Update the Comprehensive Plan to reflect properties that are available for retail
development Consider rezoning properties that are identified for retail development but not currently
zoned for such uses Demonstrate to the retail development industry that entitlement process is predictable
10
REP 2016-6723 Page 12 of 59
3. Consider Providing Financial Assistance: The Village should consider providing financial
assistance to reduce the high cost of redeveloping sites with sales tax producing tenants. Often times financial assistance pays for public improvements such as streets, traffic signals and watermains. Provide financial incentives that reduce the cost of land and other items to an amount
similar to the cost of land and other items in other portions of the trade area Consider using a variety of economic development tools to provide the financial
assistance 4. Quantify and Consider All Benefits and Revenue: The success of a redevelopment project
should have multiple measures, including increase in taxable value of the property, increases in other revenues as a result of the redevelopment (sales tax, home rule sales tax), revenue from the sale of land to a developer, and whether the project furthers other community values, such as redeveloping a dilapidated site or eyesore.
Identify and quantify all direct and indirect revenues generated by the retail development Identify and qualify all nonfinancial benefits of the retail development Compare the revenues and benefits to the amount of financial assistance to be provided Consider the costs and benefits and make financial assistance decisions on a case by case
basis 5. Prioritize Efforts: The Village should focus efforts on projects that have a high potential of
significantly increasing sales tax revenue. Focus attraction efforts on largescale, high return projects Continue to facilitate smaller scale retail projects as the opportunities become available
6. Prepare a Key Focus Area Plan for 63rd and Woodward As Part of Comprehensive Plan
Update: The existing retail center at 63rd and Woodward suffers from functional obsolescence. The commercial area to the west in Woodridge has substantial vacancies. This portion of 63rd Street should be studied as a Key Focus Area during the Comprehensive Plan Update to envision an appropriate recommended future land use that meets the changing retail environment.
7. Explore Opportunities to Attract Sales Tax Generating Uses to Ellsworth Business Park
and Oak Grove Commons: The Village should further study opportunities to attract businesses that generate retail sales tax revenue and do not fit in typical commercial retail developments. Examples of these types of uses include micro breweries, warehouses with a retail outlet and point of sale businesses.
11
REP 2016-6723 Page 13 of 59
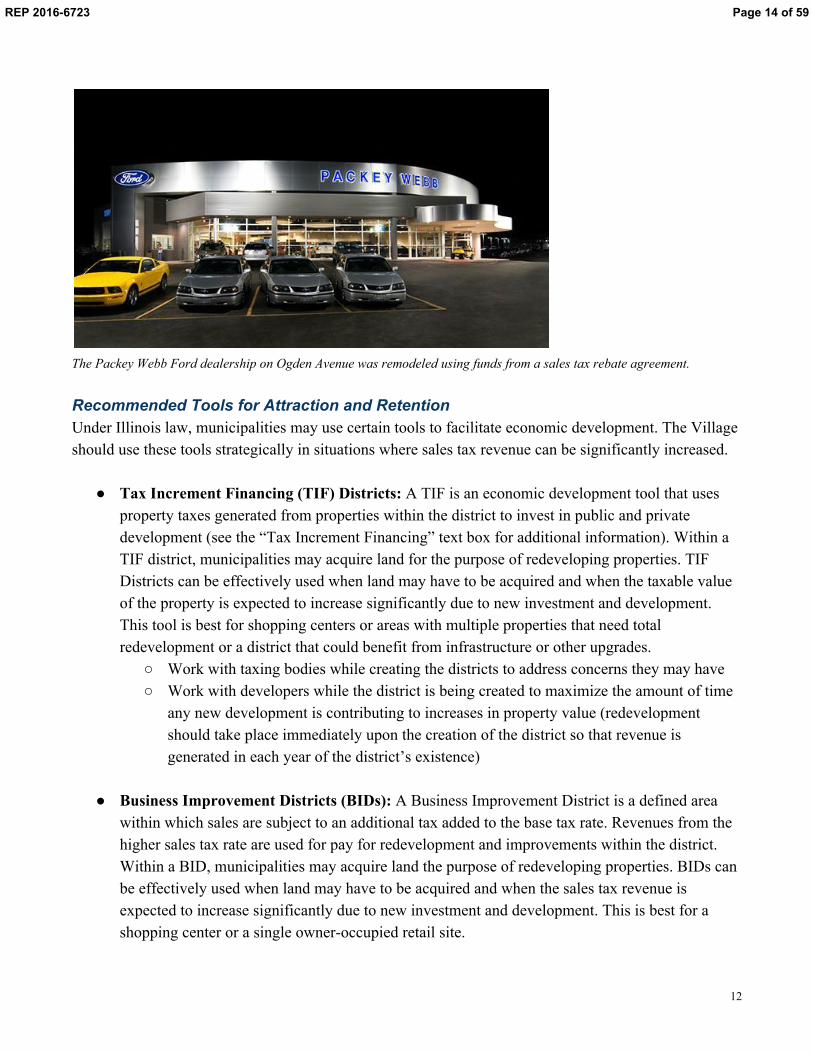
The Packey Webb Ford dealership on Ogden Avenue was remodeled using funds from a sales tax rebate agreement. Recommended Tools for Attraction and Retention Under Illinois law, municipalities may use certain tools to facilitate economic development. The Village should use these tools strategically in situations where sales tax revenue can be significantly increased.
Tax Increment Financing (TIF) Districts: A TIF is an economic development tool that uses property taxes generated from properties within the district to invest in public and private development (see the “Tax Increment Financing” text box for additional information). Within a TIF district, municipalities may acquire land for the purpose of redeveloping properties. TIF Districts can be effectively used when land may have to be acquired and when the taxable value of the property is expected to increase significantly due to new investment and development. This tool is best for shopping centers or areas with multiple properties that need total redevelopment or a district that could benefit from infrastructure or other upgrades.
Work with taxing bodies while creating the districts to address concerns they may have Work with developers while the district is being created to maximize the amount of time
any new development is contributing to increases in property value (redevelopment should take place immediately upon the creation of the district so that revenue is generated in each year of the district’s existence)
Business Improvement Districts (BIDs): A Business Improvement District is a defined area
within which sales are subject to an additional tax added to the base tax rate. Revenues from the higher sales tax rate are used for pay for redevelopment and improvements within the district. Within a BID, municipalities may acquire land the purpose of redeveloping properties. BIDs can be effectively used when land may have to be acquired and when the sales tax revenue is expected to increase significantly due to new investment and development. This is best for a shopping center or a single owneroccupied retail site.
12
REP 2016-6723 Page 14 of 59

Work with developers while the district is being created to maximize the amount of time any new development is contributing to increases in sales tax revenue (redevelopment should take place immediately upon the creation of the district so that revenue is generated in each year of the district’s existence)
Sales Tax Rebate Agreements: A sales tax rebate agreement returns a portion of the sales tax
generated to the retailer or developer. The revenue from the rebated sales taxes are used to offset the cost of acquiring or making improvements to land. Sales tax rebates work well for projects consisting of a single, high sales tax producing tenant.
Use for retailers that generate large amounts of sales tax revenue Review and consider agreements on a casebycase basis
Tax Increment Financing
Tax Increment Financing is simple in concept. TIF calls for local taxing bodies to make a joint investment in the development or redevelopment of an area, with the intent that any short term gains be reinvested and leveraged so that all the taxing bodies will receive larger financial gains in the future. The funds for this investment do not come from current revenues, but from future tax revenues, not otherwise expected to occur. These new revenues are generated by increased public and private investment in identified, underperforming, areas. When a TIF district is created, the value of the property in the area is established as the “base” amount. The property taxes paid on this base amount continue to go to the various taxing bodies as they always had. It is the growth of the value of the property over the base that generates the tax increment. This increment is collected into a special fund for use by the Village to make additional investments in the TIF district. This reinvestment generates additional growth in property value, which results in even more revenue growth for reinvestment. In this way the TIF redevelopment project creates a vital cycle, increasing development and redevelopment in the area, such that when the TIF project ends — and Illinois law allows a TIF project to exist for a period of up to 23 years — all of the taxing bodies benefit from the new growth. A tax increment is the difference between the amount of property tax revenue generated before TIF district designation and the amount of property tax revenue generated after designation. Establishment of a TIF does not reduce property tax revenues available to taxing bodies as the property taxes collected on properties included in the TIF at the time of designation continue to be distributed to them in the same manner as they would if the TIF did not exist. Only the new property taxes generated by the incremental increase in the value of these properties after the TIF is established are available for investment in the district.
13
REP 2016-6723 Page 15 of 59

14
REP 2016-6723 Page 16 of 59
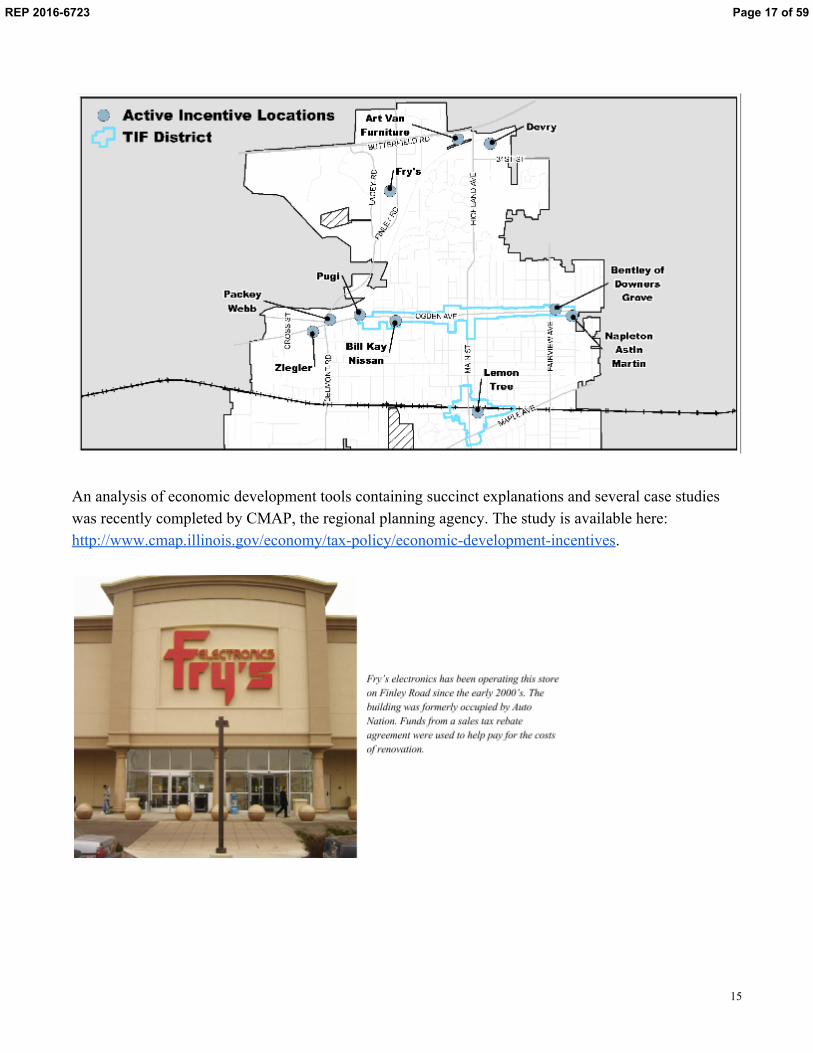
An analysis of economic development tools containing succinct explanations and several case studies was recently completed by CMAP, the regional planning agency. The study is available here: http://www.cmap.illinois.gov/economy/taxpolicy/economicdevelopmentincentives.
15
REP 2016-6723 Page 17 of 59

Each economic development tool offers unique attributes that should be considered
Tool How It Works Best Used For Pros Cons
Tax Increment Financing
Uses increases in property taxes paid by properties within the district to invest in public and private development TIFs run for 23 years
Shopping centers or areas with multiple properties that need total redevelopment or a district that could benefit from infrastructure or other upgrades
Potential to generate larger amounts of revenue Can facilitate large scale redevelopment
Impacts property tax revenues for other taxing bodies Lengthy approval process
Business Improvement District
Retail sales within an approved district are taxed at a higher rate than normal. The revenue from the higher sales tax is reinvested on improvements in the district. BIDs run for 23 years
Single owneroccupied retail site or shopping center with large anchor store
Potential to generate large amounts of revenue Can facilitate large scale redevelopment
Additional sales tax rate may negatively affect tenant attraction and retention Lengthy approval process
Sales Tax Rebate Agreement
Village returns a portion of the sales tax to the retailer in exchange for a level of performance or agreement to make improvements
Single, high sales tax producing tenant such as auto dealerships
Potential to generate significant returns for both the Village and retailer Quick, easy approval process
Limited applicability Village and retailer must share the retail sales tax revenue; there is no new revenue source created
16
REP 2016-6723 Page 18 of 59

Locations for Retail Development As stated in the AECOM report, each commercial corridor has a “unique identity” offering different development opportunities. Strategies should be tailored to fit each corridor. Efforts to attract retailer should be focused on the locations below:
Catalyst sites identified in the Comprehensive Plan Southeast corner of Finley Road and Butterfield Road North side of Butterfield University Plaza Walnut and Ogden (frontage) Finley/Belmont and Ogden Avenue Stonewall Avenue and Ogden Avenue (north side) Stonewall Avenue and Ogden Avenue (south side) South Side between Middaugh and Saratoga Northwest corner of Ogden Avenue and Main Street Southeast corner of Ogden Avenue and Main Street Ogden between Fairview and Florence (North side)
Northwest corner of 75th Street and Lemont Road Portions of 63rd Street as identified in the Key Focus Area Plan to be completed with the
Comprehensive Plan update
University Plaza on Butterfield Road a catalyst site identified for retail redevelopment
17
REP 2016-6723 Page 19 of 59

DRAFT - Competitive Retail Alignment Study
Competitive Retail Alignment StudyDowners Grove Economic Development CorporationJanuary 14, 2016
REP 2016-6723 Page 20 of 59

DRAFT - Competitive Retail Alignment Study
Table of Contents
Core Findings......................................................................................................................................................................................................... 1
Approach & Introduction ....................................................................................................................................................................................... 4
Stakeholder Interview Insights............................................................................................................................................................................... 5
National Retail Sales Trends .................................................................................................................................................................................. 6
Economic Context ................................................................................................................................................................................................10
Trade Area Framework .........................................................................................................................................................................................11
Real Estate Inventory Analysis ..............................................................................................................................................................................25
Corridor Analysis ..................................................................................................................................................................................................28
Supporting Tables .................................................................................................................................................................................................35
Methodology ........................................................................................................................................................................................................36
Limiting Conditions ...............................................................................................................................................................................................37
REP 2016-6723 Page 21 of 59

Competitive Retail Alignment Study 1
Core FindingsRecession and Recovery
§ While 2015 is arguably the first “normal” year since 2004 in economic terms, from a retail standpoint,the total number of announced store closures in 2014 and 2015 (12,955) was only slightly less thanthe number of announced closures in 2009 (13,262).
§ While retail sales levels across Illinois have exceeded pre-recession thresholds, construction of newretail space and construction of new housing units remain “stuck” at levels well below long-termaverages.
§ While online retailing has dramatically increased its share of total US retail sales (from 2.5% to 10.4%since 2000), retail footprints are only beginning to adjust to the reality of “omni-channel” retailshopping.
Downers Grove / Trade Area
§ Using data from the Bureau of Labor Statistics the Village supports an estimated day-time populationof about 65,000 people, which includes an estimated 45,000 employees and about 20,500 residents.The evening population includes roughly 50,000 people.
§ Since the “Great Recession” Downers Grove has supplanted Oak Brook as the second largestemployment location in Du Page County, after Naperville.
§ Downers Grove Main Street was the third largest Metra Station for passenger boardings in 2014
§ The Core Trade area around Downers Grove represents one of the key concentrations of income inthe Chicago Metropolitan Area; in 2014 this area generated more than $7 billion in retail sales.
REP 2016-6723 Page 22 of 59

Competitive Retail Alignment Study 2
§ Downers Grove is located within the larger East / West submarket defined by CoStar, a submarketthat supports more than 76 million square feet of retail space, representing about 15% of totalregional retail inventory (about 525 million square feet). It is the third largest retail Submarket in theentire region by inventory.
§ In Downers Grove, retail sectors with above average sales capture include Food, Building Materials,Automotive, Drugs & Miscellaneous Retail, Furniture & Household Furnishings, and Drinking & EatingPlaces. Apparel and General Merchandise sales are under-performing in Downers Grove.
§ For Downers Grove, Automotive has seen the strongest rate of growth in retail sales since 2009,faster than the trade area, but slower than the state wide average.
§ Decline in manufacturing may simply mirror statewide trends; it could be an indicator of local troubleand impending land use change. As the Agriculture and All Others category reflects a variety ofactivities, more research is needed to understand drivers in this sector.
§ Reflective of lower vacancy levels, Downers Grove has seen strong net absorption since 2009, above200,000 square feet, second only to Bolingbrook since 2009.
§ While retail vacancy levels in Downers Grove (5%) are well below regional averages, the communityis increasingly built out, with little vacant land remaining and a large inventory of older (1970 to 1990)and arguably obsolete commercial buildings located along corridors such as Ogden Avenue that arenot up to current national chain expectations; Corridors such as 75th Street face not dissimilarchallenges.
§ Put another way, while retail markets have changed dramatically, the inventory of retail space inDowners Grove remains locked in an earlier time period.
REP 2016-6723 Page 23 of 59

Competitive Retail Alignment Study 3
ImplicationsThere are clear practical challenges in encouraging infill redevelopment along older commercialcorridors. Long- standing challenges link with the difficulty of getting financing for projects due toconstraints created by smaller (constrained) parcels, older / obsolete buildings, and delays created byextended entitlement and development review policies. These factors are a key reason why infillprojects are seen as more “risky”. Reflective of the real challenges of effecting change in these areas, anumber of successful policy responses have emerged:
§ Building public consensus and involvement upfront regarding density, mix of uses and trafficmanagement
§ Identifying an advocate organization to drive corridor revitalization
§ Identifying important sites and securing preliminary entitlements for their redevelopment
§ Encouraging density and mixed use at key nodes along corridors
§ Improve the appeal of infill sites with targeted infrastructure and access improvements
§ Marketing infill sites aggressively
§ Selective site acquisition and building demolition
§ Development of enhanced corridor transit (Bus Rapid Transit)
REP 2016-6723 Page 24 of 59
Competitive Retail Alignment Study 4
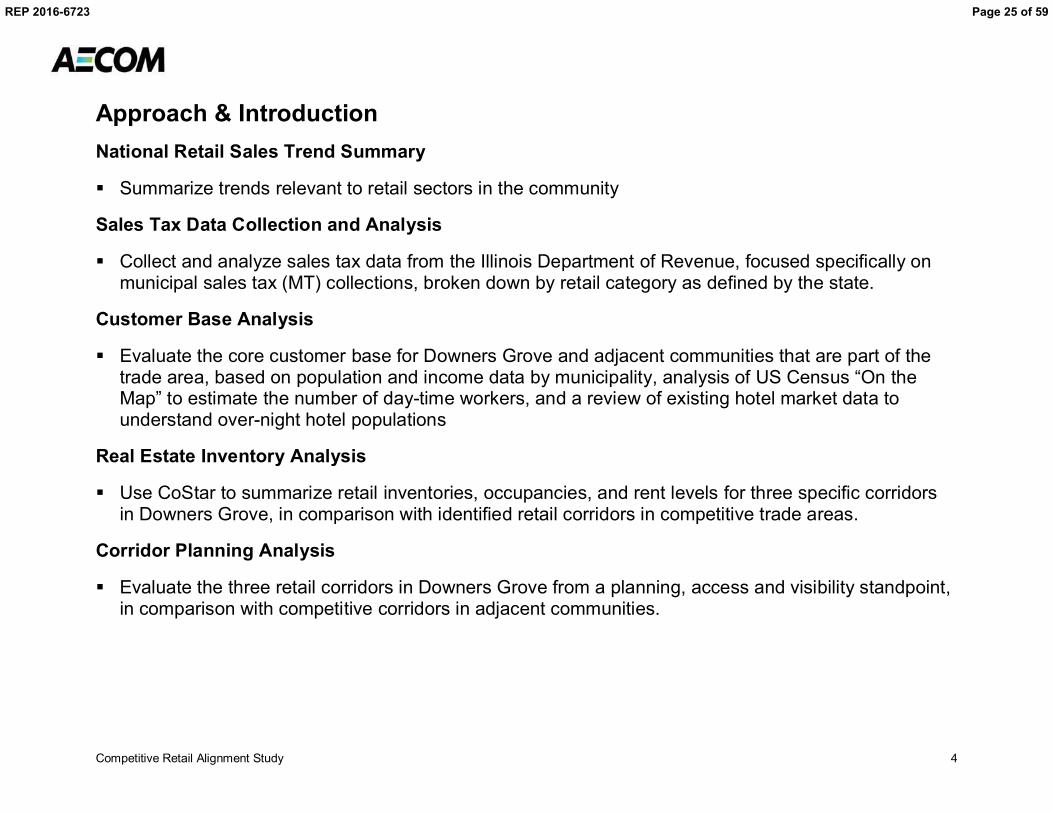
Approach & IntroductionNational Retail Sales Trend Summary
§ Summarize trends relevant to retail sectors in the community
Sales Tax Data Collection and Analysis
§ Collect and analyze sales tax data from the Illinois Department of Revenue, focused specifically onmunicipal sales tax (MT) collections, broken down by retail category as defined by the state.
Customer Base Analysis
§ Evaluate the core customer base for Downers Grove and adjacent communities that are part of thetrade area, based on population and income data by municipality, analysis of US Census “On theMap” to estimate the number of day-time workers, and a review of existing hotel market data tounderstand over-night hotel populations
Real Estate Inventory Analysis
§ Use CoStar to summarize retail inventories, occupancies, and rent levels for three specific corridorsin Downers Grove, in comparison with identified retail corridors in competitive trade areas.
Corridor Planning Analysis
§ Evaluate the three retail corridors in Downers Grove from a planning, access and visibility standpoint,in comparison with competitive corridors in adjacent communities.
REP 2016-6723 Page 25 of 59
Competitive Retail Alignment Study 5
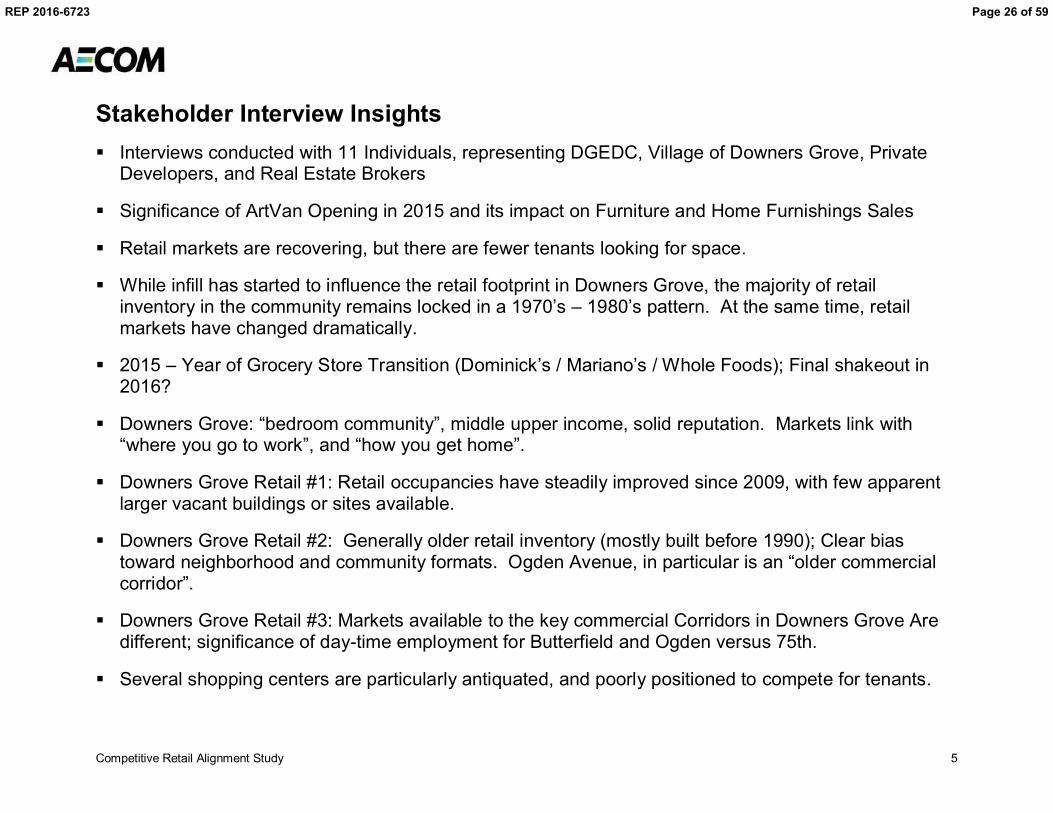
Stakeholder Interview Insights§ Interviews conducted with 11 Individuals, representing DGEDC, Village of Downers Grove, Private
Developers, and Real Estate Brokers
§ Significance of ArtVan Opening in 2015 and its impact on Furniture and Home Furnishings Sales
§ Retail markets are recovering, but there are fewer tenants looking for space.
§ While infill has started to influence the retail footprint in Downers Grove, the majority of retailinventory in the community remains locked in a 1970’s – 1980’s pattern. At the same time, retailmarkets have changed dramatically.
§ 2015 – Year of Grocery Store Transition (Dominick’s / Mariano’s / Whole Foods); Final shakeout in2016?
§ Downers Grove: “bedroom community”, middle upper income, solid reputation. Markets link with“where you go to work”, and “how you get home”.
§ Downers Grove Retail #1: Retail occupancies have steadily improved since 2009, with few apparentlarger vacant buildings or sites available.
§ Downers Grove Retail #2: Generally older retail inventory (mostly built before 1990); Clear biastoward neighborhood and community formats. Ogden Avenue, in particular is an “older commercialcorridor”.
§ Downers Grove Retail #3: Markets available to the key commercial Corridors in Downers Grove Aredifferent; significance of day-time employment for Butterfield and Ogden versus 75th.
§ Several shopping centers are particularly antiquated, and poorly positioned to compete for tenants.
REP 2016-6723 Page 26 of 59

Competitive Retail Alignment Study 6
National Retail Sales TrendsAECOM examined retail spending from 1992 through 2014 to provide clarityregarding significant changes that have unfolded in national retail markets. Keytrends were identified:
§ The impact of tighter credit markets, decreased consumer spending and over-construction led to a wave of bankruptcies among American retailers after2009. While chains such as Levitz, Sharper Image, Circuit City and Linen ‘nThings filed for bankruptcy protection, other chains like Office Depot, Lowe’sand J.C. Penny were forced to downsize operations. Trends for this periodalso include dramatic auto dealership closures by Ford and General Motors.
§ While the pace of store closures has slowed, trends for 2014 and 2015 areimpacted by the bankruptcy of Radio Shack, as well as the Staples / OfficeDepot merger announcement; it is not clear that this merger will gain regulatoryapproval. Trends also reflect the reality of improved occupancies, linked withlimited new retail construction since 2010. Tenanting options have expandedbeyond critical care centers, dollar stores, and Aldi.
§ Auto sales were particularly hard hit during the Great Recession. Auto-relatedsales dropped by almost 26% from 2007 to 2009. Unprecedented closings andsubstantial loans from the federal government reflected the precarious financialstate of automobile firms. By 2014, auto-related sales have recovereddramatically.
§ From 1992 to 2014, gasoline sales increased at a 5.8% annual rate. Gasolineprices play a major role in determining the growth of gasoline retail sales.Gasoline sales spiked from $373 billion in 2009 to $552 billion in 2013, a47.8% increase. However, recent dramatic decreases in gasoline prices in2014 have led to an uncharacteristic 2.7% decrease in gasoline sales from2013. Future factors contributing to lower gas prices are more fuel efficientvehicles.
Figure 1. Announced Retail Store Closings
Source: Retailindustry.about.com
Figure 2. Retail Sales, Millions of US Dollars
Source: US Census
0
2,000
4,000
6,000
8,000
10,000
12,000
14,000
2009 2010 2011 2012 2013 2014 2015
$1,000
$1,500
$2,000
$2,500
$3,000
$3,500
$4,000
$4,500
$5,000
$5,500
1992
1993
1994
1995
1996
1997
1998
1999
2000
2001
2002
2003
2004
2005
2006
2007
2008
2009
2010
2011
2012
2013
2014
REP 2016-6723 Page 27 of 59

Competitive Retail Alignment Study 7
§ Online spending continues to absorb market sharefrom “brick and mortar” retail. Between 1992 and2014, online retailing increased from 2.5% to 10.4%of retail sales, representing growth from about $35billion to more than $375 billion. While the re-allocation of retail sales to online shopping is of littleconcern to retail chains, the same cannot be said formunicipalities relying on retail sales taxes in thecommunity.
§ Growth of health and personal care stores reflectsthe increasing scale of products and health careservices that drug stores and pharmacies now offer.
§ Building material stores (Lowes, Menards and HomeDepot) have dramatically altered the market forhome improvement supplies. In general, sales grewstrongly through 2006, only to suffer through therecession. While sales have recovered, appreciatethat local housing markets have not recovered topre-recession construction trends.
§ Grocery stores have remained relatively stable.Between 1992 and 2014, spending on food andbeverage stores grew at an annualized rate of 2.6%.
§ Retailers are reacting to changing spending patternsdriven by new technologies (broadband access andcell phones), which have recently captured asignificant share of disposable income; TiVo, iTunesand Netflix are examples.
Figure 3. Percent of General Retail Dollars by Category, 1992 and 2014
Source: US Census
11.9%
2.3%
12.6%
3.2%
8.3%
6.4%
2.7%
15.8%
18.2%
2.9%
6.8%
8.8%
2.8%
3.4%
5.5%
3.9%
6.2%
14.4%
3.6%
14.1%
25.7%
3.0%
8.3%
9.1%
Warehouse clubs and superstores
Sporting goods, hobby, book, and musicstores
Nonstore retailers
Miscellaneous store retailers
Health and personal care stores
General merchandise stores
Furniture, home furnishings, electronicsand appliance stores
Food services and drinking places
Food and beverage stores
Electronics and appliance stores
Clothing and clothing access. stores
Building mat. and garden equip. andsupplies
1992 2014
REP 2016-6723 Page 28 of 59

Competitive Retail Alignment Study 8
§ The rollout of Macy’s as a national brand highlights the disappearance of more than ten regional department store brands and has had asignificant impact on existing shopping malls. In the same context, the pivot of Sears/Kmart towards a REIT structure raises concerns for theeventual need to reposition a large number of regional malls still anchored by these chains.
§ Shopping centers are adapting to the changing retail market by providing a more varied collection of tenants looking to experience shopping,with the evolution of the “Lifestyle Center” as a specific example. Existing malls have seen the incorporation of outdoor lifestyle elements tosustain competitive positioning. Of note, health care is being looked at as an anchor use in these projects.
§ For traditional regional shopping malls, the general sense is that the stronger, well-located malls are doing well, while older malls are runninginto difficulties.
§ Big box formats have increasingly engaging in battles for market share. In most cases, retailers involved locate stores in close proximity topull sales from a competitor, or keep older stores dark to prevent competitors from relocating into a market. While precise implications are notclear, there is a general sense that larger format retailers have added new space faster than they have grown sales, resulting in lowered storesales per square foot and greater competitive pressures for independent store owners.
§ Project scale drives market reach, with large projects needing a regional market to sustain project fundamentals, and smaller projects tied toneighborhood, campus, or community scale markets. On a practical basis, regional destination scale projects generally start at about 175,000sq. ft. of retail, space and can culminate at more than 2 million sq. ft. of rentable space.
§ National chain stores in the apparel, shoes, and accessories segment tend to prefer tenanting scenarios where they can cluster together. Pre-recession, the combination of Chico’s, Ann Taylor, Coldwater Creek, and Talbots was a typical example. Other areas where clustering iscommon include housewares and home improvement, and consumer services.
§ Retailers are finding their traditional suburban markets increasingly saturated with retail space, urban markets are an increasing focus forgrowth in sales. Obstacles such as site assembly and brownfields remediation can hamper development potential.
REP 2016-6723 Page 29 of 59
Competitive Retail Alignment Study 9
Metro Chicago Perspective
Figure 4. Retail Space Construction, Metropolitan Chicago, in Millions of SF, 1982 to 2015
Source: CoStar
Figure 5. Retail Space Vacancy Trend, Metropolitan Chicago, 2006 to 2014
Source: CoStar
0
2
4
6
8
10
12
14
1982
1983
1984
1985
1986
1987
1988
1989
1990
1991
1992
1993
1994
1995
1996
1997
1998
1999
2000
2001
2002
2003
2004
2005
2006
2007
2008
2009
2010
2011
2012
2013
2014
2015
4%
5%
6%
7%
8%
9%
10%
11%
12%
2006 2007 2008 2009 2010 2011 2012 2013 2014 2015
Vacant SpaceAvailable Space
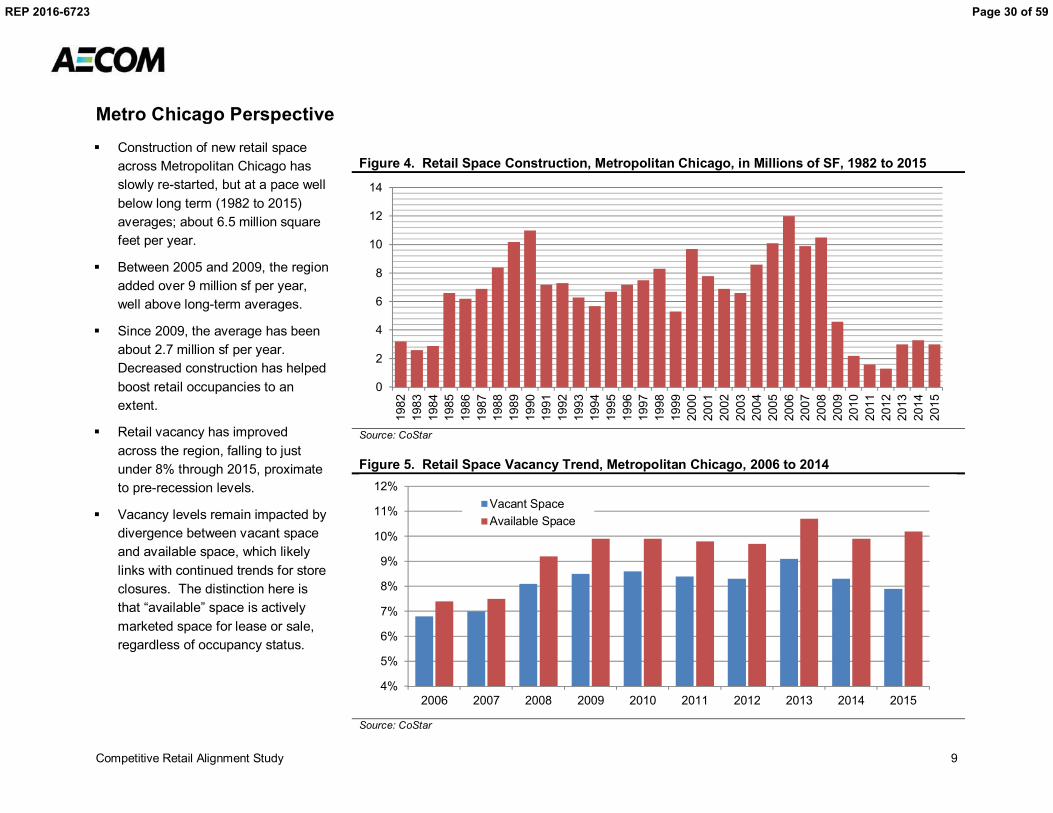
§ Construction of new retail spaceacross Metropolitan Chicago hasslowly re-started, but at a pace wellbelow long term (1982 to 2015)averages; about 6.5 million squarefeet per year.
§ Between 2005 and 2009, the regionadded over 9 million sf per year,well above long-term averages.
§ Since 2009, the average has beenabout 2.7 million sf per year.Decreased construction has helpedboost retail occupancies to anextent.
§ Retail vacancy has improvedacross the region, falling to justunder 8% through 2015, proximateto pre-recession levels.
§ Vacancy levels remain impacted bydivergence between vacant spaceand available space, which likelylinks with continued trends for storeclosures. The distinction here isthat “available” space is activelymarketed space for lease or sale,regardless of occupancy status.
REP 2016-6723 Page 30 of 59

Competitive Retail Alignment Study 10
Economic ContextThe State of Illinois Department of Employment Securitymaintains the Where Workers Work dataset for NE Illinois.The data, focused on private employment only, highlightsseveral trends for the region and trade area.
§ For the 6-County Metropolitan Area, total privateemployment has finally exceeded 2007 pre-recessionpeaks. The region added jobs since 2010 at a 1.8%annualized rate, driven largely by job growth in DuPage Country, which saw an increase in job growth ata 2.3% rate. Only Will County grew at a faster rateover the same period.
§ The chart to the right highlights more detailedemployment trends for Naperville, Downers Grove,and Oak Park. The chart notes that not only hasDowners Grove seen steady growth in private sectoremployment over the noted period, but that DownersGrove has also supplanted Oak Brook in terms of totalemployment since 2007.
While Regional employment trends have in generalrecovered to pre-recession levels, the same cannot besaid for housing. In general, the pace of new housing unitconstruction (as measured by permits) remains well belowpre-recession thresholds, even in Du Page.
§ Permit trends for Downers Grove reflect a morenuanced trajectory; with about 70 permits per year in2013 and 2014 being generally consistent with pre-recession thresholds before 2005.
Figure 6. Total Private Sector Employment
Source: State of IL, Where Workers Work
Figure 7. Housing Permits by Year, Du Page County
Source: http://socds.huduser.gov/permits/
20,000
30,000
40,000
50,000
60,000
70,000
80,000Naperville Downers Grove Oak Brook
0500
1,0001,5002,0002,5003,0003,5004,0004,5005,000
2000 2001 2002 2003 2004 2005 2006 2007 2008 2009 2010 2011 2012 2013 2014
REP 2016-6723 Page 31 of 59
Competitive Retail Alignment Study 11
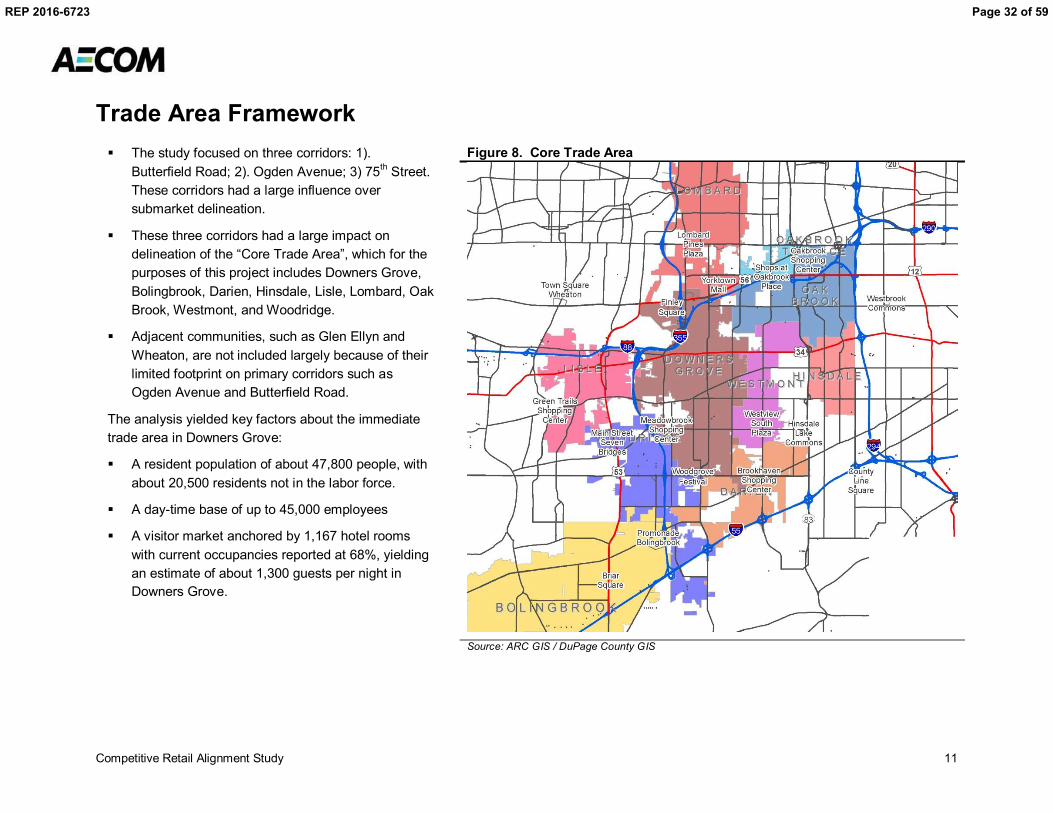
Trade Area FrameworkFigure 8. Core Trade Area
Source: ARC GIS / DuPage County GIS
§ The study focused on three corridors: 1).Butterfield Road; 2). Ogden Avenue; 3) 75th Street.These corridors had a large influence oversubmarket delineation.
§ These three corridors had a large impact ondelineation of the “Core Trade Area”, which for thepurposes of this project includes Downers Grove,Bolingbrook, Darien, Hinsdale, Lisle, Lombard, OakBrook, Westmont, and Woodridge.
§ Adjacent communities, such as Glen Ellyn andWheaton, are not included largely because of theirlimited footprint on primary corridors such asOgden Avenue and Butterfield Road.
The analysis yielded key factors about the immediatetrade area in Downers Grove:
§ A resident population of about 47,800 people, withabout 20,500 residents not in the labor force.
§ A day-time base of up to 45,000 employees
§ A visitor market anchored by 1,167 hotel roomswith current occupancies reported at 68%, yieldingan estimate of about 1,300 guests per night inDowners Grove.
REP 2016-6723 Page 32 of 59

Competitive Retail Alignment Study 12
Trade Area Opportunity
Figure 9. Chicago MSA Income Density by Zip Code
Source: ARC GIS / DuPage County GIS
§ The Core Trade Area, extending fromBolingbrook from the southwest toOak Brook to the northeastrepresents one of the primary retaildestinations and concentrations ofincome in the entire ChicagoMetropolitan Area.
§ The East/West Corridor submarket isidentified by CoStar as the primaryretail areas in DuPage County. Thissubmarket includes more than 76million square feet of retail space,representing about 15% of totalregional retail inventory (about 525million square feet). It is the thirdlargest retail Submarket in the entireregion by inventory.
§ The adjacent map reinforces theunderlying income trends that driveretailer interest in areas like Du PageCounty. The map highlights thelocation of Downers Grove astride abroader area of concentrated wealth,in this case zip codes that eachsupport between $1.37 and $2.4billion in household income.
REP 2016-6723 Page 33 of 59

Competitive Retail Alignment Study 13
Figure 10. Downers Grove, Retail Building Locations, Avg. Building Size in Square Feet
Source: CoStar
REP 2016-6723 Page 34 of 59
Competitive Retail Alignment Study 14
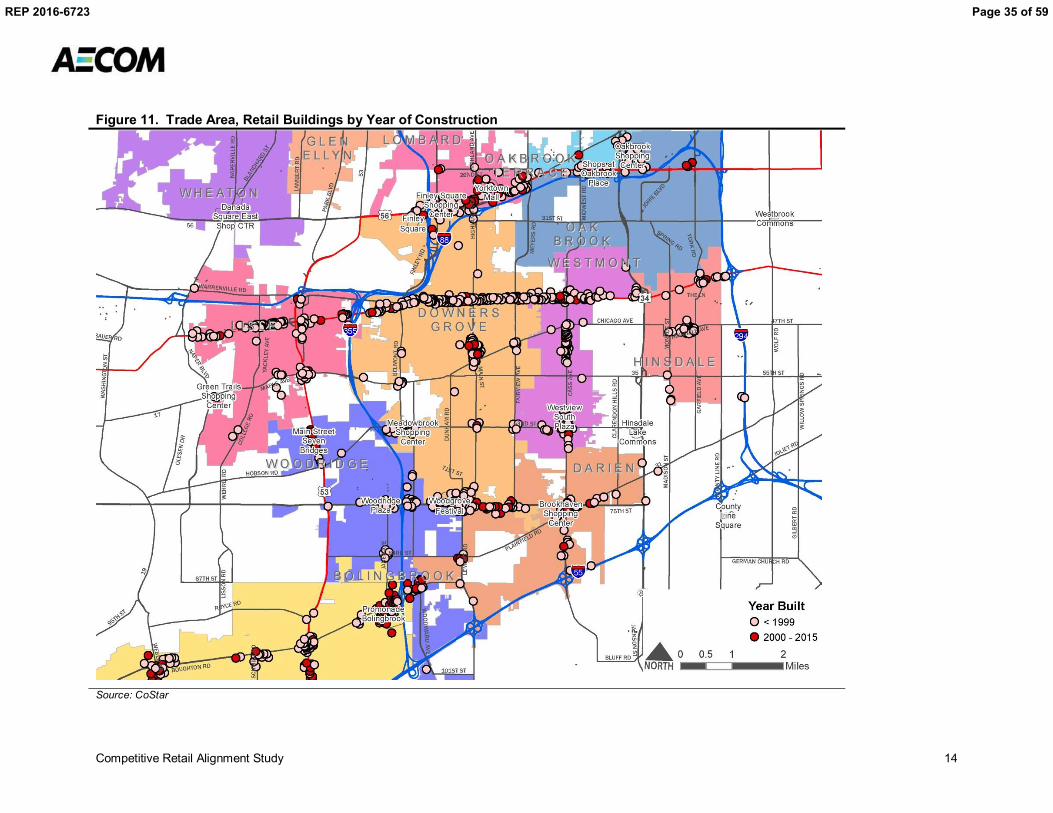
Figure 11. Trade Area, Retail Buildings by Year of Construction
Source: CoStar
REP 2016-6723 Page 35 of 59

Competitive Retail Alignment Study 15
Retail Sales Analysis – Downers Grove
§ The Trade Area supports at least $7.3 Billion in retail spending; Downers Grove captures about17% of total Trade Area sales.
§ Retail sectors with above average sales capture include Food, Building Materials, Automotive,Drugs & Miscellaneous Retail, Furniture & Household Furnishings, and Drinking & Eating Places.
§ Apparel and General Merchandise sales are under-performing in Downers Grove.
Figure 12. Retail Sales By Store Type, Trade Area / Downers Grove Market Share
Retail Category Trade AreaDowners
GroveDowners GroveMarket Share
General Merchandise $793,700,445 $44,570,147 5.6%Food $561,253,344 $134,094,401 23.9%Drinking and Eating Places $798,502,921 $137,168,211 17.2%Apparel $454,521,738 $29,117,830 6.4%Furniture & H.H. & Radio $593,954,630 $102,900,471 17.3%Lumber, Bldg, Hardware $245,684,965 $56,928,114 23.2%Automotive & Filling Stations $1,774,235,223 $328,130,391 18.5%Drugs & Misc. Retail $1,136,964,630 $269,609,365 23.7%Agriculture & All Others $733,713,839 $128,014,318 17.4%Manufacturers $141,761,390 $10,473,620 7.4%Totals $7,300,343,855 $1,241,006,868 17%Source: Illinois Department of Revenue
REP 2016-6723 Page 36 of 59

Competitive Retail Alignment Study 16
Figure 13. Downers Grove - Total Retail Sales, Millions of US Dollars, 2000-2014
Source: Illinois Department of Revenue
$0
$50
$100
$150
$200
$250
$300
$350
$400
2000 2001 2002 2003 2004 2005 2006 2007 2008 2009 2010 2011 2012 2013 2014
Mill
ions
ofU
S$$
General Merchandise
Food
Drinking and Eating Places
Apparel
Furniture & H.H. & Radio
Lumber, Bldg, Hardware
Automotive & Filling Stations
Drugs & Misc. Retail
Agriculture & All Others
Manufacturers
REP 2016-6723 Page 37 of 59

Competitive Retail Alignment Study 17
Figure 14. Downers Grove – Automotive & Drugs / Miscellaneous Retail Sales, Millions of US Dollars, 2000-2014
Source: Illinois Department of Revenue
$0
$50,000,000
$100,000,000
$150,000,000
$200,000,000
$250,000,000
$300,000,000
$350,000,000
$400,000,000
2000 2001 2002 2003 2004 2005 2006 2007 2008 2009 2010 2011 2012 2013 2014
Automotive & Filling Stations
Drugs & Misc. Retail
Annual Growth Since 2009Automotive: 6.3% GrowthDrugs & Miscellaneous Retail: 3.3%
REP 2016-6723 Page 38 of 59

Competitive Retail Alignment Study 18
Figure 15. Downers Grove – Food & Drinking and Eating Retail Sales, Downers Grove, 2000-2014
Source: Illinois Department of Revenue
$0
$50,000,000
$100,000,000
$150,000,000
$200,000,000
$250,000,000
$300,000,000
$350,000,000
$400,000,000
2000 2001 2002 2003 2004 2005 2006 2007 2008 2009 2010 2011 2012 2013 2014
Food
Drinking and Eating Places
Annnual Growth Since 2009Food: 2.7%Drinking and Eating: 3.1%
REP 2016-6723 Page 39 of 59

Competitive Retail Alignment Study 19
Figure 16. Downers Grove – Building Materials & Furniture and Furnishings Total Retail Sales, Downers Grove, 2000-2014
Source: Illinois Department of Revenue
$0
$50,000,000
$100,000,000
$150,000,000
$200,000,000
$250,000,000
$300,000,000
$350,000,000
$400,000,000
2000 2001 2002 2003 2004 2005 2006 2007 2008 2009 2010 2011 2012 2013 2014
Lumber, Bldg, Hardware
Furniture & H.H. & Radio
Annual Growth Since 2009Building Materials: 0.1%Furniture & Home Furnishings: -4.8%
REP 2016-6723 Page 40 of 59

Competitive Retail Alignment Study 20
Figure 17. Downers Grove – General Merchandise and Apparel Retail Sales, Downers Grove, 2000-2014
Source: Illinois Department of Revenue
$0
$50,000,000
$100,000,000
$150,000,000
$200,000,000
$250,000,000
$300,000,000
$350,000,000
$400,000,000
2000 2001 2002 2003 2004 2005 2006 2007 2008 2009 2010 2011 2012 2013 2014
General Merchandise
Apparel
Annual Growth Since 2009General Merchandise: -0.4%Apparel: 1.6%
REP 2016-6723 Page 41 of 59

Competitive Retail Alignment Study 21
Figure 18. Downers Grove – Agricultural, Other, and Manufacturing Retail Sales, Downers Grove, 2000-2014
Source: Illinois Department of Revenue
$0
$50,000,000
$100,000,000
$150,000,000
$200,000,000
$250,000,000
$300,000,000
$350,000,000
$400,000,000
2000 2001 2002 2003 2004 2005 2006 2007 2008 2009 2010 2011 2012 2013 2014
Agriculture & All Others
Manufacturers
Annual Growth Since 2009Agricultural & All Others: 5.1%Manufacturing:-11.4%
REP 2016-6723 Page 42 of 59

Competitive Retail Alignment Study 22
Figure 19. State of Illinois Growth in Retail Sales, 2009-2014
Source: Illinois Department of Revenue
Figure 20. Downers Grove Growth in Sales, 2009-2014 Figure 21. Submarket Growth in Retail Sales, 2009-2014
Source: Illinois Department of Revenue Source: Illinois Department of Revenue
6.8%
4.6%
3.6%
3.5%
3.2%
3.0%
2.2%1.8%
1.6%
1.3%
0% 2% 4% 6% 8%
Automotive & Filling Stations
Drinking and Eating Places
Apparel
Drugs & Misc. Retail
Agriculture & All Others
Lumber, Bldg, Hardware
Food
General Merchandise
Manufacturers
Furniture & H.H. & Radio
6.3%
5.1%
3.3%
3.1%
2.7%
1.6%
0.1%
-0.4%
-4.8%
-11.4%
-12% -7% -2% 3% 8%
Automotive & Filling Stations
Agriculture & All Others
Drugs & Misc. Retail
Drinking and Eating Places
Food
Apparel
Lumber, Bldg, Hardware
General Merchandise
Furniture & H.H. & Radio
Manufacturers
7.1%
6.1%
5.6%
5.5%
5.0%
3.9%
2.5%
1.8%
1.6%
1.1%
0% 2% 4% 6% 8%
Agriculture & All Others
Manufacturers
Furniture & H.H. & Radio
Automotive & Filling Stations
Drugs & Misc. Retail
Drinking and Eating Places
Apparel
Lumber, Bldg, Hardware
Food
General Merchandise
§ For Downers Grove, Automotive has seen the strongest rate ofgrowth in retail sales since 2009, faster than the trade area, butslower than the state wide average.
§ Decline in manufacturing may simply mirror statewide trends; itcould be an indicator of local trouble and impending land usechange.
§ As the Agriculture and All Others category reflects a variety ofactivities, more research is needed to understand drivers in thissector.
§ Sales decline in furniture does not include the impact of theArtVan opening in 2015.
REP 2016-6723 Page 43 of 59

Competitive Retail Alignment Study 23
Figure 22. Income Adjusted Pull Factors, Downers Grove, 2000 to 2014
Source: Illinois Department of Revenue
0.0
1.0
2.0
3.0
4.0
5.0
6.0
2000 2001 2002 2003 2004 2005 2006 2007 2008 2009 2010 2011 2012 2013 2014
General Merchandise
Food
Drinking and Eating Places
Apparel
Furniture & H.H. & Radio
Lumber, Bldg, Hardware
Automotive & Filling Stations
Drugs & Misc. Retail
Agriculture & All Others
REP 2016-6723 Page 44 of 59

Competitive Retail Alignment Study 24
Pull Factor Implications
§ The pull factors incorporate an adjustment for local incomes relative to state averages. All thingsbeing equal, affluent communities with significant retail inventories will tend to support higher pullfactors.
§ As average store sizes have grown considerably in the past 10 years, linked with superstores andwarehouse clubs, the opening of individual stores generally less than 25,000 sf will not materiallychange pull factors. For example, in general merchandise, penetration is driven largely by locationdecisions by Walmart, Target, and Meijer, where average store formats are in excess of 150,000square feet; in this example, one store can significantly change the pull factor.
§ Cluster strategies, i.e. where groups of similar stores (shoes, apparel, restaurants) group withinwalking distance, can create more significant attractive power and increase trade area draw to anextent.
REP 2016-6723 Page 45 of 59

Competitive Retail Alignment Study 25
Real Estate Inventory Analysis
Figure 23. Retail Inventory, Core Trade Area, Millions of Square Feet, 2015
Source: CoStar
Figure 24. Retail Vacancy Rate, Core Trade Area, 2015
Source: Illinois Department of Revenue
0 1 2 3 4 5 6
Downers GroveBolingbrook
DarienHinsdale
LisleLombard
Oak BrookWestmont
Woodridge
5.0%7.8%
4.3%10.5%
11.7%9.6%
2.0%13.3%
2.9%
0% 2% 4% 6% 8% 10% 12% 14%
Downers GroveBolingbrook
DarienHinsdale
LisleLombard
Oak BrookWestmont
Woodridge
§ AECOM reviewed data from CoStar forretail space in noted communities withinthe Downers Grove Trade Area. Data isas of December 2015.
§ CoStar inventory data for Downers Grovewas reviewed to identify larger obviousbuildings misclassified as retail. Theanalysis did not involve a 100% count ofall retail spaces, however.
§ The analysis showed that Downers Grovesupports the third largest inventor of retailspace in the trade area, over 4 millionsquare feet, with an enviably low vacancyrate, about 5%, well below regionalaverages.
REP 2016-6723 Page 46 of 59
Competitive Retail Alignment Study 26
Figure 25. Total Net Absorption, 2009-2015, Core Trade Area, Thousands of Sq. Feet
Source: CoStar
Figure 26. Overall NNN Rent, Core Trade Area, 2015
Source: CoStar
-100 -50 0 50 100 150 200 250 300 350
Downers Grove
Bolingbrook
Darien
Hinsdale
Lisle
Lombard
Oak Brook
Westmont
Woodridge
$16.33$14.58
$21.92$31.04
$13.99
$13.51$24.35
$13.13
$17.49
$0 $5 $10 $15 $20 $25 $30 $35
Downers GroveBolingbrook
Darien
HinsdaleLisle
Lombard
Oak BrookWestmont
Woodridge
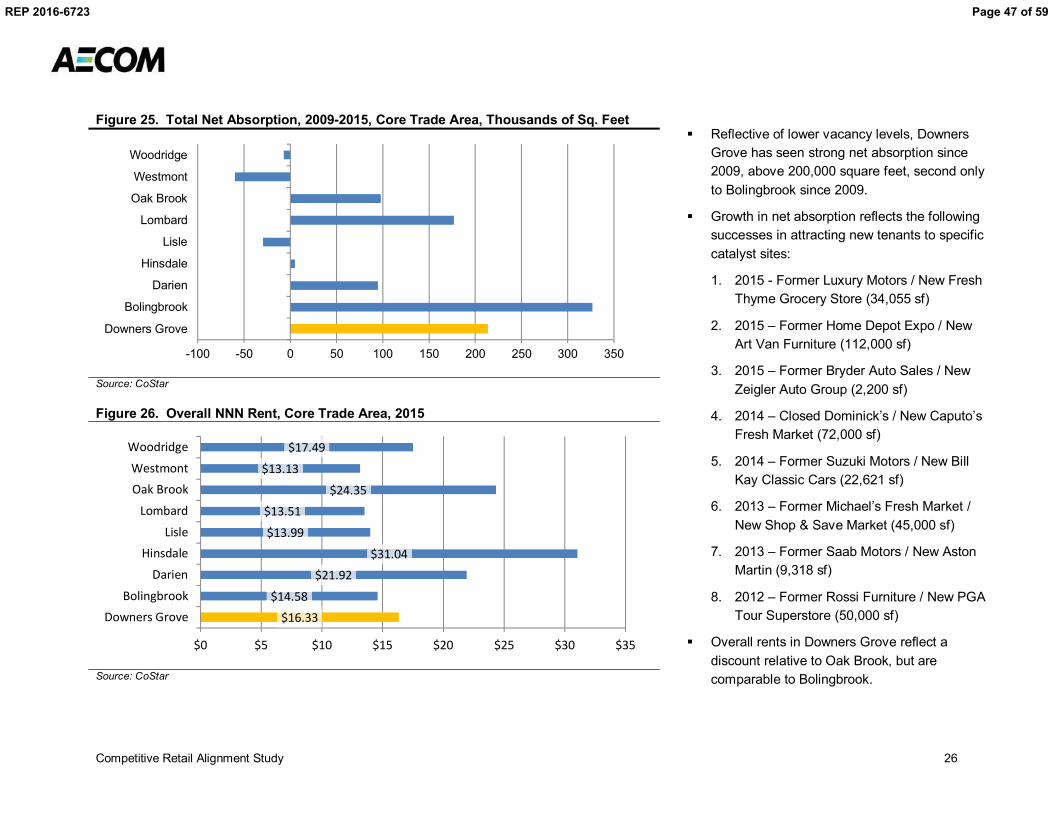
§ Reflective of lower vacancy levels, DownersGrove has seen strong net absorption since2009, above 200,000 square feet, second onlyto Bolingbrook since 2009.
§ Growth in net absorption reflects the followingsuccesses in attracting new tenants to specificcatalyst sites:
1. 2015 - Former Luxury Motors / New FreshThyme Grocery Store (34,055 sf)
2. 2015 – Former Home Depot Expo / NewArt Van Furniture (112,000 sf)
3. 2015 – Former Bryder Auto Sales / NewZeigler Auto Group (2,200 sf)
4. 2014 – Closed Dominick’s / New Caputo’sFresh Market (72,000 sf)
5. 2014 – Former Suzuki Motors / New BillKay Classic Cars (22,621 sf)
6. 2013 – Former Michael’s Fresh Market /New Shop & Save Market (45,000 sf)
7. 2013 – Former Saab Motors / New AstonMartin (9,318 sf)
8. 2012 – Former Rossi Furniture / New PGATour Superstore (50,000 sf)
§ Overall rents in Downers Grove reflect adiscount relative to Oak Brook, but arecomparable to Bolingbrook.
REP 2016-6723 Page 47 of 59

Competitive Retail Alignment Study 27
Figure 27. Retail Sales Per Square Foot, 2006-2014
Source: CoStar, Illinois Department of Revenue / CoStar
$200
$250
$300
$350
$400
$450
$500
$550
2006 2007 2008 2009 2010 2011 2012 2013 2014
Downers Grove
Bolingbrook
Darien
Hinsdale
Lisle
Lombard
Oak Brook
Westmont
Woodridge
REP 2016-6723 Page 48 of 59

Competitive Retail Alignment Study 28
Corridor AnalysisEach major retail corridor in Downers Grove has a unique identity as it relates toconsumer and merchant interests. To improve retail corridor revitalization, it isuseful to conduct a Strengths, Weaknesses, Opportunities and Threats (SWOT)analysis. Using SWOT analysis to understand environmental conditions andconstraints helps in assessing and improving economic potential in DownersGrove retail corridors. Five major retail corridors exist in Downers Grove. Below isa summary and retail inventory of each corridor:
Figure 28. Retail Corridor Summary
CorridorSummary
RentableBuilding Area
Land Area(Acres)
SquareFeet
BuildingAge
AverageBuilding Size
(Sq Ft)
FloorAreaRatio
Average DailyTraffic (ADT)
Butterfield Road 1,425,502 145.47 6,338,518 30.12 49,155 0.22 54,900Ogden Avenue 1,283,716 104.71 5,397,222 43.11 9,951 0.24 36,000Downtown 304,000 9.58 470,495 73.32 6,772 0.79 16,90063rd Street 356,431 34.07 1,598,652 35.25 25,459 0.22 27,00075th Street 937,307 182.02 7,989,450 25.17 24,666 0.12 33,900Total 4,306,956 475.85 21,794,337 52.96 16,511 0.20 168,700Source: CoStar, Illinois Department of Transportation
Ogden Avenue
Art Van Furniture -Butterfield Road
REP 2016-6723 Page 49 of 59

Competitive Retail Alignment Study 29
Figure 29. Corridor Retail Inventory, Square Feet, 2015 Figure 30. Downers Grove Overall NNN Rent, 2015
Source: CoStar Source: CoStar
Figure 31. Corridor Retail Vacancy Rate, 2015
Source: Illinois Department of Revenue
0.00.20.40.60.81.01.21.41.6
ButterfieldRoad
OgdenAvenue
75th Street 63rd Street Downtown
Squa
reFe
et(M
illio
ns)
$13.64
$15.73 $16.26$14.89
$12
$13
$14
$15
$16
$17
ButterfieldRoad
Ogden Avenue 75th Street 63rd Street
Downers Grove Overall NNN Rent, 2015
5.0%2.4%
11.7%
2.0% 1.4%0%
2%
4%
6%
8%
10%
12%
14%
ButterfieldRoad
OgdenAvenue
75th Street 63rd Street Downtown
§ 75th Street supports the highest vacancy level as well as the3rd largest inventory of total retail space
§ Ogden Avenue vacancy reflects both limited direct vacancyas well as a larger number of occupied but under-utilizedbuildings.
§ Rent levels across the corridors are generally consistent;
§ Estimated downtown average rents (noted by CoStar at$25.55/sf) are not included, requiring further investigation
REP 2016-6723 Page 50 of 59

Competitive Retail Alignment Study 30
Butterfield RoadStrengths Weaknesses
§ High average daily traffic counts§ Cluster of big-box commercial activity attracting other
complementary retail§ Abundant surface parking availability§ Unique businesses to expand consumer base (Art Van, PGA Tour
Superstore)§ Roadway infrastructure conditions accommodate a large capacity of
vehicles§ Truck routes allow for ease in merchant delivery requirements§ Large pool of national retailers§ Signalized intersections§ Outlot potential§ Pace bus routes in vicinity present opportunity to increase
workforce and consumer potential§ Access to Interstate 88, Interstate 355, Route 83, and close access
to Roosevelt Road
§ No frontage roads, and access is controlled mainly at signalizedintersections
§ Signage visibility is difficult due to code restrictions, higher speedlimit, abundance of surface parking, and grade differentials
§ Public transit and pedestrian infrastructure is lacking (fewsidewalks, lack of shelters, grade changes from right-of-way tostorefront)
§ Disrepair of shopping center parking lots
Opportunities Threats
§ High household income§ Availability of affordable real estate near the corridor§ Downers Grove is the western Anchor of the Butterfield Retail
Corridor, including Yorktown Mall and Oak Brook Mall§ Working and visitor population due the abundance of offices and
hotels
§ Nearby retail competition creating vacuum on consumer spending§ Fewer young professionals willing to work in suburban offices§ General downward pressure on office space per employee§ Retail leakage to nearby Oak Brook/Lombard / Bolingbrook§ Population in single family housing has plateaued§ Located in an office zone, consumer activity can be impacted by
increased rush hour traffic
REP 2016-6723 Page 51 of 59

Competitive Retail Alignment Study 31
Ogden AvenueStrengths Weaknesses
§ Small lots allow for great visibility from roadway§ Multiple driveways allow for easy accessibility for each business§ Unique, local retailers capture consumers looking for more specific
goods or services§ Accessibility to nearby neighborhoods§ Car dealership hub on west side of corridor§ Newer retail buildings on east side of corridor§ Consistent branded street signage helps create sense of place§ Transit runs within proximity of corridor§ Center turn lane allows for two-way driveway entry§ Grocery store at Saratoga Avenue and Ogden Avenue is a catalyst
for area activity§ High average daily traffic counts§ Low vacancy in corridor
§ Shallow lot depths limit site configuration, volume of surfaceparking, shared access service drives or outlots
§ Inconsistent setbacks from sidewalk / road, and varying gradechanges relative to road
§ Frequent curb cuts from Ogden Avenue to businesses createdangerous traffic scenarios
§ Minimal outlot potential§ Hodge-podge development: incompatible adjacent retailers and
building type§ Business delivery is complicated with narrow driveway turning
radius§ Disrepair of shopping center parking lots§ Overhead powerlines negatively affect visibility and corridor
aesthetics§ Inconsistent site design creates suboptimal appearance (setbacks,
placement of parking, screening/buffering, landscaping, signage,etc.)
§ Unattractive signage
Opportunities Threats
§ Potential to develop more office to increase potential consumeractivity
§ Infill strategies to assemble sites for larger opportunities§ Start-up and home-based business potential§ Make more inviting streetscape§ Develop cohesive merchandising strategy
§ Emphasis on automobile sector makes corridor fortunes subject tochanges in the business cycle
§ Older building age than competing corridors could hamper ability toattract new businesses
§ Balance of ownership is oriented toward private/individual ratherthan companies/REIT’s (which has capital/maintenance as well asland assembly challenge implications)
§ Land use conflicts arising adjacent residential
REP 2016-6723 Page 52 of 59

Competitive Retail Alignment Study 32
DowntownStrengths Weaknesses
§ Historic with older buildings and architectural character§ Quality surrounding neighborhood§ Mixed-use development§ New, dense residential housing stock§ Accessibility to neighborhood§ Variety of small businesses – unique retail offerings§ Start-up and home-based businesses§ Transit such as Metra and Pace increases activity in area
§ Lack of availability of parking could deter would-be shoppers§ High rent in comparison to peer retail corridors§ Very old building stock requires increased maintenance§ Low traffic counts
Opportunities Threats
§ Focus on infill mixed use development, with residential§ Potential for attracting local entrepreneurship§ Tourism to the downtown area§ Grow traditional walkable downtown aesthetic with unique, apparel
/ boutique retail (destination)
§ Easier to park at other retail destinations§ Stability of business base during recessions: small businesses may
have difficulty withstanding economic downturns, leading toincreased vacancies
§ Lacks direct interstate access discouraging some businesses fromlocating there
§ Railroad / local traffic interruptions are reasonably expected to growover time, leading to eventual need for additional grade separatedcrossings
REP 2016-6723 Page 53 of 59

Competitive Retail Alignment Study 33
63rd StreetStrengths Weaknesses
§ Parking availability§ Competitive commercial rents§ Minimal vacancies§ Proximate to major arterials and interstates
§ Aesthetically dated and arguably unappealing retail structures§ Disrepair of shopping center parking lots§ Grade change from right-of-way to storefront§ Lack of national chains§ Outlots block visibility to storefronts in back of lot§ Lack of hotel or office presence limits lunch business§ Relatively low average daily traffic counts; not a heavily traveled
corridor§ Disrepair of parking lots and building facades§ Larger setbacks from streets§ The adjacent shopping center in Woodridge has a vacant
Dominick’s.
Opportunities Threats
§ Reposition existing retail offerings § Nearby submarkets such as Westmont are more viable due tohigher visibility from nearby Interstate 355
§ Land use conflicts arising adjacent residential§ Nearby vacant supermarket space creates negative perceptions§ Future status of the Target and former Dominick’s in Woodridge
REP 2016-6723 Page 54 of 59

Competitive Retail Alignment Study 34
75th StreetStrengths Weaknesses
§ Accessibility to neighborhood§ Strong big-box anchor retailers present§ Pace bus route§ National retailers§ Parking availability§ Outlot potential§ High average daily traffic counts§ Some centers feature landscaped parking lots
§ Vacancies in existing storefronts, particularly west of Lemont Road§ The Grove Shopping Center has an apparent surplus of parking
which overwhelms the site§ Poor visibility from street due to width of parking lots, small
signage, vegetation/buffered landscaping, deep setbacks fromparkway and road
§ One-way median access off of 75th Street and Lemont Road limitsvisibility and access
§ Strange/inefficient site & parking lot configuration§ Inadequate transit infrastructure§ Receiving/delivery to businesses adjacent to residential areas§ Limited adjacent office and hotel use limits demand§ Unappealing architecture
Opportunities Threats
§ Significant opportunity for infill development§ Nodal development on 75th Street and Lemont Road§ Upscale retail development in on 75th Street in nearby Darien
raises retail design standards
§ Wal-Mart and Home Depot in Darien draws activity away§ Retail leakage to Woodridge/Darien (newer retail
opportunities/better interstate access)§ Street network linking retail centers to Lemont Road
REP 2016-6723 Page 55 of 59

Competitive Retail Alignment Study 35
Supporting TablesFigure 32. Property Tax Code Rates for Principal Cities in DuPage County
Primary City Township 2013 2014 AnnualChange
Glendale Heights Bloomingdale Township 12.6354 13.2927 5.2%Carol Stream Bloomingdale Township 10.2032 10.5257 3.2%Bensenville Addison Township 10.094 10.4134 3.2%Aurora Winfield Township 10.0029 10.2205 2.2%Bartlett Wayne Township 11.8336 10.1156 -14.5%Bolingbrook Lisle Township 9.8869 10.1068 2.2%Woodridge Lisle Township 9.9155 10.0967 1.8%Elk Grove Village Addison Township 8.9105 9.9695 11.9%Aurora Naperville Township 9.7879 9.9634 1.8%Addison Bloomingdale Township 9.0604 9.4517 4.3%Lombard York Township 8.9748 9.2531 3.1%Bloomingdale Bloomingdale Township 8.5344 8.9496 4.9%Glen Ellyn Milton Township 8.4647 8.722 3.0%Itasca Addison Township 8.2639 8.6424 4.6%Lisle Lisle Township 8.3032 8.4873 2.2%Wood Dale Addison Township 8.0992 8.3248 2.8%Warrenville Winfield Township 7.9863 8.2512 3.3%Wheaton Milton Township 7.8747 8.1082 3.0%Winfield Milton Township 7.7186 8.0102 3.8%Warrenville Naperville Township 7.7814 8.008 2.9%Westmont Downers Grove Township 7.2014 7.603 5.6%Naperville Lisle Township 7.3129 7.4433 1.8%Naperville Naperville Township 7.2779 7.3814 1.4%Clarendon Hills Downers Grove Township 6.4722 6.5565 1.3%Downers Grove Lisle Township 6.3795 6.4798 1.6%Downers Grove York Township 6.3562 6.4568 1.6%Downers Grove Downers Grove Township 6.3462 6.4461 1.6%Hinsdale York Township 5.7334 5.8202 1.5%Willowbrook Downers Grove Township 5.1734 5.2841 2.1%Oak Brook York Township 3.8389 3.9263 2.3%Source: DuPage County
REP 2016-6723 Page 56 of 59
Competitive Retail Alignment Study 36
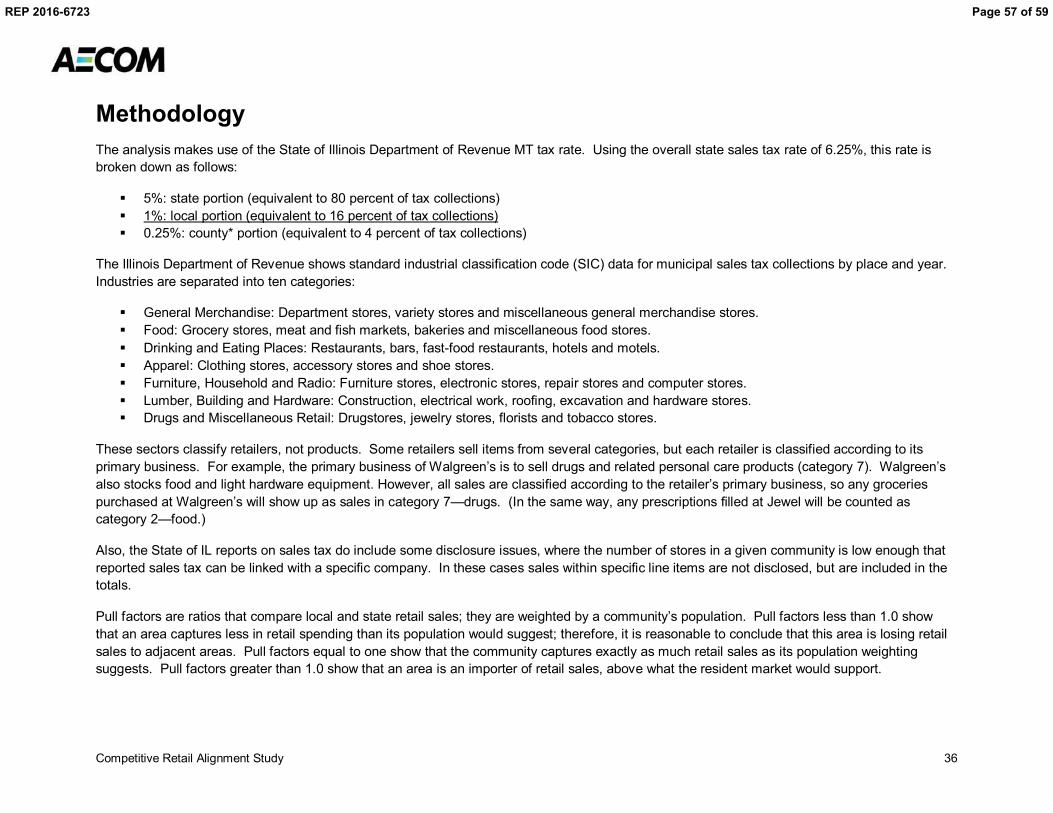
MethodologyThe analysis makes use of the State of Illinois Department of Revenue MT tax rate. Using the overall state sales tax rate of 6.25%, this rate isbroken down as follows:
§ 5%: state portion (equivalent to 80 percent of tax collections)§ 1%: local portion (equivalent to 16 percent of tax collections)§ 0.25%: county* portion (equivalent to 4 percent of tax collections)
The Illinois Department of Revenue shows standard industrial classification code (SIC) data for municipal sales tax collections by place and year.Industries are separated into ten categories:
§ General Merchandise: Department stores, variety stores and miscellaneous general merchandise stores.§ Food: Grocery stores, meat and fish markets, bakeries and miscellaneous food stores.§ Drinking and Eating Places: Restaurants, bars, fast-food restaurants, hotels and motels.§ Apparel: Clothing stores, accessory stores and shoe stores.§ Furniture, Household and Radio: Furniture stores, electronic stores, repair stores and computer stores.§ Lumber, Building and Hardware: Construction, electrical work, roofing, excavation and hardware stores.§ Drugs and Miscellaneous Retail: Drugstores, jewelry stores, florists and tobacco stores.
These sectors classify retailers, not products. Some retailers sell items from several categories, but each retailer is classified according to itsprimary business. For example, the primary business of Walgreen’s is to sell drugs and related personal care products (category 7). Walgreen’salso stocks food and light hardware equipment. However, all sales are classified according to the retailer’s primary business, so any groceriespurchased at Walgreen’s will show up as sales in category 7—drugs. (In the same way, any prescriptions filled at Jewel will be counted ascategory 2—food.)
Also, the State of IL reports on sales tax do include some disclosure issues, where the number of stores in a given community is low enough thatreported sales tax can be linked with a specific company. In these cases sales within specific line items are not disclosed, but are included in thetotals.
Pull factors are ratios that compare local and state retail sales; they are weighted by a community’s population. Pull factors less than 1.0 showthat an area captures less in retail spending than its population would suggest; therefore, it is reasonable to conclude that this area is losing retailsales to adjacent areas. Pull factors equal to one show that the community captures exactly as much retail sales as its population weightingsuggests. Pull factors greater than 1.0 show that an area is an importer of retail sales, above what the resident market would support.
REP 2016-6723 Page 57 of 59

Competitive Retail Alignment Study 37
Limiting ConditionsAECOM devoted the level of effort consistent with (i) the level of diligence ordinarily exercised by competent professionals practicing in the area under the same orsimilar circumstances, and (ii) consistent with the time and budget available for the Services to develop the Deliverables. The Deliverables are based onestimates, assumptions, information developed by AECOM from its independent research effort, general knowledge of the industry, and information provided byand consultations with Client and Client's representatives. No responsibility is assumed for inaccuracies in data provided by the Client, the Client'srepresentatives, or any third-party data source used in preparing or presenting the Deliverables. AECOM assumes no duty to update the information contained inthe Deliverables unless such additional services are separately retained pursuant to a written agreement signed by AECOM and Client.
AECOM’s findings represent its professional judgment. Neither AECOM nor its parent corporations, nor their respective affiliates or subsidiaries (“AECOMEntities”) make any warranty or guarantee, expressed or implied, with respect to any information or methods contained in or used to produce the Deliverables.
The Deliverables shall not to be used in conjunction with any public or private offering of securities, debt, equity, or other similar purpose where it may be reliedupon to any degree by any person other than the Client. The Deliverables shall not be used for purposes other than those for which they were prepared or forwhich prior written consent has been obtained from AECOM.
Possession of the Deliverables does not carry with it any right of publication or the right to use the name of "AECOM" in any manner without the prior expresswritten consent of AECOM. No party may reference AECOM with regard to any abstract, excerpt or summarization of the Deliverables without the prior writtenconsent of AECOM. AECOM has served solely in the capacity of consultant and has not rendered any expert opinions in connection with the subject matterhereof. Any changes made to the Deliverables, or any use of the Deliverables not specifically identified in the Agreement between the Client and AECOM orotherwise expressly approved in writing by AECOM, shall be at the sole risk of the party making such changes or use.
The Deliverables were prepared solely for the use by the Client. No third party may rely on the Deliverables unless expressly authorized by AECOM in writing(including, without limitation, in the form of a formal reliance letter. Any third party expressly authorized by AECOM in writing to rely on the Deliverables may do soonly on the Deliverable in its entirety and not on any abstract, excerpt or summary. Entitlement to rely upon the Deliverables is conditioned upon the entitled partyaccepting full responsibility for such use, strict compliance with this Agreement and not holding AECOM liable in any way for any impacts on the forecasts or theearnings resulting from changes in "external" factors such as changes in government policy, in the pricing of commodities and materials, changes in marketconditions, price levels generally, competitive alternatives to the project, the behavior of consumers or competitors and changes in the Client’s policies affectingthe operation of their projects.
The Deliverables may include “forward-looking statements”. These statements relate to AECOM’s expectations, beliefs, intentions or strategies regarding thefuture. These statements may be identified by the use of words like “anticipate,” “believe,” “estimate,” “expect,” “intend,” “may,” “plan,” “project,” “will,” “should,”“seek,” and similar expressions. The forward-looking statements reflect AECOM’s views and assumptions with respect to future events as of the date of theDeliverables and are subject to future economic conditions, and other risks and uncertainties. Actual and future results and trends could differ materially fromthose set forth in such statements due to various factors, including, without limitation, those discussed in the Deliverables. These factors are beyond AECOM’sability to control or predict. Accordingly, AECOM makes no warranty or representation that any of the projected values or results contained in the Deliverables willactually occur or be achieved. The Deliverables are qualified in their entirety by, and should be considered in light of, these limitations, conditions andconsiderations.
REP 2016-6723 Page 58 of 59

Downers Grove Sales Tax Revenue History
Home Rule Sales Tax (1.0% of total sales tax rate, 75% received in Capital Projects Fund, 25% received in General Fund)Does not apply to titled or registered tangible personal property (such as vehicles, watercraft, aircraft, trailers, and mobile homes), and qualifying food, drugs and medical appliances
Month % changeof Sale 2006 2007 2008 2009 2010 2011 2012 2013 2014 2015 from 2014
Jan 284,280 328,497 314,497 405,577 384,040 528,932 498,135 550,647 514,341 530,879 3.22%Feb 348,466 318,975 285,253 373,113 392,889 512,644 552,314 537,471 533,393 509,486 -4.48%Mar 286,731 379,698 341,592 485,805 428,900 597,676 616,736 596,764 605,286 574,884 -5.02%Apr 438,181 364,068 320,853 429,289 423,671 599,371 599,081 606,530 645,877 618,799 -4.19%May 388,678 389,659 361,553 461,190 458,100 635,253 660,068 732,861 679,924 692,883 1.91%Jun 388,060 373,243 351,647 483,819 483,860 658,091 700,346 674,790 627,034 700,140 11.66%Jul 371,027 360,523 490,038 430,193 597,273 618,015 599,457 603,056 642,048 637,241 -0.75%Aug 352,994 346,318 467,744 422,012 599,259 601,033 601,277 622,644 613,344 654,729 6.75%Sep 366,829 352,658 484,550 434,301 589,091 607,299 588,851 603,603 627,365 667,993 6.48%Oct 347,325 351,910 444,798 424,418 572,015 566,842 590,664 583,651 643,076 712,892 10.86%Nov 345,169 385,590 493,794 473,282 640,829 636,733 634,951 645,740 644,884 681,643 5.70%Dec 571,359 491,134 631,349 643,108 888,720 855,813 809,955 881,725 832,870 906,412 8.83%
Gross Total 4,489,099 4,442,273 4,987,667 5,466,107 6,458,646 7,417,701 7,451,835 7,639,481 7,609,442 7,887,981 3.66%Rebates - - - - - - - - - 66,425
Net Total 4,489,099 4,442,273 4,987,667 5,466,107 6,458,646 7,417,701 7,451,835 7,639,481 7,609,442 7,821,556 2.79%
Sales Tax (1.0% of total Sales Tax Rate, 100% received in General Fund)
Month % changeof Sale 2006 2007 2008 2009 2010 2011 2012 2013 2014 2015 from 2014
Jan 965,672 927,484 940,420 830,903 752,089 776,281 773,486 868,049 840,475 908,825 8.13%Feb 1,052,604 968,315 911,121 779,533 819,650 864,564 857,811 870,207 887,265 884,760 -0.28%Mar 917,795 1,129,276 1,063,030 984,377 837,431 923,617 970,227 965,692 1,028,695 1,000,337 -2.76%Apr 1,285,299 1,099,618 1,011,771 859,784 866,533 901,356 925,312 973,187 1,073,455 1,044,518 -2.70%May 1,177,793 1,137,944 1,065,209 930,210 909,975 888,019 1,031,740 1,222,972 1,122,502 1,146,404 2.13%Jun 1,088,389 1,108,633 1,050,539 955,138 986,196 973,958 1,048,232 1,040,053 973,530 1,109,639 13.98%Jul 1,168,401 1,058,415 1,006,968 890,242 914,802 938,100 946,669 999,766 1,075,534 1,087,996 1.16%Aug 1,054,686 1,035,718 973,975 869,600 927,922 945,294 986,767 1,025,052 1,036,924 1,117,375 7.76%Sep 1,064,638 1,092,440 959,244 847,099 892,245 909,687 948,365 943,288 1,051,973 1,088,543 3.48%Oct 1,010,145 1,098,633 884,282 833,572 843,419 881,314 930,881 954,925 1,025,781 1,140,596 11.19%Nov 1,006,068 1,107,710 966,996 926,473 938,935 937,150 994,580 998,105 1,051,432 1,069,077 1.68%Dec 1,483,844 1,342,829 1,096,025 1,156,959 1,224,615 1,201,281 1,154,285 1,261,570 1,242,504 1,324,940 6.63%
Gross Total 13,275,335 13,107,015 11,929,580 10,863,890 10,913,811 11,140,619 11,568,354 12,122,866 12,410,070 12,923,011 4.13%Rebates 574,787 717,573 678,162 563,750 605,489 829,286 796,174 777,864 970,621 928,184 -4.37%
Net Total 12,700,548 12,389,442 11,251,418 10,300,140 10,308,322 10,311,333 10,772,180 11,345,002 11,439,449 11,994,827 4.85%
REP 2016-6723 Page 59 of 59