sales and operations planning - diva portal808536/fulltext01.pdf · sales and operations planning...
TRANSCRIPT
Sales and Operations Planning: Complexities in the S&OP/CLSC interface
JOEL LARSSON
BEICHEN CHEN
Master of Science Thesis
Stockholm, Sweden 2015
Sälj- och Verksamhetsplanering: Komplexiteter i gränssnittet S&OP/CLSC
JOEL LARSSON
BEICHEN CHEN
Examensarbete
Stockholm, Sverige 2015
Sales and Operations Planning:
Complexities in the S&OP/CLSC interface
Joel Larsson
Beichen Chen
Examensarbete INDEK 2015:11
KTH Industriell teknik och management
Industriell ekonomi och organisation
SE-100 44 STOCKHOLM
Sälj- och verksamhetsplanering:
Komplexiteter i gränssnittet S&OP/CLSC
av
Joel Larsson
Beichen Chen
Examensarbete INDEK 2015:11
KTH Industriell teknik och management
Industriell ekonomi och organisation
SE-100 44 STOCKHOLM
Master of Science Thesis INDEK 2015:11
Sales and Operations Planning:
Complexities in the S&OP/CLSC interface
Joel Larsson
Beichen Chen
Approved
2015-04-15
Examiner
Jannis Angelis
Supervisor
Andreas Feldmann
Commissioner
Contact person
Abstract
Environmental concerns are increasing in today's marketplace as well as the pressure for companies to
be as efficient as possible in order to retain and gain market share. This has led to a need for
standardized processes. A process that has become increasingly more common in companies is the
sales and operations planning (S&OP) process which aims to match demand with supply. With the
environmental concern growing in interest it is becoming more important for companies to reuse a
product in order to utilize the remaining value of the product. This if often only done if there is
financial gains from the commitment. This is done in a closed loop supply chain where Original
Equipment Manufacturers (OEM) takes back and remanufacture, refurbish and repair used products.
With a growing interest in closed loop supply chains it is becoming increasingly more important for
companies to be efficient in this area as well. The focal company of this study is working with their
sales and operations planning process as well as with remanufactured products in order to become
more efficient with their processes they want to integrate the remanufactured products, in this study
called R2 products into the already existing S&OP process. The aim of this study was hence to
investigate what complexities that may arise when remanufactured products are integrated into an
S&OP process, i.e. what challenges that would occur when remanufactured products were brought in
to the S&OP process.
The case design included semi-structured interviews as the main data source. The results of the study
showed that complexities may arise in all five steps of the S&OP process. The main findings showed
that the biggest impact of integration would be in the first two stages of the five step process, having
the most complexities. This study has both academic and managerial implications. In academia the
study contributes with knowledge in an interface which at the time of this study has been paid very
little attention in research. This study also provides researchers with a conceptual framework which
can be tested in other settings and used as a basis for further evaluation of this interface. The
managerial implications comes from having the possibility by this study to know potential areas that
will need extra attention before an integration of remanufactured products is conducted. The
framework presented in this study can provide managers with a checklist to follow in the integration
process.
Key-words
Sales and Operations Planning, Closed loop supply chain, Remanufacturing
Examensarbete INDEK 2015:11
Sälj- och Verksamhetsplanering:
Komplexiteter i gränssnittet S&OP/CLSC
Joel Larsson
Beichen Chen
Godkänt
2015-04-15
Examinator
Jannis Angelis
Handledare
Andreas Feldmann
Uppdragsgivare
Kontaktperson
Sammanfattning
Den miljömässiga medvetenheten på dagens marknader ökar och likaså trycket på företag att vara så
effektiva som möjligt för att behålla och vinna markandsandelar. Detta har lett till att behov av att
standardisera processer där en mer vanligt förekommande process är sälj- och
verksamhetsledningsprocessen (Sales and Operations Planning) som har till uppgift att balansera
utbud och efterfrågan. Med den ökande miljömässiga medvetenheten blir det mer och mer viktigt för
företag att öka längden på produktens livscykel genom att ta tillvara på det resterande värdet när den
initiala kunden nått sitt slut på användandet. Detta görs dock ofta endast om det även är lönsamt för
företaget. Detta görs i en så kallad sluten försörjningskedja (closed loop supply chain) där
originaltillverkare tar tillbaka produkter och omarbetar dem för att ge dem nytt liv. Med ökande
intresse och globalt tryck om hållbarhet är även detta ett område där företag börjar sträva mot att bli
mer effektiva. Fallföretaget i denna studie arbetar med sälj och verksamhetsledning, tillika med
omarbetade produkter. För att blir att öka effektiviteten i deras processer vill de därför integrera deras
omarbetade produkter i den befintliga sälj och verksamhetsledningsprocessen. I denna studie kallas
dessa produkter för R2. Syftet med denna studie var således att undersöka vilka komplexiteter som kan
uppkomma vid denna integrering. Det vill säga, vilka oväntade utmaningar som kan framkomma när
R2 produkterna integreras i sälj och verksamhetsledningsprocessen.
Fallstudiens utformning inkluderade semistrukturerade intervjuer som huvudsaklig datakälla.
Resultaten av studien visade att komplexiteter kan uppkomma i alla fem delar av sälj- och
verksamhetsledningsprocessen. De huvudsakliga resultaten visade dock att den största påverkan skulle
hamna i de första två stegen av den fördefinierade femstegsprocessen. Denna studie har både
akademiska och praktiska implikationer. För akademin bidrar studien med kunskap i gränssnittet
mellan sälj- och verksamhetsledning och omarbetade produkter. Den bidrar också med ett konceptuellt
ramverk som kan användas av forskare för att vidareutveckla och utvärdera gränssnittet. De praktiska
implikationerna kommer från att denna studie ger möjlighet för beslutsfattare i företage att förstå
potentiella områden som behöver extra uppmärksamhet före en integration av omarbetade produkter
genomförs.
Nyckelord
Sälj och verksamhetsplanering, sluten försörjningskedja, omarbetning
Preface
This study, as a final project of a five year engineering program becomes a finish line, but also a
starting point for future endeavors. This journey has brought laughter, tears and very much joy and
would not have been possible without true support from family and friends, which we will always be
grateful for.
We also like to thank the sponsors at the focal company for hosting us and contributing with many
hours of knowledge, practical guidance and understanding which brought a lot of knowledge and
understanding that will never be forgotten. We would also like to thank our supervisor Andreas
Feldmann, lecturer at KTH for the discussions and inspiration during the last three years.
Stockholm, April 2015
Joel Larsson & Beichen Chen
Nomenclature
CLSC Closed Loop Supply Chains
DOA Dead on Arrival
EMEA Europe, the Middle East and Africa
OEM Original Equipment Manufacturer
PRM Product Returns Management
R2 Round Two (Remanufactured products in the focal company)
S&OP Sales and Operations Planning
USCAN USA/Canada
Table of content
1. INTRODUCTION ............................................................................................................................. 1
1.1 PROBLEM FORMULATION ............................................................................................................... 2
1.2 PURPOSE AND AIM ......................................................................................................................... 2
1.3 RESEARCH QUESTIONS ................................................................................................................... 2
1.4 DELIMITATIONS ............................................................................................................................. 3
1.5 DISPOSITION .................................................................................................................................. 3
2. THEORETICAL FRAMEWORK................................................................................................... 4
2.1 SALES AND OPERATIONS PLANNING (S&OP) ............................................................................... 4
2.2 CLOSED LOOPS SUPPLY CHAINS AND REMANUFACTURING ........................................................... 9
2.3 GAP ANALYSIS AND SUMMARY OF THE THEORETICAL FRAMEWORK ......................................... 15
3. METHODOLOGY .......................................................................................................................... 16
3.1 CASE STUDY ................................................................................................................................. 16
3.2 RESEARCH DESIGN ....................................................................................................................... 17
3.3 VALIDITY & RELIABILITY ........................................................................................................... 21
3.4 ETHICS AND ANONYMITY ............................................................................................................ 22
4. EMPIRICAL CHAPTER OF THE FOCAL COMPANY .......................................................... 23
4.1 THE FOCAL COMPANY .................................................................................................................. 23
4.2 SALES AND OPERATIONS PLANNING AT THE FOCAL COMPANY ................................................... 23
4.3 REMANUFACTURING IN THE ORGANIZATION ............................................................................... 25
4.4 SUMMARY AND ANALYSIS ........................................................................................................... 26
5. ANALYSIS - S&OP PROCESS COMPLEXITIES ..................................................................... 28
5.1 DEMAND SIDE COMPLEXITIES ...................................................................................................... 28
5.2 SUPPLY SIDE COMPLEXITIES ........................................................................................................ 35
5.3 S&OP EXECUTIVE COMPLEXITIES ............................................................................................... 39
5.4 SUMMARY OF ANALYSIS .............................................................................................................. 44
6. DISCUSSION AND CONCLUSIONS ........................................................................................... 45
6.1 CONCEPTUAL CONTRIBUTION ...................................................................................................... 46
6.2 SUMMARY OF FINDINGS ............................................................................................................... 47
6.3 EMPIRICAL CONTRIBUTION .......................................................................................................... 47
6.4 LIMITATIONS AND FUTURE RESEARCH ........................................................................................ 48
REFERENCES .................................................................................................................................... 49
APPENDIX A – INITIAL OPEN INTERVIEWS ......................................................................................... 55
APPENDIX B – INTERVIEW QUESTIONS FOR SEMI-STRUCTURED INTERVIEWS ................................... 56
APPENDIX C – SEMI-STRUCTURED INTERVIEWS ............................................................................... 60
List of figures
Figure 1: The five steps of the S&OP process (Wallace & Stahl, 2008) ................................................. 1
Figure 2: S&OP process by Grimson and Pyke (2007) ........................................................................... 6
Figure 3: The five steps of the S&OP process (Wallace & Stahl, 2008) ................................................. 6
Figure 4: The closed-loop supply chain (Guide Jr. & Van Wassenhove, 2006) ..................................... 9
Figure 5: The recoverable manufacturing system (Thierry, et al., 1995) .............................................. 10
Figure 6: Distinctive characteristics in the S&OP/CLSC interface ....................................................... 15
Figure 7: Research process (Stuart, et al., 2002) ................................................................................... 17
Figure 9: The S&OP process in the focal company (Focal Company, 2014a)...................................... 24
Figure 10: Demand side complexities ................................................................................................... 35
Figure 11: Information flow of supply and demand data ...................................................................... 38
Figure 12: Supply side complexities ..................................................................................................... 39
Figure 13: S&OP executive complexities ............................................................................................. 43
Figure 14: Summary of conceptual framework ..................................................................................... 47
List of tables Table 1: Disposition of the study ............................................................................................................ 3
Table 2: Modified table of complicating characteristics in a CLSC (Guide Jr., 2000; Guide Jr. & Van
Wassenhove, 2006) ............................................................................................................................... 11
Table 3: Modified table of manufacturing factors (Guide Jr., et al., 2000) ........................................... 13
Table 4: Summary of interview types ................................................................................................... 20
Table 5: Validity and reliability summary ............................................................................................. 22
Table 6: Attitude to integration of R2 ................................................................................................... 42
Table 7: Awareness of R2 ..................................................................................................................... 43
Table 8: Summary of S&OP complexities ............................................................................................ 44
1
1. Introduction
This chapter presents a background to the research and a problem formulation, together with the
purpose, the research questions, the delimitations and the disposition of the study.
In the past, planning of sales and production were seen as two separate areas which were measured on
different goals (Wahlers & Cox, 1994). But with a rapid changing business environment there is a
need for coordination and standardization of processes within companies in order to be able to
compete in the marketplace. To optimize and utilize the resources in the most efficient way, there is a
need to have a process which brings control to the company. The sales and operations planning
(S&OP) process is often used for this purpose (Vollman & et al, 2005). During the 21st century the
importance of S&OP have grown which can be seen by the synthesis made by Thomé et al. (2012)
which shows that the number of papers on S&OP increased drastically from 2002 to 2010. S&OP
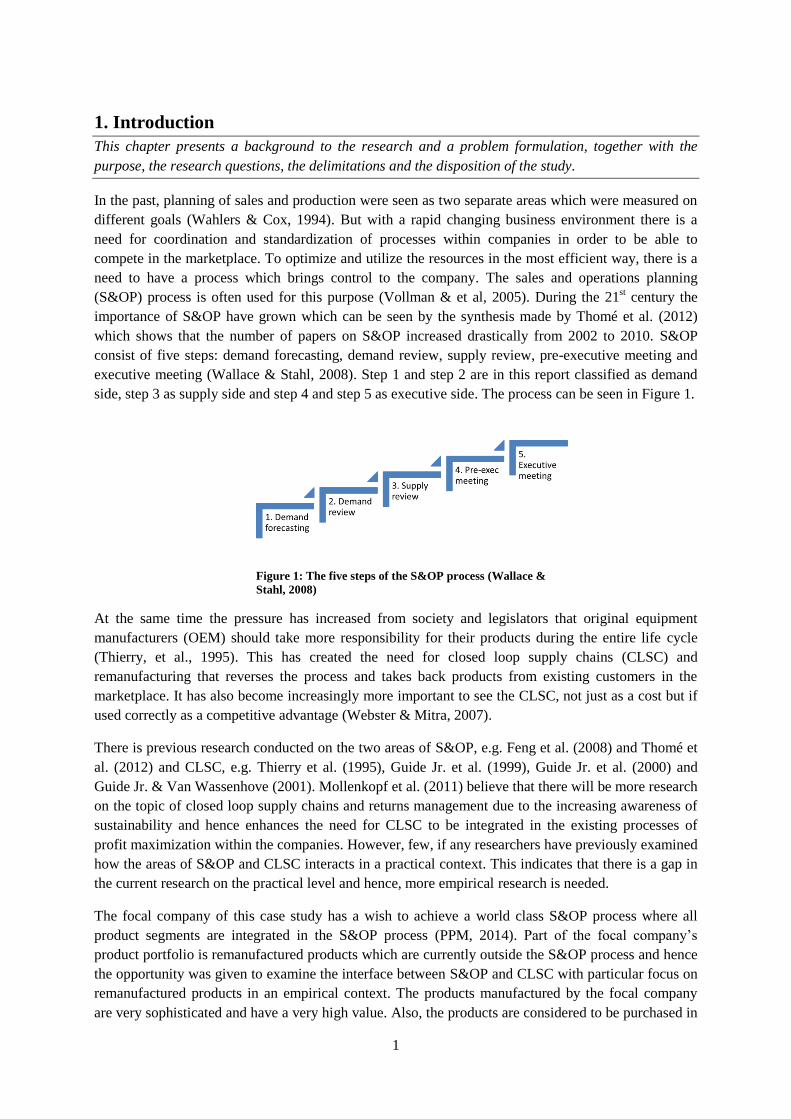
consist of five steps: demand forecasting, demand review, supply review, pre-executive meeting and
executive meeting (Wallace & Stahl, 2008). Step 1 and step 2 are in this report classified as demand
side, step 3 as supply side and step 4 and step 5 as executive side. The process can be seen in Figure 1.
At the same time the pressure has increased from society and legislators that original equipment
manufacturers (OEM) should take more responsibility for their products during the entire life cycle
(Thierry, et al., 1995). This has created the need for closed loop supply chains (CLSC) and
remanufacturing that reverses the process and takes back products from existing customers in the
marketplace. It has also become increasingly more important to see the CLSC, not just as a cost but if
used correctly as a competitive advantage (Webster & Mitra, 2007).
There is previous research conducted on the two areas of S&OP, e.g. Feng et al. (2008) and Thomé et
al. (2012) and CLSC, e.g. Thierry et al. (1995), Guide Jr. et al. (1999), Guide Jr. et al. (2000) and
Guide Jr. & Van Wassenhove (2001). Mollenkopf et al. (2011) believe that there will be more research
on the topic of closed loop supply chains and returns management due to the increasing awareness of
sustainability and hence enhances the need for CLSC to be integrated in the existing processes of
profit maximization within the companies. However, few, if any researchers have previously examined
how the areas of S&OP and CLSC interacts in a practical context. This indicates that there is a gap in
the current research on the practical level and hence, more empirical research is needed.
The focal company of this case study has a wish to achieve a world class S&OP process where all
product segments are integrated in the S&OP process (PPM, 2014). Part of the focal company’s
product portfolio is remanufactured products which are currently outside the S&OP process and hence
the opportunity was given to examine the interface between S&OP and CLSC with particular focus on
remanufactured products in an empirical context. The products manufactured by the focal company
are very sophisticated and have a very high value. Also, the products are considered to be purchased in
Figure 1: The five steps of the S&OP process (Wallace &
Stahl, 2008)
2
relatively low volumes and only by institutions and companies, i.e. they are Business to Business
products (B2B).
1.1 Problem formulation
Much is written about different topics relating to S&OP e.g. Lapide (2003; 2005; 2007), Sheldon
(2006), Feng et al. (2008) and Thomé et al. (2012). Also very much is written on different topics
regarding CLSC and remanufacturing e.g. Muckstadt & Isaac (1981), Thierry et al. (1995), Lund
(1998), Guide Jr et al. (1999; 2000; 2001; 2006). However, as far as the researchers are concerned
there is no attempt to fill the gap of examining the interface between the S&OP and CLSC with
particular focus on remanufactured products in a practical setting. This is also particularly interesting
since Guide Jr. and Srivastava (1998) support that coordination processes for demand are important,
but that these processes are more complex for remanufactured products compared to traditional
manufacturing which emphasize the need for this type of study. The existing gap in the literature
combined with the case study company’s wish to achieve more efficient processes for remanufactured
products makes this study highly valid in terms of contribution.
Therefore this study paid special attention to the gap in the existing body of knowledge and a case
study was conducted to understand and highlight complexities, i.e. complicating factors that make the
integration of remanufactured products more difficult than the integration of regular products in a
forward supply chain into an S&OP process.
1.2 Purpose and aim
The purpose of this study was hence to, from a pre-implementation perspective identify and list
potential complexities that may occur when remanufactured products are integrated into an S&OP
process. This was done in order to fulfill the aim of study; to contribute to the existing body of
knowledge around sales and operations planning and closed loop supply chains in regards of the
additional complexities that occur from having remanufactured products as part of the S&OP process.
The unit of observation for collecting data was the people employed within the S&OP process and the
R2 team.
1.3 Research questions
The purpose of the study was to investigate potential complexities, i.e. additional difficulties that
closed loop supply chains and in particular remanufactured products brings to a sales and operations
planning process from a pre-implementation perspective, and the aim of this study was achieved by
answer the main research question:
What complexities arise when remanufactured products are added to a sales and operations
planning process for high-value, low volume, B2B products?
To answer the main research question, three sub questions were answered:
1. What demand side complexities arise when remanufactured products are added to a sales
and operations planning process for high-value, low volume, B2B products?
2. What supply side complexities arise when remanufactured products are added to a sales and
operations planning process for high-value, low volume, B2B products?
3. What executive side complexities arise when remanufactured products are added to a sales
and operations planning process for high-value, low volume, B2B products?
3
1.4 Delimitations
This study was conducted within one focal company, and was delimited to two product groups which
in this report are called Apple and Berry. The study was also limited to the USA/Canada (USCAN)
and Europe, Middle East, Africa (EMEA) regions, since these two regions according to the Product
Manager for Remanufacturing (2014) (PPR) have the biggest exchange with the remanufacturing
team, even though the focal company has businesses in other parts of the world. The study only
examined the focal company itself and did not include customers and suppliers. The phenomenon
studied was the focal company’s sales and operations planning process, and the planning process at the
time of the study for remanufactured products, and hence the interviews were held with employees
involved in these two processes. Due to lack of time, sales representatives who actively meet and talk
to customers were represented by their managers. By studying the focal company, a natural
delimitation came from the type of products which the focal company is producing. The products can
be described as high value products with a very high technical complexity. These products are
business to business (B2B) products sold in relatively low volumes. Hence the results from this study
are suggested to only be valid in this context and would need further studies to be able to generalize to
other settings. Further, since the S&OP process can be seen as an administrative process, focus was
placed on identifying administrative or strategic complexities rather than on the technological
complexities that arose in the workshop when working on remanufactured products.
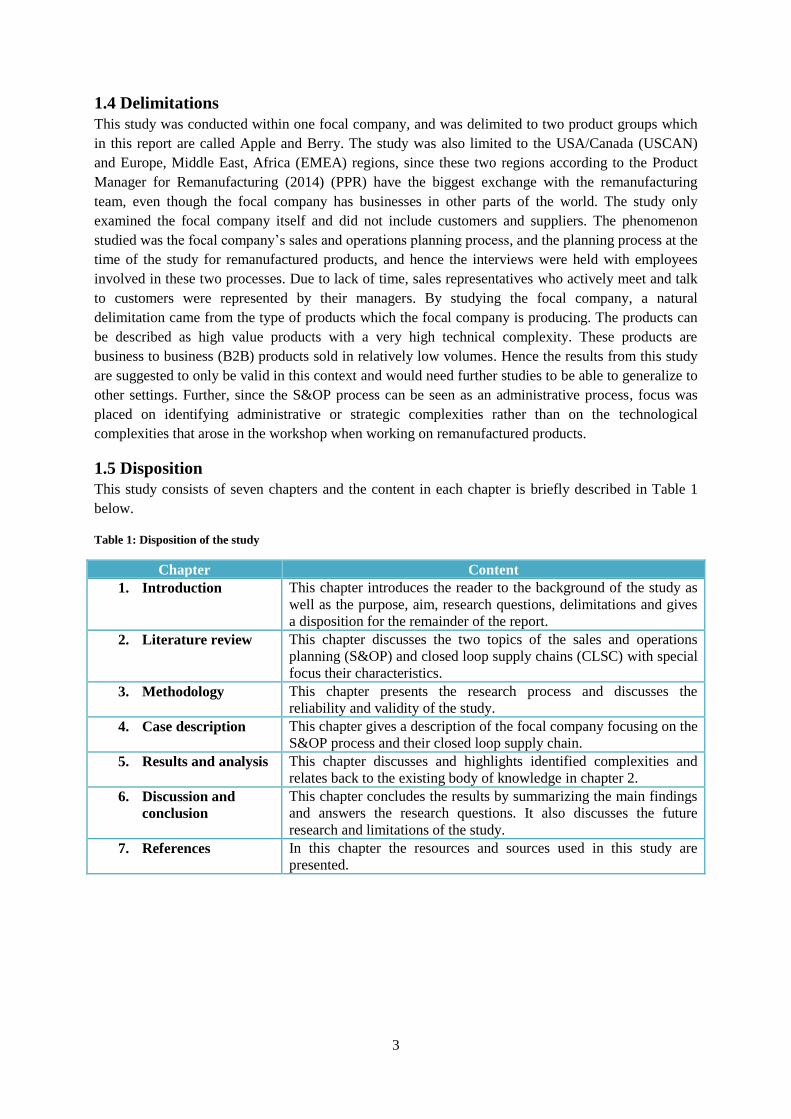
1.5 Disposition
This study consists of seven chapters and the content in each chapter is briefly described in Table 1
below.
Table 1: Disposition of the study
Chapter Content
1. Introduction This chapter introduces the reader to the background of the study as
well as the purpose, aim, research questions, delimitations and gives
a disposition for the remainder of the report.
2. Literature review This chapter discusses the two topics of the sales and operations
planning (S&OP) and closed loop supply chains (CLSC) with special
focus their characteristics.
3. Methodology This chapter presents the research process and discusses the
reliability and validity of the study.
4. Case description This chapter gives a description of the focal company focusing on the
S&OP process and their closed loop supply chain.
5. Results and analysis This chapter discusses and highlights identified complexities and
relates back to the existing body of knowledge in chapter 2.
6. Discussion and
conclusion
This chapter concludes the results by summarizing the main findings
and answers the research questions. It also discusses the future
research and limitations of the study.
7. References In this chapter the resources and sources used in this study are
presented.
4
2. Theoretical framework
The literature review consists of two parts corresponding to the two main areas of relevant existing
knowledge: sales and operations planning (S&OP) and closed loop supply chains (CLSC). The S&OP
literature is used as the foundation for the proposed research questions, for the empirical research
and for the conducted analysis. In the first part, the concept of S&OP is introduced and the steps of
the process are described. This is followed by a description of distinctive characteristics of the S&OP
process. The second part follows the same structure as the previous part; the concept of closed loop
supply chains is first introduced followed by a description of the distinctive characteristics of such
systems. The literature chapter is concluded with a visualization of the existing gaps and a suggested
theoretical framework.
2.1 Sales and Operations Planning (S&OP)
In this chapter the concept of Sales and operations planning is presented as well as descriptions of
distinctive characteristics for an S&OP process.
2.1.1 Definition, purpose and features of S&OP
Sales and operations planning (S&OP) is defined by the American Production and Inventory Control
Society (APICS) (2013) as:
“A process to develop tactical plans that provide management the ability to strategically direct its
businesses to achieve competitive advantage on a continuous basis by integrating customer-focused
marketing plans for new and existing products with the management of the supply chain…”
Many descriptions of S&OP as a concept are introduced by different authors (Olhager, et al., 2001;
Olhager & Rudberg, 2002; Kathuria, et al., 2007; Thomé, et al., 2012) depending on their
perspectives. S&OP is by Thomé et al. (2012) described as a tool that helps a business to consolidate
business plans where the purpose is twofold: to balance supply and demand, and to link the strategic
plans of the firm to the operational plans and hence create strong links and alignment within the
company. The main purpose of S&OP is hence to align the entire firm to achieve the same goals, both
vertically from strategy to operations, and horizontally between functions and intra-functionally, i.e.
within functions themselves (Kathuria, et al., 2007). Feng et al. (2008) conclude that a fully integrated
S&OP model in which sales, production, distribution and procurement are joined yields higher
financial return than a partially integrated S&OP model in which sales and production are done jointly
but distribution and procurement are done separately or completely decoupled. Thomé et al. (2012)
summarizes the work around S&OP carried out by Grimson and Pyke (2007), Feng et al. (2008), and
Nakano (2009) into four features:
(i) Cross-functional and tactical planning process
(ii) Integrates separate plans within the firm to a unified plan
(iii) S&OP has a planning horizon spanning up to 18 months
(iv) S&OP creates value and increases the performance of the firm.
S&OP evolved from a need to coordinate the sales and manufacturing functions in firms. Wahlers &
Cox (1994) highlight the lack of coordination of information flow, products and services as a growing
concern and explicitly point out the separation between sales and manufacturing. Sales performance
was often measured on sales volumes and revenue without any consideration taken to organizational
bottom line profit, i.e. potential costs of producing the products. The cost control was considered the
responsibility of the manufacturing function, by optimizing labor, material and equipment efficiency.
Very local performance was often measured with no consideration taken to the overall business
5
objectives. Nowadays, in an increasingly competitive environment there is a constant need to develop
and increase coordination between functions and as a part of that the S&OP process is gaining
increased recognition (Feng, et al., 2008).
2.1.2 The steps of the S&OP process
Different descriptions are made by different authors of the S&OP process. Below are the processes by
Grimson and Pyke (2007) and Wallace and Stahl (2008) described to give some contrast to different
perspectives of the process, even if it essentially is the same procedure. Both Grimson and Pyke
(2007) and Wallace and Stahl (2008) describe the S&OP process as having five steps.
Grimson and Pyke (2007) draw from several previous authors when they describe the S&OP process
e.g. (Rooney & Bangert, 2001; Kruse, 2003; Lapide, 2003; Lapide, 2005). The process starts when
employees within the commercial organization of a company gather unconstrained projected sales data
which is used as an initial forecast. The unconstrained forecast should refer to how much the company
is able to sell to the customers if not limited by production. Thereafter the forecast is adjusted by
potential marketing plans such as trade shows and promotions of certain products where the demand
can temporarily increase. This first step also includes information about new product introductions and
product obsolescence.
The second step of the process includes what Grimson and Pyke (2007) refer to as pre-meetings held
with the operations team. This meeting is conducted prior to a third meeting where the plans for the
next period are set. The operations team collects data about internal capacity, such as production and
inventory and supply chain capacity. In parallell the commercial team continues to improve their
forecasts by gathering more data.
In the third step of the process, the S&OP team, which includes representatives from sales and
marketing, operations and finance, meets and together develops the plan which set the guidelines for
the next period. Thereafter a strategy is set on whether the company should build inventory or try to
reduce it in order to meet the coming demand in the next period (Grimson & Pyke, 2007). From the
third step, an adjusted plan comes out based on the improvements made in the forecast which is called
termed “commitment-to-order” (CTO) and is an overall agreement of what can be produced and
supplied and hence reflect finance, marketing and supply chain (Chen-Ritzo, et al., 2010). This step of
the process improves dramatically if an S&OP champion is participating, i.e. usually a senior
executive who has the authority to grant implementation of the planning decisions.
The fourth step of the plan described by Grimson and Pyke (2007) is to distribute the S&OP plan to
the respective teams, i.e. sales team, marketing team and operations team. As a fifth and final step the
results of the S&OP process are measured using Key Performance Indicators (KPIs). These measures
vary among industries and even product lines and can be anything from inventory on hand to obsolete
inventory, capacity utilization and lead times. If there is a new product introduction, measurements
such as development costs and ramp-up time as well as market share and forecast accuracy are
important. Improved forecasting accuracy could, as a result, lead to reduced inventories of raw
materials and finished goods (Croxton, et al., 2002). From the financial perspective, indicators like
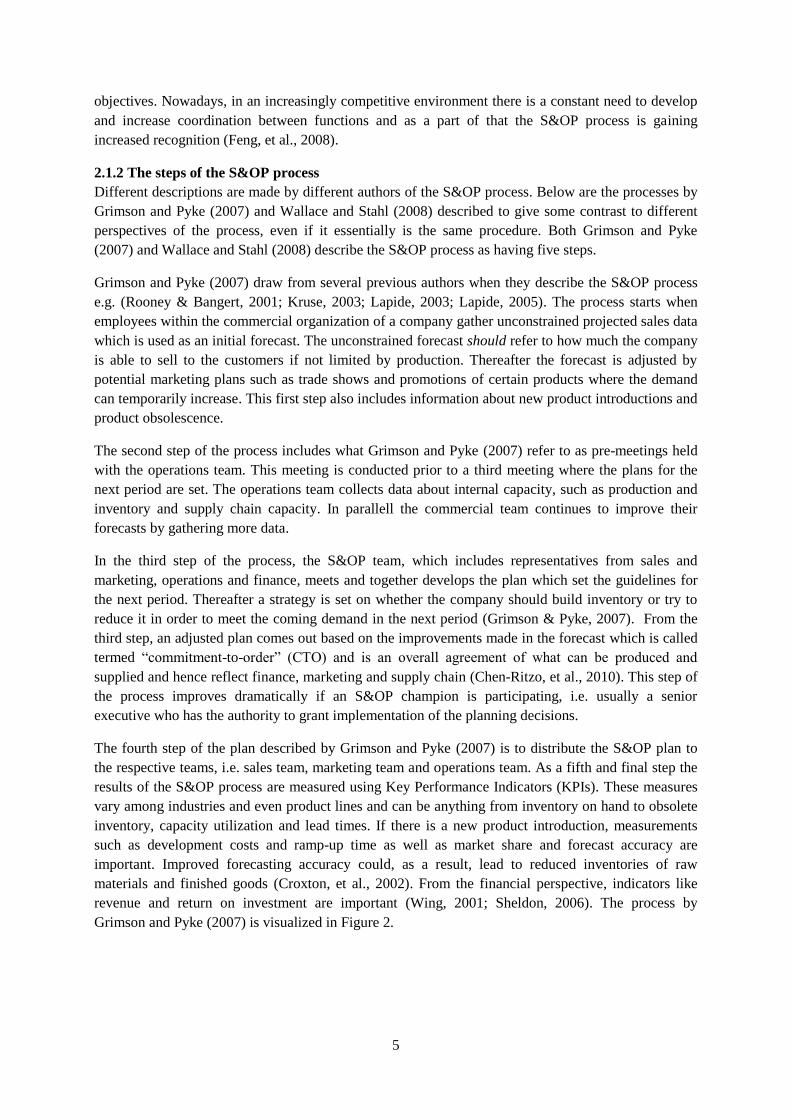
revenue and return on investment are important (Wing, 2001; Sheldon, 2006). The process by
Grimson and Pyke (2007) is visualized in Figure 2.
6
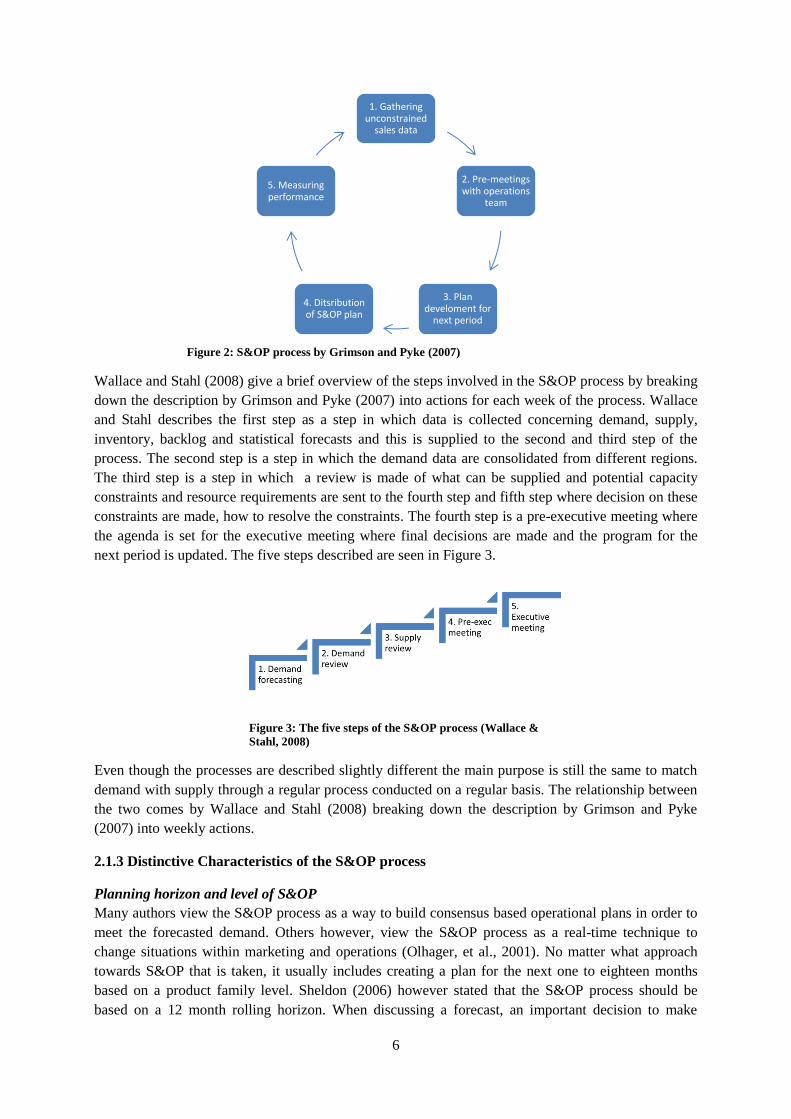
Wallace and Stahl (2008) give a brief overview of the steps involved in the S&OP process by breaking
down the description by Grimson and Pyke (2007) into actions for each week of the process. Wallace
and Stahl describes the first step as a step in which data is collected concerning demand, supply,
inventory, backlog and statistical forecasts and this is supplied to the second and third step of the
process. The second step is a step in which the demand data are consolidated from different regions.
The third step is a step in which a review is made of what can be supplied and potential capacity
constraints and resource requirements are sent to the fourth step and fifth step where decision on these
constraints are made, how to resolve the constraints. The fourth step is a pre-executive meeting where
the agenda is set for the executive meeting where final decisions are made and the program for the
next period is updated. The five steps described are seen in Figure 3.
Even though the processes are described slightly different the main purpose is still the same to match
demand with supply through a regular process conducted on a regular basis. The relationship between
the two comes by Wallace and Stahl (2008) breaking down the description by Grimson and Pyke
(2007) into weekly actions.
2.1.3 Distinctive Characteristics of the S&OP process
Planning horizon and level of S&OP
Many authors view the S&OP process as a way to build consensus based operational plans in order to
meet the forecasted demand. Others however, view the S&OP process as a real-time technique to
change situations within marketing and operations (Olhager, et al., 2001). No matter what approach
towards S&OP that is taken, it usually includes creating a plan for the next one to eighteen months
based on a product family level. Sheldon (2006) however stated that the S&OP process should be
based on a 12 month rolling horizon. When discussing a forecast, an important decision to make
Figure 3: The five steps of the S&OP process (Wallace &
Stahl, 2008)
1. Gathering unconstrained
sales data
2. Pre-meetings with operations
team
3. Plan develoment for
next period
4. Ditsribution of S&OP plan
5. Measuring performance
Figure 2: S&OP process by Grimson and Pyke (2007)
7
considers the planning horizon. This horizon usually ranges between six months to three years
(Grimson & Pyke, 2007). However this planning horizon varies between industries, by product and
seasonality and is usually longer for products with long lead times and high seasonality (Grimson &
Pyke, 2007). A study is made by Guide Jr. and Jayaraman (2000) where they state that for
remanufactured products 75% of remanufacturing firms have a planning horizon of 16 weeks and 20%
have a planning horizon of less than four weeks.
Meeting frequency
In the literature the meeting frequency is usually suggested to be monthly but according to the study
by Grimson and Pyke (2007), companies seem to be moving toward more frequent meetings and some
leading companies are even working with an event-driven S&OP process in which managers respond
to situations that arise, such as competitor product changes. Thomé et al. (2012) and Bower (2005)
also discuss the meeting frequency and conclude that it is important to have regular meetings and
create a culture with trust and confidence among the team.
Information systems utilization
An area that is contrasting in the literature concerns information systems which by some authors are
seen as an important part of the S&OP process for facilitating the work. However there seems to be no
agreement among academics, on the level of investment in information systems to support the process.
Some recommend spreadsheets while others clearly advocate the use of sophisticated IT systems
(Thomé, et al., 2012). Sheldon (2006) proclaim that the use of simple IT tools are preferable since it
takes less time to make changes when for example prices or product families changes compared to
using sophisticated ERP systems.
S&OP as a mediator
Slightly contradictive to researchers who have not examined the role of the S&OP process as a
mediator of goals within the firm, Oliva and Watson (2011) show in their research that there is at least
partial evidence that the S&OP process helps make a difference in the performance of the firm. This
happens even when there are different incentive structures for different functions in the firm and the
environment is not collaborative. This means that there are different incentives for different functions
within the organization and hence all functions are not streamlined to achieve the same goals. Despite
this Oliva and Watson (2011) conclude that S&OP has a positive impact on the performance of the
firm.
Characteristics of an S&OP framework
There have been few attempts to synthesize the S&OP literature and much of what is written is done
on a consultancy/own experience basis rather than research basis e.g. (Lapide, 2002; Sheldon, 2006;
Lapide, 2007). Tuomikangas and Kaipia (2014) are however among the latest researchers concluding
their findings in a six aspect framework with mechanisms consisting of S&OP process, S&OP tools
and data, S&OP Culture and Leadership, S&OP Organization, S&OP Performance Management, and
S&OP Strategic alignment. Out of these six the focus of this study is on the S&OP process as the main
element, however it is believed that since the S&OP process is one part of six in the framework by
Tuomikangas and Kaipia (2014) it cannot be excluded that all the complexities can be found within
the S&OP process only. Below are the different parts of the framework described.
S&OP organization mechanism aims to identify key actors and functions involved in the S&OP
process as well defining the formal structure of the stakeholders and responsibilities within the S&OP.
Milliken (2008) especially emphasize that in order to succeed there is a need to determine S&OP
process team members and positions as well as laying out the structure for the coming meetings. The
8
S&OP process mechanism defines the formal planning activities, decision making activities and other
collaborative activities. Milliken (2008) adds that to succeed there should be clear planning groups,
planning horizon and resources available. The S&OP tools and data mechanism aims to provide the
best set of data and good IT tools. It makes sure that common data and common validation and
interpretation of data are carried out within the process. This is considered to be very important for the
decision making process. Tuomikangas and Kaipia (2014) further suggest that data used in the process
should be accurate, updated frequently and appropriate in order to be useful for the members of the
S&OP process. Ivert and Jonsson (2010) particularly highlight the importance of continuously
updating the system with correct data in order for personnel not to lose confidence in the system. In
the case of this study it is important to understand the users’ use of the data and how the data from the
remanufactured products fit in with the current way of working. The S&OP performance management
which aims to measure financial, process and operational performance should therefore define the
activities in order for the organization to be able to do that. Financial performance considers costs and
revenue optimization measures, process performance concerns measurements such as learning effects
and planning efficiency, and operational performance concerns measurements such as order fill rate
and delivery speed. The importance of measurements is also highlighted by Milliken (2008)
emphasizing the need to have measurement procedures in place.
The Strategic alignment mechanism aims to act as a link between long-term strategic plans and short
term operational goals. The last mechanism, S&OP culture and leadership, aims at creating a culture
where the use of S&OP is successful. This includes the organizational mindset and practices that
facilitate and improve the planning processes. It should make sure to have the right corporate norms,
commitment, trust, rewards and incentives. These different capabilities are achieved through training,
communication and staff development (Thomé, et al., 2012), something that is also supported by
Milliken (2008).
9
2.2 Closed loops supply chains and remanufacturing
In this chapter the closed loop supply chain (CLSC) system is introduced followed by a description of
remanufacturing and finalized with characteristics of such systems.
2.2.1 Closed loop supply chain
In Europe customers and authorities require the manufacturers to take more responsibility for their
products than before (Thierry, et al., 1995). The customers are concerned about the environment and
authorities increase the product disposal cost (Thierry, et al., 1995). In the US on the other hand,
incentives are driven by the market place and therefore presents another focus for the products that are
being returned (Guide Jr. & Van Wassenhove, 2001). Kocabasoglu et al. (2007) emphasize that CLSC
have the potential to reduce negative environmental impact, however the investments made in CLSC
must be in integration with forward supply chain investments such as S&OP. Guide et al. (2003)
define a closed loop supply chain (CLSC) as:
"A supply chain network that includes the returns processes and where the manufacturer has the intent
of capturing additional value and further integrating all supply chain activities."
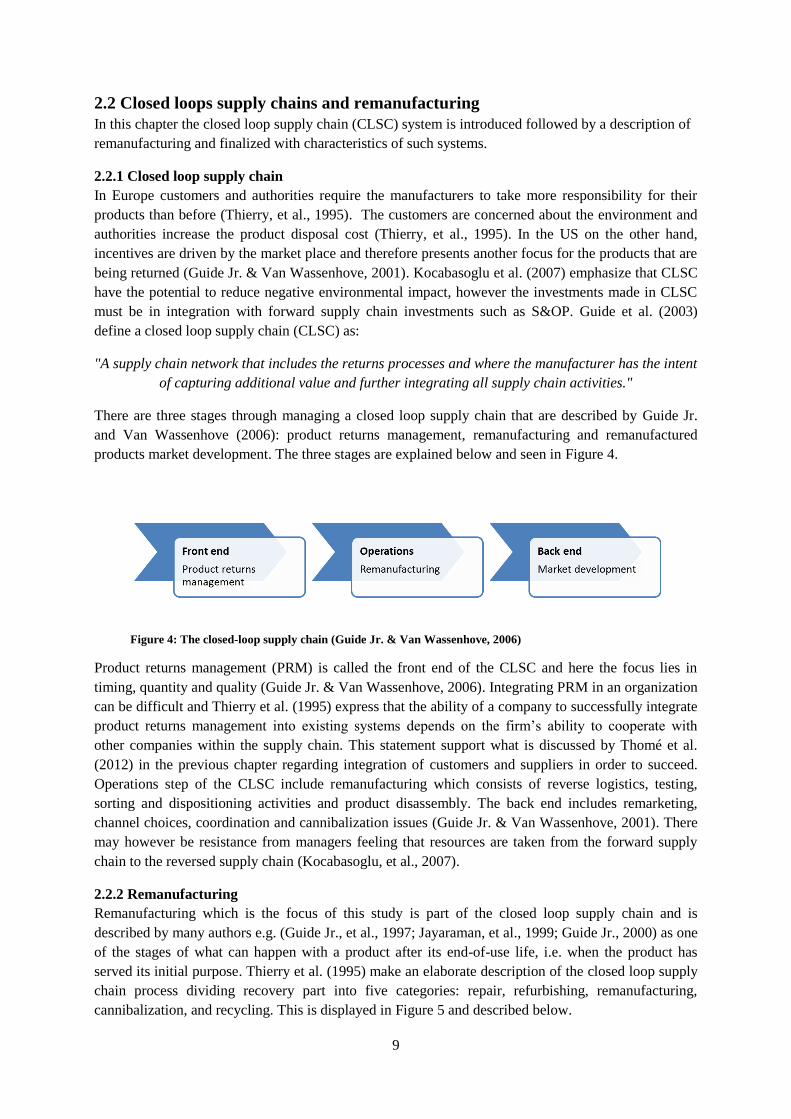
There are three stages through managing a closed loop supply chain that are described by Guide Jr.
and Van Wassenhove (2006): product returns management, remanufacturing and remanufactured
products market development. The three stages are explained below and seen in Figure 4.
Product returns management (PRM) is called the front end of the CLSC and here the focus lies in
timing, quantity and quality (Guide Jr. & Van Wassenhove, 2006). Integrating PRM in an organization
can be difficult and Thierry et al. (1995) express that the ability of a company to successfully integrate
product returns management into existing systems depends on the firm’s ability to cooperate with
other companies within the supply chain. This statement support what is discussed by Thomé et al.
(2012) in the previous chapter regarding integration of customers and suppliers in order to succeed.
Operations step of the CLSC include remanufacturing which consists of reverse logistics, testing,
sorting and dispositioning activities and product disassembly. The back end includes remarketing,
channel choices, coordination and cannibalization issues (Guide Jr. & Van Wassenhove, 2001). There
may however be resistance from managers feeling that resources are taken from the forward supply
chain to the reversed supply chain (Kocabasoglu, et al., 2007).
2.2.2 Remanufacturing
Remanufacturing which is the focus of this study is part of the closed loop supply chain and is
described by many authors e.g. (Guide Jr., et al., 1997; Jayaraman, et al., 1999; Guide Jr., 2000) as one
of the stages of what can happen with a product after its end-of-use life, i.e. when the product has
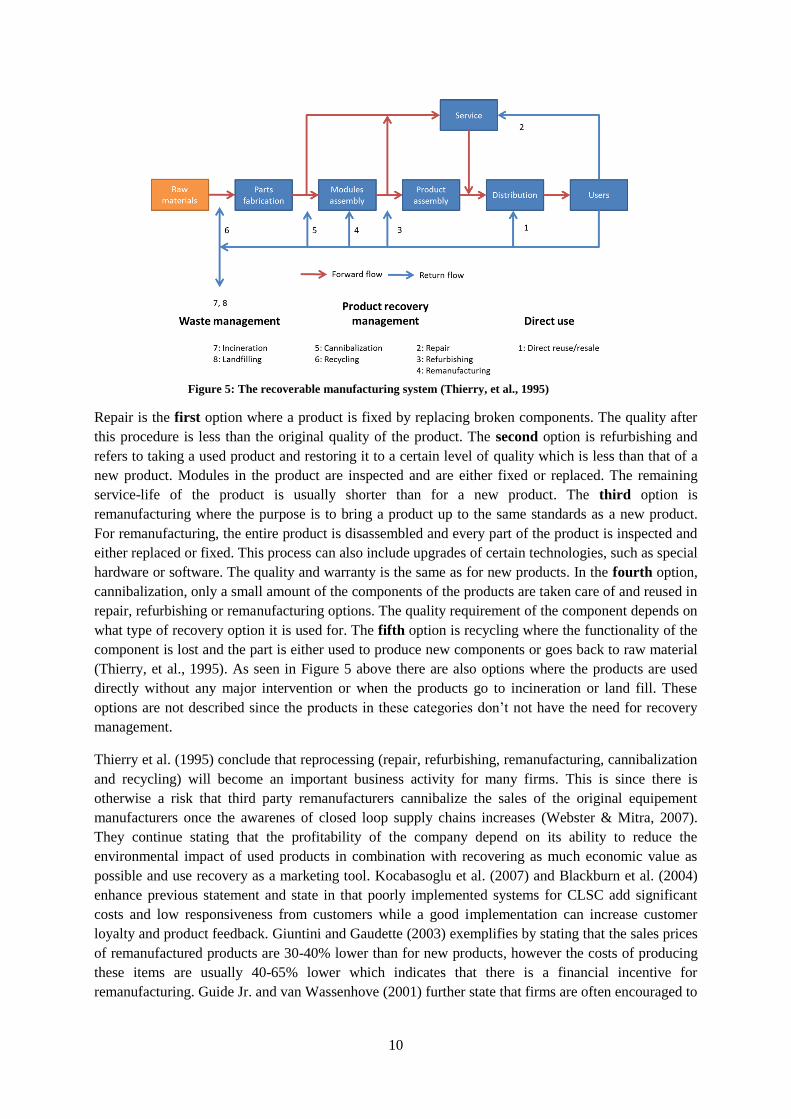
served its initial purpose. Thierry et al. (1995) make an elaborate description of the closed loop supply
chain process dividing recovery part into five categories: repair, refurbishing, remanufacturing,
cannibalization, and recycling. This is displayed in Figure 5 and described below.
Figure 4: The closed-loop supply chain (Guide Jr. & Van Wassenhove, 2006)
10
Repair is the first option where a product is fixed by replacing broken components. The quality after
this procedure is less than the original quality of the product. The second option is refurbishing and
refers to taking a used product and restoring it to a certain level of quality which is less than that of a
new product. Modules in the product are inspected and are either fixed or replaced. The remaining
service-life of the product is usually shorter than for a new product. The third option is
remanufacturing where the purpose is to bring a product up to the same standards as a new product.
For remanufacturing, the entire product is disassembled and every part of the product is inspected and
either replaced or fixed. This process can also include upgrades of certain technologies, such as special
hardware or software. The quality and warranty is the same as for new products. In the fourth option,
cannibalization, only a small amount of the components of the products are taken care of and reused in
repair, refurbishing or remanufacturing options. The quality requirement of the component depends on
what type of recovery option it is used for. The fifth option is recycling where the functionality of the
component is lost and the part is either used to produce new components or goes back to raw material
(Thierry, et al., 1995). As seen in Figure 5 above there are also options where the products are used
directly without any major intervention or when the products go to incineration or land fill. These
options are not described since the products in these categories don’t not have the need for recovery
management.
Thierry et al. (1995) conclude that reprocessing (repair, refurbishing, remanufacturing, cannibalization
and recycling) will become an important business activity for many firms. This is since there is
otherwise a risk that third party remanufacturers cannibalize the sales of the original equipement
manufacturers once the awarenes of closed loop supply chains increases (Webster & Mitra, 2007).
They continue stating that the profitability of the company depend on its ability to reduce the
environmental impact of used products in combination with recovering as much economic value as
possible and use recovery as a marketing tool. Kocabasoglu et al. (2007) and Blackburn et al. (2004)
enhance previous statement and state in that poorly implemented systems for CLSC add significant
costs and low responsiveness from customers while a good implementation can increase customer
loyalty and product feedback. Giuntini and Gaudette (2003) exemplifies by stating that the sales prices
of remanufactured products are 30-40% lower than for new products, however the costs of producing
these items are usually 40-65% lower which indicates that there is a financial incentive for
remanufacturing. Guide Jr. and van Wassenhove (2001) further state that firms are often encouraged to
Figure 5: The recoverable manufacturing system (Thierry, et al., 1995)

11
have environmentally friendly products as part of their portfolio, however companies in general don’t
do that unless they can see the financial return of such a commitment.
Mollenkopf et al. (2011) state that when returns management is seen as a competitive advantage it is
imperative for marketing and operations to work together in order to understand the full value. Guide
Jr. and Van Wassenhove (2001) advocate on the same topic; that there is a need for more integrated
business models that could take advantage of the value from remanufacturing. Guide Jr. and Van
Wassenhove (2001) continue, stating that there is no use spending scant and passively accepting
returns for it to look attractive to top managers but instead to focus properly and see it as a competitive
advantage. This suggest that if remanufacturing will prove its full potential, it must be integrated as a
part of the ordinary business activities.
2.2.3 Distinctive Characteristics of CLSC and remanufacturing
Production planning and control characteristics
Working with remanufacturing requires chages and adaptions to the entire supply chain. production
planning and control within a company and hence require its specific treatment (Guide Jr., 2000).
Guide Jr. identifies seven complicating characteristics which needs to be taken into consideration
when working with remanufactured products. These characteristics can be sorted into the front end and
operations stage of the closed loop supply chain as described by Guide Jr. and Van Wassenhove
(Guide Jr. & Van Wassenhove, 2006). The uncertain timing and quantity of returns means that there is
a big inaccuracy about the knowledge of when used products will be returned to the OEM, if the
products will be returned at all. This also have a big impact on the knowledge of the available quantity
of returns, i.e. when the returned will available which affect when it is possible to sell a
remanufactured product to a new customer. This is also very closely related to the issues of the
balancing the returns of used products with the demand for the same. If the uncertainty is high about
when a product is returned for remanufacturing, it also very uncertain when the demand for any
specific kind of product can be met. These two complicating characteristics can be sorted under the
front end stage of the CLSC. The remaining five characteristics can be sorted under the operations
stage of the CLSC and are only mentioned in brief since this thesis is about the S&OP process which
has an administrative and strategic agenda and hence doesn’t focus on the actual workshop layout.
These five complicating characteristics are the disassembly of returned products, uncertainty of what
materials than can be recovered, requirement for a logistics network, the complication of matching
available material with needed material, the problem of varying routings for remanufactured products
and the highly variable lead times. The characteristics are summarized in modified Table 2.
Table 2: Modified table of complicating characteristics in a CLSC (Guide Jr., 2000; Guide Jr. & Van Wassenhove,
2006)
Stage Complicating characteristic
Frond end The uncertain timing and quantity of returns
The need to balance returns with demands
Operations Disassembly of returned products
Uncertainty in what materials that can be recovered
The requirement for a reverse logistics network
The complication of matching available material with material needed
The problem of varying routings for products in a remanufacturing process and
hence highly variable processing times.
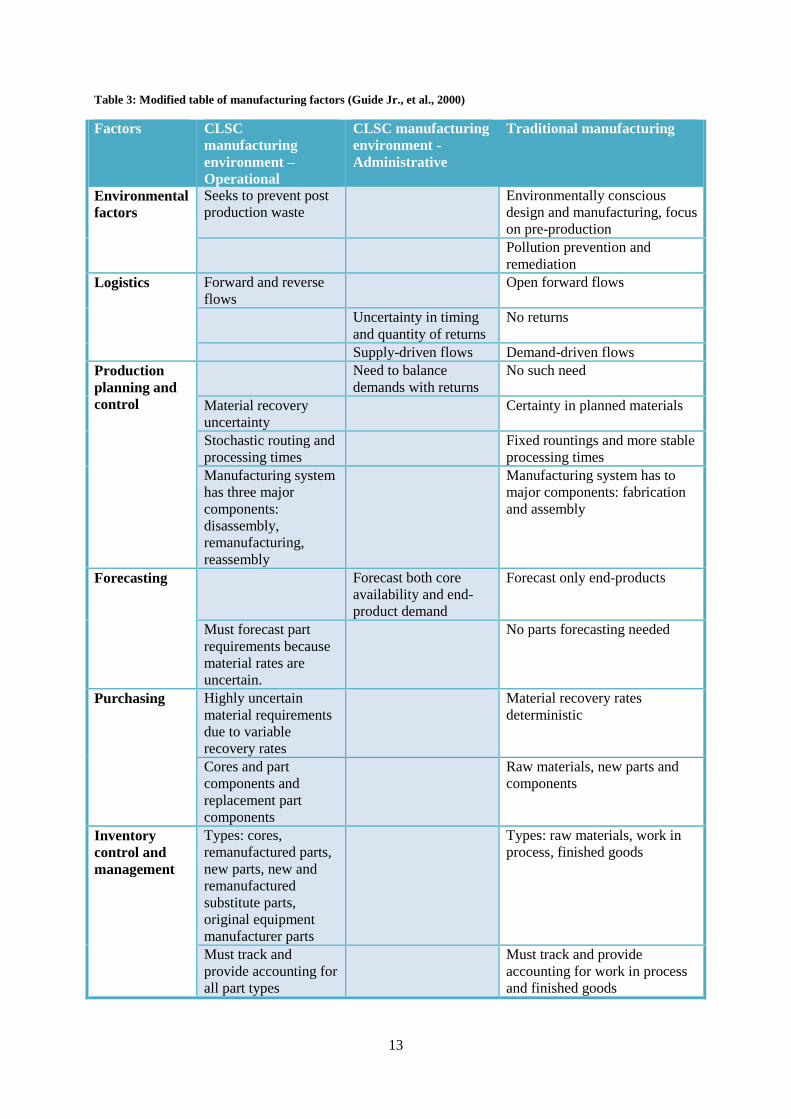
Guide Jr. et al. (2000) identify areas of recoverable manufacturing systems which incurs increased
challenges for management, planning and control functions. These areas are environment, logistics,

12
production planning and control, forecasting, purchasing, inventory control and management. Some of
these additional challenges overlap with the ones described above. However, since this study fouses on
the administrative and strategic S&OP process some areas appear to be more relevant than others.
Since the S&OP process is of administrative type the authors of this thesis categorize the factors by
Guide Jr. et al. (2000) into administrative and operational. One of the administrative factors that is
added to the already above discussed characteristics is that there is a difference in what drives the flow
of the products and changes the way in planning can be made. For the CLSC manufacturing
environment the flow of the products are based on what supply that can be brought back from the
market and hence affect what can be supplied to the market in terms of new remanufactured products.
In contrast, for traditional manufacturing the flow of goods is only based on what the demand is since
the restrictions in terms of supply of raw material are much less. One of the administrative factors that
are very relevant to the S&OP process is the difference in forecasting procedures. For traditional
manufacturing and the traditional S&OP process the forecasts are based only on demand. However,
when working with remanufactured products in general there is also a need to forecast supply
availability as well as demand for the remanufactured products which contrasts to the original S&OP
process procdure. In Table 3 below the modified table is presented.
13
Table 3: Modified table of manufacturing factors (Guide Jr., et al., 2000)
Factors CLSC
manufacturing
environment –
Operational
CLSC manufacturing
environment -
Administrative
Traditional manufacturing
Environmental
factors
Seeks to prevent post
production waste
Environmentally conscious
design and manufacturing, focus
on pre-production
Pollution prevention and
remediation
Logistics Forward and reverse
flows
Open forward flows
Uncertainty in timing
and quantity of returns
No returns
Supply-driven flows Demand-driven flows
Production
planning and
control
Need to balance
demands with returns
No such need
Material recovery
uncertainty
Certainty in planned materials
Stochastic routing and
processing times
Fixed rountings and more stable
processing times
Manufacturing system
has three major
components:
disassembly,
remanufacturing,
reassembly
Manufacturing system has to
major components: fabrication
and assembly
Forecasting Forecast both core
availability and end-
product demand
Forecast only end-products
Must forecast part
requirements because
material rates are
uncertain.
No parts forecasting needed
Purchasing Highly uncertain
material requirements
due to variable
recovery rates
Material recovery rates
deterministic
Cores and part
components and
replacement part
components
Raw materials, new parts and
components
Inventory
control and
management
Types: cores,
remanufactured parts,
new parts, new and
remanufactured
substitute parts,
original equipment
manufacturer parts
Types: raw materials, work in
process, finished goods
Must track and
provide accounting for
all part types
Must track and provide
accounting for work in process
and finished goods
14
Another complicating characteristic is discussed by Giuntini and Gaudette (2003) which affects the
willingness to work with remanufacturing. They state that sales representatives do not have incentives
to focus on remanufactured products, which are seen as cannibalizing the sale of new products and
hence threaten the commissions of the sales representative. They further emphasize that it requires
commitment from top management, in order for remanufacturing to succeed within the firm. Other
authors also mention the differences between recoverable and traditional manufacturing environments,
and what the implications are for forecasting and production planning activities and processes. Gungor
& Gupta (1999) writes that there is limited applicability of production planning and scheduling
methods for traditional products on remanufactured products and hence there the two options to
choose from is either to create new methodologies for remanufactured products or modify existing
methods to fit for remanufactured products.
Supply driven flow
What is most difficult to forecast according to Brennan, et al. (1994) is the returns of used products,
and depending on the product’s sales success the returns may spread over many years or come back
within a very short timeframe. As discussed in previous chapter the flow of remanufactured goods is
supply driven, i.e. based on the amount of products that are returned and the company hence relies on
the market to supply the material for remanufacturing. For new products the flow is demand driven
where the only consideration needed to be taken is how much the market wants to buy. The amount of
remanufactured products a company can produce and sell depends on how many cores that are
available for the company to buy back, rather than how many customers that are willing to buy the
remanufactured product. Since the amount of used cores available for buying back from previous
customers and the quality of those is difficult for a company to forecast and control, a supply driven
flow is seen to have greater uncertainty in timing, quantity, and quality than a demand driven flow
(Jayaraman, et al., 1999; Van Hillegersberg, et al., 2001).
Market-driven returns management
There is research stating that it is more difficult to plan, manage and control remanufacturing
operations (Guide Jr., et al., 1997; Guide Jr. & Srivastava, 1998). The additional complexity is partly
because of the variability in quality which makes the production process very insecure. To cope with
part of that insecurity, a firm can be market-driven (not to be confused with demand driven flow)
when working with returns and only take back product cores which they know they can use and hence
increase the certainty of the quality of products that comes back, however this might reduce the
returned quantities. The other option is to have a waste-driven approach where any quality of a used
product is taken back (Guide Jr. & Van Wassenhove, 2001) which gives a larger amount of returns,
but the quality may fluctuate more and hence increase processing times in the workshop. The market-
driven approach must include some incentive, usually financial, for customers to return their products
which can be considered a cost for the firm. Guide Jr. et al. (2000) discuss the possibility for the
producer of a product to claim a deposit for the product in order for it to be more attractive for the
customer to return the product. They also emphasize that there is a need for firms to develop core
acquisition strategies to balance demand with returns and avoid finished goods inventory of
remanufactured products. The waste-driven approach on the other hand relies on the producers to take
responsibility for discarded products by collecting and reusing them without any incentives for the
end-users such as deposits.
The market-driven approach gives the company a bigger chance of inspecting the products before
taking it back. This gives a better control of the quality of the product (Guide Jr., 2000) and is usually
used for high value products (NASR, et al., 1998). However, the uncertainty in returns still makes it
difficult in terms of capacity planning, materials planning, scheduling and inventory management and
15
can be very expensive for the firm (Guide Jr. & Van Wassenhove, 2001). The benefits of a market-
driven approach is that it results in lower amounts of received inventory, lower disposal costs, lower
variability in processing times which means easier planning. Labor and machining costs are also lower
with a higher output frequency due to better quality input (Guide Jr. & Van Wassenhove, 2001).
2.3 Gap analysis and Summary of the Theoretical framework
In the literature there are very few, if any, intersections between the two areas of S&OP and CLSC.
Different gaps are highligted on either S&OP or CLSC e.g. (Guide Jr., 2000; Feng, et al., 2008;
Mollenkopf, et al., 2011; Thomé, et al., 2012). There are however researchers who claim that due
increased environmental acts and awareness amongst consumers, there is a need to develop systems
for managing the remanufacturing process (Guide Jr., et al., 2000). Also Mollenkopf et al. (2011)
emphasize the importance of functional integration in the context of remanufacturing which further
enhances the need for this study.
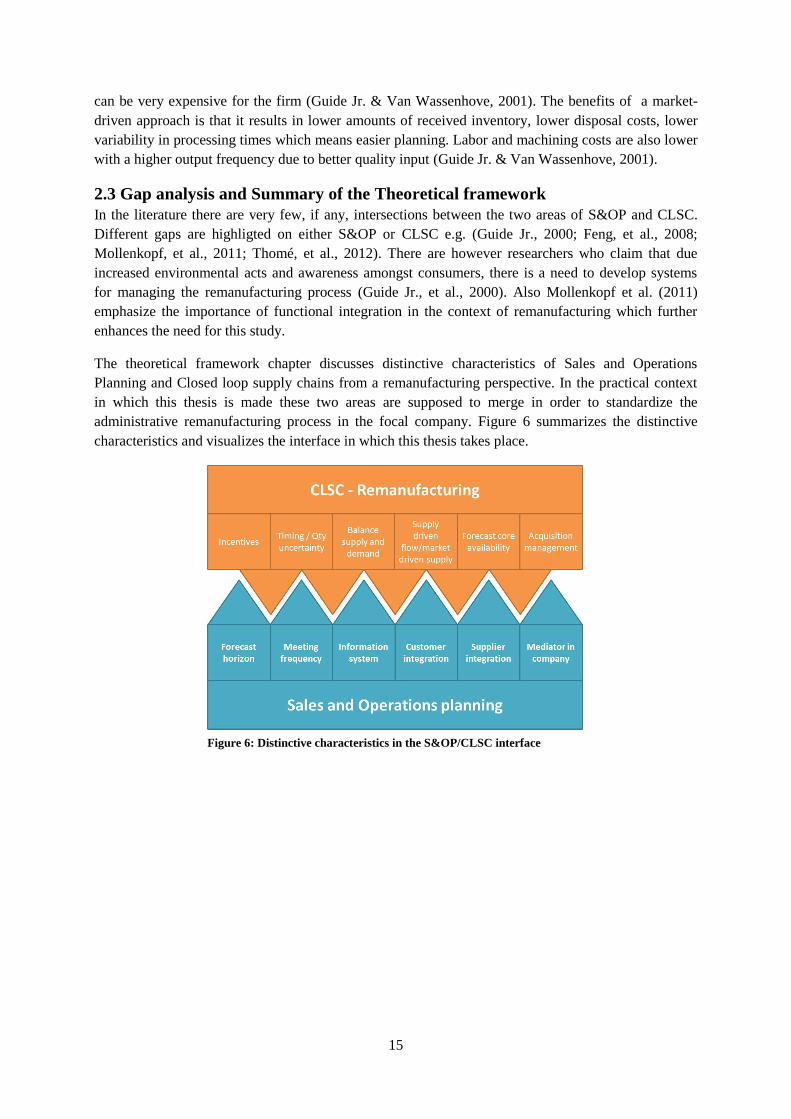
The theoretical framework chapter discusses distinctive characteristics of Sales and Operations
Planning and Closed loop supply chains from a remanufacturing perspective. In the practical context
in which this thesis is made these two areas are supposed to merge in order to standardize the
administrative remanufacturing process in the focal company. Figure 6 summarizes the distinctive
characteristics and visualizes the interface in which this thesis takes place.
Figure 6: Distinctive characteristics in the S&OP/CLSC interface
16
3. Methodology In this chapter the methodology used in this study is accounted for. The validity, reliability, and
generalizability of the study are discussed.
3.1 Case study
The case study methodology was chosen for this study for three reasons. First, the researchers had the
opportunity to investigate the sales and operations planning (S&OP) process of the focal company in
its natural environment by being granted access by the focal firm. Second, very little, if any previous
research has been conducted on the particular interface between S&OP and CLSC. Third, the task at
hand involved a case where it is not possible to fully control the environment and at the same time
examine actual events, thus surveys or experimental strategies were inappropriate. According to (Voss,
et al., 2002) and (Yin, 2009), in such circumstances the case study methodology is a suitable one to
use.
A single case study was chosen in order to be able to go in-depth, and many researchers have stated
that in-depth case studies in S&OP is lacking, e.g. (Tuomikangas & Kaipia, 2014; Linderman &
Chandrasekaran, 2010). The case chosen for this study was based on the special access granted by the
focal company and hence the research could therefore be classified as an opportunist case study
(Collis & Hussey, 2009). In line with Yin’s (2009) recommendations for case studies, the focal
company was highly willing to provide access to people, records, and data as the research topic
corresponded with their business interests.
The topic of S&OP had previously been explored, however many of the published articles in journals
were by practitioners e.g. (Lapide, 2005; Sheldon, 2006; Lapide, 2007) where focus lay on a more
practical perspective, and no account of the scientific method was included in the articles. For these
articles, the validity and reliability could be questioned and was one limitation to this study, which to
an extent bases its theory on these articles due to lack of academic articles. In the area of
remanufacturing and closed loop supply chain more literature was found where some papers were
believed to be seminal to the development of the area. However no articles did study the interface
between S&OP and CLSC and remanufacturing. Although Guide and Van Wassenhove (2006) gave
an account of the effects of remanufacturing and closed loop supply chain on areas such as production
planning and control and forecasting, which can be seen to overlap with S&OP, it did not explicitly
study the effects of remanufacturing and closed loop supply chain on the S&OP process. For this
reason this study could be seen as exploratory and theory building since it aimed to uncover areas of
research, identify and describe key variables and identify linkages between variables (Voss, et al.,
2002), which in this case was done through an in-depth case study. Collis and Hussey (2009)
continued stating that the aim in such a study is to look for patterns and ideas rather than testing a
hypothesis.
3.1.1 Research purpose
This study could be classified as both basic and applied research since the contribution of the study
was believed to benefit both the focal company and contribute to academia in the areas of S&OP, and
remanufacturing and closed loop supply chain. (Collis & Hussey, 2009). This was seen to be one of
the first studies studying the interface between S&OP and CLSC.
3.1.2 Research logic
The research used a mix of deductive and inductive methods. The generation of research question
from the research topic was deductive as literature relevant to the topic was reviewed and a gap was
identified. The research question was designed so that it integrated the theoretical research gap and the
17
focal company’s practical problem. This was done in order for the results to contribute both to
academic knowledge and practical implications for the focal company. The logic of data analysis was
both inductive and deductive. First, an inductive approach was used to structure the interview data into
categories based on themes and topics. A deductive approach was then used where the theoretical
framework was tested on the categories created from the empirical data. Results from this analysis
were used then as a starting point for forming conclusions.
3.1.3 Triangulation
The data collected in this case study was mostly of qualitative nature, however some of the questions
asked during the interview were done on a scale from 1 to 10. This worked as a support to the
qualitative data to be able see whether the perception of interviewees using the quantitative scale
would match the qualitative answers. Studies often include both qualitative and quantitative data and
are considered to be complementary (Collis & Hussey, 2009). More data collection triangulation was
done in terms of methods, as three different data collection methods were used: interviews, document
reviews and non-participant observations, as recommended by (Collis & Hussey, 2009; Stuart, et al.,
2002).
3.2 Research design
3.2.1 Process
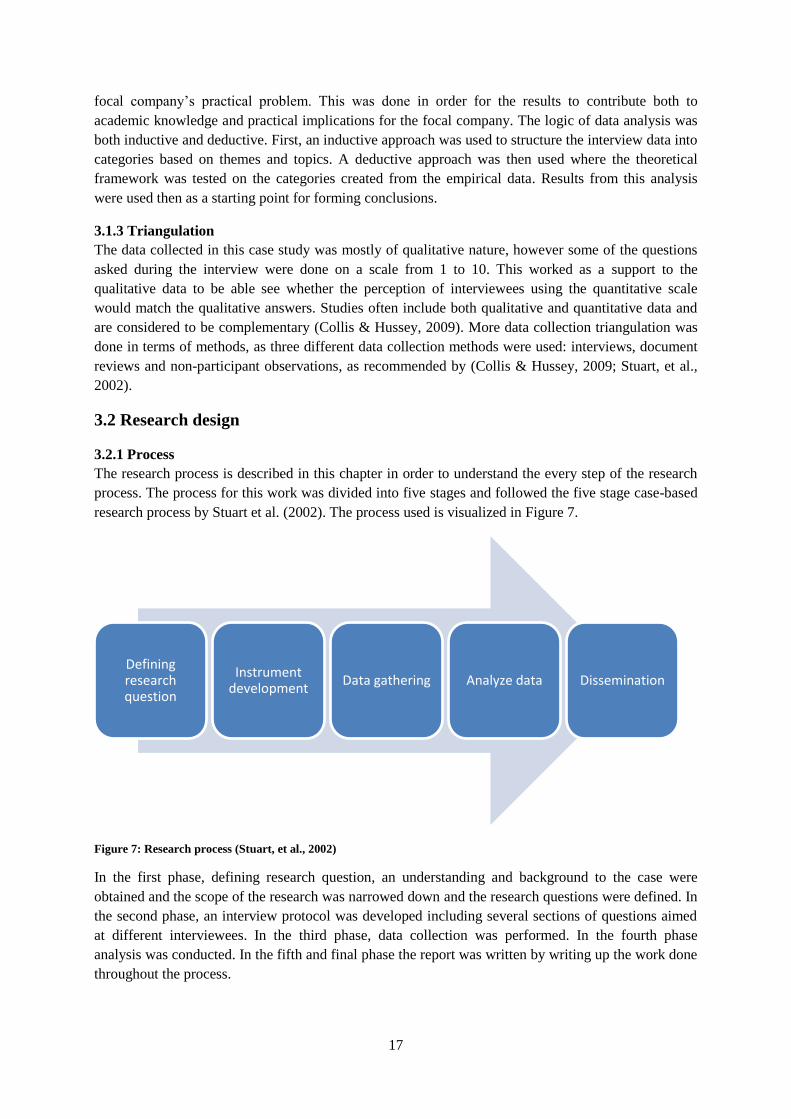
The research process is described in this chapter in order to understand the every step of the research
process. The process for this work was divided into five stages and followed the five stage case-based
research process by Stuart et al. (2002). The process used is visualized in Figure 7.
Figure 7: Research process (Stuart, et al., 2002)
In the first phase, defining research question, an understanding and background to the case were
obtained and the scope of the research was narrowed down and the research questions were defined. In
the second phase, an interview protocol was developed including several sections of questions aimed
at different interviewees. In the third phase, data collection was performed. In the fourth phase
analysis was conducted. In the fifth and final phase the report was written by writing up the work done
throughout the process.
Defining research question
Instrument development
Data gathering Analyze data Dissemination
18
Some activities were also conducted throughout the process. These were biweekly meetings held with
the sponsors at the focal company which followed up on the work done since the previous meeting.
Meetings with the supervisor at KTH were held on a regular basis to discuss progression and raise
questions. Seminars at KTH were also a mandatory part of the thesis work where research questions,
methods, results/analysis and conclusions were discussed.
3.2.2 Defining research question
In the first phase, defining the research question, qualitative data was gathered by observations,
informal conversations and meetings in order to understand the context. Meetings were held with
seven different people within the organization see Appendix A – Initial open interviews. The meetings
were held in a two-way setting where the researchers were able to ask questions about the company,
the supply chain and the different areas of study, i.e. the Sales and Operations Planning Process
(S&OP) and their remanufactured products, known in this study as Round two (R2) products. In
parallel the literature was reviewed and a gap was identified which provided a basis for creating the
research question which Collis and Hussey (2009) state as very important for any academic research.
The gap identified also aimed to match the expectations of the focal company. When reviewing the
literature the researchers tried to verify information in order to increase the validity of the findings in
the literature. This was believed important since some of the literature found, even though in journals,
were written from a practitioner’s standpoint with no academic rigor behind it e.g. (Lapide, 2005;
Lapide, 2007) and did not have references, or academic structure.
The initial literature search was narrowed down in accordance with Collis and Hussey’s (2009)
recommendations by only searching literature from 1990 and forward. Articles were found based on
keywords around Sales and Operations Planning (S&OP) and closed loop supply chain (CLSC) and
remanufacturing. The references in these were used in a second round to review more literature. The
literature review also included relevant articles based on suggestions in the data bases. After the first
round of literature search the research questions were defined. A second and third round of literature
search was iterated in the same manner to confirm or change the research questions. Continuously
during the review, relevant literature was summarized and drafts of the review were written in a report
structure. Finally the research questions were presented to the supervisor at the university and the
sponsors who made additional comments and adjustments and the final research question is seen
below.
What complexities arise when remanufactured products are added to a sales and operations
planning process for high-value, low volume, B2B products?
3.2.3 Interview instrument development
The second phase in the process was to develop the research instrument used for collecting the
majority of the data. This process was continuous and was based on the literature read up until the
time of data collection. Stuart et al. (2002) and Yin (2009) highlight the importance of a case study
protocol. However, in this study the protocol was a light version of the full case study protocol
containing an explanation of purpose of the study and the research interview questions. This was
because of a few reasons, firstly, this was a single case study conducted within one S&OP process in
one company, secondly, there were only two researchers who conducted all the interviews and had one
digital database, and thirdly the time frame for the study was short and hence priorities had to be made
on where to focus.
19
During the literature review thoughts about interview questions were written down in a continuous
manner as it was important for the researchers to make sure that any ideas that came up in the
literature review process were not lost.
The creation of interview questions was later based on the previous ideas noted down and organized
into different question packages containing different types of questions for different stakeholders. For
example, interviewees working on the sales side were asked additional questions on demand planning,
while those working on the manufacturing side were asked additional questions on supply planning.
Executives were asked additional questions related to strategy. The questions are to be seen in
Appendix B – Interview questions. To make sure there was relevance in the questions to both
academia and to the focal company the questions were sent for revision to the supervisor at KTH and
to the two sponsors and the supervisor at the focal company.
3.2.4 Empirical data collection
Interviews
The data collected in this case study was mostly of qualitative nature, however some of the questions
asked during the interview were done on a scale from 1 to 10. This worked as a measurement and
good guidelines towards the qualitative data to be able to see whether the perception would match the
qualitative answers. Studies often include both qualitative and quantitative data and are considered to
be complementary (Collis & Hussey, 2009) which help to compare the data. More data collection
triangulation was done both in terms of methods, using interviews, document reviews and non-
participant observations (Collis & Hussey, 2009; Stuart, et al., 2002).
In this phase the majority of the data was gathered through semi-structured interviews since it is a
good method to use when understanding a context or when there is a need to understand the step by
step logic (Collis & Hussey, 2009) or when trying to explain a phenomenon (Saunders, et al., 2009).
The various positions of interviewees were chosen to get a holistic picture on different aspects of the
S&OP process, and how the integration of the R2 products into the process would affect all parties
involved. Interviews were conducted on the demand side, i.e. step 1 and 2 in the S&OP process and on
the supply side, i.e. step 3. Additionally interviews were conducted with executives, i.e. step 4 and 5 as
well as with persons from the R2 team. In total 26 semi-structured interviews were conducted where
every interview lasted for approximately one hour. A summary of the interviewees is presented in
Appendix C – Semi-structured interviews together with information of what type of interview that was
made with each interviewee.
The interviews were booked via the focal company’s calendar system where an initial booking was
made two weeks before the suggested date for the interview with a time slot of one hour. This was
believed to be reasonable for the interviewee to be able to answer the interview questions. This initial
booking explained the purpose of the study and who the sponsor was within the focal company. Three
days before the interview was conducted an additional email was sent out containing the interview
questions. The purpose of this was to give the interviewee a chance to think through the questions
before hand in order to give more depth in the responses.
The interviews were conducted as face-to-face, video conference or tele-conference interviews. The
preferred way of doing semi-structured interviews according to Saunders et al. (2009) is face to face,
but when there are limitations such as distance and costs of travelling, telephone or internet based
interviews provide an advantage. In the case of this study the interviewees were spread between many
countries and it would not have been feasible to make face-to-face interviews. The priority for the
20
interviews was face-to-face if possible and then video-conference where it was possible to see the
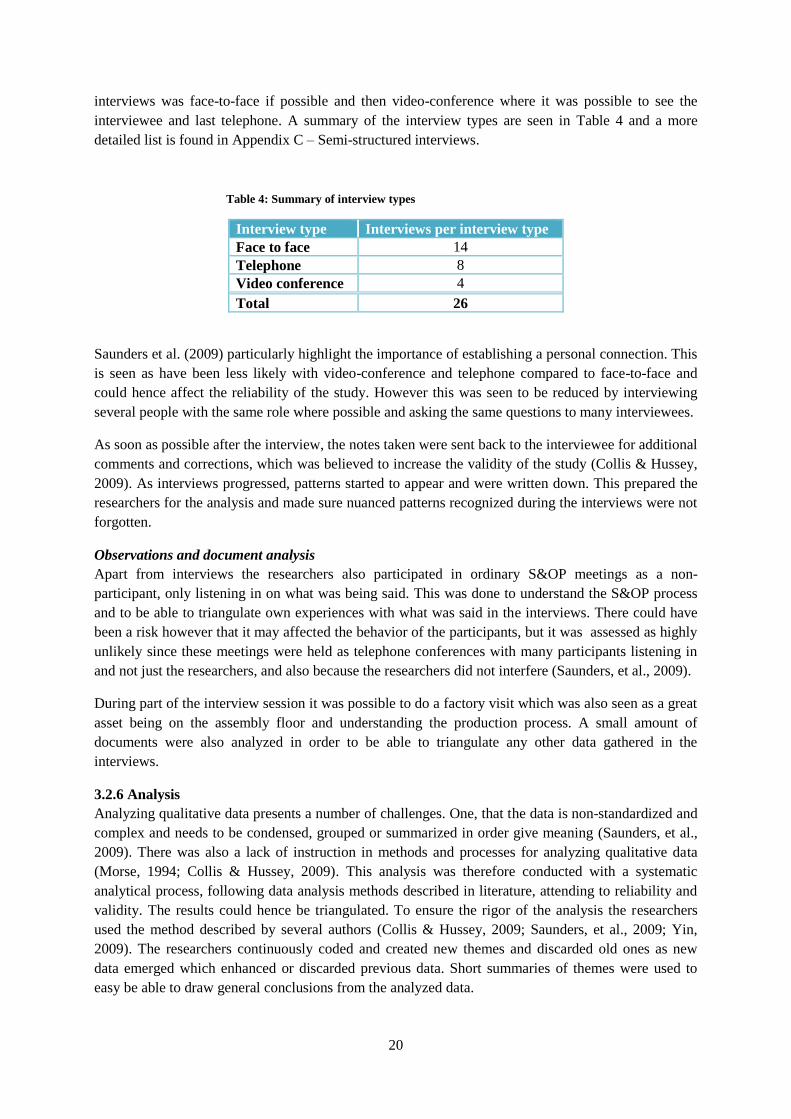
interviewee and last telephone. A summary of the interview types are seen in Table 4 and a more
detailed list is found in Appendix C – Semi-structured interviews.
Table 4: Summary of interview types
Interview type Interviews per interview type
Face to face 14
Telephone 8
Video conference 4
Total 26
Saunders et al. (2009) particularly highlight the importance of establishing a personal connection. This
is seen as have been less likely with video-conference and telephone compared to face-to-face and
could hence affect the reliability of the study. However this was seen to be reduced by interviewing
several people with the same role where possible and asking the same questions to many interviewees.
As soon as possible after the interview, the notes taken were sent back to the interviewee for additional
comments and corrections, which was believed to increase the validity of the study (Collis & Hussey,
2009). As interviews progressed, patterns started to appear and were written down. This prepared the
researchers for the analysis and made sure nuanced patterns recognized during the interviews were not
forgotten.
Observations and document analysis
Apart from interviews the researchers also participated in ordinary S&OP meetings as a non-
participant, only listening in on what was being said. This was done to understand the S&OP process
and to be able to triangulate own experiences with what was said in the interviews. There could have
been a risk however that it may affected the behavior of the participants, but it was assessed as highly
unlikely since these meetings were held as telephone conferences with many participants listening in
and not just the researchers, and also because the researchers did not interfere (Saunders, et al., 2009).
During part of the interview session it was possible to do a factory visit which was also seen as a great
asset being on the assembly floor and understanding the production process. A small amount of
documents were also analyzed in order to be able to triangulate any other data gathered in the
interviews.
3.2.6 Analysis
Analyzing qualitative data presents a number of challenges. One, that the data is non-standardized and
complex and needs to be condensed, grouped or summarized in order give meaning (Saunders, et al.,
2009). There was also a lack of instruction in methods and processes for analyzing qualitative data
(Morse, 1994; Collis & Hussey, 2009). This analysis was therefore conducted with a systematic
analytical process, following data analysis methods described in literature, attending to reliability and
validity. The results could hence be triangulated. To ensure the rigor of the analysis the researchers
used the method described by several authors (Collis & Hussey, 2009; Saunders, et al., 2009; Yin,
2009). The researchers continuously coded and created new themes and discarded old ones as new
data emerged which enhanced or discarded previous data. Short summaries of themes were used to
easy be able to draw general conclusions from the analyzed data.
21
Inductive coding was made with software from the data gathered by creating themes and
classifications based on the responses from the interviewees. The coding was by the researchers seen
as a good way of compressing data and make it easier to analyze (Saunders, et al., 2009). Propositions
and themes that emerged were tested against the data gathered to examine whether or not these
suggested ideas were of any value or could be discarded by contradictive opinions amongst the
interviewees which was supported by several authors (Collis & Hussey, 2009; Yin, 2009).
3.2.7 Dissertation
The fifth step of the process was the dissemination process where the main focus was to produce and
finish the report. Rough drafts were written for all parts of the report and after that it was worked
through with comments from external parties. This was then corrected and the report was finalized
3.3 Validity & Reliability
3.3.1 Construct validity
To achieve construct validity the recommendation by Yin (2009) was used and sought to enable a
clear chain of evidence by being very descriptive in the methods chapter of the thesis in order to be
able to explain every step for the reader to be able to follow the logic as well as having explanatory
titles and preambles of each chapter and having a clear structure in the report. The researchers also
used triangulation by gathering data through interviews, non-participant observations, and other
documents which was suggested by Yin (2009) and Voss et al. (2002).
3.3.2 Internal validity
In terms of internal validity the researchers defined a clear research framework based on the literature.
The empirically drawn results were compared with the results from other studies within the areas of
sales and operations planning and closed loop supply chain. Also, several authors’ previous findings
were compared to be able to verify the credibility that concepts were valid, all which were supported
by Gibbert et al. (2008).
3.3.3 External validity
The external validity refers to the generalization from empirical observations to theory (Yin, 2009)
where Eisenhardt (1989) argues that case studies can be a starting point for theory development and
hence this study contributed in that aspect since it drew empirical conclusions which can be used to
build theory which in a later stage can be tested. The focal company and case were well described with
ample details in the empirical chapter as suggested by Cook and Campbell (1979).
3.3.4 Reliability
Reliability is the absence of differences in the results if the research were repeated (Saunders, et al.,
2009). To enhance the reliability the interview notes were sent to the interviewees to do what could be
related to a test-retest method described by Collis and Hussey (2009) where the respondents had the
chance to confirm or change any of the notes taken from the interview. Throughout the methods
chapter the aim was to be as transparent as possible in order to give the reader a chance to follow
every step of the process. If a reader requests it is possible to scrutinize the interview transcripts,
documents, database of collected data and other information from the study. The measures described
above were recommended by Gibbert et al. (2008). However, a general insight is that the purpose of a
case study is to reflect the reality at the point in time at which the study was conducted. This reality
may be subject to changes and may change the outcome of a repeated study (Saunders, et al., 2009).
The validity and reliability actions are summarized in Table 5 below.
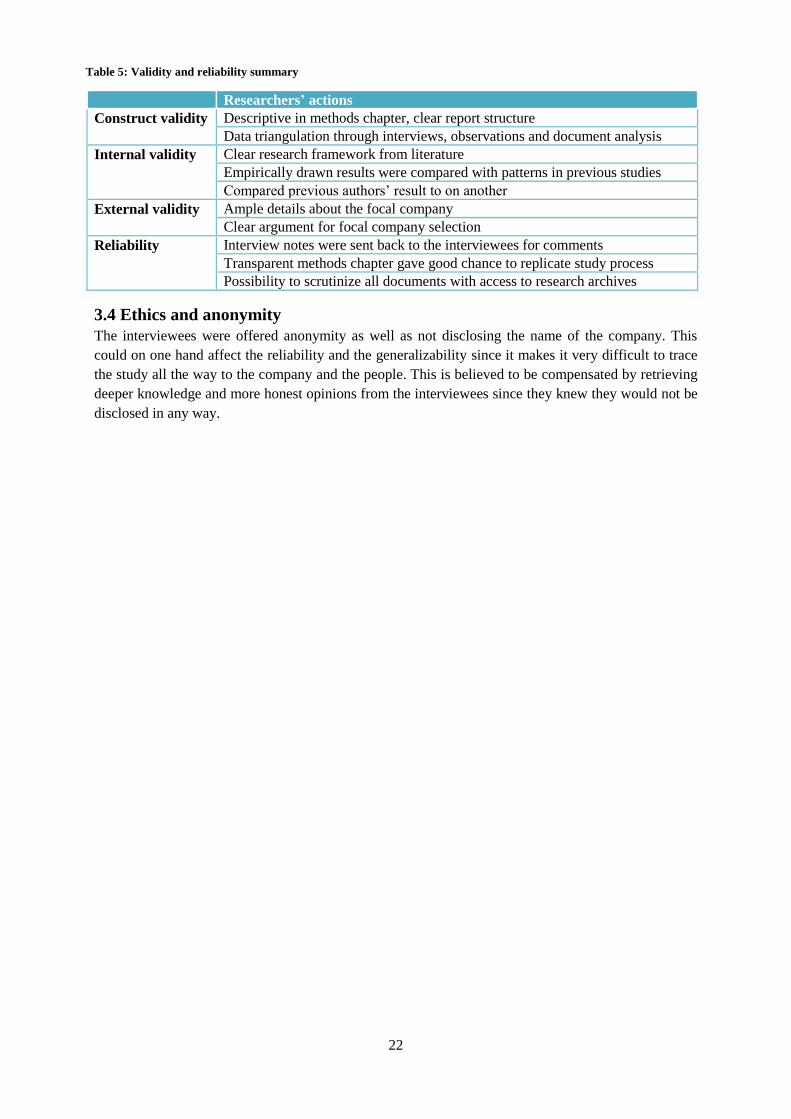
22
3.4 Ethics and anonymity
The interviewees were offered anonymity as well as not disclosing the name of the company. This
could on one hand affect the reliability and the generalizability since it makes it very difficult to trace
the study all the way to the company and the people. This is believed to be compensated by retrieving
deeper knowledge and more honest opinions from the interviewees since they knew they would not be
disclosed in any way.
Researchers’ actions
Construct validity Descriptive in methods chapter, clear report structure
Data triangulation through interviews, observations and document analysis
Internal validity Clear research framework from literature
Empirically drawn results were compared with patterns in previous studies
Compared previous authors’ result to on another
External validity Ample details about the focal company
Clear argument for focal company selection
Reliability Interview notes were sent back to the interviewees for comments
Transparent methods chapter gave good chance to replicate study process
Possibility to scrutinize all documents with access to research archives
Table 5: Validity and reliability summary
23
4. Empirical chapter of the focal company
In this chapter the focal company is described in detail. There are two parts in this chapter, the first
one gives a brief overview of the company and describes their S&OP process. The second part
describes the R2 team and their current processes.
4.1 The focal company
The focal company is part of a global conglomerate operating in a variety of industries with a broad
range of products. The industry in which the focal company operates is characterized by its relatively
low volumes of the products being sold and high prices of each item due to high technological
complexity of the products (GM Logistics and Fulfillment, 2014). For simplicity for the reader the
business is divided into two separate groups of products which in this study are called group Apple
and Berry. Group Berry is characterized by very low unit volumes and higher prices than Apple where
the annual volume of Berries are less than 10% of that of Apple products (PPL A, 2014).
The reasons for integrating the R2 products into the existing S&OP process are many. One is from a
strategic perspective which is described by the Product Planning Manager (2014):
“Our objective is to have a world class S&OP process. Reason for that is so we have a high level of
customer fulfillment, low inventory, so we can drive cash for business. Process should be as good as it
can be in order to support business metrics.”
The PPM continues with the reasons behind the integration:
“For me strategically we need to ensure we only have one process, that we have got all products in
that one process at very basic level. We probably need to tune process around some of the products.”
The Product Manager for Remanufacturing (PMR) state that the horizon for matching supply and
demand is very short and by integrating the R2 products into the S&OP process the PM
Remanufacturing hope that the horizon can be extended and that the forecasting of R2 products will be
done in a more structured way by using the S&OP forecasting system (PM Remanufacturing, 2014).
Further, the PMR (2014) state that the hope is to see more commitment from the sales team which will
increase the quality of the gathered data about the R2 systems.
R2 in the conglomerate company is an important part of the business and the PPM (2014) continues:
“…from strategic perspective, we need to understand importance of this. Because this is a business we
want to develop, I know discussions are going on. R2 is important for the rest of the business, other
products in the focal company. I think we need to take notice of it, have robust processes around it.”
4.2 Sales and operations planning at the focal company
In 2011 the focal company merged the many independent sales and operations processes into the
S&OP process where they have four conceptual steps; demand step, supply step, profit and loss step
and an executive step. They also started to use an Oracle based statistical tool called Demantra (GM
Logistics and Fulfillment, 2014) which by Oracle (2014) is described as:
“…enables you to implement a continuous and proactive sales and operations planning process that
profitably balances demand, supply and budgets.”
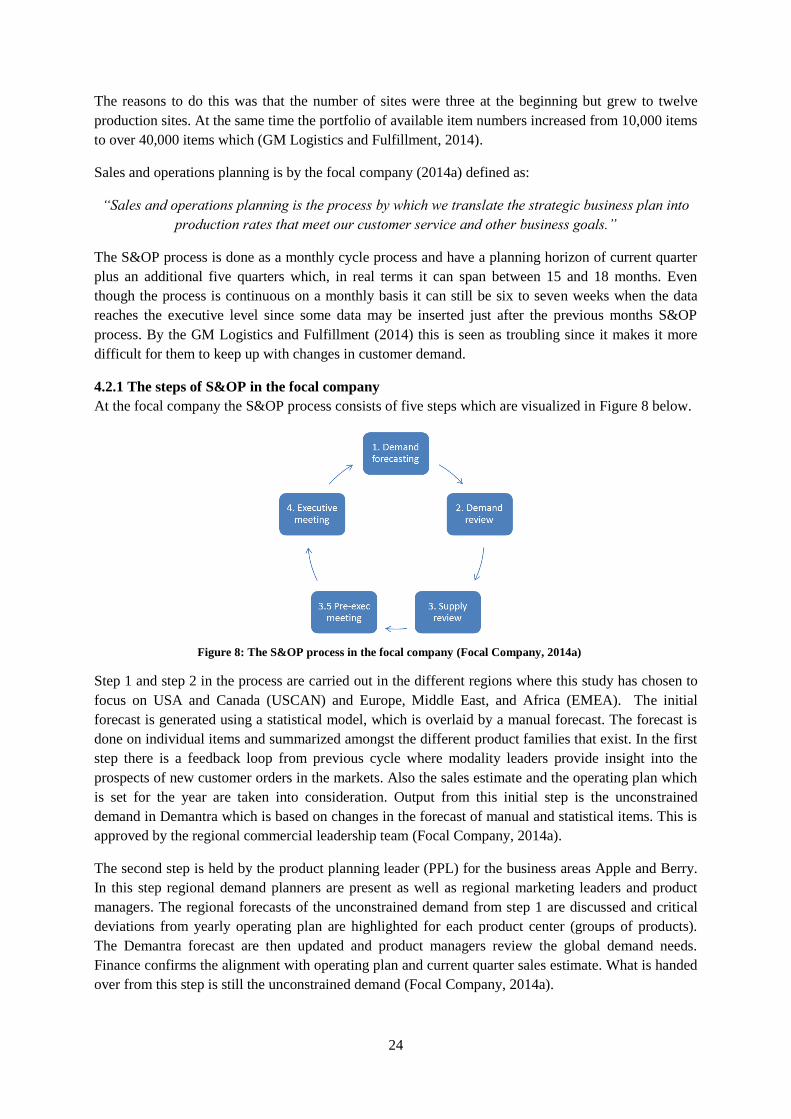
24
The reasons to do this was that the number of sites were three at the beginning but grew to twelve
production sites. At the same time the portfolio of available item numbers increased from 10,000 items
to over 40,000 items which (GM Logistics and Fulfillment, 2014).
Sales and operations planning is by the focal company (2014a) defined as:
“Sales and operations planning is the process by which we translate the strategic business plan into
production rates that meet our customer service and other business goals.”
The S&OP process is done as a monthly cycle process and have a planning horizon of current quarter
plus an additional five quarters which, in real terms it can span between 15 and 18 months. Even
though the process is continuous on a monthly basis it can still be six to seven weeks when the data
reaches the executive level since some data may be inserted just after the previous months S&OP
process. By the GM Logistics and Fulfillment (2014) this is seen as troubling since it makes it more
difficult for them to keep up with changes in customer demand.
4.2.1 The steps of S&OP in the focal company
At the focal company the S&OP process consists of five steps which are visualized in Figure 8 below.
Step 1 and step 2 in the process are carried out in the different regions where this study has chosen to
focus on USA and Canada (USCAN) and Europe, Middle East, and Africa (EMEA). The initial
forecast is generated using a statistical model, which is overlaid by a manual forecast. The forecast is
done on individual items and summarized amongst the different product families that exist. In the first
step there is a feedback loop from previous cycle where modality leaders provide insight into the
prospects of new customer orders in the markets. Also the sales estimate and the operating plan which
is set for the year are taken into consideration. Output from this initial step is the unconstrained
demand in Demantra which is based on changes in the forecast of manual and statistical items. This is
approved by the regional commercial leadership team (Focal Company, 2014a).
The second step is held by the product planning leader (PPL) for the business areas Apple and Berry.
In this step regional demand planners are present as well as regional marketing leaders and product
managers. The regional forecasts of the unconstrained demand from step 1 are discussed and critical
deviations from yearly operating plan are highlighted for each product center (groups of products).
The Demantra forecast are then updated and product managers review the global demand needs.
Finance confirms the alignment with operating plan and current quarter sales estimate. What is handed
over from this step is still the unconstrained demand (Focal Company, 2014a).
Figure 8: The S&OP process in the focal company (Focal Company, 2014a)
25
The third step is the supply review where each production site is involved and reviews the Demantra
forecast which is handed over from the commercial teams. Master Schedulers, Product Planning
Leaders (PPL), Manufacturing planners, Plant managers, Material Managers, Team leaders and
Sourcing team participates in this meeting. They compare the new forecast with the one from the
previous month and identify critical deviations. The supply team then determines if and how demand
can be met. The output is a production commitment which is the constrained demand that will be
fulfilled and are transferred to the production IT systems. Risks are highlighted and mitigation plans
are prepared and issues that can’t be resolved are escalated to the next step (Focal Company, 2014a).
The step defined as 3.5 is held by the Product Planning Manager (PPM) which has the operational
responsibility of the S&OP process. General Manager from fulfillment, manufacturing managers,
business leaders and PPLs participate in these meetings. These meeting are on a high level with very
few details. They run through the build plans and inventory for the current quarter and look at metrics
for fulfillment and the S&OP process. They also identify risks and constraints which have been
escalated. Output is an acceptance of the suggested build plan for the coming cycle as well as priorities
and directions for coming cycles on how to balance supply and demand. Any issue that can’t be
resolved in this stage is escalated to the last step of the process (Focal Company, 2014a).
The final step of the process is held by the PPM and in this meeting CEO, CFO, head of supply chain
and General Manager for fulfillment participates. This is on a strategic level where the inputs are a
high level forecast summary from the demand and supply reviews and how that effect the revenue,
inventory turns and operating plans, fulfillment metrics and S&OP metrics, and any escalated issues
that have not been resolved. Outputs are decisions on any issues and strategic decisions on how to
keep the right level of fulfillment and inventory (Focal Company, 2014a).
4.3 Remanufacturing in the organization
It is important for the reader at this stage to be aware of that the focal company refers to its reuse
activities as refurbishing and not remanufacturing. There is however a fundamental difference in the
definition used within the company compared to the one used as the definition in this study based on
Thierry et al. (1995). The focal company’s definition of refurbishing is that a product that is brought
back is restored into a new product of the same type, i.e. product A1 is restored into a new A1 product.
The focal company’s definition of remanufactured products is when a product is brought back as an
A1 product and turned into and A2 product in the process (PM Remanufacturing, 2014). The
definition used by Thierry et al. (1995) refers to refurbishing as a recovered product that has lower
quality standard than a new product while a remanufactured product has the same quality standard as
a new product. For the remaining of this report the term remanufacturing according to Thierry et al.
(1995) will be used.
4.3.1 Remanufacturing background and concept in the focal company
For the focal company it started in 2009 with trade-ins, buy backs and 3rd
party vendors. In 2011 when
the business was setup in EMEA the focal company also started taking back dead on arrivals (DOAs)
(PM Remanufacturing, 2014). DOAs are products which the focal company buys back from the
customers since the products don’t work when installed. In the past, these DOAs were located in the
regions across the globe with no second use, but with the introduction of R2, instead of letting the
products sit in the regions and take up costly space and capital, they were sent to the production
facilities where they were remanufactured and sold under the concept of R2 (PM B, 2014). The trade-
in process of products is handled by the sales team. The pure buy backs comes directly from the
customer to the R2 team via a 3rd
party provider (SM, 2014). Now the R2 products are used to reach a
segment which could not be reached using new products and hence they fill a gap at the same time as
26
the company are in better control of the market than before and also let customers try the company’s
products and hopefully buy a new product the second time (SM, 2014).
The R2 products also fill another purpose in shorter projects. This is because it might not always be
profitable to buy a new product if it is only going to be used for a short period of time (SM, 2014). But
generally it could be said that these products are sold to smaller companies that doesn’t have the
funding to buy new products the first time. One could think that the remanufacturing comes from the
company being environmentally sustainable but in the case of these products it is a way to keep
control of and find a bigger market (PM Remanufacturing, 2014) or as a tool to drive sales of new
products (GM Logistics and Fulfillment, 2014; SM, 2014). Considering the initial low volumes of the
new products that are sold the volumes of products that come back are very low and hence make them
very hard to forecast. On top of the low volumes, there are also demo products which the sales
representatives sell. This makes every sales opportunity uncertain because the customer could buy any
of these three items (new, demo or R2) (SOM B, 2014).
4.3.2 The remanufacturing team and processes
The team working with the R2 products is a small consisting of a product manager, a service manager,
a global commercial marketing manager, and an aftermarket program manager and four persons doing
the service and remanufacturing on the R2 products (Focal Company, 2014b). Since the team is small,
many of the processes are ad-hoc and adjusted to the situation required (PM Remanufacturing, 2014;
SM, 2014). Regular meetings are held about potential leads and incoming cores.
To create a more steady flow of incoming cores for the remanufacturing process, marketing campaigns
are used where the customers receive a discount on a new product when they return their old product.
The benefit for the customers when returning their products to the focal company is that the company
stands for the cost of inspection, de-installation and transportation (PM Remanufacturing, 2014).
The cooperation with the sales team is ad-hoc. In the USCAN region the process is the most
progressed where the global commercial marketing manager have regular contact with the sales team
about the R2 products, this is however not the case in the EMEA or Asia region (PM
Remanufacturing, 2014). The sales team has a constant request to try to take back products. It is
crucial for the focal company that they get products back since without them they will not be able to
make offers on R2 product to new customers (SM, 2014).
Since the volumes of the returned products are low it is hard to not only predict when a customer will
return one product but also when a customer is interested in buying an R2 product. At the moment
there is no one responsible for making a return forecast, i.e. gathering and summarizing data on
product returns (PM Remanufacturing, 2014). The horizon on which they know what supply will be is
about one month, but they hope by the integration that the horizon will extend to the current quarter
(PM Remanufacturing, 2014). In comparison to the new products a distinct difference is that the with
the new products the focal company always work with the forecasted demand, but with the R2
products this is not possible due to the lack of control of supply (PM B, 2014).
4.4 Summary and analysis
It is seen in the focal company description that their description of the S&OP process have many
similarities in content to the one presented by Grimson and Pyke (2007) and Wallace and Stahl (2008)
in terms of steps included in the process and the way the process is performed. This is seen by the
researchers as positive since it confirms that the literature around the S&OP seem to be valid.

27
For the remanufacturing team it can be identified from the literature that issues raised in the literature
persist in companies today. Guide Jr. (Guide Jr., 2000) discusses that information about the magnitude
and uncertainty of return flows can be seen as a complicating characteristic which clearly can be seen
in the focal company today. Considering how the process works before taking back an instrument it is
concluded in accordance with Guide Jr. and van Wassenhove (2001) that the focal company works
with a market-driven returns management process and not waste-driven returns management process
which has the implications that less volume of products are returned, but on the other hand there is a
better guarantee that the products returned can be remanufactured and sold.
Webster and Mitra (2007) identify that there may be a strategic advantage for an OEM to work with
remanufacturing since that will prevent third party remanufacturers from entering the market. This is
also seen in the focal company where the reason for working with remanufacturing is to be able to
have a better control of the products after the first user’s end of use and hence prevent external parties
from entering the market.
In the interview, the PPM (2014) state that the focal company wants to have a world class S&OP
process in order to have high customer fulfillment. This can in theory be related to Kocabasoglu et al.
(2007) and Blackburn et al. (Blackburn, et al., 2004) who state that a good implementation of reversed
supply chain systems can increase customer loyalty and product feedback. In the case of the studied
company it is believed that by integrating R2 into the S&OP process and spending resources to find
complexities, there is a good base for achieving a world class S&OP and hence increase the service
level and customer fulfillment. Guide Jr. and Van Wassenhove (2001) also advocate that there is a
need for more integrated business models that can take advantage of remanufacturing and hence there
is another reason for the focal company to integrate the R2 products.
In summary, the focal company show many similarities with characteristics brought up in the literature
both about the S&OP process but also about the remanufacturing team and their processes. This is
seen as good since it enhances the validity that the study is focused on the right area.
28
5. Analysis - S&OP process complexities
The analysis is divided into three chapters where the identified areas of complexity are separately
highlighted and discussed in accordance with the research questions. First the demand side
complexities are analyzed and discussed followed by supply side and S&OP executive complexities.
5.1 Demand side complexities
In this chapter five topics are explained and discussed in order to highlight the complexities that it
means for the people involved in the two steps on the demand side of the S&OP process, that is the
commercial organization including Business Operations Manager and Modality leaders for step one
and regional demand planners and order fulfillment leader in step two. These five topics are:
Availability expectations
Flexibility vs standardization
IT-management in sales forecasting
Sales representatives incentives to focus on R2 products
Information sharing and opportunity management
Availability expectations from R2 products
A major issue that came up amongst several of the interviewees when asked about their own impact of
an integration of R2 was about what expectations that could be had for the R2 products compared to
new products in terms of availability from the supply chain once the R2 products are in the S&OP
process. The Commercial Finance Leader (CFL) discussed the need to make sure that R2 products are
available:
“If we’re going to really actively go sell R2 we need to make sure the products are available. There’s
going to be a lot more interaction than, ‘ok we want to buy an R200’. When we sell it we don’t even
know if we’ll have a product to buy.” (CFL, 2014)
The CFL later came back to the issue around expectations when asked about what was needed in order
for the integration to succeed:
“Expectations on what can be built and refurbished. We don’t want sales team to go out sell more R2
when we don’t even have products.” (CFL, 2014)
From the view of the sales team it was described how the integration of R2 would increase the
awareness and availability and make the sales representatives more conversant about the R2 products
as well as the other types of products offered. The complexity however seemed to come from the fact
that the sales representatives should be certain on what they can offer in terms of R2 products which
may pose a complexity within the focal organization if they can make that promise or not. The Sales
Operations Manager for product group Berry (SOM B) said:
“You want them to be 100% confident to talk about R2 right in the first call [with the customer] if that
is necessary. Way to do that is if they talk about it, then quote it, it’s going to shift. So right now, they
have to look back at inventory lists to see if it’s there [R2 products] to quote it.” (SOM B, 2014)
What was highlighted by the R2 Global Commercial and Marketing (Manager R2GCMM) (2014) was
the indirect expectations of the SOM B (2014) statement above that for the sales representatives to
know what there is in stock they themselves will need to add a forecast into the IT-system on what
they believe they will sell, else it will never be possible for the R2 team to find the right amount of
products to remanufacture.
29
The Product Manager for Berries (PM B) was very straight forward and seemed to getting to core of
this issue around expectations.
“…it can erode someone’s will to leave a forecast if they [sales representatives] still know that it will
not be fulfilled. You expect it to be fulfilled if you leave a forecast. In this case you can’t make that
promise. I don’t think you can promise to deliver [an R2 product].” (PM B, 2014)
PM B continued after a question about what the difference would be between having the R2 product in
the S&OP process and having R2 outside the process:
“…you put them [R2] in a process, by tradition for all other products [new products] you [sales
representatives] expect the order to be fulfilled. You leave an order for it to be on the shelf. But this
time you leave an order but no one can guarantee that there is a product available.” (PM B, 2014)
Related to availability expectations is also the change in validity requirements which may occur if R2
is integrated. The implications of integrating the R2 into the S&OP process were discussed by the
General Manager Sales (GM Sales) who said:
“Where I do see complexities is validating the data. The moment you start putting in [numbers into the
system], “we need 2 or 3 units”, then you want to know where did you [the sales representative] get
that data from, that is where it’s going to drive complexity”. (GM Sales, 2014)
Flexibility vs standardization
In two of the interviews the interviewees discussed the implications of integrating R2 into the
standardized S&OP process. However, even though only two interviews touched upon this it is still
believed to be an important topic for the focal company to consider. This concerned the flexibility that
is offered today by the R2 team being outside the S&OP process. The question for the focal company
to answer is how that flexibility will be affected by the integration into the S&OP process. The
Modality Leader for Berries (ML B) made the following statement:
“Current system works okay. I feel we need a bit of flexibility. Working with the remanufacturing
manager directly works well in terms of managing stock. When talking to customer to secure a system,
when you are comfortable you are just going to get an order, the remanufacturing manager is
comfortable putting that aside for a customer.” (ML B, 2014)
When ML B was asked about the benefits and drawbacks of the integration the same topic came up:
“The benefit is that you are just following the same process for everything, and processes are needed.
That’s how the company works essentially. So the company benefits. It’s a drawback because it's
outside of current system, and now we have flexibility, getting a bit more personal service, the higher
quality service we’re getting at the moment, that’s not scalable.” (ML B, 2014)
The Materials and Logistics Manger (MMLM) on the supply side of the process also highlighted this
when asked about benefits and drawbacks and said that the R2 products have special characteristics
and could not see the benefits of integration since the S&OP process is a very aggregated process:
“All articles are in the S&OP process and make the discussion extremely general. This creates
challenges and I don’t see the benefits of integrating R2.” (MLM, 2014)
30
IT management in sales forecasting
Something that was discussed by a number of interviewees regarded data management around the R2
products and how that differed from the data used for the new products. Mainly, two areas were
identified which were the discussed by the interviewees:
Aggregation of data
Product structure
Aggregation of data
On the topic of aggregation of data it is understood that the level at which the sales representatives
forecast new products are at item level. That is for every individual item number there is a separate
forecast. For the R2 products the issue that was highlighted was whether that resolution was needed or
if it would be enough with a more aggregate level, which may have implications for other parts of the
organization. The Regional Demand Planner for USCAN (RDP USCAN) said the following:
“So I don’t know how much details we need to have, Apple R2, is that enough for them to do
something about? Apple Clean has 3 or 4 models in it. Is it enough to just say Apple Clean, or could
they end up sourcing the wrong thing?” (RDP USCAN, 2014)
In the supply chain organization the MLM discussed the uncertainty in the forecast which was done
today by the sales representatives and how that was passed on through the different systems.
Especially this MLM discussed what the current relationship was between new and R2 products in the
forecasts that were entered into the system by the sales representatives. The interviewee said that
maybe the sales representatives had some buffer with the R2 products by not making a distinction
between new and R2 products in the data entry and making everything into one data entry.
“…when they have a prospect of 15, and 5 are R2… that is easy. There could be an element of
uncertainty which we don’t see today.” (MLM, 2014)
The Product Planning Leader for Apple products (PPL A) that was interviewed confirmed previous
interviews stating that all items are forecasted on item level and to make a different configuration for
the R2 products would be difficult:
“Our system is built on item level. To forecast on a higher level for the R2 products would require
another system.” (PPL A, 2014)
ML B said that for the R2 categories in their region at the moment they forecast only a dollar value for
each category which is contradictive to the planning system for new products where quantities are
forecasted.
“But for R2 we just forecast dollar value for each category. So we need to be careful and forecast
which type of product.” (ML B, 2014)
This is the complexity that needs to be highlighted in terms of aggregation level, at what level should
the R2 products be demand forecasted and what is the technical solution behind it?
Product center structure in IT system
Many interviewees mentioned the uncertainty of that they didn’t know how the data was going to be
used and displayed and relates to the product center structure used in the company today. The product
centers are divided depending on in which facility the products are produced. That is one facility has
one product center number and another facility another one. The issue that arises in the case of the R2
31
products is whether they should be part of the product center at which they are produced or if they
should be a separate product center to increase the visibility of the products. This discussion comes
from the fact that R2 in total, are spread across all product groups and is a small number measured in
dollars and if it is part of a large product center there will be very little chance that the R2 products
will get attention they seek to get by this integration. The CFL said:
“It depends how they are going to show the data. This is where I don’t know. Are they going to show
all Berry R2 or separate them? What we review at the moment, one business area, one PC [product
center] looks at all of Berry won’t work on a high level view. Depending on… we won’t be going on
unit by unit, item by item. If we will look at Berry or Berry R2 or if separating them that I don’t
know.” (CFL, 2014)
From the SOM B the interpretation was that it was confused whether or not the R2 products had its
own product group:
“…don’t know if it’s in a different product group, but within PC46 [product center 46]. Maybe it is in
a different product group, maybe in an R2 product group.” (SOM B, 2014)
The product center structure seems to be important in order to be able to highlight the R2 products and
bring R2 the attention they need. Else there seem to be very little use of integration.
Sales representatives incentives to focus on R2 products
What was also defined as a complexity was the incentive structure for sales representatives to focus on
the R2 products on a monthly basis in the S&OP process instead of the ad-hoc process used today in
order to increase the certainty in supply of cores from the R2 products. There were large differences
between different interviewees in whether they believed incentives were a good thing or not. For that
reason the incentives are highlighted here as a complexity since it needs to be further examined within
the focal company to understand what approach to use in order to make the best possible integration.
Those who were positive to incentives seemed to think primarily about financial incentives and were
discussed by Modality Leader A (ML A) and SOM B seen in the statements below:
“From that aspect if you want to solidify the supply chain if you give some kind of bonus for bringing
in R2 then you would find people [salespeople] start to react and work for you.” (ML A, 2014)
“The way they look at is it ‘I would get a sale, I would have gotten if I didn’t do the trade-in’. Another
way, is to give compensation on trade-in, for every trade-in you get 500 bucks on trade-in.” (SOM B,
2014)
On the other hand those who were negative stated that it was part of the sales representatives’ job to
do the activities related to the R2 products as well. The GM Sales said:
“...clearly each salesperson have a dollar value they got to hit, higher of each individual unit the
better. If they sell R2 yes, but lower revenue. Clearly they want to sell new [product] in the first
instance. That’s the... they don’t have any particular incentives of accuracy of funnel management
accuracy…” (GM Sales, 2014)
This was repeated by the general sales manager:
“There’s no incentive... the incentive would be to make process easy, how accurate data is going to
be” (GM Sales, 2014)
32
Also the global commercial and marketing manager for the R2 team (R2GCMM) expressed the same
attitude:
“None, they should do it because they get paid the salary. They get paid by selling systems. Same as
other platforms. To give extra incentives to them... Some get paid a lot. What it is all about. Other
incentive is that what we will get knowledge of what we have in stock.” (R2GCMM, 2014)
Information sharing and opportunity management
Information sharing was not seen as a major complexity but it was believed that it was still a valid
complexity since it involves several stakeholders which at the moment are not completely defined. In
regards of what information that was needed to step two in the process it was seen to be both supply
information as stated by the Order fulfillment leader:
“On supply side we want to understand what could be provided from existing inventory. Also
understanding if they have process to acquire trade in or buy backs, fulfill demand if we do see in
market for refurbished products.” (OFL, 2014)
But also demand information as stated by the two interviewed regional demand planners:
“To be honest I don’t usually get into the details, what opportunities to put in. I just take that from the
modality leader. So I don’t know if it’s me who have to go back but someone will have to go back to
get some detail about those [R2] opportunities if it's not already there.” (RDP USCAN, 2014)
“…I assume that I will need to talk to someone in the remanufacturing manager’s team, if not the
remanufacturing manager himself, if I need to control some number. Surely I will get numbers from
the commercial finance leader (CFL) in the future as well but I will for sure have to discuss my
numbers with someone in the R2 team as well.” (RDP EMEA, 2014)
Today there are only new products in the Sales and Operations Planning process, which means that the
people working in the second stage of the process only are accustomed to working with new products.
However the order fulfillment leader highlighted that they need to understand how the R2 products
work as well:
“But I don’t know that they [the sales representatives] been accustomed to forecasting R2 sales, so we
have to understand from them how that selling process might be different. We’re going into account
selling new piece that’s different from selling refurbished equipment. We don’t know if their process is
the same, if they use same part numbers, I would guess it’s different, brand new Apple maybe one item
number, remanufactured may be different. So understand how those opportunities are managed. And
how we can take that input into demantra…” (OFL, 2014)
The order fulfillment leader continued highlighting the importance of information sharing and
communication:
“If we’re going to launch a project integrating R2, we need to have someone identified to work with
the commercial team to understand that. It may be a regional responsibility, because systems are
different from region to region. Sales process may be different too. But someone must be responsible
for understanding what those differences are.” (OFL, 2014)
33
Summary and analysis of demand side complexities – step 1 and step 2
The interviews imply that in the first two steps of the S&OP process, there are several complexities
that are highlighted as important to solve before integration is commenced. Especially there are four
areas that the interviewees came back to which was defined as complexities.
S&OP expectations from R2 product,
Flexibility versus process standardization,
IT management in the sales forecasting process, and
Incentives for sales representatives to focus on R2 products
Information sharing and opportunity management
From the interviews it was a recurring topic that there seemed to be an open question around the topic
of what commitment that was to be made by integrating the R2 products into the S&OP process. The
commitment was in terms of what could be promised to the sales organization from the supply chain
organization taking the special characteristics of the R2 products into consideration, i.e. having an
uncertainty about the quantity of supply available and the timing of potential returns. To handle this
complexity there is a need to make consensus decisions between the sales organization, the supply
organization, the S&OP organization and the R2 team in order to handle the difficulties that may arise
in terms of expectations amongst sales representatives which in turn may lead to loss of customer
loyalty and reduced revenue. Part of this regards to the validity of the data in the system which is
highlighted by Ivert and Jonsson (2010) who state that for the personnel using the data not to lose
confidence in the system would require the data in the system to be up to date and accurate. In the case
of the studied company, one of the consequences seen by the authors is that with the R2 products
being a relatively small part of the business the accuracy of the data provided by the sales
representatives and the R2 team may not always be accurate when in the S&OP process since the
volumes are relatively low and hence with a monthly cycle the data may expire before it is discussed
in the process and hence may cause the sales representatives to lose confidence in the system in
accordance with Ivert and Jonsson (2010).
Another aspect highlighted by a few of the interviewees was the flexibility of a small independent
organization versus a standardized well known process as the Sales and Operations Planning process.
Considering the characteristics of the R2 products as difficult with the uncertainty in recovery rates
and very imperfect correlation between demand and supply (Guide Jr. & Srivastava, 1998) combined
with the very low volumes generally returned (PM Remanufacturing, 2014) it is believed to be crucial
that there is as short channel of communication as possible between the customer and the supply and
refurbishment of the product. By integrating the R2 products another layer of communication will be
added as well as the use of a monthly S&OP cycle in the focal company which will increase the lead
time of the decisions that will be made. However the R2 products can be seen as products that would
match for an event-driven process as Grimson and Pyke (2007) state where the managers respond to
situations that arise. In real terms this could mean that the R2 team responds to customer requests from
the regions as part of their daily activity but on the other hand also participates in the regular meetings
held within the S&OP process. Ivert and Jonsson (2010) discuss the need of accurate data in order to
have trust in the system and it is believed that by being flexible, the paths of decisions will be short
and hence the accuracy of the data will be better than if it is included in a monthly cycle and will thus
make the personnel in the company more positive to the R2 products.
The IT management in the sales forecasting process was divided into two sub components;
aggregation of data and product center structure. These areas are believed to be important for the R2
products, partly from a logistical perspective when entering the data into the current data systems,
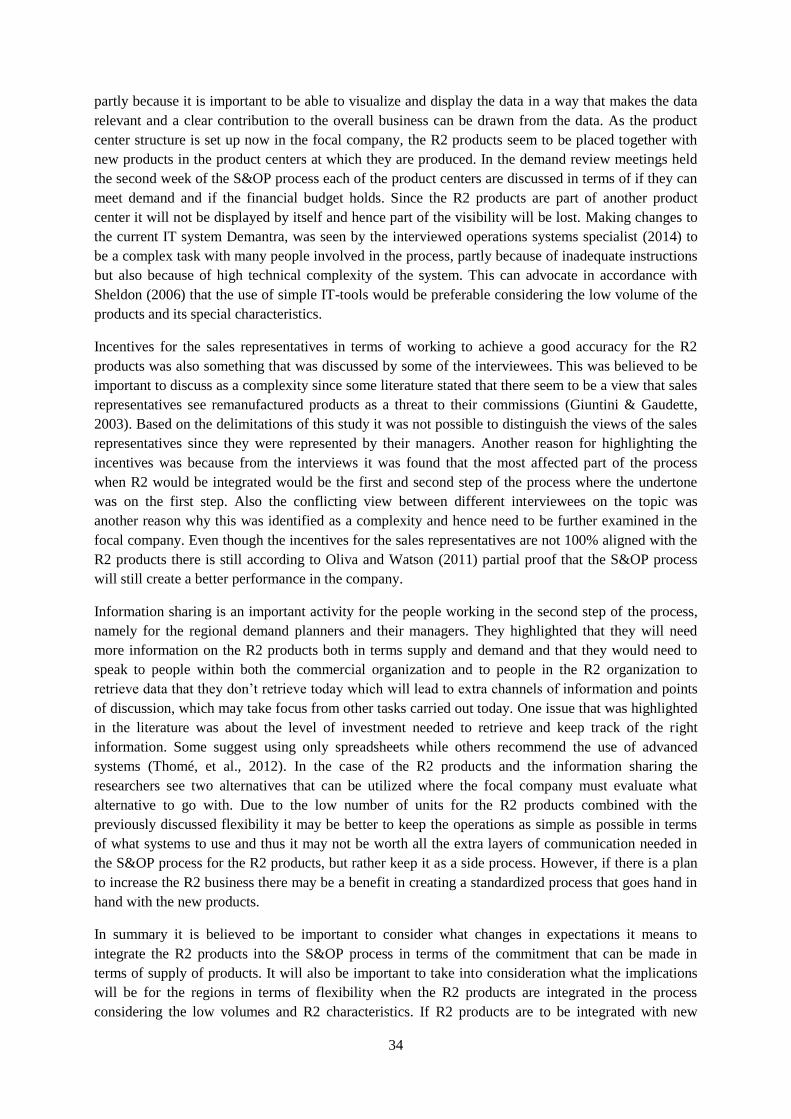
34
partly because it is important to be able to visualize and display the data in a way that makes the data
relevant and a clear contribution to the overall business can be drawn from the data. As the product
center structure is set up now in the focal company, the R2 products seem to be placed together with
new products in the product centers at which they are produced. In the demand review meetings held
the second week of the S&OP process each of the product centers are discussed in terms of if they can
meet demand and if the financial budget holds. Since the R2 products are part of another product
center it will not be displayed by itself and hence part of the visibility will be lost. Making changes to
the current IT system Demantra, was seen by the interviewed operations systems specialist (2014) to
be a complex task with many people involved in the process, partly because of inadequate instructions
but also because of high technical complexity of the system. This can advocate in accordance with
Sheldon (2006) that the use of simple IT-tools would be preferable considering the low volume of the
products and its special characteristics.
Incentives for the sales representatives in terms of working to achieve a good accuracy for the R2
products was also something that was discussed by some of the interviewees. This was believed to be
important to discuss as a complexity since some literature stated that there seem to be a view that sales
representatives see remanufactured products as a threat to their commissions (Giuntini & Gaudette,
2003). Based on the delimitations of this study it was not possible to distinguish the views of the sales
representatives since they were represented by their managers. Another reason for highlighting the
incentives was because from the interviews it was found that the most affected part of the process
when R2 would be integrated would be the first and second step of the process where the undertone
was on the first step. Also the conflicting view between different interviewees on the topic was
another reason why this was identified as a complexity and hence need to be further examined in the
focal company. Even though the incentives for the sales representatives are not 100% aligned with the
R2 products there is still according to Oliva and Watson (2011) partial proof that the S&OP process
will still create a better performance in the company.
Information sharing is an important activity for the people working in the second step of the process,
namely for the regional demand planners and their managers. They highlighted that they will need
more information on the R2 products both in terms supply and demand and that they would need to
speak to people within both the commercial organization and to people in the R2 organization to
retrieve data that they don’t retrieve today which will lead to extra channels of information and points
of discussion, which may take focus from other tasks carried out today. One issue that was highlighted
in the literature was about the level of investment needed to retrieve and keep track of the right
information. Some suggest using only spreadsheets while others recommend the use of advanced
systems (Thomé, et al., 2012). In the case of the R2 products and the information sharing the
researchers see two alternatives that can be utilized where the focal company must evaluate what
alternative to go with. Due to the low number of units for the R2 products combined with the
previously discussed flexibility it may be better to keep the operations as simple as possible in terms
of what systems to use and thus it may not be worth all the extra layers of communication needed in
the S&OP process for the R2 products, but rather keep it as a side process. However, if there is a plan
to increase the R2 business there may be a benefit in creating a standardized process that goes hand in
hand with the new products.
In summary it is believed to be important to consider what changes in expectations it means to
integrate the R2 products into the S&OP process in terms of the commitment that can be made in
terms of supply of products. It will also be important to take into consideration what the implications
will be for the regions in terms of flexibility when the R2 products are integrated in the process
considering the low volumes and R2 characteristics. If R2 products are to be integrated with new
35
products despite the different characteristics it is believed to be important to make sure that those
products can be highlighted and easily displayed in discussion and hence need the right type of IT
structure. Incentives for the sales representatives to focus on the R2 products are a topic needed to
discuss further in order to understand the drivers and hence understand how the focal company can
gain the most out of the R2 products in the long run. How to manage the information sharing on the
demand side when R2 is integrated must also be considered. A visualization of the demand side
complexities are highlighted below in Figure 9.
5.2 Supply side complexities
On the supply side three different complexities were found and are described below:
Planning uncertainty
Supply driven process
Information flow of supply
Planning uncertainty
Planning uncertainty was one, conceptual topic that was discussed among two of the interviewees, one
on the supply side and on the demand side of the process. When the materials and logistics manager
(MLM) was asked about the benefits of the integration the manager got on the track talking about the
planning uncertainty because sales representative may not distinguish between new products and R2
products in data entry.
“…under the assumption that it is the same sales organization, but I don’t know if it the same sales
organization, same individuals that sell R2 as new products. Then there is a benefit that… when they
[sales representatives] have a prospect of 15 products, and 5 of them are R2… then it is easy. There it
could be a factor of uncertainty today that we don’t see today [since R2 are not included].” (MLM,
2014)
The MLM continued on the same questions:
“…theoretic risk that they [sales representatives] communicating R2 products in the total number if it
is the same sales representative that sell new and R2 products. If they say 15 and are thinking, ‘I will
sell 10 new and 5 R2’ and today it comes out as 15 new products.” (MLM, 2014)
The GM Sales that was interviewed discussed the same topic and highlighted the way at which it can
change from being a new product to an R2 product when asked about what part the S&OP process that
would face most challenges when R2 is integrated in the process:
Figure 9: Demand side complexities
36
“Getting accuracy in there in the first place. Speed of transition or if something becomes an R2, that’s
going to be hard to nail. I can see benefits of linearity, but how close can we get to… 3-4 months out,
saying this will really be an R2. Things tend to change quickly. Default will be, we will always need
new products, it can transition over course of week, ‘hey we suddenly get less funding, so it’s going to
be an R2’.” (GM Sales, 2014)
Supply driven process
The supply of cores was identified in the literature as a major obstacle for remanufactured products.
This was confirmed in the interviews where many of the interviews in some context brought up the
discussion around the uncertainty with R2.
The complexity with remanufactured products is that there is a need to buy back cores (Thierry, et al.,
1995) and when the order fulfillment leader (OFL) was asked what activities that would be affected
the OFL discussed what was driving the chain of events in the process for remanufactured products:
“We can’t always make to order. It is more of a supply driven model. That may change the way we
forecast. More question of the inverse. This is what we predict we have available to sell, can we sell it
versus this is what market is demanding, can we build it. I don’t know, maybe I’m wrong, maybe
there’s a market for buying, or encouraging trade-in for aftermarket products. But I could also see it
driven more by supply than driven by demand. That’s a conversation we don’t typically have with the
sales team. But maybe we could turn it on reverse and say we use S&OP process to get visibility on
supply, then have conversation with commercial teams, based on that info, what do you think you can
sell on the market, what can you commit on selling, and then go out selling.” (OFL, 2014)
The modality leader for Berry product (ML B) also expressed that the remanufactured products are on
a supply driven model when asked about who should do the forecasting of used products:
“There, I’d say no - we have to know about supply to be able to forecast.” (ML B, 2014)
Information flow of supply
The responsibility of forecasting may seem obvious for new products as a task carried out by the sales
representatives. When the interviewees were asked particularly about what part of the organization
that should do the supply forecasting of the R2 product different answers came up. A few mentioned
the demand side (PPL B, 2014; PM A, 2014), i.e. sales representatives and demand planning while the
majority (OFL, 2014; PrPM, 2014; RDP USCAN, 2014; SM, 2014; PM B, 2014; MS A, 2014; GM
Sales, 2014) said that the R2 team should do the forecasting of supply. The responses from some of
the interviews were in direct contradiction to one another, even though both the interviewees worked
in the same part of the organization. First the Sales Operations Manager for Berry products (SOM B):
“…you could forecast old products coming in. I would want to do it in that process, I wouldn’t want to
create an outside process, like if you want to forecast trade-in coming in, it needs to be put into
normal process sales person uses, I don’t want to have another trade-in tracker. Can’t do that, sales
are too busy.” (SOM B, 2014)
The SOM B continued:
“That’s not something we do… we don’t forecast trade-ins. That would be change to our process,
something we could do if needed.” (SOM B, 2014)
This view of the sales operations manager stands in direct contrast to the GM sales view when the
question was asked about whom should do the forecasting:
37
“It certainly shouldn’t be sales. The only role of sales... sales should be helping to say, this is what we
feel would be ratio between new and old products. But when it comes to acquisition of products that’s
nothing to do with sales, that’s internal demand planning. So we see demand then it’s up to the R2
product Manager to say we got this supply.” (GM Sales, 2014)
Summary and analysis of supply side complexities – step 3
On the supply side of the S&OP process a few complexities were identified by the interviews. Since
the supply of cores is essential for the remanufacturing operations to exist the complexities on this side
are seen by the researchers to stem from that particular uncertainty. Especially four different
complexities were identified and listed below:
Planning uncertainty
Supply driven process
Supply forecasting responsibility
The planning uncertainty complexity also from the supply uncertainty and is also identified in the
framework for remanufacturing by Guide Jr. et al. (2000) since there is a need to balance demand with
returns. It is not like with new products where you need to match raw material, capacity and labor with
the demand, but in the case of the R2 there is also a need to match it with the returns of used products
which is said to lie outside the control of the company and hence increase the uncertainty in timing,
quality and quantity (Jayaraman, et al., 1999; Van Hillegersberg, et al., 2001). In relation to the S&OP
process this is an important complexity to highlight since it highlights the importance of working with
the returns management process which is supported by Jayaraman et al. (1999) but not to forget that it
should be done in combination with the forward flow supply chain, else there may be a risk that if the
forward supply chain is not managed properly it may give a bad effect to the reversed supply chain in
the long run. This complexity however doesn’t seem to be a big problem within the focal company.
This is since they are already planning in close cooperation with the planning team for new products
(PM Remanufacturing, 2014) but for the academic contribution it is still believed to be valid but will
depend on the context of the company.
From the interviews it was identified that the planning uncertainty seems to be the stemming from the
fact that there always seem to be a lack of supply in comparison to the demand that is available for the
R2 products. That was in the literature described as having a supply driven model rather than a
demand driven model (Jayaraman, et al., 1999; Van Hillegersberg, et al., 2001) which was identified
as a second complexity on the supply side. This could be further visualized using the model in Figure
4 by Guide Jr. and Van Wassenhove (2006) who divided the returns management process into three
categories. The one identified as the bottle neck is the product returns management and not the internal
operations or the development of new markets for the remanufactured products since there very often
seem to be an overflow of demand for the remanufactured products (PM Remanufacturing, 2014). A
supporting factor that was described by Brennan et al. (1994) which makes the returns management
more difficult and that was described in some of the interviews was that the products in the focal
company have a very long life cycle and hence the returned products are spread over a long period of
time.
It is a very important insight that the returns management process is supply driven rather than demand
driven when introducing remanufactured products into the S&OP process, the basic assumption is that
supply is matched to demand and not vice versa, i.e. that demand is matched by supply which to the
researchers seem to be a different mindset compared to new products and could hence pose challenges
by itself on a more conceptual level since there may be a need to change the paradigm used in the
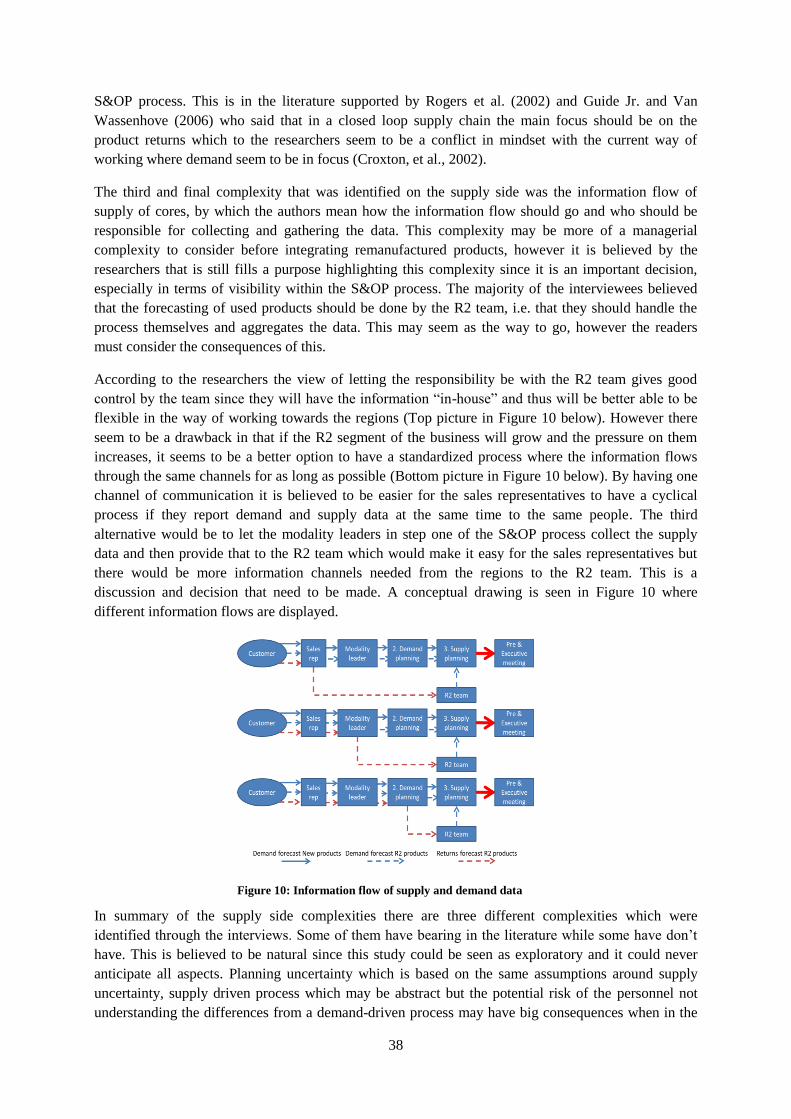
38
S&OP process. This is in the literature supported by Rogers et al. (2002) and Guide Jr. and Van
Wassenhove (2006) who said that in a closed loop supply chain the main focus should be on the
product returns which to the researchers seem to be a conflict in mindset with the current way of
working where demand seem to be in focus (Croxton, et al., 2002).
The third and final complexity that was identified on the supply side was the information flow of
supply of cores, by which the authors mean how the information flow should go and who should be
responsible for collecting and gathering the data. This complexity may be more of a managerial
complexity to consider before integrating remanufactured products, however it is believed by the
researchers that is still fills a purpose highlighting this complexity since it is an important decision,
especially in terms of visibility within the S&OP process. The majority of the interviewees believed
that the forecasting of used products should be done by the R2 team, i.e. that they should handle the
process themselves and aggregates the data. This may seem as the way to go, however the readers
must consider the consequences of this.
According to the researchers the view of letting the responsibility be with the R2 team gives good
control by the team since they will have the information “in-house” and thus will be better able to be
flexible in the way of working towards the regions (Top picture in Figure 10 below). However there
seem to be a drawback in that if the R2 segment of the business will grow and the pressure on them
increases, it seems to be a better option to have a standardized process where the information flows
through the same channels for as long as possible (Bottom picture in Figure 10 below). By having one
channel of communication it is believed to be easier for the sales representatives to have a cyclical
process if they report demand and supply data at the same time to the same people. The third
alternative would be to let the modality leaders in step one of the S&OP process collect the supply
data and then provide that to the R2 team which would make it easy for the sales representatives but
there would be more information channels needed from the regions to the R2 team. This is a
discussion and decision that need to be made. A conceptual drawing is seen in Figure 10 where
different information flows are displayed.
In summary of the supply side complexities there are three different complexities which were
identified through the interviews. Some of them have bearing in the literature while some have don’t
have. This is believed to be natural since this study could be seen as exploratory and it could never
anticipate all aspects. Planning uncertainty which is based on the same assumptions around supply
uncertainty, supply driven process which may be abstract but the potential risk of the personnel not
understanding the differences from a demand-driven process may have big consequences when in the
Figure 10: Information flow of supply and demand data
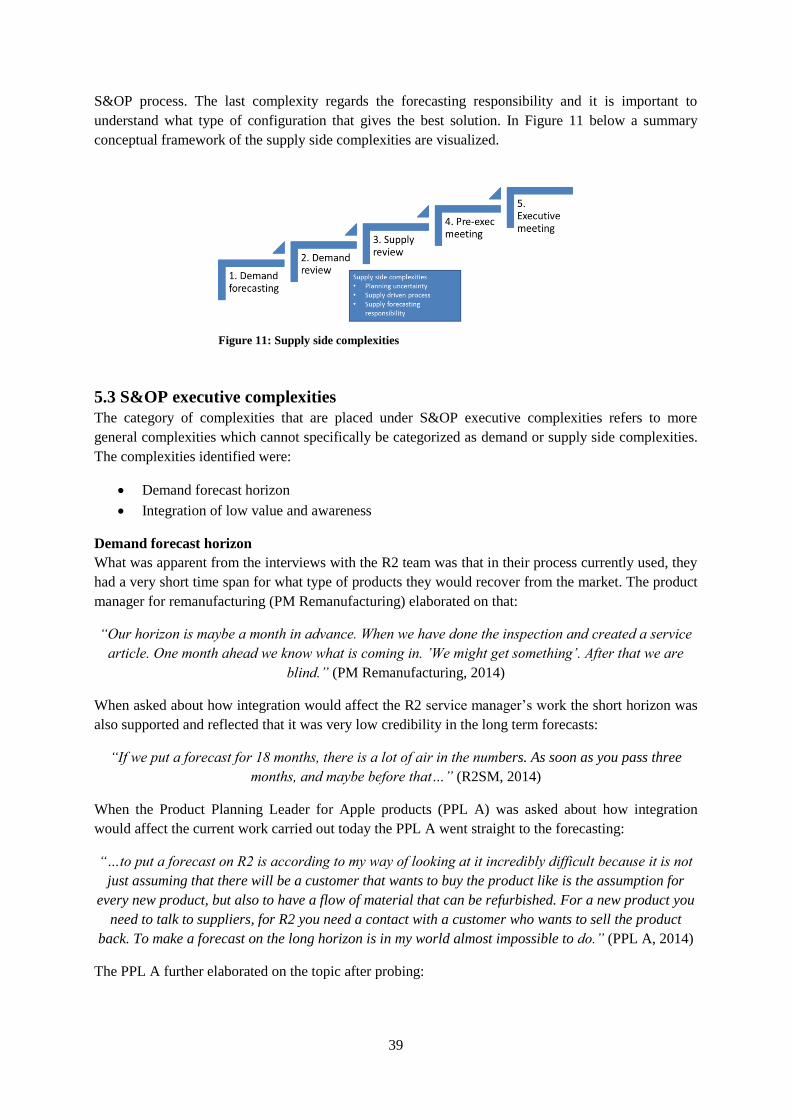
39
S&OP process. The last complexity regards the forecasting responsibility and it is important to
understand what type of configuration that gives the best solution. In Figure 11 below a summary
conceptual framework of the supply side complexities are visualized.
5.3 S&OP executive complexities
The category of complexities that are placed under S&OP executive complexities refers to more
general complexities which cannot specifically be categorized as demand or supply side complexities.
The complexities identified were:
Demand forecast horizon
Integration of low value and awareness
Demand forecast horizon
What was apparent from the interviews with the R2 team was that in their process currently used, they
had a very short time span for what type of products they would recover from the market. The product
manager for remanufacturing (PM Remanufacturing) elaborated on that:
“Our horizon is maybe a month in advance. When we have done the inspection and created a service
article. One month ahead we know what is coming in. ’We might get something’. After that we are
blind.” (PM Remanufacturing, 2014)
When asked about how integration would affect the R2 service manager’s work the short horizon was
also supported and reflected that it was very low credibility in the long term forecasts:
“If we put a forecast for 18 months, there is a lot of air in the numbers. As soon as you pass three
months, and maybe before that…” (R2SM, 2014)
When the Product Planning Leader for Apple products (PPL A) was asked about how integration
would affect the current work carried out today the PPL A went straight to the forecasting:
“…to put a forecast on R2 is according to my way of looking at it incredibly difficult because it is not
just assuming that there will be a customer that wants to buy the product like is the assumption for
every new product, but also to have a flow of material that can be refurbished. For a new product you
need to talk to suppliers, for R2 you need a contact with a customer who wants to sell the product
back. To make a forecast on the long horizon is in my world almost impossible to do.” (PPL A, 2014)
The PPL A further elaborated on the topic after probing:
Figure 11: Supply side complexities
40
“…to have horizon on how much we can get back beyond this quarter. We don’t have good enough
information on how much the customers wants to buy, I don’t see how can get information on what we
can get back.” (PPL A, 2014)
When the same product planning leader was asked what would be most important to focus on it came
back to the horizon:
“Same thing as for the S&OP process we have today. To keep a reasonable horizon to give effect on
the [production] planning. You can’t just look at the coming weeks but further away. If you feel that
you can’t look further, then there is no value to make a signal about what is going to happen.” (PPL
A, 2014)
The general manager for logistics and fulfillment (GM Logistics and Fulfillment) was asked how it
was believed that the integration would affect the current tasks carried out and made a sketch on the
whiteboard with a four field matrix with different planning horizons in each field and said:
“Where would you put R2? It is totally unpredictable. We don’t know what dealers there are.” (GM
Logistics and Fulfillment, 2014)
The accuracy in the forecast of R2 products was discussed by GM Sales and especially the speed at
which products change from a new to an R2:
“Going to be that speed of change... single biggest challenge. We will likely know unit demand ahead
of quarter, or put finger on it, but to be able to say if it’s specifically an R2 or not going to be a lot
more difficult. It is a question of does customer require the product or not, that’s ok, but R2 or not,
then it’s about competitive situation, funding situation. So single challenge is speed.” (GM Sales,
2014)
Due to the low number of R2 products it was believed that if it is difficult to predict how many new
products that will be sold it will be even harder to predict what will be an R2 product.
Integration of low value and awareness in the organization
During many of the interviews a question came up about what the value would be of the integration of
R2. Many believed that the effort put in to integrating R2 would not be much bigger than the output by
having R2 in the S&OP process. The ML A was very much to the point expressing this:
“It might be a lot of work for a little income compared to other products.” (ML A, 2014)
The order fulfillment leader discussed around flexibility but came on to the topic discussing the
balance in the processes established:
“…we do have tendency at the focal company to create a lot of processes, and sometimes that process
becomes burdensome and not as effective in the absence of it. On other hand we’re sort of looked at as
a best in class because of our process and rigor we have. There has to be a balance there.” (OFL,
2014)
When asked about drawbacks of the integration the production preparation manager (PrPM) came to
talk about all the resources put into the process and what the output would be:
“How many people will spend time doing this? There are very much people involved in the process.
For them to do a good job, how much time do they need to spend? And at the end, how much better
information will it be than the product manager doing estimation?” (PrPM, 2014)
41
The PrPM expressed concerns about low volume products and the volatility that it brings and
concluded that the disadvantage will be all the extra work for little output:
“My concern is that volumes are quite low and probably quite volatile. That’s the sense, don’t have
lots of evidence but my sense is it’s very much… not a smooth business you get 3 a month.
Disadvantage that we create lots of extra work and because very volatile, that we are not able to add
much value.” (PPM, 2014)
The operation systems specialist (OSS) that was interviewed had one thing to mark on when asked
about what part of the S&OP process that would face the most challenges in the integration:
“I’m not sure if I can judge on this. I have no idea about this. Only thing I would like to comment is
we need to balance how much we investigate for R2 compared to the rest of the products. If we spend
more time on R2 than for other business areas where we earn many times more in our company, then
something is wrong.” (OSS, 2014)
All in all many different people on separate occasions mentioned the value of an integration as
something worth considering when and before integrating the remanufactured products into the S&OP
process. One aspect of why many see the low value may be because of the lack of understanding of the
R2 product. Some of the interviewees were asked about how good the knowledge was R2 amongst the
staff. The business leader for Apple products (BL A) believed that sales representatives know but
other part of the organization don’t know as much.
“Not so good I think. Sales representatives know what R2 is… not special about that. But in general
the ones that work in the S&OP process, the ones that we meet on the regional meetings. They seem to
have very little knowledge…” (BL A, 2014)
The PM remanufacturing was of the same opinion that there may be a need to create more awareness
about the R2 products or at least create an understanding of what it is:
“I don’t know… I’m guessing there is a need for more training. Or just to create an understanding of
what it is. But the ones working with demantra, they don’t need to know what it is.” (PM
Remanufacturing, 2014)
Even though the product manager for remanufacturing stating that there is no need for those working
with demantra to have that knowledge, it may depend on the previously discussed flow of information
for the R2 products.
The PPM also agreed that the knowledge about R2 was not as good as it could be and said that it
wasn’t certain that the people working with demantra, regional demand planners had the knowledge
about the R2 products:
“I think we find there are some people in North America regions who know a lot of about R2 and
product offerings. I’m not sure whether regional demand planners are really that familiar with it.”
(PPM, 2014)
Summary and analysis – S&OP executive complexities
Some of the identified complexities were not possible to place under any of the two initial areas of
demand side or supply side complexities. Therefore they were seen as more of S&OP executive
complexities where it is hard to distinguish where the biggest impact of the complexity would be. Two
major complexities were identified as executive and are analyzed in this chapter:
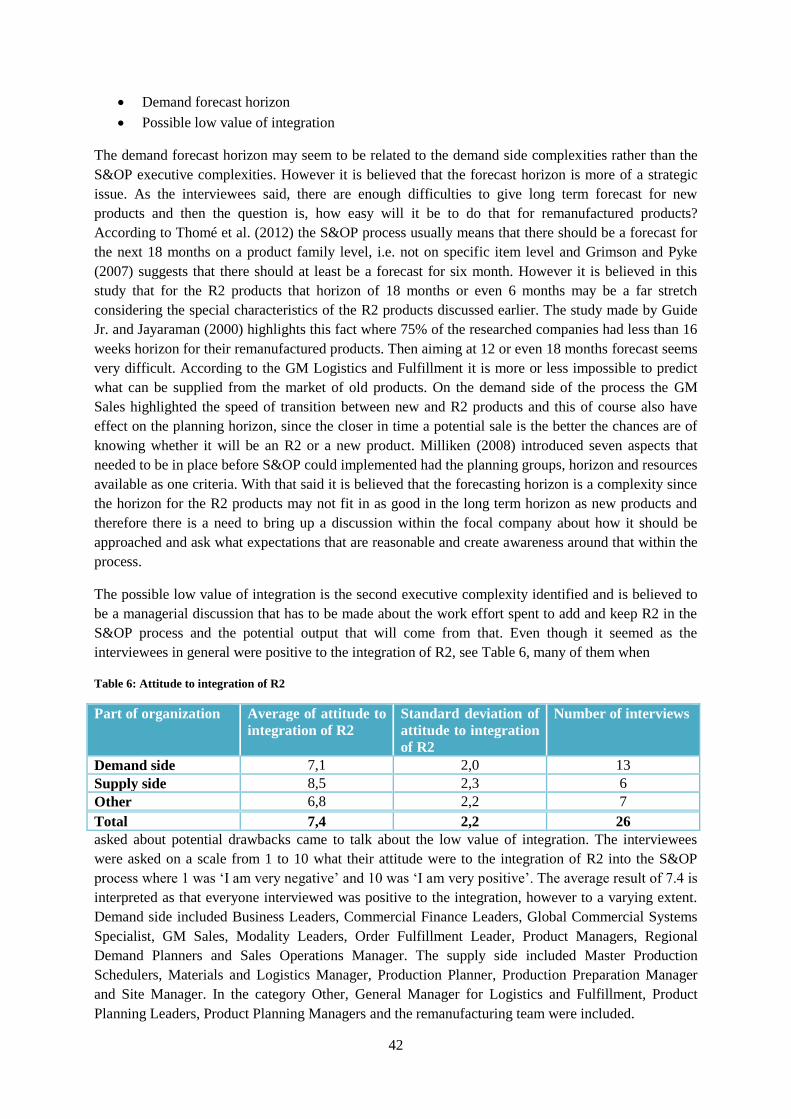
42
Demand forecast horizon
Possible low value of integration
The demand forecast horizon may seem to be related to the demand side complexities rather than the
S&OP executive complexities. However it is believed that the forecast horizon is more of a strategic
issue. As the interviewees said, there are enough difficulties to give long term forecast for new
products and then the question is, how easy will it be to do that for remanufactured products?
According to Thomé et al. (2012) the S&OP process usually means that there should be a forecast for
the next 18 months on a product family level, i.e. not on specific item level and Grimson and Pyke
(2007) suggests that there should at least be a forecast for six month. However it is believed in this
study that for the R2 products that horizon of 18 months or even 6 months may be a far stretch
considering the special characteristics of the R2 products discussed earlier. The study made by Guide
Jr. and Jayaraman (2000) highlights this fact where 75% of the researched companies had less than 16
weeks horizon for their remanufactured products. Then aiming at 12 or even 18 months forecast seems
very difficult. According to the GM Logistics and Fulfillment it is more or less impossible to predict
what can be supplied from the market of old products. On the demand side of the process the GM
Sales highlighted the speed of transition between new and R2 products and this of course also have
effect on the planning horizon, since the closer in time a potential sale is the better the chances are of
knowing whether it will be an R2 or a new product. Milliken (2008) introduced seven aspects that
needed to be in place before S&OP could implemented had the planning groups, horizon and resources
available as one criteria. With that said it is believed that the forecasting horizon is a complexity since
the horizon for the R2 products may not fit in as good in the long term horizon as new products and
therefore there is a need to bring up a discussion within the focal company about how it should be
approached and ask what expectations that are reasonable and create awareness around that within the
process.
The possible low value of integration is the second executive complexity identified and is believed to
be a managerial discussion that has to be made about the work effort spent to add and keep R2 in the
S&OP process and the potential output that will come from that. Even though it seemed as the
interviewees in general were positive to the integration of R2, see Table 6, many of them when
Table 6: Attitude to integration of R2
Part of organization Average of attitude to
integration of R2
Standard deviation of
attitude to integration
of R2
Number of interviews
Demand side 7,1 2,0 13
Supply side 8,5 2,3 6
Other 6,8 2,2 7
Total 7,4 2,2 26
asked about potential drawbacks came to talk about the low value of integration. The interviewees
were asked on a scale from 1 to 10 what their attitude were to the integration of R2 into the S&OP
process where 1 was ‘I am very negative’ and 10 was ‘I am very positive’. The average result of 7.4 is
interpreted as that everyone interviewed was positive to the integration, however to a varying extent.
Demand side included Business Leaders, Commercial Finance Leaders, Global Commercial Systems
Specialist, GM Sales, Modality Leaders, Order Fulfillment Leader, Product Managers, Regional
Demand Planners and Sales Operations Manager. The supply side included Master Production
Schedulers, Materials and Logistics Manager, Production Planner, Production Preparation Manager
and Site Manager. In the category Other, General Manager for Logistics and Fulfillment, Product
Planning Leaders, Product Planning Managers and the remanufacturing team were included.
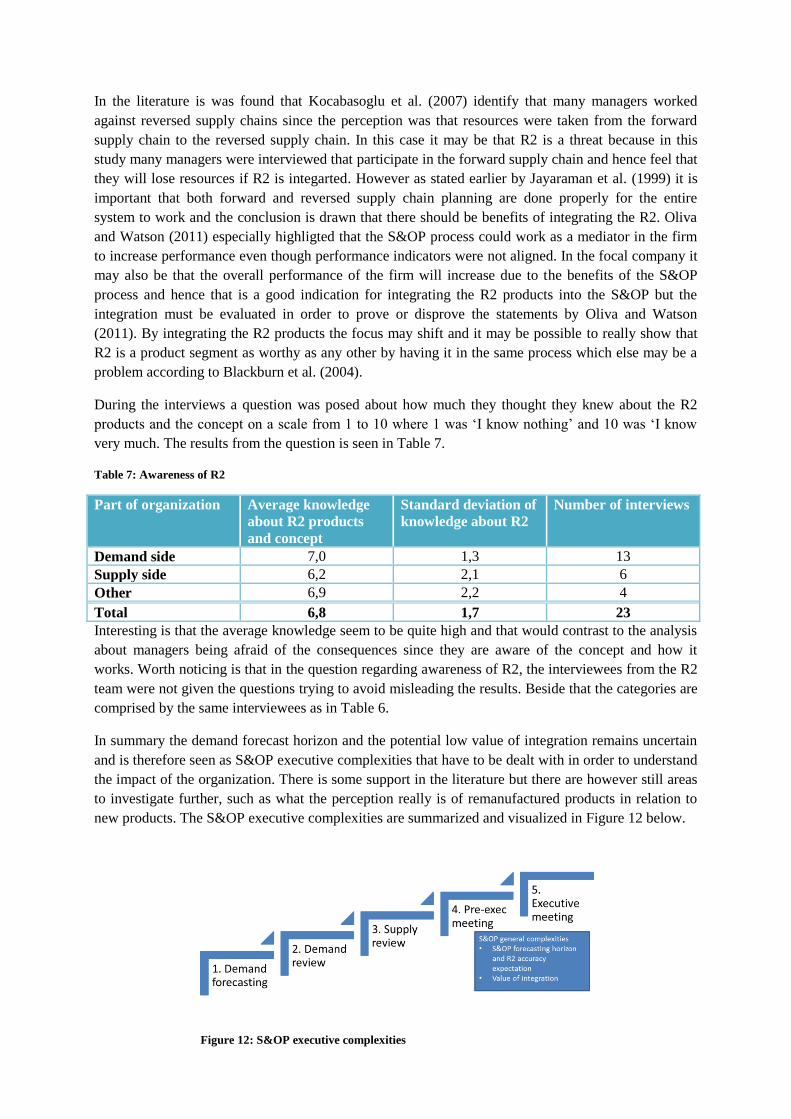
43
In the literature is was found that Kocabasoglu et al. (2007) identify that many managers worked
against reversed supply chains since the perception was that resources were taken from the forward
supply chain to the reversed supply chain. In this case it may be that R2 is a threat because in this
study many managers were interviewed that participate in the forward supply chain and hence feel that
they will lose resources if R2 is integarted. However as stated earlier by Jayaraman et al. (1999) it is
important that both forward and reversed supply chain planning are done properly for the entire
system to work and the conclusion is drawn that there should be benefits of integrating the R2. Oliva
and Watson (2011) especially highligted that the S&OP process could work as a mediator in the firm
to increase performance even though performance indicators were not aligned. In the focal company it
may also be that the overall performance of the firm will increase due to the benefits of the S&OP
process and hence that is a good indication for integrating the R2 products into the S&OP but the
integration must be evaluated in order to prove or disprove the statements by Oliva and Watson
(2011). By integrating the R2 products the focus may shift and it may be possible to really show that
R2 is a product segment as worthy as any other by having it in the same process which else may be a
problem according to Blackburn et al. (2004).
During the interviews a question was posed about how much they thought they knew about the R2
products and the concept on a scale from 1 to 10 where 1 was ‘I know nothing’ and 10 was ‘I know
very much. The results from the question is seen in Table 7.
Table 7: Awareness of R2
Part of organization Average knowledge
about R2 products
and concept
Standard deviation of
knowledge about R2
Number of interviews
Demand side 7,0 1,3 13
Supply side 6,2 2,1 6
Other 6,9 2,2 4
Total 6,8 1,7 23
Interesting is that the average knowledge seem to be quite high and that would contrast to the analysis
about managers being afraid of the consequences since they are aware of the concept and how it
works. Worth noticing is that in the question regarding awareness of R2, the interviewees from the R2
team were not given the questions trying to avoid misleading the results. Beside that the categories are
comprised by the same interviewees as in Table 6.
In summary the demand forecast horizon and the potential low value of integration remains uncertain
and is therefore seen as S&OP executive complexities that have to be dealt with in order to understand
the impact of the organization. There is some support in the literature but there are however still areas
to investigate further, such as what the perception really is of remanufactured products in relation to
new products. The S&OP executive complexities are summarized and visualized in Figure 12 below.
Figure 12: S&OP executive complexities
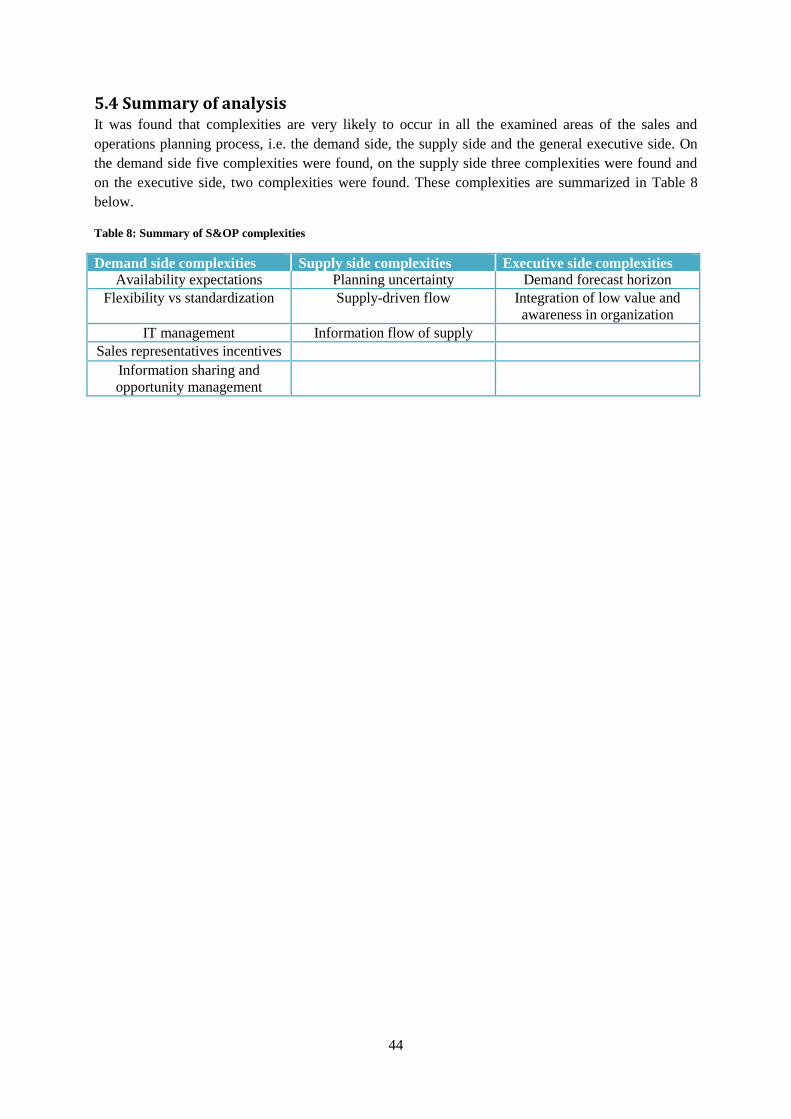
44
5.4 Summary of analysis It was found that complexities are very likely to occur in all the examined areas of the sales and
operations planning process, i.e. the demand side, the supply side and the general executive side. On
the demand side five complexities were found, on the supply side three complexities were found and
on the executive side, two complexities were found. These complexities are summarized in Table 8
below.
Table 8: Summary of S&OP complexities
Demand side complexities Supply side complexities Executive side complexities
Availability expectations Planning uncertainty Demand forecast horizon
Flexibility vs standardization Supply-driven flow Integration of low value and
awareness in organization
IT management Information flow of supply
Sales representatives incentives
Information sharing and
opportunity management
45
6. Discussion and Conclusions
In the concluding chapter a general discussion is held around the analysis made in the previous
chapter. The research questions are answered and a discussion on limitations and future research are
conducted.
Through the interviews, many complexities did arise in all parts of the S&OP process. What is
interesting though is that very many of the complexities could be placed on the demand side. This is
believed to be because the demand side is closest to the marketplace and hence have the responsibility
to collect information to the focal company which is then needed to be aggregated from many different
sources, whether it be demand or supply information.
All complexities did not fit with the theoretical framework in the second chapter. This is seen as very
natural since the S&OP process is a complex process and many factors do affect the performance of
the process. Tuomikangas and Kaipia (2014) suggest a framework containing six different areas where
the S&OP process as such is one of them. From their framework it can be found that complexities
such as the S&OP executive complexities belong to the strategic alignment. The IT related
complexities can be placed under the S&OP IT and tools part of their framework and is believed to be
a key piece of the puzzle since the massive amount of information in the S&OP process must be
handled and hence systems are needed to be able to utilize and visualize the data fully. Whether the IT
system should be sophisticated or simple was disputed in the literature (Sheldon, 2006; Thomé, et al.,
2012). The complexity of believed low value of integration could be seen to belong under the S&OP
culture and leadership part of their framework.
The change of mind set, to go from a demand driven mind set to a supply driven mind set seem to be
crucial and this confirms much of the literature written about remanufacturing stating that the issue
with remanufactured products is the lack of information about supply, which spread ripples in the
organization to the commercial organization (Thierry, et al., 1995; Guide Jr., et al., 2000).
The complexities identified in this study are placed under one of three areas of the process. It remains
to be seen however, whether or not the complexities will only impact the part of the organization in
which they are placed in this study. It is believed that for example the complexity of flexibility versus
standardization may have an overall impact in the organization but, the biggest impact will most likely
be in the first steps of the process.
From a practitioner’s perspective it is apparent from the study that there seem to be difficulties when
new products are integrated into an S&OP process, which as far as the researchers are concerned no
one has showed before. By the interviews and meetings held with people in the focal company it is
understood that for some of the complexities identified there are already solutions in place, such as for
planning uncertainty. This however implies that the interviewees may not have the overall view of the
activities taking place in the process. For research on the other hand it can be seen as good that the
interviewees were interviewed with an open mind and could help the academic field to highlight
complexities which may not otherwise have been apparent if the interviewees were completely
involved in all steps of the process.
It is believed to be both benefits and drawbacks of integration. On the positive it is believed to
facilitate the overall communication and awareness of R2 and it might become easier to plan material
sourcing and production. All products will be on the same level of priority (MS B, 2014) and hence
this is believed to lead to a better awareness of R2. There will also be a better structure around supply
and demand forecasting for the sales representatives and especially if the R2 segment will grow. On
46
the negative, the R2 products do have special characteristics and low volume which could be seen as
difficult to handle in a monthly process due to the fact that the data might become obsolete before it is
used in the process and hence requires a more flexible, rapid process. By the integration, an extra layer
of communication will be added which may increase the difficulties in communication and the
interpretation of data may become distorted. To give the best effect for a relatively small product
segment such as R2, there will be a need to clarify and focus on the reverse flow and forward flow of
information simultaneously (Kocabasoglu, et al., 2007) and the best way to move forward may be not
to utilize the S&OP process fully but to find the elements of the process which contributes in a
positive manner.
6.1 Conceptual contribution
The purpose of this research was to investigate what complexities that will arise when remanufactured
products are integrated into a sales and operations planning process. The main research question that
was posed was:
What complexities arise when remanufactured products are added to a sales and operations
planning process for high-value, low volume, B2B products?
To answer this research question three sub questions were answered.
RQ 1: What demand side complexities arise when remanufactured products are added to an S&OP
process?
The study indicated that that there are additional complexities identified when remanufactured
products are integrated in an S&OP process. In this case five complexities were identified on the
demand side of the S&OP process and can be summarized under the areas of supply chain
commitment to commercial team, process standardization, IT management and information sharing
and incentive management.
Under supply chain commitment it was found that there is a need for the commercial team, and
especially the sales representatives to know what expectations they can have from remanufactured
product in terms of availability compared to new products. Process standardization was found to be
crucial for products with special characteristics to consider if it is appropriate to work with them in the
same way as with new products. Under information IT management and information sharing this
research indicated that IT plays a crucial role in the S&OP process and for products with special
characteristics the IT management will require special attention. So will the need for additional
information sharing within the process. Finally, the research indicated that it is unclear whether or not
there is a need for incentives to sales representatives for working outside their ordinary process with
new products and was hence seen as a complexity.
RQ 2: What supply side complexities arise when remanufactured products are added to an S&OP
process?
This research found indications that there are complexities also on the supply side of the S&OP
process. These complexities could be categorized under production planning, change of mind set and
information structure.
The research found that one area related to production planning could be affected by an integration of
remanufactured products. This was the overall planning uncertainty. In the change of mind set the
research indicate that there is a need to be aware of the difference between working with a forward

47
flow of goods and a reversed flow of goods and what the controlling factor is. This did not seem to be
obvious in the interviews and was hence added as a complexity. The last category, data structure
indicated that the information flow of supply may be a challenge and deserves attention when
integrated in the S&OP process.
RQ 3: What S&OP executive complexities arise when remanufactured products are added to an
S&OP process?
It was found that not just demand and supply side would be affected by an integration of
remanufactured product, but there would also be general, called executive complexities which could
not be placed under any of the first two. Two complexities were found and could be considered to
belong to a category of strategic decisions. The demand forecast horizon was identified to be different
for new products and remanufactured products and indicates that there is a need to consider how this
difference plays out and whether it is reasonable or not to have remanufactured products in the S&OP
process. The second complexity related to the actual value of integration and could be seen to be
among the first decisions to make before moving further with integration.
6.2 Summary of findings
To conclude, complexities were identified in all parts of the S&OP process and hence indicate the
need to examine the entire S&OP process before remanufactured products are integrated into an
S&OP process. New knowledge have been contributed through this study in the interface between
remanufacturing and sales and operations planning in terms of highlighting complexities believed to
be relevant, not just in the focal company but to many more companies, especially considering the
potential to reduce environmental impact (Kocabasoglu, et al., 2007) using reversed supply chains.
The findings of this study are summarized and visualized in Figure 13 below and can work as a future
framework for further studies.
6.3 Empirical contribution
From an empirical stand point this research has contributed to areas of interest when this issue arises
in companies of integrating remanufactured products. This issue can be investigated both pre- and
post-implementation and could thus be used a pro-active framework when considering an integration
as well as a framework for evaluating an already existing S&OP process where remanufactured
products are included. The complexities themselves can act as a checklist in risk assessment and can
be advantageously extended if more complexities arise.
Figure 13: Summary of conceptual framework
48
6.4 Limitations and Future research
Due to the limited time for this project and the special access granted, it was believed to be better to
focus on conducting several interviews in the focal company instead of making a multiple case study.
This however, may of course affect the generalizability of the results and hence it is suggested that
more studies are conducted in different companies and industries where the results from this study
may work as part of a theoretical framework. The time limited the amount of interviews that could be
conducted and hence it was selected to not interview any sales representatives. Looking back, it is
believed to be preferred to interview sales representatives as well considering the results from this
study and it is thus recommended for future studies to include them as well if not to make a separate
study with including only sales representatives.
Based on the fact that the focal company had a relatively new S&OP process, it might have affected
the interviewees ability to understand the process fully and thus reducing the insight they were able to
give. Therefore it is suggested to conduct a study at a later stage, preferably when the remanufactured
products are integrated and evaluate the process. The same procedure could very likely be used in any
company evaluating against the suggested framework from this study.
To understand the entire process, interviews were conducted in each step of the process. This may on
the other hand lead to a lack of depth in each of the steps. This was however prioritized considering
the nature of the topic, i.e. that the interface was previously not examined and affected the entire
S&OP process. Therefore it is suggested to make focused studies, maybe with the use of focus groups
where a discussion can be held on additional impact that may come from integration.
The focus of this study was on the steps of the process and hence had a more operational approach
rather than a strategic approach. It would be interesting to investigate how the integration would affect
on a strategic level and understand the issue from a holistic perspective.
The interface between remanufacturing and sales and operations planning has been paid very little, if
any attention in previous literature and therefore there was no specific literature to rely on in the topic.
This may have caused the work to be conducted on a high level. Therefore as a concluding remark it is
believed that this area needs further attention and hence future studies are believed to be needed,
particularly case studies to understand potential differences in empirical contexts.
49
References American Production and Inventory Control Society (APICS), 2013. APICS Dictionary. [Online]
Available at: http://www.apics.org/dictionary/dictionary-information?ID=3771
[Accessed 24 September 2014].
BL A, 2014. Business Leader, Product group A [Interview] (5 11 2014).
Blackburn, J. D., Guide Jr., V. D. R., Souza, G. C. & Van Wassenhove, L. N., 2004. Reverse Supply
Chains for Commercial Returns. California Management Review, 46(2), pp. 6-22.
Bower, P., 2005. 12 most common threats to sales and operations planning process. Journal of
Business Forecasting, 24(3), pp. 4-14.
Brennan, L., Gupta, S. M. & Taleb, K. N., 1994. Operations Planning Issues and an
Assembly/Disassembly Environment. International Journal of Operations and
Production Management, 14(9), pp. 57-67.
CFL, 2014. Commercial Finance Leader [Interview] (21 10 2014).
Chen-Ritzo, C.-H., Ervolina, T., Harrison, T. P. & Gupta, B., 2010. Sales and operations planning in
systems with order configuration uncertainty. European Journal of Operations
Management, 205(3), pp. 604-614.
Collis, J. & Hussey, R., 2009. Business Research: A Practical Guide For Undergraduate &
Postgraduate Students. 3:e ed. London, England: Macmilan Publishers Limited.
Cook, T. & Campbell, D., 1979. Quasi-Experimental Design: Design and Analysis Issues for Field
Settings. Skokie, IL, US (In: Gibbert et al., 2008. Research Notes And Commentaries:
What Passes As A Rigorous Case Study?, Strategic Management Journal, 29(13), pp.
1465-1474): Rand McNally.
Croxton, K. L., Lambert, D. M. & García-Dastugue, S. J., 2002. The Demand Management Process.
The International Journal of Logistics Management, 13(2), pp. 51-66.
Eisenhardt, K. M., 1989. Building Theories from Case Study Research. Academy of Management
Review, 14(4), pp. 532-550.
Feng, Y., D'Amours, S. & Beauregard, R., 2008. The value of sales and operations planning in
oriented strandboard industry with make-to-order manufacturing system: Cross
functional integration under deterministic demand and spot market recourse.
International Journal of Production Economics, 115(1), pp. 189-209.
Focal Company, 2014a. The Focal Company - The S&OP process. s.l.:The Focal company.
Focal Company, 2014b. Employee profile. [Online]
[Accessed 20 11 2014].
Gibbert, M., Ruigrok, W. & Wicki, B., 2008. Research Notes and Commentaries - What Passes as a
Rigorous Case Study?. Strategic Management Journal, 29(13), pp. 1465-1474.
Giuntini, R. & Gaudette, K., 2003. Remanufacturing: The next great opportunity for boosting US
productivity. Business Horizons, 46(6), pp. 41-48.
50
GM Logistics and Fulfillment, 2014. General Manager Logistics and Fulfillment [Interview] (18 11
2014).
GM Sales, 2014. General Manager Sales, Product group B [Interview] (3 11 2014).
Grimson, J. A. & Pyke, D. F., 2007. Sales and operations planning: an exploratory study and
framework. The International Journal of Logistics Management, 18(3), pp. 322-346.
Guide Jr., V. D. .. & Jayaraman, V., 2000. Product Acquisition Management: current industry practice
and a proposed framework. International Journal of Production Research, 38(16), pp.
3779-3800.
Guide Jr., V. D. R., 2000. Production planning and control for remanufacturing: industry practice and
research needs. Journal of Operations Management, 18(4), pp. 467-483.
Guide Jr., V. D. R., Jayaraman, V. & Linton, J. D., 2003. Building contingency planning for closed-
loop supply chains product recovery. Journal of Operations Management, 21(3), pp.
259-279.
Guide Jr., V. D. R., Jayaraman, V., Srivastava, R. & Benton, W. C., 2000. Supply-Chain Management
for Recoverable Manufacturing Systems. Interfaces, 30(3), pp. 125-142.
Guide Jr., V. D. R. & Srivastava, R., 1998. Inventory buffers in recoverable manufacturing. Journal of
Operations Management, 16(5), pp. 551-568.
Guide Jr., V. D. R., Srivastava, R. & Kraus, M. E., 1997. Product structure complexity and scheduling
of operations in recoverable manufacturing. International Journal of Production
Research, 35(11), pp. 3179-3199.
Guide Jr., V. D. R. & Van Wassenhove, L., 2001. Managing Product Returns for Remanufacturing.
Production and Operations Management, 10(2), pp. 142-155.
Guide Jr., V. D. R. & Van Wassenhove, L. N., 2006. Closed-Loop Supply Chains: An Introduction to
the Feature Issue (Part 1). Production and Operations Management, 15(3), pp. 345-450.
Guide Jr., V. R., Jayaraman, V. & Srivastava, R., 1999. Production planning and control for
remanufacturing: a state-of-the-art survey. Robotics and Computer-Integrated
Manufacturing, 15(3), pp. 221-230.
Gungor, A. & Gupta, S. M., 1999. Issues in environmentall conscious manufacturing and product
recovery: a survey. Computers & Industrial Engineering, 36(4), pp. 811-853.
Ivert, L. K. & Jonsson, P., 2010. The potential benefits of advanced planning and scheduling systems
in sales and operations planning. Industrial Management and Data systems, 110(5), pp.
659-681.
Jayaraman, V., Guide JR, V. & Srivastava, R., 1999. A closed-loop logistics model for
remanufacturing. The Journal Of the Operational Research Society, 50(5), pp. 497-508.
Kathuria, R., Joshi, M. P. & Porth, S. J., 2007. Organizational alignment and performance: past,
present an future. Management Decision, 45(3), pp. 503-517.
51
Kocabasoglu, C., Prahinksi, C. & Klassen, R. D., 2007. Linking forward and reverse supply chain
investments: The role of business uncertainty. Journal of Operations Management,
25(6), pp. 1141-1160.
Kruse, G., 2003. New wine in old bottles. IEE Manufacturing Engineer, 83(3), pp. 48 (In: Grimson,
Andrew J. & Pyke, David S.; 2007; Sales and operations planning: an exploratory study
and framework; The International Journal of Logistics Management; 18(3); pp. 322-
346).
Lapide, L., 2002. New Developments in Business Forecasting. The Journal of Business Forecasting,
21(2), pp. 11-14.
Lapide, L., 2003. Make the baseline forecast your trusted advisor. The Journal of Business
Forecasting, 22(4), pp. 21-22.
Lapide, L., 2005. Sales and Operations Planning Part III: A diagnostic model. The Journal of Business
Forecasting, 24(1), pp. 13-16.
Lapide, L., 2007. Sales and Operations Planning (S&OP) Mindsets. The Journal of Business
Forecasting, 26(1), pp. 21-31.
Linderman, K. & Chandrasekaran, A., 2010. The scholarly exchange of knowledge in Operations
Management. Journal of Operations Management, 28(4), pp. 357-366.
Lund, R. T., 1998. Remanufacturing: an American resource. Proceedings of the Fifth International
Congress Environmentally Conscious Design and Manufacturing. Rochester, NY,
USA, Rochester Institute of Technology (In: Guide Jr., V. R., 2000. Production
planning and control for remanufacturing: industry practice and research needs. Journal
of Operations Management, 18(4), pp. 467-483).
Milliken, A. L., 2008. Sales and Operations Planning: Building the Foundation. The Journal of
Business Forecasting, 27(3), pp. 4-12.
ML A, 2014. Modality Leader, Product group A [Interview] (22 10 2014).
ML B, 2014. Modality Leader, Product group B [Interview] (16 10 2014).
MLM, 2014. Material and Logistics Manager [Interview] (23 10 2014).
Mollenkopf, D. A., Frankel, R. & Ivan, R., 2011. Creating value through returns management:
Exploring the mareketing-operations interface. Journal of Operations Management,
29(5), pp. 391-403.
Morse, J. M., 1994. Emerging from the data: The cognitive processes of analysis in qualitative inquiry.
In: Critical Issues in Qualitative Research. Thousand Oaks, CA, US (In: Collis and
Hussey; Business Research: A practical guide for undergraduate and postgraduate
students (3rd ed); Macmillan Pub; UK) : Sage, pp. 23-43.
MS A, 2014. Master Scheduler/Inventory Leader - Product group A [Interview] (22 10 2014).
MS B, 2014. Master Scheduler/Inventory leader - Product group B [Interview] (22 10 2014).
52
Muckstadt, J. & Isaac, M., 1981. An analysis of single-item inventory systems with returns. Naval
Research Logistics Quarterly, 28(2), pp. 237-254 (In: Guide Jr, V.D.R et al.; 2000;
Supply-Chain Management for Recoverable Manufacturing Systems; Interfaces; 30(3);
pp. 125-142)..
Nakano, M., 2009. Collaborative forecasting and planning in supply chains. International Journal of
Physical Distribution, 39(2), pp. 84-105.
NASR, N. H. C., VAREL, E. & BAUER, R., 1998. State-of-the-Art Assessment of Remanufacturing
Technology. Rochester, New York, US: Rochester Institute of Technology, National
Center for Remanufacturing, NY (In: Guide Jr., V..R et al.; 2001; Managing Product
Returns For Remanufacturing; Production and Operations Management; 10(2); pp.142-
154).
OFL, 2014. Order Fulfillment Leader [Interview] (17 10 2014).
Olhager, J. & Rudberg, M., 2002. Linking manufacturing strategy decisions on process choice with
manufacturing planning and control systems. International Journal of Production
Research, 40(10), pp. 2335-2351.
Olhager, J., Rudberg, M. & Wikner, J., 2001. Long-term capacity management: Linking perspectives
from manufacturing strategy and sales and operations planning. International Journal
of Production Economics, 69(2), pp. 215-225.
Olhager, J. & Selldin, E., 2007. Manufacturing planning and control approaches: market alignment
and performance. International Journal of Production Research, 45(6), pp. 1469-1484.
Oliva, R. & Watson, N., 2011. Cross-functional alignment in supply chain planning: A case study of
sales and operations planning. Journal of Operations Management, 29(5), pp. 434-448.
Oracle, 2014. Oracle Value Chain Planning - Demantra Real-Time Sales and Operations Planning.
[Online]
Available at: http://www.oracle.com/us/products/applications/056845.pdf
[Accessed 20 11 2014].
OSS, 2014. Operation Systems Specialist [Interview] (17 10 2014).
Petersen, K. J., Handfield, R. B. & Ragatz, G. L., 2005. Supplier integration into new product
development: coordinating product, process and supply chain design. Journal of
Operations Management, 23(3), pp. 371-388.
PM A, 2014. Product Manager - Product group A [Interview] (20 10 2014).
PM B, 2014. Product Manager, Product group B [Interview] (24 10 2014).
PM Remanufacturing, 2014. Product Manager Remanufacturing [Interview] (5 11 2014).
PPL A, 2014. Product Planning Leader, Product group A [Interview] (22 10 2014).
PPL B, 2014. Product Planning Leader - Product group B [Interview] (5 11 2014).
PPM, 2014. Product Planning Manager [Interview] (28 10 2014).
53
PrPM, 2014. Production Preparation Manager [Interview] (23 10 2014).
R2GCMM, 2014. R2 Global Commercial and Marketing Manager [Interview] (14 11 2014).
R2SM, 2014. R2 Service Manager [Interview] (23 10 2014).
RDP EMEA, 2014. Regional Demand Planner - EMEA [Interview] (17 10 2014).
RDP USCAN, 2014. Regional Demand Planner - USCAN region [Interview] (13 10 2014).
Rogelio, O. & Watson, N., 2011. Cross-functional alignment in supply chain planning: A case study of
sales and operations planning. Journal of Operations Management, 29(5), pp. 434-448.
Rogers, D. S., Lambert, D. M., Croxton, K. L. & Garcia-Dastugue, S. J., 2002. The Returns
Management Process. The International Journal of Logistics Management, 14(2), pp. 1-
18.
Rooney, C. & Bangert, C., 2001. High-level management control of the planning process. Adhesives
Age, 44(10), pp. 49 (In: Grimson, Andrew J. & Pyke, David S.; 2007; Sales and
operations planning: an exploratory study and framework; The International Journal of
Logistics Management; 18(3); pp. 322-346).
Saunders, M., Lewis, P. & Thornhill, A., 2009. Reserach Methods for Business Students. 5th ed.
Ediburgh Gate, Harlow, Essex, England: Pearson Education Limited.
Sheldon, D., 2006. World Class Sales & Operations Planning: A Guide to Successful. 1st ed. Ft
Lauderdale, FL, US: J. Ross Publishing.
SM, 2014. Service Manager [Interview] (23 10 2014).
SM, 2014. Site Manager, Product group A and B [Interview] (23 10 2014).
SOM B, 2014. Sales Operations Manager USCAN, Product group B [Interview] (24 10 2014).
Stuart, I. et al., 2002. Effective research in operations management: a process perspective. Journal of
Operations Management, 20(5), pp. 419-433.
Thierry, M., Salomon, M., Van Nunen, J. & Van Wassenhove, L., 1995. Strategic Issues in Product
Recovery Management. California Management Review, 37(2), pp. 114-135.
Thomé, A. M. T., Scavarda, L. F. & Fernandez, N. S., 2012. Sales and operations planning: A research
synthesis. International Journal of Production Economics, 138(1), pp. 1-13.
Thomé, A. M. T., Sousa, R. S. & Scavarda do Carmo, L. F. R. R., 2014. The impact of sales and
operations planning practices on manufacturing operational performance. International
Journal of Production Research, 52(7), pp. 2108-2121.
Tuomikangas, N. & Kaipia, R., 2014. A coordination framework for sales and operations planning
(S&OP): Synthesis from the literature. International Journal of Production Economics,
Volume 154, pp. 243-262.
54
Wahlers, J. L. & Cox, J. F., 1994. Competitive factors and performance measurement: Applying the
theory of constraints to meet customer needs. International Journal of Production
Economics, 37(2-3), pp. 229-240.
Wallace, T. & Stahl, B., 2008. The Demand Planning Process in Executive S&OP. Journal of Business
Forecasting, 27(3), pp. 19-24.
Van Hillegersberg, J., Zuidwijk, R., Van Nunen, J. & Van Eijk, D., 2001. Supporting Return Flows in
the Supply Chain (Indusry Trend or Event). Communications of the ACM, June, 44(6),
pp. 74-79.
Webster, S. & Mitra, S., 2007. Competitive strategy in remanufacturing and the impact of take-back
laws. Journal of Operations Management, 25(6), pp. 1123-1140.
Wing, L. a. P. G., 2001. Toward twenty-first-century pharmaceutical sales and operations.
Pharmaceutical Technology North America, 25(11), pp. 20-6 (In: Grimson, Andrew J.
& Pyke, David S.; 2007; Sales and operations planning: an exploratory study and
framework; The International Journal of Logistics Management; 18(3); pp. 322-346).
Vollman, T. E. & et al, 2005. Chapter 3: Sales and Operations Planning. In: Manufacturing Planning
and Control Systems for Supply Chain Management. s.l.:McGraw-Hill.
Voss, C., Tsikriktsis, N. & Frohlich, M., 2002. Case Research in Operations Management.
International Journal of Operations and Production Management, 22(2), pp. 195-219.
Yin, R. K., 2009. Case Study Research - Design and Methods. 4th ed. Thousand Oaks, California,
U.S.: Sage Inc..
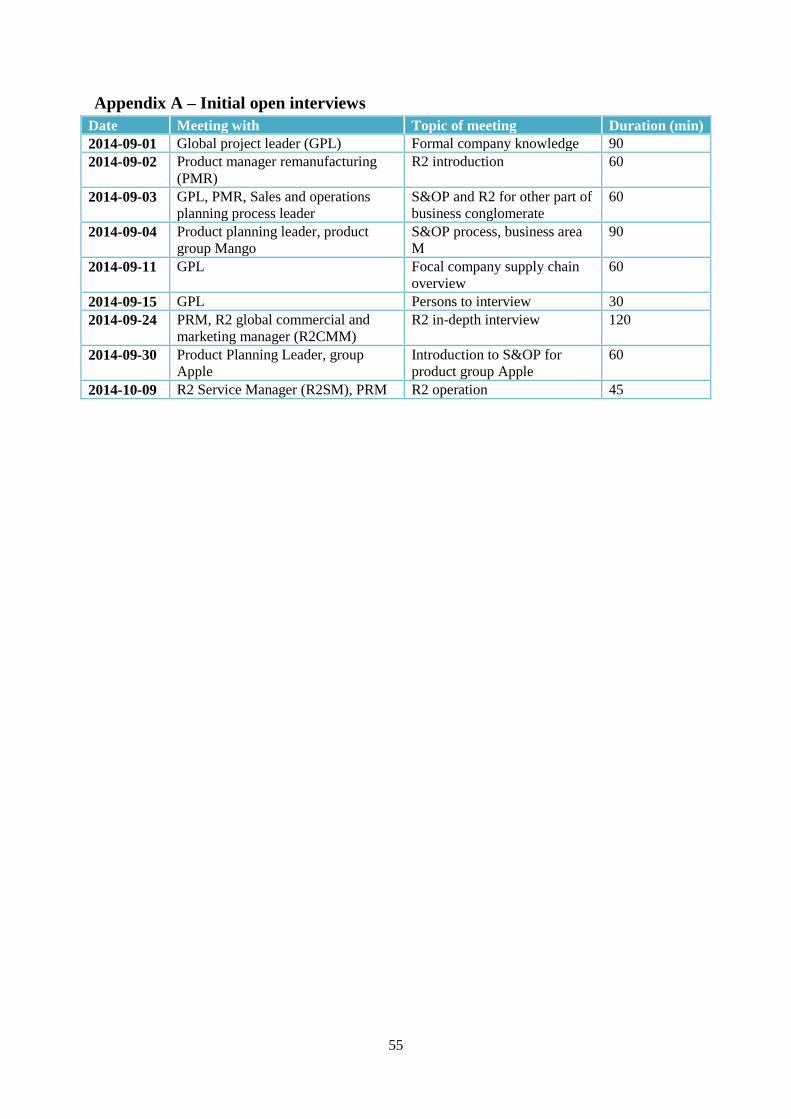
55
Appendix A – Initial open interviews
Date Meeting with Topic of meeting Duration (min)
2014-09-01 Global project leader (GPL) Formal company knowledge 90
2014-09-02 Product manager remanufacturing
(PMR)
R2 introduction 60
2014-09-03 GPL, PMR, Sales and operations
planning process leader
S&OP and R2 for other part of
business conglomerate
60
2014-09-04 Product planning leader, product
group Mango
S&OP process, business area
M
90
2014-09-11 GPL Focal company supply chain
overview
60
2014-09-15 GPL Persons to interview 30
2014-09-24 PRM, R2 global commercial and
marketing manager (R2CMM)
R2 in-depth interview 120
2014-09-30 Product Planning Leader, group
Apple
Introduction to S&OP for
product group Apple
60
2014-10-09 R2 Service Manager (R2SM), PRM R2 operation 45
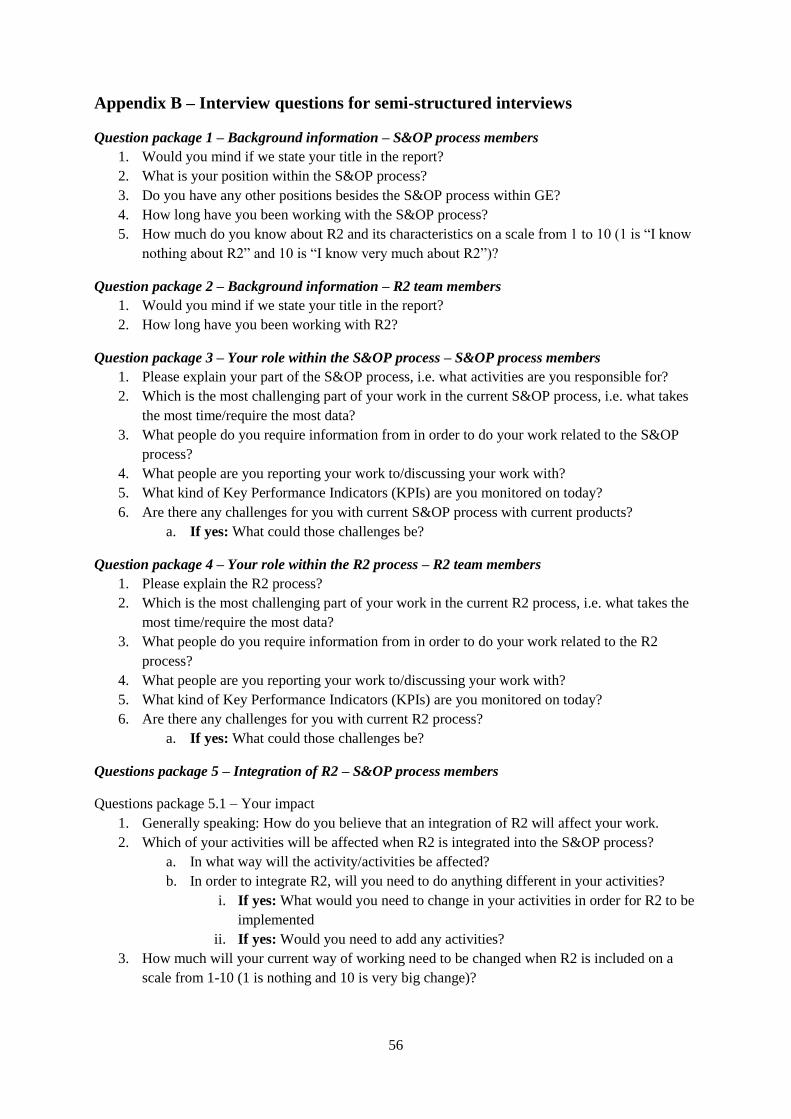
56
Appendix B – Interview questions for semi-structured interviews
Question package 1 – Background information – S&OP process members
1. Would you mind if we state your title in the report?
2. What is your position within the S&OP process?
3. Do you have any other positions besides the S&OP process within GE?
4. How long have you been working with the S&OP process?
5. How much do you know about R2 and its characteristics on a scale from 1 to 10 (1 is “I know
nothing about R2” and 10 is “I know very much about R2”)?
Question package 2 – Background information – R2 team members
1. Would you mind if we state your title in the report?
2. How long have you been working with R2?
Question package 3 – Your role within the S&OP process – S&OP process members
1. Please explain your part of the S&OP process, i.e. what activities are you responsible for?
2. Which is the most challenging part of your work in the current S&OP process, i.e. what takes
the most time/require the most data?
3. What people do you require information from in order to do your work related to the S&OP
process?
4. What people are you reporting your work to/discussing your work with?
5. What kind of Key Performance Indicators (KPIs) are you monitored on today?
6. Are there any challenges for you with current S&OP process with current products?
a. If yes: What could those challenges be?
Question package 4 – Your role within the R2 process – R2 team members
1. Please explain the R2 process?
2. Which is the most challenging part of your work in the current R2 process, i.e. what takes the
most time/require the most data?
3. What people do you require information from in order to do your work related to the R2
process?
4. What people are you reporting your work to/discussing your work with?
5. What kind of Key Performance Indicators (KPIs) are you monitored on today?
6. Are there any challenges for you with current R2 process?
a. If yes: What could those challenges be?
Questions package 5 – Integration of R2 – S&OP process members
Questions package 5.1 – Your impact
1. Generally speaking: How do you believe that an integration of R2 will affect your work.
2. Which of your activities will be affected when R2 is integrated into the S&OP process?
a. In what way will the activity/activities be affected?
b. In order to integrate R2, will you need to do anything different in your activities?
i. If yes: What would you need to change in your activities in order for R2 to be
implemented
ii. If yes: Would you need to add any activities?
3. How much will your current way of working need to be changed when R2 is included on a
scale from 1-10 (1 is nothing and 10 is very big change)?
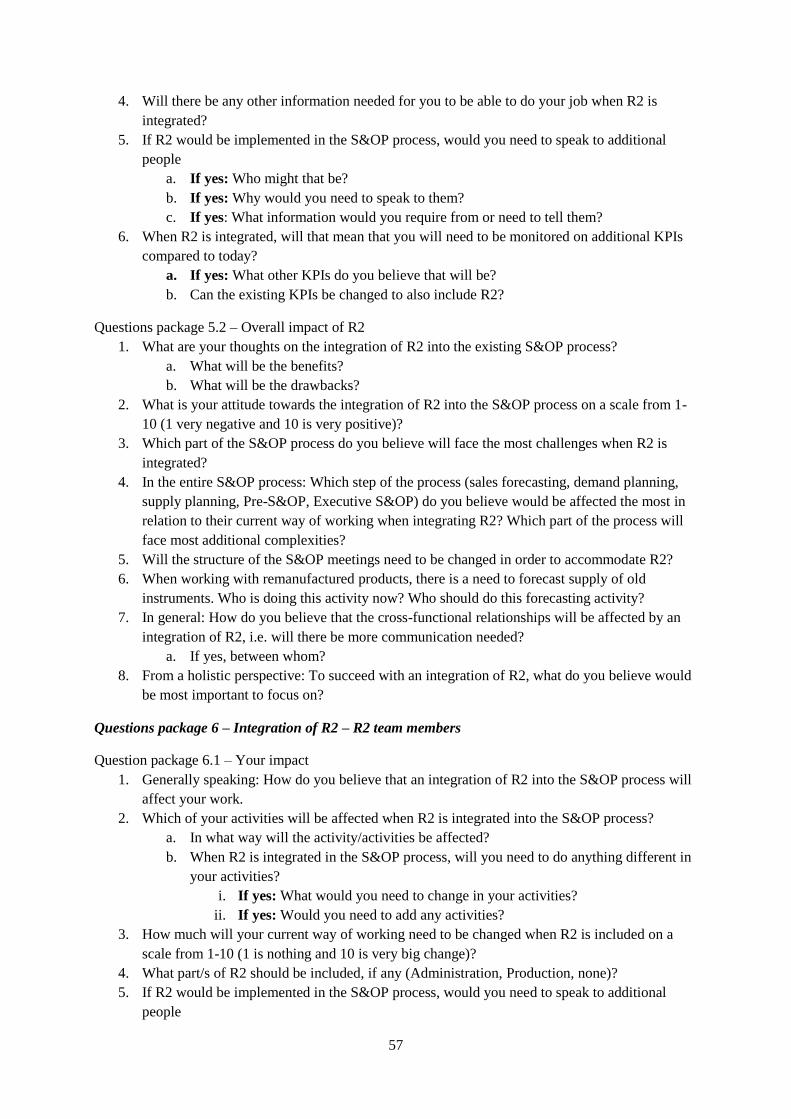
57
4. Will there be any other information needed for you to be able to do your job when R2 is
integrated?
5. If R2 would be implemented in the S&OP process, would you need to speak to additional
people
a. If yes: Who might that be?
b. If yes: Why would you need to speak to them?
c. If yes: What information would you require from or need to tell them?
6. When R2 is integrated, will that mean that you will need to be monitored on additional KPIs
compared to today?
a. If yes: What other KPIs do you believe that will be?
b. Can the existing KPIs be changed to also include R2?
Questions package 5.2 – Overall impact of R2
1. What are your thoughts on the integration of R2 into the existing S&OP process?
a. What will be the benefits?
b. What will be the drawbacks?
2. What is your attitude towards the integration of R2 into the S&OP process on a scale from 1-
10 (1 very negative and 10 is very positive)?
3. Which part of the S&OP process do you believe will face the most challenges when R2 is
integrated?
4. In the entire S&OP process: Which step of the process (sales forecasting, demand planning,
supply planning, Pre-S&OP, Executive S&OP) do you believe would be affected the most in
relation to their current way of working when integrating R2? Which part of the process will
face most additional complexities?
5. Will the structure of the S&OP meetings need to be changed in order to accommodate R2?
6. When working with remanufactured products, there is a need to forecast supply of old
instruments. Who is doing this activity now? Who should do this forecasting activity?
7. In general: How do you believe that the cross-functional relationships will be affected by an
integration of R2, i.e. will there be more communication needed?
a. If yes, between whom?
8. From a holistic perspective: To succeed with an integration of R2, what do you believe would
be most important to focus on?
Questions package 6 – Integration of R2 – R2 team members
Question package 6.1 – Your impact
1. Generally speaking: How do you believe that an integration of R2 into the S&OP process will
affect your work.
2. Which of your activities will be affected when R2 is integrated into the S&OP process?
a. In what way will the activity/activities be affected?
b. When R2 is integrated in the S&OP process, will you need to do anything different in
your activities?
i. If yes: What would you need to change in your activities?
ii. If yes: Would you need to add any activities?
3. How much will your current way of working need to be changed when R2 is included on a
scale from 1-10 (1 is nothing and 10 is very big change)?
4. What part/s of R2 should be included, if any (Administration, Production, none)?
5. If R2 would be implemented in the S&OP process, would you need to speak to additional
people
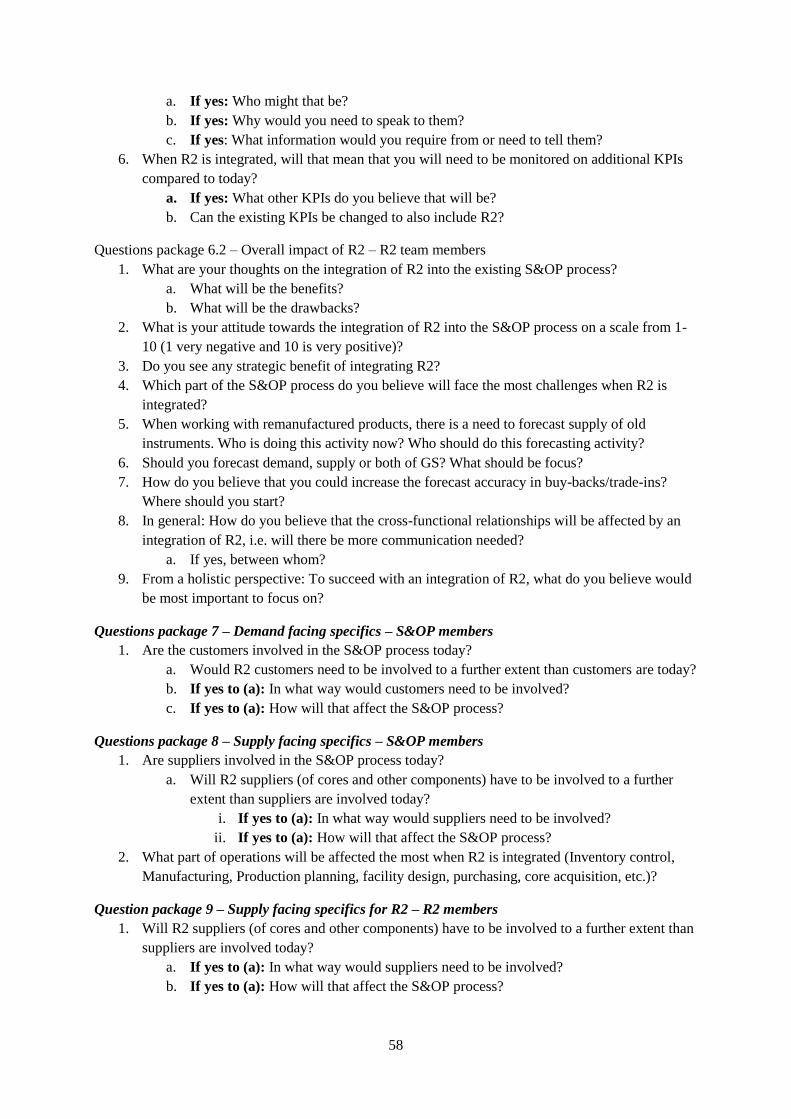
58
a. If yes: Who might that be?
b. If yes: Why would you need to speak to them?
c. If yes: What information would you require from or need to tell them?
6. When R2 is integrated, will that mean that you will need to be monitored on additional KPIs
compared to today?
a. If yes: What other KPIs do you believe that will be?
b. Can the existing KPIs be changed to also include R2?
Questions package 6.2 – Overall impact of R2 – R2 team members
1. What are your thoughts on the integration of R2 into the existing S&OP process?
a. What will be the benefits?
b. What will be the drawbacks?
2. What is your attitude towards the integration of R2 into the S&OP process on a scale from 1-
10 (1 very negative and 10 is very positive)?
3. Do you see any strategic benefit of integrating R2?
4. Which part of the S&OP process do you believe will face the most challenges when R2 is
integrated?
5. When working with remanufactured products, there is a need to forecast supply of old
instruments. Who is doing this activity now? Who should do this forecasting activity?
6. Should you forecast demand, supply or both of GS? What should be focus?
7. How do you believe that you could increase the forecast accuracy in buy-backs/trade-ins?
Where should you start?
8. In general: How do you believe that the cross-functional relationships will be affected by an
integration of R2, i.e. will there be more communication needed?
a. If yes, between whom?
9. From a holistic perspective: To succeed with an integration of R2, what do you believe would
be most important to focus on?
Questions package 7 – Demand facing specifics – S&OP members
1. Are the customers involved in the S&OP process today?
a. Would R2 customers need to be involved to a further extent than customers are today?
b. If yes to (a): In what way would customers need to be involved?
c. If yes to (a): How will that affect the S&OP process?
Questions package 8 – Supply facing specifics – S&OP members
1. Are suppliers involved in the S&OP process today?
a. Will R2 suppliers (of cores and other components) have to be involved to a further
extent than suppliers are involved today?
i. If yes to (a): In what way would suppliers need to be involved?
ii. If yes to (a): How will that affect the S&OP process?
2. What part of operations will be affected the most when R2 is integrated (Inventory control,
Manufacturing, Production planning, facility design, purchasing, core acquisition, etc.)?
Question package 9 – Supply facing specifics for R2 – R2 members
1. Will R2 suppliers (of cores and other components) have to be involved to a further extent than
suppliers are involved today?
a. If yes to (a): In what way would suppliers need to be involved?
b. If yes to (a): How will that affect the S&OP process?
59
Question package 10 – Strategy
1. What are the current priorities for the focal company supply chain strategy?
a. How important is R2 in the overall supply chain strategy?
b. What do you see as the purpose of integrating R2 into the S&OP process?
2. Is the integration of R2 part of a long-term strategic agenda?
3. Are you planning on increasing the R2 part of the business?
a. If yes: How do you plan to do that?
4. How good is the knowledge about R2 amongst the staff working in the S&OP process today?
a. Will they need more training on R2?
Question package 11 – Sales
1. What do you see as specific challenges in sales forecasting, i.e. step 1 in the S&OP process
2. How do sales representatives and the commercial organization see R2 in relation to new
instruments?
3. What incentives do you believe that sales representatives need for them to make a good job
with demand and supply information about R2, when R2 is integrated into the S&OP process?
Question package 12 – Other questions or comments
1. Do you have any questions or comments about the questions we’ve have asked you?
2. Do you have any other comments on the project or other?
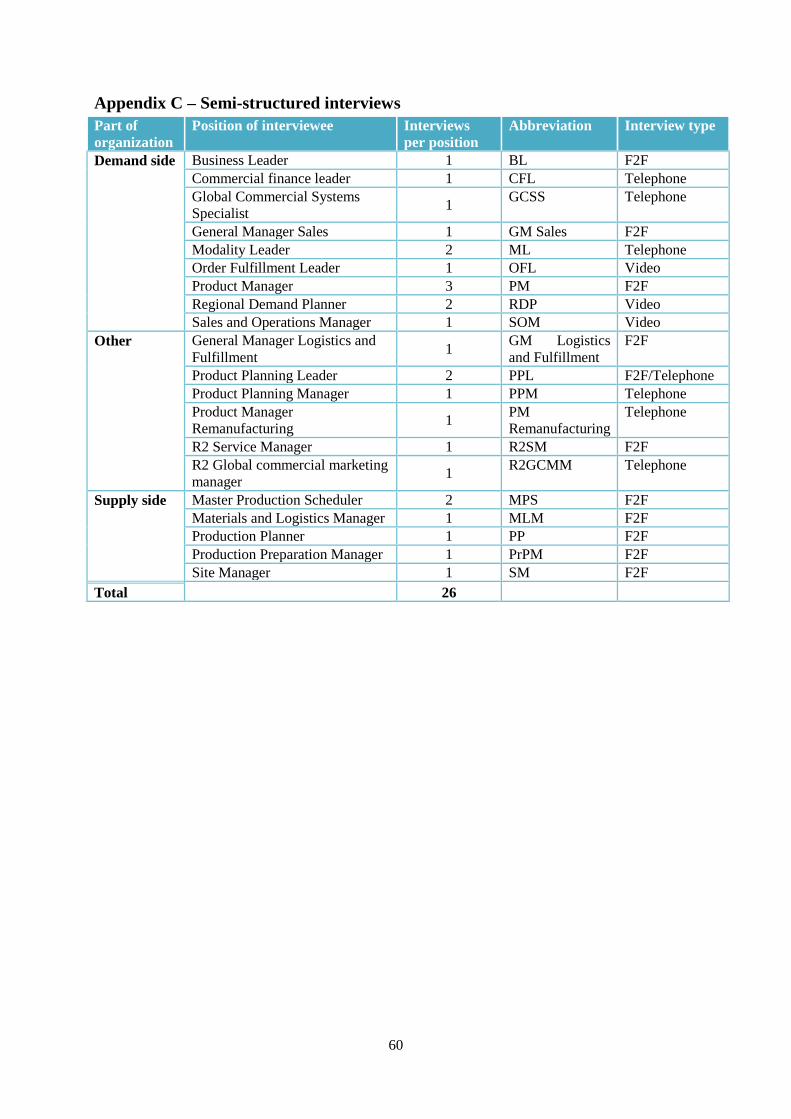
60
Appendix C – Semi-structured interviews
Part of
organization
Position of interviewee Interviews
per position
Abbreviation Interview type
Demand side Business Leader 1 BL F2F
Commercial finance leader 1 CFL Telephone
Global Commercial Systems
Specialist 1
GCSS Telephone
General Manager Sales 1 GM Sales F2F
Modality Leader 2 ML Telephone
Order Fulfillment Leader 1 OFL Video
Product Manager 3 PM F2F
Regional Demand Planner 2 RDP Video
Sales and Operations Manager 1 SOM Video
Other General Manager Logistics and
Fulfillment 1
GM Logistics
and Fulfillment
F2F
Product Planning Leader 2 PPL F2F/Telephone
Product Planning Manager 1 PPM Telephone
Product Manager
Remanufacturing 1
PM
Remanufacturing
Telephone
R2 Service Manager 1 R2SM F2F
R2 Global commercial marketing
manager 1
R2GCMM Telephone
Supply side Master Production Scheduler 2 MPS F2F
Materials and Logistics Manager 1 MLM F2F
Production Planner 1 PP F2F
Production Preparation Manager 1 PrPM F2F
Site Manager 1 SM F2F
Total 26