salmon farm - pinniped interactions in british columbia ... · 1997). the expansion of fish farming...
TRANSCRIPT

Fisheries and OceansScience
Pêches et OcéansSciences
C S A SCanadian Science Advisory Secretariat
S C C SSecrétariat canadien de consultation scientifique
Research Document 2001/142 Document de recherche 2001/142
Not to be cited withoutpermission of the authors *
Ne pas citer sansautorisation des auteurs *
Salmon Farm - Pinniped Interactions in British Columbia:An Analysis of Predator Control,
its Justification and Alternative Approaches
G.S. Jamieson and P.F. Olesiuk
Department of Fisheries and OceansPacific Biological Station
Nanaimo, B.C.V9T 6N7
* This series documents the scientific basis for theevaluation of fisheries resources in Canada. Assuch, it addresses the issues of the day in the timeframes required and the documents it contains arenot intended as definitive statements on thesubjects addressed but rather as progress reportson ongoing investigations.
* La présente série documente les basesscientifiques des évaluations des ressourceshalieutiques du Canada. Elle traite des problèmescourants selon les échéanciers dictés. Lesdocuments qu’elle contient ne doivent pas êtreconsidérés comme des énoncés définitifs sur lessujets traités, mais plutôt comme des rapportsd’étape sur les études en cours.
Research documents are produced in the officiallanguage in which they are provided to theSecretariat.
This document is available on the Internet at:
Les documents de recherche sont publiés dans lalangue officielle utilisée dans le manuscrit envoyé auSecrétariat.
Ce document est disponible sur l’Internet à:http://www.dfo-mpo.gc.ca/csas/
ISSN 1480-4883Ottawa, 2001


2
Abstract
Predator control is widely practised in most forms of agriculture and aquaculture, includingsalmonid fish farming. Canada has a process whereby fish farmers can obtain authorisation to killpredators, particularly pinnipeds (seals and sea lions), but to date, the details of this process, howit is being used by industry, and alternative measures to minimise the need for such killing havenot been scientifically assessed. Here, we describe existing Fisheries and Oceans Canada (DFO)policy and culling permit requirements associated with predator control; the impacts marinemammals are having on cultured fish production; the annual, seasonal and spatial pattern of kills;how this pattern is related to the abundance, distribution of haulouts and seasonal movements ofpinnipeds; and the availability, effectiveness and use of alternate methodologies to deter pinnipedimpacts on fish farms. Establishment of Canada’s Oceans Act in 1997 gave DFO the mandate formarine ecosystem management. With the recent growth in the coastal ecotourism industry andthe economic value and public interest now associated with pinnipeds, there is a current need forthis information. Pinnipeds are near the top of the marine food chain, and although they are notcommercially exploited, their continued presence and occurrence in natural ecosystems atappropriate levels of abundance are important resource management objectives.

3
Résumé
La plupart des activités d’agriculture et d’aquaculture, y compris l’élevage de salmonidés, fontcommunément appel à des mesures de lutte contre les prédateurs. Le Canada a en place unprocessus permettant aux pisciculteurs d’obtenir l’autorisation de tuer les prédateurs, enparticulier les pinnipèdes (phoques et otaries), mais jusqu’à maintenant, les détails de ceprocessus, comment il est utilisé par l’industrie et les mesures de remplacement visant àminimiser le besoin d’abattre les prédateurs n’ont pas été évalués au plan scientifique. Sontdécrits dans le présent document la politique relative à la lutte contre les prédateurs de Pêches etOcéans Canada et les exigences du permis d’abattage sélectif; les incidences des mammifèresmarins sur la production de poisson d’élevage; la répartition annuelle, saisonnière et spatiale desanimaux tués; le lien entre cette répartition et l’abondance, la distribution des aires de terrissageet les déplacements saisonniers des pinnipèdes; et la disponibilité, l’efficacité et l’utilisationd’autres méthodes pour prévenir les incidences des pinnipèdes sur les piscicultures. La Loiconcernant les océans du Canada, adoptée en 1997, a conféré au MPO le mandat de la gestiondes écosystèmes marins. Ce type de renseignements est requis à la lumière de l’essor récent del’industrie de l’écotourisme maritime, ainsi que de la valeur économique des pinnipèdes et del’intérêt que ceux-ci soulèvent chez le public. Les pinnipèdes occupent les échelons supérieurs dela chaîne alimentaire marine et, bien qu’ils ne soient pas chassés commercialement, leur présencedans les écosystèmes naturels à des niveaux d’abondance appropriés est de ce fait un importantobjectif de gestion des ressources.

4
Introduction
Potential predators of aquaculture (finfish and shellfish) crops in British Columbia arepredominantly piscivorous birds, marine and aquatic mammals, fish, and crustaceans. Predationproblems arise in most aquacultural endeavours. Some predatory species are protected by law,making lethal methods to reduce predation unacceptable unless a permit is obtained. Aquaculturetechnologies that efficiently and economically reduce crop loss without significantly affectingpredator populations or their roles in ecosystem health are considered desirable (OTA 1995).
Marine mammals are at the top of the food chain, are important consumers of fish andinvertebrates, and are thought to have a major influence on the structure and function of aquaticcommunities. Marine mammals also play a dynamic role by transferring energy and nutrients,although many of these ecological processes remain poorly understood (Bowen 1997, Trites1997). The expansion of fish farming in British Columbia, both in number and spatially over thepast few decades (Tables 1-4, Figure 1), coupled with the recovery of pinniped populations, hasresulted in increased interaction between marine mammals and finfish aquaculture operations.Like the concerns cattle and sheep farmers have about wolves preying on their animals,aquaculturists also want to maximise their profits by minimising fish losses from marinemammal predators. The simple solution is to kill marine mammals preying on, or in closeproximity to, farmed fish, but this is becoming less and less a viable option. In contrast toculling, which is a term generally used in wildlife management to denote a general reduction innumbers in an area, kills by fish farmers are directed at a relatively small number of specificanimals in the vicinity of salmon farms. The issue of pinniped killings has become particularlycomplicated because: 1) in some coastal areas (e.g., Clayoquot Sound and the BroughtonArchipelago), the number of salmon farms has increased significantly over the past decade; 2)with the expanded development of marine ecotourism focused around marine mammals, marinemammals now have significant economic value; 3) increased public recognition of the value ofmaintaining and sustaining natural ecosystems; and 4) new laws (e.g. Canada Oceans Act 1997)that now require an ecosystem approach as one of the principles of a governance structure tomanage Canada’s ocean environment. To achieve this approach, a precautionary-approachframework with the following elements has been proposed (O’Boyle 2000):
1. Conservation objectives to maintain, within acceptable bounds, the diversity of ecosystemtypes and species, ecosystem structure and function, and marine environmental quality;
2. Exploitation strategies based on reference points, where appropriate;3. Account of uncertainty, including reversal of the burden of proof, stake-holder involvement
in the determination of acceptable level of risk, and monitoring of indicators and associatedpre-agreed management actions that are essential for management;
4. Implementation of a decision-making process, including pre-agreement on actions (decisionrules) to be taken, depending on the circumstances; and
5. Evaluation of management system performance, including the relevance of the objectives,and the applicability of the indicators and reference points.

5
The publicity in spring, 2000, around the discovery of a substantial number of sea lions killed byfinfish farmers in Clayoquot Sound, coupled with the increasing value of pinnipeds to theecotourism industry, raise a number of science questions about: 1) the actual impacts pinnipedshave on finfish farming; 2) methodologies available to minimise potential impacts; and 3) theimplications of pinniped killing, both as a preventative measure to minimise salmon losses andon pinniped population dynamics. The quantity and quality of the science data supporting thejustification of pinniped killings has not been assessed formally by DFO. Here, we bring togetherthe most recent data available, discuss the requirements and processes to generate data ofcredible quality that we suggest should be available, and make recommendations as to how issuesrelating to pinniped killing by fish farmers should be dealt with in the future.
There is little doubt that predator-salmon farm dynamics have changed greatly since the industryfirst established itself in the 1980s. Seal and sea lion populations have changed in bothdistribution and abundance, while salmon farms have grown in number, size, and sophistication.What might have been true in the 1980s may well be significantly different at present. However,for some topics, only data from the early development of the aquaculture industry are presentlyavailable. In these cases, caution should be applied to the use of such information, but given thatthese are the only data available, they are nevertheless presented here to illustrate the extent andquality of existing data and where new data need to be compiled.
Regulations relating to the killing of marine mammals by fish farmers
Historically, marine mammals have been extensively harvested and controlled by humans inB.C., either in directed fisheries (e.g., sea otters and whales) or as perceived nuisance predatorscompeting with humans for fish (e.g., sea lion culls and harbour seal bounties from the turn ofthe century up until the late 1960s). In recent decades, however, synthetics have largely replacedproducts derived from marine mammals, and a better understanding of the basic biology ofanimals (food requirements, feeding habits) has indicated that control programs were largelyineffective (Fisher 1952, Spalding 1964, Malouf 1986, Olesiuk 1993). At the same time,changing public attitudes raised concern about the need to kill marine mammals, and the killingof these species has become of particular concern in contrast to that of most other marine species.Being relatively advanced mammals, there are, for example, regulations to ensure that theirdeaths are achieved as humanely as possible. We believe it is thus useful to briefly summariseexisting regulations within Canada and American States adjacent to B.C. to put concerns andissues around the killings of pinnipeds in context.
Statutes administered by DFO that affect the development and operation of the salmon farmingindustry in B.C. include the Fisheries Act, the Fish Inspection Act, the Navigable WatersProtection Act, the Canadian Environmental Assessment Act and the regulations pursuant toeach.
Seals and sea lions have been protected under the authority of the federal Fisheries Act since1970. Originally, commercial fishermen were allowed to shoot seals and sea lions to defend theircatch and gear, but that clause was eliminated in 1984. Marine Mammal Regulations, enactedunder the federal Fisheries Act in 1993, prohibit anyone from disturbing a marine mammal

6
except when fishing under the authority of these Regulations. They further provide that anyattempt to kill a marine mammal must be made in a manner that is designed to kill it quickly, theequipment necessary to retrieve it must be available, and a reasonable effort must be made toretrieve a dead animal immediately after it was killed.
The three species of pinnipeds that are known to interact with salmon fish farms in BC areharbour seals (Phoca vitulina), California sea lions (Zalophus californianus) and Steller sea lions(Eumetopias jubatus). Dixon (1989) reviewed the statutory and administrative frameworksregarding predator control on finfish farms, and identified gaps in the legislation and regulationsof the day for salmon farmers to deal with problem wildlife. At that time, marine mammals wereprotected under Section 32 of the Fisheries Act. Although anecdotal evidence indicated that thepractice of illegally shooting seals by farm staff was taking place, between 1986 and 1988 nocharges were laid for contravention of Section 32 of the Act (Dixon 1989). In an effort toregulate the killing of marine mammals at fish farms, DFO established a predator licensingprogram in 1989. The program allows DFO to issue permits to aquaculture operators allowingshooting of problem seals and sea lions pursuant to subsection 22(1) of the Fishery (GeneralRegulations), and subsequently under subsection 4(1) of the Marine Mammal Regulations and(DFO 1997).
These licences are issued subject to a number of terms and conditions that typically include thefollowing:
• only harbour seals, California sea lions and Steller sea lions may be killed;• only seals and sea lions that are actually taking or attempting to take fish in seas cages
may be killed;• the area of killing is limited to the immediate site of the sea cages and killing must not
occur outside the boundaries of the lease or licence of occupation for the farm;• employees who kill seals or sea lions must meet one of the following qualifications:
- certification from the Conservation and Outdoor Recreation Education Program,- completion of a basic firearm safety course, or- possession of a provincial hunting licence;
• firearms used must meet certain specifications;• every attempt must be made to retrieve for biological sampling killed seals and sea lions;
and• the licence holder must submit quarterly reports listing the number and species of animals
killed and the date each animal was killed.
At the time of the initial application for a licence, the applicant must satisfy the DFO that it hastried other measures in an attempt to deal with problems with seals and sea lions before a licenceto kill them will be issued (DFO 1997) including the use of predator nets, seal scares, dogs, extralighting and increased vigilance by farm operators (EAO 1997). However, it appears thisinformation is not in fact being requested by DFO, as there is no database of the measures thatmay have been taken by applicant farms and the form by which a licence is requested does notask for this information (Appendix 1). When the licence (Appendix 2) is issued, the DFO notifiesthe R.C.M.P., the provincial conservation officer and the federal fisheries officer. A licence is

7
issued for a period of one year and, in recent years, licences have been renewed automaticallyunless evidence is provided indicating non-compliance with the terms and conditions set out inthe licence, and in particular, the submission of quarterly reports on marine mammals killed. Thisis a self-reporting system and the DFO has no formal auditing system in place. There have beenno prosecutions for violations of these licences by salmon aquaculture operators. At present,most, if not all, operating farms possess a valid licence to kill seals and sea lions (EAO 1997).Between 1990-96, the number of sites licensed to undertake pinniped killing increased from 60to 82 (DFO 1997).
The BC Environmental Assessment Office Salmon Aquaculture Review discussion paper (EAO1997) on aquatic mammals and other species reviewed the interactions between marine mammalsand the salmon farm industry, including the predator control program. The EAO report (Iwamaet al. 1997) was critical of the lack of DFO resources applied to this program, implied by thelimited enforcement of the conditions of predator licenses. One recommendation forimprovement of the system was the requirement for all operations to develop and implement a“predation control plan”, which would be enforceable if incorporated into the aquacultureoperating license. Another recommendation is that a rigorous survey be conducted on theinteractions between the industry and aquatic mammal predation including a more rigorousquantification of the degree of predation (Iwama et al. 1997). However, neither of theserecommendations have been implemented by DFO to date.
American regulations
Regulations relating to the killing of pinnipeds in the American states adjacent to B.C. arepresently quite different than those in Canada. From 1988 to 1995, if non-injurious predatorcontrol were ineffective and stocks were under substantial and immediate threat, under theMarine Mammal Protection Act (MMPA), salmon farmers (falling under the category ofcommercial fisheries) were permitted to kill seals, subject to registration and reportingrequirements. Since March 3, 1995, amendments to the MMPA prohibit commercialfisheries/salmon growers using lethal force to control predators, excepting for the protection ofhuman life (NMFS 1996).
NOAA (1999) recommended that in situations where pinnipeds conflict with human activities,such as at fishery sites or marinas, lethal removal by government officials would be authorisedonly after non-lethal deterrence has been ineffective. Lethal removal would only be used when:(a) an individual pinniped is repeatedly involved in a conflict situation, such as raiding fish pens;and (b) non-lethal deterrents applied have been ineffective. Two types of pinniped behaviourswould indicate ineffective use of non-lethal deterrence, as shown by the following examples: (1)a pinniped is on a dock and does not leave when non lethal measures are attempted; and 2) anindividual pinniped reacts to deterrence measures by leaving the area and returns repeatedly afterthe person who has used the deterrence has left the immediate site. These guidelines are felt tomost effectively resolve specific pinniped conflict situations.
Since passage of the MMPA in 1972, West Coast populations of California sea lions and Pacificharbour seals have increased at average annual rates of 5-8%. As of 1997 (NOAA 1997), there

8
was no conclusive evidence that populations had reached their optimum sustainable populationlevel (OSPL), although more recent data indicates that harbour seal populations in Washingtonand Oregon may now be at this level (NOAA 1999).Finally, it should be noted that the U.S. legislation and regulations may have implications for fishfarms in Canada. The U.S. Marine Mammal Protection Act of 1972 as Amended, Sec. 102 (c)(3) (Marine Mammal Commission, 1995) states that “[it is unlawful to import into the UnitedStates] any fish, whether fresh, frozen, or otherwise prepared, if such fish was caught in a mannerwhich the Secretary has proscribed for persons subject to the jurisdiction of the United States,whether or not any marine mammals were in fact taken incident to the catching of the fish”. Thiswould seem to indicate that fish harvested from fish farms in a manner that would not bepermitted in the U.S. (by shooting seals and sea lions) might not be able to be sold in U.S.markets, but a legal interpretation is required to evaluate this.
The U.S. National Marine Fisheries Service (NMFS) has classified the Steller sea lion populationstock west of 144 degrees W. longitude (a line near Cape Suckling, AK) as endangered, with theremainder of the Steller sea lion population remaining as threatened, effective June 4, 1997. Thismeasure, authorized by the Endangered Species Act of 1973 (Act), corresponds with adetermination to reclassify this species based on biological information indicating that there aretwo distinct population stocks, as authorized under the Act, by the NMFS which has jurisdictionfor this species. The listing limits whether animals can be killed, and U.S. stock assessmentsinclude estimates of numbers of animals killed in neighboring countries. The listing maytherefore also have implications for salmon farming in Canadian waters.
Documentation of Salmon Losses
The published information from British Columbia on losses of farmed salmon that areattributable to predators is very limited, and it is therefore necessary to bring forward materialthat is dated or derived from other jurisdictions where the situation is not truly comparable. Itwould appear that the salmon farming industry or salmon farmers have not collected andcompiled any more detailed or current information. Our analysis has been based on theinformation available, some of which may be of limited validity or of tenuous quality.
A lack of substantiated, quantified data documenting salmon losses due to pinniped predation is aworld-wide phenomenon (van de Wetering 1989, Howell and Munford 1992, Arnold 1992,NMFS 1996, Iwama et al. 1997, NOAA 1999). However, there are various estimates of salmonaquaculture losses due to direct or indirect marine mammal interaction. Table 5 summarises thelosses reported over the past 12 years. Another source of information where salmon losses havebeen documented is insurance company claim records (Table 6). However, these numbers areconsidered to underestimate the actual number of losses because reported claims are in excess ofdeductibles and claim thresholds, which can be as high as 20% and 80% respectively (Nash et al.2000).
A recent BC government review (EAO 1997) of finfish farming stated “about half of all farms inB.C. experience fairly substantial predation losses. A 1989 estimate based on a survey of fishfarmers put salmon losses from predation mortality and escapes due to predator net damage at 1.5

9
per cent [this includes otter and bird predation] of total industry production in that year - over200,000 fish eaten. If salmon losses due to only sea lions and seals are considered, then theestimated loss rate was 1% (Rueggeberg and Booth 1989).
There are several reasons why it is difficult to accurately determine the number of salmon lossesrelated to pinniped interaction. Marine mammals can cause salmon losses directly by predationor through escapement due to net pen damage (DFO 1997), and indirectly such as increasedlosses from disease associated with injuries, decreased feeding and growth from stress, anddecreased value of damaged fish. It would seem simple to calculate an initial estimate of loststock through direct seal predation or escapement by subtracting the number harvested plus themortalities found in the pens from the initial number of fish stocked. However, stock numbersare often only accounted for at harvest, making it difficult to accurately determine losses whenthe number of fish initially stocked in the pens has an unknown estimated measurement error anddeaths due to causes other than pinniped predation (e.g. disease) may not all be counted(Parkinson and Deegan 1989; A. Thomson, DFO, Nanaimo, BC, pers. comm.). David Groves(Sea Spring Salmon Farm Ltd., BC, pers. comm.) estimated the introduction measurement errorat 1-2% if accurate counting of mortalities in net pens is conducted at appropriate time intervals.This should be done every few days over the first couple of weeks after the salmon are firstintroduced to salt water pens. Small salmon rot away completely in 3-4 d, so monitoring ofmortalities has to be quite frequent. Weekly monitoring of mortalities is acceptable with largefish.
It may be possible to estimate some direct predation losses based on counts of the number ofcarcasses in the net pens showing evidence of pinniped attack (Campbell 1991). Fish subject toseal attacks can exhibit certain characteristics such as parallel scrapes and puncture holes causedby seal canines (Pemberton et al. 1991, Tillapaugh et al. 1993). Other evidence includes remainsof the fish head, tail and/or backbone, which are sometimes left behind when seals suck out thegut contents of the fish through the net (Ross 1988, Rueggeberg and Booth 1989, Campbell1991, Tillapaugh et al. 1993). Recent amendments to the BC Aquaculture Regulations nowrequire fish farms to inspect farm mortalities for signs of predator attacks and record predator-related mortalities in a written inventory record. These amendments, effective October 31, 2000,should improve the quantification of salmon losses attributed to pinniped predation.
Marine mammals can also contribute indirectly to losses through predation-related injury orstress, which is considered by some to cause more damage to farm stocks than direct predationlosses (Tillapaugh et al. 1993). Half of BC fish farm survey respondents perceived increaseddisease incidence in salmon due to myxobacterial infections was related to wounds or descaling.An increase in vibrio outbreaks, such as Bacterial Kidney Disease (BKD), have also beenattributed to predation-related stress (D. Kieser, DFO, pers. comm.). Disturbance in feedingbehaviour caused by seals in the vicinity of net pens were also reported in the survey, having thegreatest affect in the spring when fish appetite and growth rates are most rapidly increasing(Tillapaugh et al. 1993).
Some farmers blamed salmon losses on certain predators without actually observing thepredation taking place (Rueggeberg and Booth 1989, Pemberton et al. 1991). Survey results of

10
BC salmon farms demonstrated that although 37% of farms experienced predation problems,only 27% actually reported losses, indicating that in some instances predation may be more of aperceived problem than a documented one (Rueggeberg and Booth 1989). In some cases,pinnipeds may be drawn to the vicinity of net cages and only feed on wild fish attracted to theoutside of cages by uneaten feed pellets and waste material (Campbell 1991, Howell andMunford 1992). There may be a lack of visual evidence of pinniped predation because mostattacks occur at night (Pemberton and Shaughnessy 1993, Tillapaugh et al. 1993). Failure toproperly distinguish between pinniped species is also a problem. Because visual observations areoften only of the upper portion of the animal’s head when its above water, and usually at adistance, it can be difficult to accurately identify seal and sea lion species (van de Wetering1989). Also, it is possible that predation-related losses by wildlife other than marine mammalsmay be attributed to pinnipeds. In British Columbia, river otters (Lutra canadensis) have beenidentified as the most frequent non-marine predator at fish farms (Rueggeberg and Booth 1989,Fraker 1996), and in one survey, otter-related salmon losses were estimated to be 30,600 fish on22 farms in 1988 (Rueggeberg and Booth 1989). Accurate identification of predator species isimportant in order to institute the proper predator control measures at fish farms (Fraker et al.1998).
Further circumstantial evidence implicating pinniped-related salmon losses include theobservation of animals in the vicinity of the farm just prior to discovery of holes in the net pens(Rueggeberg and Booth 1989). Because the location and size of holes are indicative of the typeof predator attack, it should be relatively easy to distinguish the species involved (Campbell1991). However, holes can also be created in net pens by damages from flotsam, logs, equipmentsnags, cleaning, boat propellers, poor net handling practices, lack of net maintenance and old age,heavy currents, and severe weather (Rueggeberg and Booth 1989, ARM 2000). World-wideclaims of predator-related net damage in 1999 were listed by one insurance company as relativelyinfrequent, but found seal damage could still take place even with apparently strong nets (ARM2000).
Tillapaugh et al. (1993) suggested that indirect losses are greater than direct losses, and indicatedthat 1991 losses in B.C. exceeded $8 million, i.e., $4 million direct plus >$4 million indirect).Fraker (1996) estimated a loss of $10 million due to pinnipeds, and although DFO (1997) hasreferred to this value, it is unclear how these estimates were derived. Fraker’s estimate was 6.4%of the value of the industry in 1996, according to the 1996 farm-gate production value of $156million (Figure 2). With a 1% loss (Booth and Rueggeberg 1989), the estimate should be about$1.5 million. Apparently, the $10 million estimate included losses not only from direct losses(mortality and escapes) but also indirect losses from increased susceptibility to disease, decreasedfeeding/growth rates, etc. (M. Fraker, TerraMar Environmental Research Ltd., Sidney, BC, per.comm.). This estimate was apparently determined based entirely on opinions of persons involvedin the industry. There was no attempt to document the losses, so there appears to be no knowncredible database that documents salmon losses due to pinnipeds by fish farm, geographicallocation or as a percentage of the production of the farm. In 1996, salmon production was 27,756t, and almost doubled to 49,100 t in 1999 equating to a farmgate production value of $292.2million (BC Fisheries 2000a, DFO 2000) (Figure 2). It remains unclear that salmon losses due topredation have increased proportionally over this time period, since many countermeasures

11
against predation are being utilised. Regardless, while a loss rate of 1% may be substantial in anabsolute amount, as a percentage of production it seems to be well within the limits ofmeasurement error and can thus be considered statistically insignificant on a site productionbasis. If nets are torn by pinnipeds at a specific farm and a large number of fish escape, then thiswould be more significant at that site, but also probably indicative of a lack of use of appropriatepredator protection devices, described below.
The above observation is not intended to suggest that predation losses may be more of aperceived problem than a real one. While published, scientific documentation of the magnitudeof kills is lacking, some losses are obviously occurring and the potential for great loss throughnet damage is high. Individual fish, particularly brood stock, are valuable and no farmer wants tolose any fish.
Development of Predation Control Methods
Efforts to develop more effective devices to protect farmed fish from pinniped predation and toreduce the need for lethal methods of predator control continue. Negative public opinion ofsalmon farmer’s killing seals was identified as an industry problem in the late 1980s (Dixon1989, van de Wetering 1989). In an effort to minimise the killing of pinnipeds, the BC SalmonFarmers Association (BCSFA) announced on May 4, 2000, the formation of a special task forcecomposed of federal and provincial government officials and fisheries stakeholders to identifynon-lethal solutions to the recent rise in conflicts with marine predators. Until therecommendations of the task force are received, their news release stated “…salmon farmers willprotect their farm stocks by focusing on predator prevention and deterrence. Destroying sea lionsor other predators will be reserved as a last resort, and will only occur when they threaten humansafety, or threaten to cause significant escapes of farm salmon or extraordinary losses to farmstocks.” Particular concern was expressed about the recent killing of predators at fish farms inClayoquot Sound, where some farm sites have now apparently voluntarily removed firearms, inconsideration of the United Nations Biosphere Reserve designation (BCSFA 2000b).
Several studies have found an increase in predation problems with increased proximity to sealhaulouts (Ross 1988, Pemberton and Shaughnessy 1993). Locating salmon farms an appropriatedistance from seal haulouts may not always be a solution, as pinnipeds tend to be widelydistributed and have numerous haulout sites (Olesiuk 1999). Tillapaugh et al. (1993) suggestedthat pinnipeds may relocate to haulouts close to a farm if pinniped attacks are successful,although there is no evidence of this actually occurring. Seals and sea lions begin to attacksalmon when they reach 400-800 g (Fraker 1996). Seals and sea lions, because of theirintelligece, relatively large size, high energy need, and high trophic level in the ecosystem, arepersistent predators that will continually probe a farms defenses, looking for opportunities tomeet their food needs. Tillapaugh et al. (1993) observed that pinnipeds can hunt in groups. Theymay wait until fish are herded into a corner by the movement of the pliable net in the undulatingwaves, then attack by pushing against the net wall and pinning the fish against an opposite wallwhere they can be caught or wounded.

12
Business risks to net pen farmers from marine mammals are both production and market related.Production lost to marine mammals occurs in several ways. First, there is direct predation. Thehigher freeboards and strength of modern net pens makes it more difficult for predators to getinside, but incidents still occur. The majority of attacked fish die almost immediately, their liversand soft bellies eviscerated. Grower testimonies give a consistent description of seal attacks onpens. Visual observations from the surface and physical evidence (net damage, fish remains)indicate that an attacker rushes the pen underwater. The fish respond by grouping tightly in acorner or pocket of the net, where they can be attacked from below, i.e., through the lower sidesor bottom of the net. A net may not necessarily be damaged, but the attacker is able to bite offand suck parts of the fish through the net (NMFS 1996, NOAA 1997). The location of the attackcan be identified by damage to the net, fish parts smeared in the net, and marks or a clearing inthe bio-fouling on the nets. Growers report that attacks will continue to occur at a particular spoton a particular pen even after nets have been repaired and cleaned.
Secondly, there can be lost production by a loss in body weight of the fish. The stress on apopulation subjected to repeated attacks by predators shows itself in poor feed conversionefficiency. Stress may also manifest itself in greater vulnerability to disease (D. Kieser, DFO,Nanaimo, BC, pers. comm.). Some attacked fish are merely injured, not killed. Growers reportthat injured fish are particularly susceptible to disease where flesh or scales are damaged. Once adisease, such as furunculosis or BKD, finds a host in an injured fish, all fish in the pen are atgreater risk. Studies show that environmental stresses enhance production of cortisol in someanadromous fish. Cortisol is a steroid hormone that, at high levels, suppresses a fish’s immunesystem and increases its susceptibility to disease [Pickering and Pottinger 1985, as cited in Ross(1988) and Anderson (1990)].
Thirdly, there can be lost production through escapement. Fish escape from net pens throughholes in the net walls made by marine mammals biting through the fabric. Incidents by BCfarmers for holes in nets increased from 10% to 20% over the 3 years 1995 – 1997 (Fraker et al.1998), with predators cited as the main cause (Nash et al. 2000).
Salmon farmers go to considerable lengths to prevent or deter predation-related losses. Theextent of predation and the deterrence strategies employed varies among farms. There is nostandard strategy. Some growers claim dogs on a farm reduce predation. Measures that have beentried or considered for reducing or eliminating pinniped predation on salmonids are harassment,aversive conditioning, exclusion from selected areas, removal of offending pinnipeds, andpinniped population control. Appendix 3 summarises the pinniped deterrent observations ofFraker et al. (1998), and approaches tried to date are briefly discussed below:
1. Harassment
Methods to directly deter pinnipeds from fish predation include noise and tactile and vesselharassment. Deterrence efforts involving noise (underwater firecrackers, cracker shells, acousticdevices, and predator sounds) are based on the assumption that noise startles, warns, scares, orcauses physical distress to pinnipeds, thereby moving them from the area. Some non-lethaldeterrence measures may be effective initially or be effective on new animals, but become

13
ineffective over time or when used on new animals in the presence of other animals that do notreact to deterrence.
a) Seal Bombs – powerful underwater firecrackers have been used to disperse pinnipeds. Theyhave been effective short-term, but over the long-term with repeated use, sea lions and sealslearn to ignore the noise (Fraker et al. 1998). Because seal bombs are explosive, there is aninherent danger that they will explode when being handled by salmon farm staff.
b) Cracker Shells – Cracker shells are shotgun shells containing an explosive projectile,
designed to explode about 50-75 yards from the point of discharge. Although the noise maystartle the pinnipeds and cause them to temporarily flee, there is usually no physicaldiscomfort to the animal involved since the explosion is in the air or on the water surface.They have been used with limited effectiveness because pinnipeds learn to avoid or ignorethe noise.
c) Acoustic Harassment/Deterrent Devices (AHDs and ADDs) – These are electronic sound-
producing devices intended to generate sounds that are irritable or painful to predators andhence keep them from fish farms. Terminology to describe them has not been usedconsistently. Originally, they were referred to as “acoustic harassment devices” (AHD)(Mate and Harvey 1987), but in 1993, DFO coined and adopted the term “acoustic deterrentdevice” (ADD). The term ADD is now widely used to refer to low amplitude devices,commonly referred to as “pingers”, that are used to indicate delineate the presence of nets,while the term AHD refers to high-amplitude devices intended to produce sounds loudenough to be irritable or painful.
Over the course of development, AHDs have become more powerful. The original AHDsdeveloped in the late 1970s and early 80s were relatively low-power units (135-140 dB) thatoperated on the principle of producing unfamiliar sounds that startled seals, but animalsquickly habituated to these devices (Anderson and Hawkins 1978, Mate and Harvey 1987).In the early 1990s, more powerful ADDs (195-220 dB) generated sounds uncomfortable toseals. A recent AHD model, which has yet to be tested due to environmental concerns, canemit sounds up to 240dB, along with associated shock waves (National Marine FisheriesService (NMFS) 1999).
With the advent of increasingly powerful AHDs, concern has grown over the impact on non-target animals, such as whales and porpoises. In 1993, the DFO adopted an interim policyallowing the experimental testing of a limited number of high amplitude acoustic devices,along with the formation of an Underwater Sound Impact Steering Committee (USISC) toinvestigate effects on non-target animals. Between 1993 and 1996, the number of authorisedAHDs increased from 6 to 17. In all cases, authorisations were conditional upon the farmsmaintaining operational records detailing periods of operation along with observationalrecords of marine mammal activity. During this period, the USISC completed a number ofstudies including an assessment of sound levels and propagation characteristics (Haller andLemon 1994) and an assessment of the behavioural response on harbour porpoise (Nicol andSowden 1994, Olesiuk et al. 1995b). The studies found that the sounds propagated great

14
distances and would be audible to porpoise up to 40-60 km, and that there was a dramaticdecline in porpoise abundance within at least several kilometres of the source when thedevices were activated (Olesiuk et al. in press). Similar observations have since been shownby Johnston (1999) and have been noted for other cetaceans in general (Morton 2000). While the environmental impacts of AHDs were of concern, it also became obvious they wereineffective at deterring seals (Nicol and Sowden 1994, Olesiuk et al. 1995a, Norberg 1998,from Nash et al. 2000). Indeed, some of the largest harbour seal kills at salmon farms occurredwhile AHDs were in use, and seal attacks did not decline until AHD use was discontinued andlarger enclosures installed (see the example in Figure 14). The loss of effectiveness ispresumably due to hearing loss or impairment over time (Reeves et al. 1996). Given their far-ranging impacts on a variety of non-target animals, potential for injury and hearing loss toseals and sea lions, and ineffectiveness at deterring predators, DFO has adopted a policy, asrecommended by the EAO (Iwama et al. 1997), of phasing out and prohibiting their use. Nopermits have been issued in recent years to operate the devices.
d) Predator Sounds – The effectiveness of pinniped predator vocalisations to frighten sea lionshas not been consistent. Pinnipeds have sometimes shown immediate avoidance responses tothe projection of killer whale sound recordings, but generally they become habituated whenkiller whales do not appear.
e) Chasing by Vessels – Chasing or hazing sea lions with a vessel proved to be ineffective at
the Ballard Locks, as animals learned to avoid the vessel (Gearin et al. 1986, 1988). Hazing istime consuming, relatively expensive and usually unsuccessful.
f) Tactile Harassment – Tactile harassment involves shooting pinnipeds with non-lethal
projectiles such as rubber bullets or blunt tipped arrows. Blunt tipped arrows were tested bythe Washington Department of Fish and Wildlife (WDFW) on sea lions at the Ballard Locks,Seattle, WA, with no significant change in predation rates (Gearin et al. 1986, 1988). Rubberprojectiles discharged from a shotgun were tested by the Oregon Department of Fish andWildlife (ODFW) on sea lions at Willamette Falls, with limited success.
g) Aversive Conditioning – Aversive conditioning is the application of an unpleasant or
painful stimulus to train animals to avoid a specific behaviour. Taste aversion is a form ofaversive conditioning that involves putting an emetic (lithium chloride) into a prey species toinduce vomiting when the prey is consumed. This was attempted on sea lions at the BallardLocks with little success (Gearin et al. 1986, 1988). A variation of this method is to dartlithium chloride directly into the pinniped when it consumes a fish or enters an area(Pemberton et al. 1991). This latter approach has not been field-tested in Canada.
h) Predator Models – Although media reports on the use of a killer whale model indicated that
it was effective in repelling seals from net pens in Scotland, use of the same model at netpens in Maine had no effect in repelling seals. Observations of pinniped behaviour in thepresence of their predators and during field-testing of the model has shown that thesemethods are ineffective over the long term.

15
2. Pinniped exclusion from selected areas around salmon farms
Predator netting, maintenance of net rigidity, using rounded and larger nets, reduction of netmesh size, and installation of perimeter fencing, including electric fencing to primarily deter riverotters, have been used to keep marine mammals away from net pens (NMFS 1996).
a) Predator Nets – These are usually made of a large mesh heavy nylon or polypropylenetwine and hung outside and around individual or groups of net pens. The most commondesign has panels hung from the walkways to a depth several meters greater than the pen, andin most cases have a floor. The foot of the predator net is usually weighted. Predator netsrepresent substantial initial and recurring cost to the growers. Consequently, not all farmsemploy the nets on all cages. In addition to materials and installation, costs are incurredregularly for servicing, repairing, replacing, and cleaning. Predator nets are only effective ifthey prevent seals from accessing the pens. If the nets are left too slack or the space betweenthe predator net and net pen is insufficient, the current can push the pen against the predatornet, exposing the fish to possible attack (Arnold 1992). If a predator net is present, thepredators have to either:
1. wait for the current to bring the primary net into contact with the predator net, 2. force the predator net into contact with the primary net, 3. wait for or create a hole in the predator net, or 4. find a way over the predator net. b) Perimeter nets – Perimeter nets are hung from piles along the perimeter of the lease site.
They can be problematic and expensive (piles, repair, cleaning, getting to and from the pens).Certain types of nets will entangle predators, leading to drowning. Shark guards are relativelysmall-mesh netting suspended beneath net cages to prevent dogfish from scavenging deadfish, or “morts”, that have fallen to the bottom of the cage and creating holes in the net in theprocess. Such nets are unlikely to entangle pinnipeds. There are, however, no data on thenumber of pinnipeds being entangled and drowned at B.C. salmon farms. The drowning ofmarine mammals has been deemed to be inhumane in Canada (Malouf 1986). However, theuse of nets (e.g. gill nets) in Canada that might potentially cause pinniped entanglement islegal, and if pinnipeds are caught, then this becomes a bycatch issue (M. Joyce, DFO,Vancouver, BC, pers. comm.).
c) Bio-Fouling of Nets – Fouled nets are much heavier and the seals have greater difficulty
pushing in the net and getting at the fish. Also, fouling reduces a pinniped’s ability to bite andsuck fish through the mesh. The detrimental effects of fouling are the reduced water flow,increased drag, and increased weight in handling. Fouled nets may also obscure or concealthe fish (Fraker et al. 1998). The treating of nets with anti-foulants has increased in recentyears, which may indirectly have caused an increase in the number of holes in nets, but acause and effect relationship has not been proven. The average age of netcages has increased,and it is also possible that older, weaker nets are more vulnerable to holing (Fraker et al.1998). The use of Flexgard 11 (Flexabar-Aquatech Corporation, Lakewood, N.J., USA), a

16
particularly heavy water-based latex, copper oxide anti-foulant, is considered a key to thesuccess Stolt Sea Farms has had in mitigating predator attacks (Gary Robinson, Stolt SeaFarms, pers. comm.).
3. Non-lethal Removal of Offending Individual Pinnipeds
Capture and relocation efforts with California sea lions at Ballard Locks, Seattle, WA, indicatedthat transporting captured sea lions relatively short distances was not effective, as the sea lionsquickly returned (Gearin et al. 1986, 1988). Translocation of harbour seals off Vancouver Islandwas also concluded to be ineffective, as the vast majority of animals (including those translocatedfrom Nanaimo to as far away as Bamfield) returned to the capture site (Olesiuk et al. 1997).pinnipeds are not easily captured, particularly those that have been once-captured.
4. Lethal Removal of Offending Pinnipeds
In situations where non-lethal measures are successful on the majority of pinnipeds in an area,lethal removal of the experienced/habitual predators combined with non-lethal deterrence may bean effective short-term means of controlling pinniped predation on farmed salmonids. However,such an approach should be considered a last resort and only be utilised if all other approacheshave failed
A Royal Commission of Seals and Sealing in Canada conducted a detailed assessment of lethalpredator control (Malouf 1986). The Commission’s recommendations and DFO responsesrepresents government policy on the issue of predator control. These recommendations aresummarised here, as we believe it is important to bring all relevant information together in thisone report to give readers a better understanding of how DFO has previously addressed the issueof killing pinnipeds. Malouf’s recommendations and DFO’s responses were as follows:
1. Any population control should be done under government supervision. DFO response: DFOagrees with this and our first priority will be to ascertain whether a cull is able to beperformed by trained government employees. If such is not the case we will certainlyhave the cull done under government supervision.
2. Fishermen fishing fixed gear, including aquaculture establishments, may be given licences to
kill “nuisance” seals in the vicinity of their gears under strict controls, with provision for arecompense for return of biological material of value to research programs. DFO response:The government agrees but will require proof that such licences are necessary, that sealswill be killed humanely and that there is no threat to the seal stock.
3. Any population control programs should be designed to provide detailed data on such matters
as the number, age, sex, location, and parasite load of the animals killed, and be associatedwith continued monitoring of the population concerned to determine any changes in number,structure, and principal biological parameters of the population, as well as the efficacy of thepopulation control measures. DFO response: The government agrees. Research necessaryto monitor the effects would be part of any seal population control programs.

17
4. In view of the suffering involved, the government should take action with a view to phasing
out, as rapidly as possible, the netting of seals in those communities which now rely largelyon this method to take harp seals both for subsistence and to provide a substantial part oftheir income. Netting of seals in other areas should be prohibited immediately. DFOresponse: The government agrees.
Many of the above recommendations appear not to have been applied by DFO to pinnipedkillings by salmon farmers in British Columbia: 1) killing of pinnipeds is not being done undergovernment supervision; 2) a low number (see below) of pinniped carcasses are being recoveredfor biological sampling, and biological data collected are not being analysed in a timely manner;and 3) pinniped populations are not being assessed in all areas where pinniped kills are beingmade.
Predator Control Program
The first marine mammal predator control permits in B.C. were issued in 1989 to two salmonfarms in response to serious predator problems. The number of predator control licences issuedincreased markedly in 1990 (Fig. 3) as the DFO Aquaculture Division promoted the issuance ofpermits. By 2000, a total of 116 predator control permits were issued. The recent increase islargely attributable to a procedural change that occurred in the mid-1990s, when licenses beganto be renewed automatically each year. As a result, recent figures include some sites that are noweither fallow or otherwise inactive. The number of sites actually reporting predator control killshas increased only slightly since the program was introduced.
The geographic distribution of sites holding predator control permits has remained fairly constantover the last decade (Fig. 4). In order to facilitate an assessment of the impact of predator controlon pinniped populations, geographic areas were chosen to correspond with those used to monitorand assess harbour seal populations (see Figure 1a in Olesiuk 1999a). Main concentrations offish farms occurred in the north-east Strait of Georgia (10%), mid-west Vancouver Island (23%),and the Broughton Archipelago (12%). A substantial number of the licensed farms (38%)occurred in areas where harbour seals have not been systematically surveyed, mostly between thenorth end of the Strait of Georgia and the south end of Queen Charlotte Strait - BroughtonArchipelago.
In 1990, marine mammal Stock Assessment Division staff in the Marine Mammal Programworked with Aquaculture Division staff to develop a predator control and monitoring program.The primary purpose of the program was to obtain estimates of the numbers of seals and sea lionskilled, so as to provide a means of assessing impact on pinniped populations. This was achievedby requiring that quarterly reports, including nil reports, be submitted. The reports specifiedinformation on the date, species, and certainty of kill. Farmers were also required to retrieve andsample carcasses, in order to facilitate more detailed assessment, since sustainable kill rates canvary depending on the age and sex of animals killed. Realising there would be no way ofindependently verifying the information provided in the reports, the program was designed toprovide no incentive for under-reporting, such as quotas. A copy of the instructional material for

18
biological sampling and the quarterly report form to be submitted by licence holders is includedin Appendix 4. Information provided by the quarterly reports was recently compiled in a geo-referenced database, which forms the basis of the assessments that follow.
Harbour Seal Kills
Over the course of the predator control program (to December 31, 2000), an estimated 5,341harbour seals were killed. This number was estimated by assuming that 100% of the killsreported as positive kills, 75% of those reported as probable kills, and 50% of those reported aspossible kills were actually killed. Small adjustments were also made to account for quarterlyreports missing or not filed (60 and 40 seal kills respectively). Numbers for 2001 were projectedfrom reports filed for the first three quarters based on the proportion of kills taken in the first twoquarters in previous years. The total also includes estimates of 3 seals killed in 1989 and 790 in1990 provided by Aquaculture Division prior to the monitoring program being introduced. It isnot clear how these two values were derived, but they appear to have been extrapolated from thenumber of kills made by a few sites that filed reports to the total number of licenses issued.
In addition to the estimated number killed, over the same time period, an additional 358 harbourseals were shot at but apparently escaped or were assumed to be non-lethally injured.
Since the predator control program and monitoring program was established, the annual numberof harbour seals estimated killed or escaped/injured has remained fairly constant, averaging about455 and 36 respectively (Fig. 5). Although the total number of seals killed has remainedconstant, the average number killed per licensed site has declined by almost half, from six toeight kills in the early 1990s to about four kills in the late 1990s (Fig. 6).
Most kills were made during winter, in the fourth quarter (October-December) and sometimesinto the first quarter (January-March) of the next year, except during 1998-99 when kills perquarter were all relatively similar (Figs. 7, 8). The seasonal pattern indicates seal attacks aremost prevalent during the non-breeding season; nearly half of all kills (48%) occurred duringOctober to January.
The recovery rate of carcasses showed a seasonal pattern (Fig. 9) somewhat different than kills(Fig. 7), with peaks in the fourth quarter, but was far below kill values. In most instances (96%),the reason specified for not recovering the carcass was that it sank. One would expect recovery tobe greatest during winter when animals are in peak nutritional condition and lowest duringsummer and autumn when reserve fat is lowest (Pitcher 1986, Boulva and McLaren 1979).However, the overall carcass loss rate (3,215 of 3,502, or 92%, of positive kills) should be lowerthan is being reported, suggesting that adequate effort may not being given for carcass recovery,as required by the control permit. Bigg (DFO, Nanaimo, BC, unpublished data) estimated that50% of harbour seals shot during the commercial hunt in B.C. were lost, and Fisher (1952)estimated that 40% of harbour seals shot for bounty were lost. Lost carcasses means no biologicaldata is obtained for those animals killed.

19
The introduction of the predator control program coincided with a change in the status of harbourseal populations in British Columbia (Fig. 10). During the 1970s and 1980s, prior to anypredator control permits being issued, populations throughout B.C. were increasing exponentiallyat a rate of about 12% per annum. This increase is believed to represent the recovery ofpopulations that had been depleted by predator control programs and commercial harvests priorto the species being protected in 1970. By the 1990s, growth rates began to subside and thepopulation subsequently appears to have stabilised. Although the levelling-off of populations inthe 1990s corresponds with the implementation of predator control at fish farms, a cause andeffect relationship is unclear. The overall population trends were based on aerial surveysconducted in index areas distributed throughout the province, including some areas far removedfrom fish farming, such as the Queen Charlotte Islands and lower Skeena River. Thestabilisation of populations may have been a density-dependent response as recoveringpopulations attained historic levels (Olesiuk 1999). This being the case, the increase in sealattacks and introduction of the predator control program may have actually been precipitatedbecause the population was approaching carrying capacity and competition for food resourceswas increasing.
Harbour seals are generally non-migratory, and usually exhibit a high degree of fidelity to aparticular haulout site or area (Olesiuk et al. 1997). Animals typically forage within 10kilometres of haulout sites (Olesiuk 1999b), although animals may undertake seasonalmovements on the order of several tens of kilometres (Cottrell 1995). A number of recentmolecular genetic studies on macro-geographic structure have indicated that harbour seals werephilopatric on a scale of a few to several hundred kilometres and that the extent of heterogeneitywas correlated with geographic distance, even in the absence of physical barriers such as openexpanses of water (Westlake and O’Corry-Crowe, in press; La Mont et al. 1996; Stanley et al.1996; Goodman 1998; Burg et al. 1999). It therefore seems appropriate to assess the impact ofpredator control kills on a more regional scale than the entire B.C. coast.
For each of the geographic subareas used to assess harbour seal stocks (see Figure 1 in Olesiuk1999), we calculated the sustainable harvest rate at the Maximum Net Productivity Level(MNPL; Taylor and DeMaster 1993). The MNPL represents the maximum number of seals thatcan be harvested; if kills exceed MNPL the population will decrease, and if kills are less thanMNPL, the population will increase the area’s carrying capacity is attained. As outlined inOlesiuk (1999), MNPL was estimated to be 11.4% at 75% of carry capacity for the Strait ofGeorgia, and 12.1% at 70% of carrying capacity in other regions of British Columbia.
In most cases, the annual kills of harbour seal at fish farms fell below MNPLs (Fig. 11). Anotable exception was the Broughton Archipelago, where during 1992-97 the number of sealskilled by salmon farms exceeded MNPL by up to a factor of ~3, which would lead to depletion ofthe local population. Indeed, during 1989-96, the two aerial surveys conducted in the BroughtonArchipelago indicated that abundance declined by 26%. This was the only area surveyed thatexhibited a decline, whereas other areas surveyed showed an average increase of 20% over thesame period (Olesiuk 1999). The kill at one site in Jervis Inlet in 1991 was 80% of MNPL, butdropped abruptly when the farm changed ownership the next year. Harbour seal kill rates havebeen increasing in mid-west Vancouver Island, and are now on the order of 70-80% of MNPL.

20
Most of the kills in this geographic subarea occur in the southern portion (Clayoquot Sound)where salmon farms are most concentrated, whereas seals are distributed throughout the area, soseal kills by salmon farmers within the southern portion of Clayoquot Sound may have exceededMNPL. While it was not possible to precisely estimate MNPL for areas where harbour sealshave not been systematically surveyed but which support high concentrations of fish farms(principally the area between the north end of Quadra Island and the south end of QueenCharlotte Strait – Broughton Archipelago), a crude estimate was made by applying the meandensity of seals in surveyed areas to the unsurveyed area. These crude calculations indicate thatseal kills by salmon farmers have been on the order of 30-45% of MNPL. Kills in other regionswere generally on the order of 10-25% of MNPL, and therefore likely pose little threat to harbourseal populations.
It should be noted that the predator control kill statistics are subject to several biases, most if notall of which would tend to underestimate the impact on seal populations. There are numerousindications that not all predator control kills were accounted for in the database used for thisanalysis. While compiling the data, we came across notes that referred to kills for which therewas no record; for example, a note on one quarterly report indicated that 28 seals had been shotby the previous owner, but there was no record of any such kills, and therefore these data couldnot be included. We came across and corrected several instances where kills had beeninadvertently reported twice, but had no way of detecting cases where kills had inadvertently notbeen reported at all. Over the years, the co-author (P.O.) has been contacted on several occasionsby fish farm employees who were conducting predator control, but were not aware of reporting orsampling requirements. Quarterly reports were often compiled and submitted by company headoffices, so it is possible that kill records not communicated from individual sites would havebeen filed as nil reports. Reported kills should therefore be considered an underestimate of thenumber of kills that actually occurred. It should also be noted that MNPL estimates represent thesustained take for all human-induced mortality, and would thus include not only predator kills atsalmon farms but predator kills at spawn-on-kelp operations, subsistence harvests, entanglementin fishing gear and debris, illegal shooting, etc.
In any given year, the harbour seal kills were not uniformly distributed among fish farm sites.Instead, most of the sites reported a small number of kills whereas a few sites reported high kills(Fig. 12). On average, the 50% of licensed sites reporting the fewest kills accounted for less than10% of the total kill, whereas the 10% of licensed sites reporting the highest kills accounted for40-60% of the total kill. In many cases the same sites consistently reported few kills year-after-year, whereas others consistently reported high kills. For all years combined, 10% of licenseholders accounted for 40% of all seal kills, whereas 50% accounted for only 10% of all seal kills.
In order to assess reasons for the skewed distribution of kills, we examined the 10% of sitesreporting the highest kill rates (Table 7) in greater detail. These sites were widely distributed(Fig. 13), and in general reflected the overall distribution of fish farms (Fig. 1). Known sealhaulouts are shown in Fig. 14, and it can be seen that haulout locations over much of the coastare undocumented. Minimum distance from seal haulouts (Olesiuk 1999), where data areavailable, ranged from 1.0 to 6.8 km (mean = 3.6 km). One-third of these sites were more than 5km from the nearest haulout site, indicating that the current siting guideline of 1 km imposed by

21
the provincial government has little biological basis. However, there were many additional siteswithin 3.6 km of harbour seal haulouts that experienced very few problems. Indeed, many of thehigh-kill sites were close to sites with low kills (Fig. 13). This suggests that factors other thandistance from haulout sites affect the severity of seal predation problems or the perceived need tokill pinnipeds.
Several of the sites accounting for the highest kills seem to have dealt with the problem in recentyears, as indicated by sharply reduced kill rates in recent years. Unfortunately, a lack ofinformation on the type of infrastructure, production levels, and predator defence mechanisms atsites precluded a detailed analysis as to why this has occurred. Nevertheless, one example worthnoting is several sites in the Broughton Archipelago owned by Stolt Sea Farms. During the early1990s, these four sites were consistently in the 10% of sites reporting the highest number of sealkills and had an estimated combined kill of 616 harbour seals (Fig. 15). During this period, thecompany made numerous efforts to reduce the problem, using acoustic harassment devices(AHDs) and retensioning predator nets, but with little success. Harbour seal kills by these foursites alone were sufficiently large to have depleted the seal population in Broughton Archipelago.However, the kill rates dropped dramatically during the late 1990s when the company moved tolarge polar circle nets with Flexguard dipping, and the overall kill rate in the BroughtonArchipelago has now been reduced to a level that would allow the recovery of the harbour sealpopulation. This company has voluntarily removed firearms from the sites, and now contractsprofessional hunters to deal with the occasional nuisance seal.
Sea Lion Kills
Over the course of the predator control program (to December 31, 2000) an estimated 902 sealions were killed. This includes 316 Steller sea lions, 565 California sea lions, and 21 that couldnot be identified to species. As was the case for harbour seals, these estimates were based on thenumber and certainty of reported kills, with small corrections to account for missing reports. Anadditional 80 sea lions were shot at but escaped or were non-lethally injured.
In contrast to harbour seals, the number of sea lions killed annually has increased sharply in thepast few years, from negligible levels to a projected kill of 267 in 2000 (Fig. 16a). Since the firstsea lion kills were reported in 1991, the increase has been exponential at a annual rate of 38.1%(Fig.16b), which indicates the numbers killed have been doubling every 2.1 years. The increasewas reflected by a sharp increase in the average number of sea lions killed per licensed site (Fig.17).
As was the case with harbour seals, there is a distinct seasonal pattern in the sea lion kill, withmost being taken in the first two quarters (January-June) of each year, and virtually none in thethird quarter (July-August) (Fig. 18). This roughly coincides with the seasonal dispersal ofanimals from rookeries and offshore year-round haulout sites during the breeding season in June-August, into inshore feeding areas once breeding has been complete (Bigg 1985). It also roughlycoincides with the post-breeding northward migration of California sea lions, which breed offCalifornia but winter as far north as Vancouver Island (Bigg 1985, Bigg and Olesiuk 1988).

22
Figure 19 shows the overall seasonal pattern of sea lion kills in more detail; most kills wereconcentrated in January-April. Although sea lions actually begin arriving on winter feeding areasin September and have attained peak winter abundance by October (P. Olesiuk, unpublisheddata), predator attacks do not increase until mid-winter, which coincides with the period in whichsea lions are feeding primarily on herring and follow herring schools (P. Olesiuk, unpublisheddata). The distribution of pre-spawning herring, especially as it relates to the distribution of fishfarms, may thus be a major factor in determining the magnitude of sea lion attacks and numberskilled.
The recovery (and hence sampling) rate of sea lions reported as being positively killed showedthe seasonal patterns expected, but was again far below kill values (Fig. 20). Only 64 of 724(9%) carcasses were recovered and sampled. In most instances (96%), it was reported thatcarcasses were not retrieved because they sank. Recovery rates varied seasonally, with a distinctpeak in March-May. This coincides with the end of the winter feeding period when animals areabout to return to rookeries and offshore haulouts. Sea lions wintering off Vancouver Islandundergo pronounced seasonal fattening over winter, and are comprised of 13-19% fat by spring(Olesiuk and Bigg 1986); few would be expected to sink during the months that most are killed.
Assessing the impact of predator control kills on sea lions is not nearly as straightforward as forharbour seals. Sea lions do not exhibit the same degree of site fidelity, and undertake significantseasonal movements. While the breeding rookeries and offshore haulouts occupied during thesummer breeding season are stable over many decades and probably even centuries (Bigg 1985),most interactions with fish farms occur when sea lions are in winter feeding areas. Duringwinter, the animals are highly mobile, and tend to concentrate where prey are abundant.Branding and tagging studies have shown, for example, that California sea lions captured inPuget Sound are routinely observed on the west coast of Vancouver Island and Strait of Georgia,and can move among these areas within days (P. Olesiuk, unpublished data).
Since MNPL estimates area not available for sea lions, we estimated the impact using two stockassessment procedures. First, we calculated surplus production, which is equivalent to thecurrent rate of population increase. It represents the number of animals that can be removed thatwill result in a stable population. Second, we calculated the potential biological removal (PBR).PBR is a technique developed by U.S. stock assessment experts to estimate the allowable limitsfor human-caused mortality (Wade 1998). It represents the maximum take, with allowances forbiases in data that would maintain a population at or above MNPL. As recommended formigratory and trans-boundary stocks (Wade and Angliss 1997) the estimates were apportionedbased on the abundance and time the stock resides in Canadian waters.
California sea lions breed off the coast of California. Populations currently number about167,000-188,000 and have been increasing at 5.4-8.3% per annum (Hill et al. 1997), so the fewhundred animals killed at salmon farms does not pose a threat to the overall population.However, the waters off Vancouver Island represent only a small fraction of the wintering range,with the number of animals wintering in this region stable over the last decade at about 2,000-3,000 animals (P. Olesiuk, unpublished data). Assuming animals spend half the year in Canadianwaters, the apportioned surplus production would be on the order of 50-125, and the PBR on the

23
order of 60-90. It thus appears that in recent years, the California sea lion kills by salmon farmshave exceeded the desired sustainable level, and in the first two quarters of 2000 did so by afactor of 2-5. Considering that the kills were concentrated along the mid-west coast of VancouverIsland (MWVANISL) (Fig. 21), which represents only about 3% of the wintering range inCanadian waters but accounts for 58% of all kills, the level of killing exceeds the sustainabletake that would be apportioned to that area by a factor of about 50.
With respect to Steller sea lions, the B.C. breeding population currently numbers (as of 1998survey) about 12,000 and has been increasing at a rate of about 2-3% per annum (Olesiuk 2001).Annual surplus production is thus on the order of 240-360, and PBR on the order of 720. Duringthe last two years, kills of Steller sea lions at fish farms thus represent about 20-30% of surplusproduction and 10% of PBR for the B.C. coast. However, on a localised scale, when oneconsiders that MWVANISL represents only 5% of the B.C. coast but accounted for 58% of thetotal Steller sea lion kill, the kill in that region has exceeded surplus production by a factor of 2-3and was about equivalent to the PBR.
As was the case with harbour seals, sea lion kills were not uniformly distributed among sites.Instead, many sites reported zero or few kills whereas a few sites reported high kills, with theskewed distribution being even more pronounced than for harbour seals (Fig. 22). On average,the 80% of licensed sites reporting the fewest kills accounted for less than 10% of the totalnumber of kills, whereas the 10% of licensed sites reporting the highest kills accounted for 60-90% of the total number of kills. However, the sites reporting abnormally high kills oftenchanged from year to year, so the concentration was not quite as skewed when averaged overyears. During the past 5 years, the period in which most of the sea lion kills occurred, 50% oflicensed sites killed essentially no sea lions, the 80% of sites with the lowest kill rates accountedfor only 20% of all kills, and the remaining 20% of sites with the largest kills accounted for 80%of all sea lions killed.
In contrast to the sites reporting large harbour seal kills, which were widely distributed, the sitesreporting the largest number of sea lions kills (Table 7) were concentrated in Clayoquot Soundand Kyuquot Sound (Figs. 21 and 23). This suggests that the severity of sea lion problems maybe related to the distribution of wintering sea lions. However, not all sites in these regionsreported large sea lions kills, but due to paucity of information on infrastructure and predationdefence mechanisms employed at the various sites, other factors that may have affected theseverity of sea lion problems could not be evaluated.
Discussion
Seals and sea lions have to be successful in capturing farmed salmon if they are going to becomepersistent and problem predators to fish farms. If they are able to satisfy their food requirementsmore easily without attacking a salmon farm, and are not introduced to positive experiences (i.e.salmon rewards) in obtaining salmon from salmon farms, then they would seek food elsewhere.A minimally protected aquaculture operation presents a “textbook example” of an optimalforaging situation for predators because of its high prey density and potential for a high foragingsuccess rate. The extent of predation problems in salmon farming thus depends largely upon the

24
type of pens used and the size of available fish in the pens at a specific farm. Based upon a reportby a task force set up to study seal predation on Maine, USA, salmon farms, the NMFS (NMFS1996) recently concluded that there is no compelling reason at this time to allow Maine salmonfarmers the right to intentionally kill seals (Goldburg and Triplett 1997). Unless an aquaculturefacility is made less inviting as a forage site, it has been suggested that killing predators will beineffective predator control, as other individuals rapidly replace those killed. That appears tohave been the case in British Columbia, where after a decade of predator control, there is noevidence that removing a few “nuisance” animals alone is reducing the need to continue to killseals and sea lions.
A variety of cage shapes, designs and sizes are used throughout the salmon industry, some ofwhich are available commercially and others that are ‘home-made’ to an individual farmer’sspecifications. Tidal regime, water circulation, extent of fouling and predation are all somewhatunique to each site, and different environmental conditions may justify different net pen designs.As a result, many farms use a combination of cage shapes and sizes, depending on the range ofconditions at each site and the grades of fish in stock (Arnold 1992).
A general lack of reliable, easily accessible scientific data on the extent of the physical andeconomic impacts of predators on aquaculture is impeding progress toward resolving conflictsamong stakeholders. Anecdotal accounts and extrapolations of data from small studies to broad,industry wide application tend to be the norm for this predation data-poor industry. Much of theavailable data was obtained in the 1980s and early 1990s, when fish farming was much reducedin scale and pinniped deterrent devices were in their infancy. To make reasonable approximationsof economic impact of predation on any single aquaculture facility requires reliable data.Absolute loss has to be considered in the context of total salmon production and the deterrentdevices in use at the time of the losses.
The farming industry is now recognising the public’s feelings towards pinniped killings, and isgradually attempting to reduce production losses caused by marine mammals through the use ofimproved defence mechanisms. Success in reducing salmon predation losses are being slowlyachieved by a combination of deliberate measures to reduce the opportunities for predators to killor wound fish, and advances in predator control technology that would be expected from agrowing profitable salmon culture industry. In British Columbia, there was one dramatic example(Stolt Sea Farms in the Broughton Archipelago) where the need for predator control was sharplyreduced when the company switched to a different type of pen infra-structure. Not all industrymembers seem to be moving in the direction of reduced pinniped killing, and their need to uselethal techniques should not be used to justify the level of pinniped killings presently occurring.
No predator deterrent technology, however, will guarantee 100% protection against predationlosses. Control methods have to be effective, economically feasible, and environmentally safe.Although available technologies will provide some protection, producers now realise they cannotrely on only one method to guard against losses. An integrated approach that combines a carefulexamination of facility location, design, construction, operation, and management for minimisinglosses due to predators along with consistent application of different effective deterrenttechniques will most likely provide the best protection from predation problems.

25
Salmon farmers are no doubt aware that pinniped killings can harm their market. Some ShetlandIsland (U.K.) salmon farmers (Arnold 1992) have designed and tested several methods ofincreasing the rigidity of fish cages to prevent seals pushing the netting inward in order to catchthe salmon, thus precluding the need for predator nets and the extra expense and maintenancethat they entail. The various tensioning systems appear to have reduced seal predation at anumber of farm sites. Apparently, since installing the systems, none of the operators have felt itnecessary to shoot seals at their farms. Seal shooting is considered by the Scottish SalmonFarmers Association (SSFA) as a last resort, to be used when all other passive deterrents havefailed, and the SSFA and Scottish Salmon Growers Association guidelines stress thisemphatically.
The long-term solution for net pen complexes situated in pinniped habitats may be in engineeringto improve separation of prey from predators (extracted from Campbell 1991, Tillapaugh et al.1993, and Fraker et al. 1998). Such improvements include:
(i) tensioning and weighting of predator net walls or barriers to make them as rigid aspossible. However, much futile effort has been expended in this area withoutsuccess when the separation between the predator net and net pen (often only thewidth of the walkway) is insufficient. Recent experience suggests the rigiditycreated by dipping nets in heavy anti-foulant, such as Flexgard 11, may be aneffective solution;
(ii) surrounding complexes or individual units or aggregation sites with improvedpredator nets, such as heavy duty black nylon mesh;
(iii) employing the best deterrents around floats and walkways (net, high freeboard,etc.);
(iv) redesigning the complex to avoid narrow passageways between tightly packed unitswhere mammals may get trapped, and which provide insufficient separationbetween predator nets and net pens; and
(v) using larger enclosures to allow fish to take refuge from predators pressing againstthe outside of nets.
All these measures are becoming easier for farm enterprises to utilise, as net pen units haveincreased substantially in size with growing economies of scale.
The long-term solution may be for net pen farm complexes to either move away from coastalhaul outs and rookeries or to become land-based. Offshore relocation is now more feasible, andthe new generation of oceanic farms is moving away from gravity cages and sheltered watertechnology. The modern higher-class cages are built around a system of spar buoys and morerigid net panels (Ocean Spar Technologies). Fish farms in Norway are already moving furtheroffshore in search of high quality water and to avoid near shore algal blooms.

26
Identified Research Needs
Fraker et al. (1998) identified the following research requirements:
a. Presently it is not possible to reliably distinguish among fish killed by river otter, seals andsea lions. To assess the effectiveness of various countermeasures, it is important to developmeans to accurately assign mortality to the proper species;
b. There are few direct observations of seals and sea lions attacking farm fish. A betterunderstanding of how these animals respond to netcages and farm fish could lead toimproved countermeasures;
c. There has been virtually no attempt to systematically study the effectiveness of variousnetcage systems and associated predation counter measures. An appropriate documenting ofinformation related to predation should lead to a “weight of evidence” which will showwhich systems work well to prevent losses to predators;
d. The relationship between distance from pinniped haulout sites and the amount of loss frompredation may be non-existent and needs to be better understood;
e. The present approach is to develop site–specific, custom netcage designs separately for eachfarm location. Research is needed to consider the effects of such variables as mesh size,current regime; optimal distances of predator nets from primary nets under differentconditions in order to maintain an adequate separation, and how to engineer netcages toreduce drag; and
f. New materials and new treatments (anti-foulants) may offer an improved barrier to predators,and the potential here needs investigation.
Iwama et al. (1997) identified the following research requirements:
a. all pinniped haulouts should be surveyed and mapped to improve information for sitingdecisions;
b. pinniped population assessments in areas of aquaculture should be conducted;c. predation problems, pinniped-farm interactions, and an inventory of pen and predator control
systems should be documented and quantified; andd. studies of pinnipeds in captivity should be undertaken to understand the dynamics of their
interactions with netpens.
These research needs are likely to evolve as the industry develops and adopts new approaches fordealing with predators. For example, treating nets with anti-foulants appears to be a promisingmethod for stiffening nets and thereby deterring seal attacks, but environmental impacts ofwidespread use of such chemical now need to be considered. Industry needs to take mostresearch responsibility, but collaboration with resource management agencies may be appropriateon some topics, such as (a), (b) and (d) above. The former BC Ministry of Fisheries was studyingthe degree of overlap between existing salmon farms and sensitive fish and wildlife habitats, andthis may include pinniped haulouts, but no results are yet available (B. Carswell, BCMF,Victoria, BC, pers. comm.).

27
Conclusions
It was concluded that:
1. There is insufficient data on which to pass scientifically defensible judgements on the currentkilling of pinnipeds by fish farmers in British Columbia: salmon losses, prior usage ofdeterrent measures and their documented ineffectiveness, and biological data on killedpinnipeds are poorly documented. Reported kill records are submitted by fish farmers, butthere are no means by which to verify the data, and there is reason to expect that such reportsunderestimate actual kill rates.
2. There is no supporting data to indicate that killings are only being conducted as a last resort.Most killings of pinnipeds are being undertaken at a minority of tenure sites, and these areoften in close proximity to sites reporting few killings. DFO policy requires strictdocumentation of the use of alternate deterrent measures, but such documentation isunavailable.
3. There is little evidence to date that interests from the broader client base of DFO (tourism,environmentalists, etc.) are providing effective input into developing alternative solutions tothe killing of pinnipeds.
4. Data presented here suggest that kill rates of pinnipeds have been and continue to beexcessive from a pinniped stock management perspective, and in some harbour seal cases,have been sufficient to reduce local populations. With sea lions, kill numbers are rapidlyincreasing.
5. The ecosystem implications of current pinniped kill rates remain to be addressed.6. Additional scientific analyses will require an improved data collection process, and funding
to implement required pinniped population assessments and habitat requirements.
Since there is no available evidence that documents that pinniped kills are necessary, animmediate withdrawal of predator control licences issued to fish farmers should be consideredand a re-evaluation of DFO’s predator control licencing system conducted.
Recommendations
a) Develop and maintain an on-going data base for all fish farm sites that documents:i) type of netpen and infrastructure being used; ii) predation control devices andtactics; iii) extent of salmon losses to pinnipeds by date with descriptions as to thecircumstances relating to the losses. This could be accomplished by requiring eachlicensed site to submit a predation control plan providing detailed information. Thiswould facilitate an up-to-date analysis of effective and ineffective pinniped deterrentmechanisms, and to document benefits and/or costs resulting from predation controlmeasures.
We could find no database within DFO that documents the non-destructive predation controlmeasures in use at farms over time, even though farmers are required to demonstrate that allsuch reasonable devices are being used before they could obtain a license to kill pinnipeds.As a follow-up to this, it would seem appropriate that at the farms where pinnipeds are being

28
killed, an annual review of such devices in use should be conducted to determine why thedevices in use were not effective.
b) Pinniped killings need to be justified and documented and, so as to insure accurate
documentation, should only be undertaken by qualified licensed hunters under thesupervision of DFO experts and only after the DFO has verified substantial farm losses,has evaluated the predation control devices in use at the farm, and has justified theneed to kill selected pinnipeds. More serious effort is needed to recover carcasses andcollect biological data from kills, and these data need to be analysed in a timely manner. The high level of killings at specific farms and a lack of required data on pinnipeds actuallykilled (an unacceptable level of killed pinnipeds are claimed to have “sunk” and were nottherefore sampled) indicates that there is currently inadequate control of pinniped killings. Itmust also be recognised that kill estimates are subject to biases that would tend tounderestimate the number of animals killed and underestimate the impact on seal and sea lionpopulations. It is expected the incentive for under-reporting will grow now that there is a highpublic interest and because expansion of the aquaculture industry may in part hinge on thenumber of predators being killed. Given the DFO’s mandate under the Oceans Act tominimise unjustified killing of all marine life, whether as bycatch in species-targeted fisheriesor in predation controls in aquaculture, and the high economic value now associated withmarine mammals, a documented and transparent process needs to be established that can beused to clearly justify all pinniped killings. Current predator control licences issued to fishfarms could be rescinded, and licences to kill pinnipeds could be only issued to appropriatehunters for use under supervised situations. Approved hunters should be trained and equippedto recover and sample carcasses for biological monitoring purposes. Data and specimencollection should then be accompanied by regular analysis and interpretation. This wouldcontribute to an improved understanding of the nature and magnitude of the interaction, andin turn could lead to more effective methods of reducing such interactions.
c) Pinniped monitoring programs need to be developed to obtain baseline data on the
abundance and distribution of pinnipeds prior to farms being located in a region, andto monitor impacts of predation control once farms have been established. Expansionof the aquaculture industry should only be permitted in areas where baselinedistribution on seals and sea lions exists, so that the potential impacts of predationcontrol can be assessed and monitored. DFO (1997) stated that “given that the coastal seal population is in excess of 100,000 and hasan annual surplus production of about 12.5%, it is clear that this population is notcompromised by mortalities attributed to predator licensing.” However, given the localisedmovements and lack of genetic dispersal of harbour seals, it seems unreasonable to assess theimpacts of kills concentrated in specific areas on a province-wide basis. The analysespresented in this assessment in fact suggest that, on a regional basis, pinniped kills by fishfarmers have in some cases exceeded sustainable pinniped production levels and may havedepleted local abundance. Baseline surveys are required in areas where salmon farms havealready been established, particularly the area between the north end of Quadra Island and thesouth end of Broughton Archipelago / Queen Charlotte Strait, and in areas where industrymay expand, such as the central/northern mainland coast north of Cape Caution, as has

29
previously been identified as a priority by PSARC (Olesiuk 1999). Monitoring programsneed to be established in areas with a high density of salmon farms, such as ClayoquotSound, which to date has only been surveyed once.
d) Further expansion of fish farms on the west coast of Vancouver Island should not be
allowed until it has been demonstrated that an acceptable resolution to the sea lion-fishfarm conflict has been addressed. There has been a rapid exponential increase in sea lion kills along the west coast ofVancouver Island in recent years, and kill rates now far exceed what would be allocated tothis region on the basis of its size. The high incidence of sea lion kills in Clayoquot Soundshould be reviewed to determine whether it is compatible with the recent designation of thearea as a UN Biosphere Reserve.
e) The existing siting guideline used by the Provincial Government of not siting fish farms
within one km of a seal haulout location does not appear to have a biological basis, andit is recommended that siting guidelines in relation to pinniped haulout locations bereviewed and revised. Most of the sites experiencing even the very highest kill rates are situated further than 1 kmfrom the nearest seal haulout, and one-third are over 5 km from the nearest seal haulout.Telemetry studies indicate daily foraging movements of harbour seals are typically in therange of 10 km.
f) Research and management recommendations within published reports on pinnipedkillings should be reviewed, priorities determined, and a plan to address them should beprepared. There have been a number of previous reports (e.g., Malouf 1986, Iwama et al. 1997, Frakeret al. 1998) that recommended specific research topics and/or management actions. As thelead agency responsible for pinniped management, DFO should take a more responsible andproactive role in determining whether pinniped kills are necessary and in ensuring that allkills are justified and conducted humanely, rather than leaving these decisions to theaquaculture industry.
g) DFO should conduct an environmental assessment of enclosures that have nettingheavily impregnated with anti-foulant to determine the risks of leaching .It appears that certain types of netpen design, such as that described above, appear to have bequite successful at reducing salmon losses due to pinnipeds, at least for harbour seals. Whileindustry should be encouraged to move toward this type of design from a predator controlperspective, it was beyond this review to consider the overall environmental acceptability ofsuch systems. Flexgard 11 has apparently been approved by Canada for use in aquaculture,but the broader environmental aspects of this and other products should be assessed. It wouldalso be useful to determine whether such enclosures are as effective at deterring sea lionattacks.

30
Acknowledgements
Much of the background material on salmon losses and pinniped deterrent procedures for thisreport were gathered and collated by Luanne Chew and Tom J. Brown, respectively, for whichwe thank them. Barron Carswell, Bill Harrower and Andy Thomson helped in the acquisition ofgrey literature reports and data. We thank Ron Ginetz, Ed Lochbaum and Marly Wietzke forproviding access to the DFO records; and Georg Jorgensen, Faith LaFlave, and Lisa Lacko fordeveloping and compiling the records into an Access database. Linda Nichol updated a numberof the figures to include all 2000 and the first three quarters of 2001 data. Ed Lochbaum, andDrs. Mark Fraker and John Pringle, along with two anonymous reviewers, provided usefulcritiques.

31
References
Anderson, D. P. 1990. Immunological indicators: Effects of environmental stress on immuneprotection and disease outbreaks. Am. Fish. Soc. Symposium 8:38-50.
Anderson, S.S. and A.D. Hawkins. 1978. Scaring seals by sound. Mammal. Rev. 8: 19-24.
ARA Consulting Group Inc. (1994). The British Columbia farmed salmon industry: Regionaleconomic impacts. Prepared for the BC Salmon Farmers Association, Agriculture and Agri-Foods Canada, and Ministry of Agriculture, Fisheries and Food. Vancouver, B.C: BC SalmonFarmers Association.
ARM (Aquaculture Risk Management). 2000. Newsletter 2000. Sunderland Marine MutualInsurance Company Ltd. 17pp.
Arnold, H. 1992. Experimental predator control measures on marine salmon farms in Shetland.Report submitted to the Planning and Coordinating Committee of the Marine MammalAction Plan, United Nations Environment Program. Greenpeace, UK. 19pp.
BC Fisheries. 2000a. The 1999 British Columbia Seafood Industry Year in Review.http://www.bcfisheries.gov.bc.ca/Pdf/Seafood_Industry_YIR_99.pdf
BC Fisheries. 2000b. British Columbia Salmon Farm Tenures data. Provided by BarronCarswell, BC Fisheries.
BCSFA. 2000b. Salmon farmers seek non-lethal solutions to predator problem. BC SalmonFarmers’ Association News Release, May 4, 2000.
Bigg, M.A. 1985. Status of Steller sea lion (Eumetopias jubatus) and California sea lion(Zalophus californianus) in British Columbia. Can. Spec. Publ. Fish. Aquat. Sci. No. 77.20pp.
Boulva, J. and I. A. McLaren. 1979. Biology of the harbour seal, Phoca vitulina, in easternCanada. J. Fish. Res. Board Can., Bull. No. 200. 24 pp.
Bowen, W.D. 1997. Role of marine mammals in aquatic ecosystems. Mar. Ecol. Prog. Ser. 158:267-274.
Burg, T.M., A.W. Trites, and M.J. Smith. 1999. Mitochondrial and microsatellite DNA analysesof harbor seal population structure in the northeast Pacific Ocean. Can. J. Zool. 77: 930-943.
Campbell, R. 1991. Non-Destructive Predator Controls on Fish Farms, A Report for the MarineConservation Society, Ross-on- Wye, England.

32
Coopers and Lybrand. 1997. Economic Impacts of the British Columbia Salmon FarmingIndustry. Report prepared for the BCSFA.
Cottrell, P. E. 1995. Diet, activity budgets, and movement patterns of harbour seals (Phocavitulina) in Cowichan Bay and adjacent areas. MSc. Thesis, University of Victoria,Victoria, B.C. 118p.
DFO. 1997. Interactions with Marine Mammals and Other Species. DFO Response to theTechnical Advisory Team Discussion Paper: Iwama et al., 1997.
DFO. 2000. Aquaculture Production Statistics.http://www.ncr.dfo.ca/communic/statistics/aquacult/Aqua_E.htm
Dixon, B.M. 1989. Predator control on fish farm sites: statutory and administrative problems.Unpublished MPA Thesis. University of Victoria. 50pp.
EAO. 1997. Salmon Aquaculture Review. Environmental Assessment Office, Vancouver, BC,Canada. http://www.eao.gov.bc.ca/project/aquacult/salmon/report/V1chp8.htm
Fisher, H. D. 1952. The status of the harbour seal in British Columbia, with particular referenceto the Skeena River. Bull. Fish. Res. Bd. Canada. No. 93. 58 pp.
Fraker, M. 1996. Interactions between salmon farms and marine mammals and other species.Report prepared for the BC Salmon Farmers Association. 25pp.
Fraker, M., W. Duval and J.A. Kerr. 1998. Report of a Workshop on Physical CountermeasuresAgainst Predation by Seals and Sea Lions at Salmon Farms. BCSFA, Vancouver, BC. 40pp.
Gearin, P.J., R. Pfeifer and S. Jeffries. 1986. Control of California sea lion predation of winter-run steelhead at the Hiram M. Chittenden Locks, Seattle, December 1985 – April 1986 withobservations of sea lion abundance and distribution in Puget Sound. Wash. Dept. Game Fish.Manage. Rept. No. 86-20. 108pp.
Gearin, P.J, R. Pfeifer, S.J. Jeffries, R.L. DeLong, and M.A. Johnson. 1988. Results of the1986-1987 California sea lion – steelhead trout predation control program at the Hiram M.Chittenden Locks. NWAFC Processed Rept. No. 88-30. 111 pp.
Goldberg, R. and Triplett. 1997. Murky Waters: Environmental Effects of Aquaculture in the US.Environmental Defense Fund
Goodman, S.J. 1998. Patterns of extensive genetic differentiation and variation amongEuropean harbour seals (Phoca vitulina vitulina) revealed using microsatellite DNApolymorphisms. Molecular Biology and Evolution 15: 104-118.

33
Haller, D.R. and D.D. Lemon. 1994. Acoustic source levels of AirMar and PRA seal-scarers.Dept. Fisheries and Oceans Contr. Rept. No. XSA FP941-3-8025/00/A. 52p.
Hill, P.S., D.P. DeMaster, and R.J. Small. 1997. Draft Alaska Marine Mammal StockAssessments. U.S. Dept. Commer., NOAA. NOAA Tech. Memo. NMFS-AFSC-78,150p.
Howell, C.L. and J.G. Munford. 1992. Predator control on finfish farms. In DePauw, N. and J.Joyce (eds.) Aquaculture and the Environment. European Aquaculture Society Specialpublication No. 16, Gent, Belgium. pp 339-364.
Iwama, G., L. Nichol, and J. Ford. 1997. Aquatic mammals and other species. In SalmonAquaculture Review. Environmental Assessment Office, Vancouver, BC, Canada.
Johansen, R. and R. Eliassen. 1999. Damages caused by marine predators in fish farms: Jointreport for north Troendelag, Nordland, Troms and Finnmarks counties. Nordlands ForskningReport No. 6. Abstract.
Johnston, D. 1999. Effects of acoustic harassment devices on harbour porpoises (Phocoenaphocoena) in the Bay of Fundy, Canada. Abstract, 13th Biennial Conference on theBiology of Marine Mammals, Maui, Hawaii, 28 Nov. – 3 Dec, 1999.
LaMont, M.M., J.T. Vida, J.T. Harvey, S. Jeffries, R. Brown, H.H. Huber, R. DeLong, and W.K.Thomas. 1996. Genetic substructure of the Pacific harbor seal (Phoca vitulina richardsi)off Washington, Oregon, and California. Marine Mammal Science 12: 402-413.
Marine Mammal Commission. 1995. The Marine Mammal Protection Act of 1972 as Amended.Washington, DC.: 264 pp.
Malouf, A. 1986. Seals and sealing in Canada. Report of the Royal Commission on Seals andSealing Industry in Canada. Vol.3. (Government of Canada Report) 679 pp.
Mate, B.R. and J.T. Harvey. 1987. Acoustical deterrents in marine mammal conflicts withfisheries. Oregon State Univ. Publ. No. ORESU-W-86-001. 116p.
Morton, A. 2000. Occurrence, photo-identification and prey of Pacific white-sided dolphins(Lagenorhyncus obliquidens) in the Broughton Archipelago, Canada, 1984-1998. MarineMammal Sci. 16(1): 80-93.
Nash, C.E., R.N. Iwamoto, and C.V.W. Mahnken. 2000. Aquaculture risk management andmarine mammal interactions in the Pacific Northwest. Aquaculture 183: 307-323.
NMFS. 1996. Report of Gulf of Maine aquaculture-pinniped interaction task force. Office ofProtected Resources, National Marine Fisheries Service, Silver Spring, MD. 70pp.

34
NMFS, 1999. Environmental assessment on testing a pulse powered generator to reduceCalifornia sea lion depredation of gear and catch aboard an actively fishing charter boat offsouthern California. Draft Report. 96p.
Nicol, L.M. and M.J. Sowden. 1994. The effect of an acoustic deterrent device (ADD) on therelative abundance and distribution of harbour porpoise (Phocoena phocoena) at a studysite in coastal British Columbia. Contract Report No. FP597-4-3004/01-XSA.
NOAA. 1997. Impacts of California sea lions and Pacific harbor seals on salmonids and on thecoastal ecosystems of Washington, Oregon, and California. National Oceanographic andAtmospheric Administration Tech. Memo. NMFS-NWFSC-28.
NOAA. 1999. Report to Congress: Impacts of California sea lions and Pacific harbor seals onsalmonids and west coast ecosystems. U.S. Department of Commerce, NationalOceanographic and Atmospheric Administration. 18pp.
Norberg, B., 1998. Testing the effects of acoustic deterrent devices on California sea lionpredation at a commercial salmon farm. NMFS-NFWSC
O’Boyle, R. 2000. Proceedings of a workshop on the ecosystem considerations for the EasternScotian Shelf Integrated management (ESSIM) Area. Bedford Inst. Oceanogr. 19-23 June,2000. 12pp.
Olesiuk, P.F. 1993. Annual prey consumption by harbor seals (Phoca vitulina) in the Strait ofGeorgia, British Columbia. Fish. Bull. 91:491-515.
Olesiuk, P. F. 1999a. An assessment of the status of harbour seals (Phoca vitulina) in BritishColumbia. Department of Fisheries and Oceans, Canadian Stock Assessment Secretariat,Res. Doc. 99/33.
Olesiuk, P.F. 1999b. Daily activity budgets and foraging patterns of harbour seals (Phocavitulina) in the Strait of Georgia, British Columbia. Abstract, 13th Biennial Conferenceon the Biology of Marine Mammals, Maui, Hawaii, 28 Nov. – 3 Dec, 1999.
Olesiuk, P.F. 2001. Recent trends in the abundance of Steller sea lions (Eumetopias jubatus) inBritish Columbia. National Marine Mammal Review Committee Working Paper 2001-10. 29pp (not citable).
Olesiuk, P.F. and M.A. Bigg. 1986. Seasonal fattening in adult male Steller sea lions(Eumetopias jubatus) in British Columbia. DFO, unpublished Manuscript. 27pp.
Olesiuk, P. F. and M. A. Bigg. 1988. Seals and sea lions in British Columbia. Department ofFisheries and Oceans Special Publ. 12 pp.

35
Olesiuk, P. F. and T. G. Smith. 1992. Harbour seal – fishery conflicts on the British Columbiacoast: A report for senior management within the Department of Fisheries and Oceans.Department of Fisheries and Oceans, Pacific Biological Station, Nanaimo, B.C. V9R5K6. Unpublished Report.
Olesiuk, P. F., D. Burles, G. Horonowitsch and T. G. Smith. 1993. Aerial censuses of pinnipedsin the Queen Charlotte Islands, 1 July - 1 August, 1992. Can. Manuscr. Rep. Fish. Aquat.Sci. No 2217. 27 pp.
Olesiuk, P. F., G. Horonowitsch, G. M. Ellis, T. G. Smith, L. Flostrand and S. Warby. 1995a.Predation by harbour seals (Phoca vitulina) on outmigrating salmon (Oncorhynchus spp.)fry and smolts in the lower Puntledge River, British Columbia. PSARC working paperS95-10. 114 pp.
Olesiuk, P.F., L.M. Nicol, M.J. Sowden and J.K.B. Ford. 1995b. Effect of sounds generated byan acoustic deterrent device on the abundance and distribution of harbour porpoise(Phocoena phocoena) in Retreat Passage, British Columbia. Unpublished Manuscript.Department of Fisheries and Oceans, Pacific Biological Station, Nanaimo, B.C. 47pp.
Olesiuk, P. F., T. G. Smith, G. Horonowitch and G. M. Ellis. 1997. Translocation of harbourseals (Phoca vitulina): A demonstration of homing ability and site fidelity. Abstract. 10thBiennial Conf. Biol. Marine Mammals, Orlando, Florida.
Olesiuk, P.F., L.M. Nicol, M.J. Sowden and J.K.B. Ford. Effect of sounds generated by anacoustic harassment device on the abundance and distribution of harbour porpoise(Phocoena phocoena) in Retreat Passage, British Columbia. Marine Mammal Science (inpress).
OTA 1995, U.S. Congress, Office of Technology Assessment, Selected Technology Issues in U.S.Aquaculture, OTA-BP-ENV-171 (Washington, DC: Office of Technology Assessment,September 1995).
Parkinson, A. and R. Deegan. 1987. Predator Control: the How To’s. Aquaculture Information,Agriculture and Fisheries Information Bulletin No. 9-1, British Columbia. 4pp.
Pemberton, D. and P. Shaughnessy. 1989. The interaction between seals and fish farms inTasmania. Interim report prepared for the Department of Lands, Parks and Wildlife,Tasmania. 96pp.
Pemberton, D., N. Brothers, and G. Copson. 1991. Predators on marine fish farms in Tasmania.Papers and Proceedings of the Royal Society of Tasmania 125: 33-35.
Pemberton, D. and P. Shaugnessey. 1993. Interactions between seals and marine fish farms inTasmania, and management of the problem. Aquatic Conservation: Marine and FreshwaterEcosystems 3: 149-158.

36
Pitcher, K.W. 1986. Variation in blubber thickness of harbor seals in southern Alaska. J. Wildl.Manage. 50:463-466
Price Waterhouse, and Department of Fisheries and Oceans (1993). Long term productionoutlook for the Canadian aquaculture industry. Ottawa: Department of Fisheries and Oceans.
Reeves, R.R., R.J. Hofman, G.K. Silber and D. Wilkinson. 1996. Acoustic deterrence ofharmful marine mammal-fishery interactions: Proceedings of a workshop held in Seattle,Washington, USA, 20-22 March, 1996. 68p. NOAA tech. Memorandum NMFS-OPR-10
Ross, A. 1988. Controlling nature’s predators on fish farms. Prepared for the MarineConservation Society, Scotland. 96pp.
Rueggeberg, H. and J. Booth. 1989. Interactions between wildlife and salmon farms in BritishColumbia: results of a survey. Technical Report Series No. 67, Canadian Wildlife Service,Pacific and Yukon Region, BC. 74pp.
Spalding, D.J. 1964. Comparative feeding habits of the fur seal, sea lion and harbour seal on theBritish Columbia coast. Bull. Fish. Res. Bd. Canada No. 146. 52pp.
Stanley, H.F., S. Casey, J.M. Carnahan, S. Goodman, J. Harwood, and R.K. Wayne. 1996.Worldwide patterns of mitochondrial DNA differentiation in the harbor seal (Phoca vitulina).Molecular Biology and Evolution 13: 369-382.
Taylor, B. L. and D. P. DeMaster. 1993. Implications of non-linear density dependence. MarineMammal Science 9:360-371.
Tillapaugh, D., C. Brenton, and B. Harrower. 1993. Predation on salmon farms in BritishColumbia: the impacts of harbour seals (Phoca vitulina). The results of a 1991 survey.Commissioned by the BC Ministry of Agriculture, Food and Fisheries. 49pp.
Trites, A.W. 1997. The role of pinnipeds in the ecosystem. In Pinniped populations, easternnorth Pacific: status, trends and issues. Eds. G. Stone, J. Goebel and S. Webster. Pages 31-39. A symposium of the 127th Annual Meeting of the American Fisheries Society. NewEngland Aquarium, Conservation Department, Central Wharf, Boston, MA 02110.
van de Wetering, D. 1989. Marine mammal – salmon farm interactions on the B.C. coast.Unpublished B.Sc. thesis. The University of British Columbia, Dept. of Animal Science.30pp.
Wade, P.R. 1998. Calculating limits to the allowable human-caused mortality of cetaceans andpinnipeds. Marine Mammal Sci. 14(1): 1-37.

37
Wade, P.R. and R.P. Anglis. 1997. Guidelines for assessing marine mammal stocks: report ofthe GAMMS workshop April 3-5, 1996, Seattle, Washington. NOAA Tech. Mem.NMFS-OPR-12.
Westlake, R.L. and G.M. O’Corry-Crowe. Macro-geographic structure and patterns of geneticdiversity in Pacific harbor seals (Phoca vitulina) from Alaska to Japan as revealed bymitochondrial DNA. Marine Mammal Science (in press).

38
Table 1: Regional summary of BC fish farm tenures in 2000. Source: BC Fisheries 2000b
Region No. offarms
Region No. offarms
North Coast 1 Queen CharlotteStrait
7
Quatsino Sound 6 BroughtonArchipelago
24
Kyuquot Sound 5 Knight Inlet 3Nootka Sound 3 Johnstone Strait 8Clayoquot Sound 24 Discovery Passage 15Barkley Sound 4 Desolation Sound 9Sooke Basin 1 Jervis Inlet 4Saltspring Islands 3 Sechelt Inlet 6
Table 2. Number of salmon farming companies and grow-out sites, 1988-1996. Sources: PriceWaterhouse (1993), ARA (1994), Coopers & Lybrand (1997), and data from 3 non-B.C. SalmonFarmers' Association (BCSFA) companies. n/a.- not available. *May include some fallow sites.(http://www.eao.gov.bc.ca/PROJECT/AQUACULT/SALMON/report/V1chp2.htm)
1988 1991 1993 1996
Number of Salmon Farming Companies101 n/a 17 16
Number of Active Grow-Out Sites 118 n/a 88* 79Average Number of Sites per Company 1.16 2.27 5.18 4.94

39
Table 3. Distribution of salmon farming companies by level of production (% of total numbercompanies). *Does not add due to rounding. Sources: ARA (1994), Coopers & Lybrand (1997),and data from 3 non-BCSFA companies.(http://www.eao.gov.bc.ca/PROJECT/AQUACULT/SALMON/report/V1chp2.htm)
Production Level 1993 1996
Less than 500 tonnes 35.3 25.0500—999 tonnes 23.5 18.71000-1999 tonnes 17.6 18.7larger than 2000 tonnes 23.5 37.5TOTAL 100.0* 100.0
Table 4. Distribution of active grow-out sites by Regional District (% of total number of activesites). Sources: ARA (1994), Coopers & Lybrand (1997), and data from 3 non-BCSFAcompanies. (http://www.eao.gov.bc.ca/PROJECT/AQUACULT/SALMON/report/V1chp2.htm)
Regional District 1993 1996Alberni-Clayoquot 17 23Comox-Strathcona 25 35Mount Waddington 28 27Nanaimo, Cowichan, Capital 0 10Sunshine Coast & Powell River 30 5TOTAL 100.0 100.0

40
Table 5: Reported estimates of salmon losses due to pinniped predation.
Date/Timespan Scope Pinnipeds-related losses Reference1 year Overall Scottish fish farm
industry estimate of directpredation loss
£1,400,000 - £4,800,000 Ross, 1988
1 year 41 Scottish farmquestionnaires min/maxestimate of directpredation loss
£377,560 - £452,500 Ross, 1988
1 year 45 Scottish farminterviews min/maxestimate of directpredation loss
£880,470 - £1,391.070 Ross, 1988
1986-87 FiscalYear
Survey of 9 Tasmanianfish farms
A$320,000 total financial loss due toseal attacks
Pemberton and Shaughnessy,1989
1987 29 BC fish farms 79,180 fish directly lost to wildlifepredation
van de Wetering, 1989
1987 3 BC fish farms 49,000 fish lost through net pendamage
Van de Wetering, 1989
1988 19 fish farms in theBCSFA
56,300 fish lost through direct sealpredation or related stress
Rueggeberg and Booth, 1989
1988 6 fish farms in the BCSFA 3,000 fish lost through direct sea lionpredation or related stress
Rueggeberg and Booth 1989
1988 68 fish farms in theBCSFA
44,000 fish lost through net-pendamage from all wildlife (seals, sealions and otters)
Rueggeberg and Booth 1989
1988 68 fish farms in theBCSFA
1% total production due to seals andsea lions
Rueggeberg and Booth 1989
1991 Scottish fish farm industry 2% total production due to predator-related damage
Campbell 1991
1990 Scottish fish farm industry C$2.0 million estimated loss Tillapaugh et al. 19931990-91 BC salmon farm industry C$4 million estimate from direct kills
and net damage escapesTillapaugh et al. 1993
1 year Tasmanian range ofannual farm stock loss
A$10,000 to A$175,000 Pemberton and Shaughnessy1993
1 year 1 Tasmanian farm A$500,000 Pemberton andShaughnessy1993
1994 Gulf of Maine 10% of an annual farm-gate value ofUS$50 million
NMFS 1996
1994 BCSFA C$10-12 million = 6.1-7.3% totalindustry production
NMFS 1996
1996 BCSFA C$10 million Fraker 19961996 BC review “Substantial” EAO 1997October 1995 toJune 1996
1 Puget Sound farm 71,449 fish ~ US$1.67 million ~4-5% production at harvest
NOAA 1997
1 night 1 BCSFA farm 2,500 fish, worst reported loss Fraker et al. 19981 stock generation 1 BCSFA farm 60,000 fish, worst reported loss Fraker et al. 19982-week period 1 BCSFA farm 5,000 fish, worst reported loss Fraker et al. 1998Unspecified 216 Norwegian farms in 4
counties5% total production Johansen and Eliassen 1999
1996 1 Puget Sound farm 86,000 fish Nash et al. 20001997 1 Puget Sound farm 114,000 fish Nash et al. 2000Recent 6-monthperiod
Tasmanian SalmonidGrowers Association
2% production Nash et al. 2000

41
Table 6: Insurance Company figures for fish farm claims due to predator-related loss
Date Scope InsuranceCompany
Insurance claims paid outfor pinniped-related losses
Reference
1991 Eastern Canada Unspecifiedreport
C$1,400,000, mostly due toseal damage
Tillapaugh et al.1993
1994 Eastern Canadaand Gulf ofMaine
Mitchell,Mcconnell,Daniels InsuranceBrokers
C$1,000,000 NMFS 1996
1995to1997
Canada,Norway andUSA
Vesta Insurance 10-20% loss claims due topredator-related net damage
Fraker et al.1998
1996 Unspecified Vesta Forsk NKr 1.2 million Nash et al. 20001997 Unspecified Vesta Forsk NKr 0.52 million Nash et al. 20001999 Worldwide Sunderland
Marine MutualInsurance Co.
5% aquaculture claims byvalue; 12% aquacultureclaims by frequency
AquacultureRiskManagement2000

42
Table 7: Site locations reporting the greatest number of harbour seal and sea lion kills (top 10%).Number killed represent the total kill during 1991 to the end of the 2nd quarter in 2000.
Site Name: Latitude Longitude Number ofHarbour Seals
KilledBarnes Bay, Okis Island 50 19.3 125 15.6 76Wehlis Bay, Wells Passage 50 51.9 126 55.3 81Thurlow Point 50 24.5 125 20.4 81Eden Island, Potts Bay 50 46.2 126 39.4 86Larsen Island, Indian Channel 50 36.3 126 37.8 87Simmonds Point, Wells Passage 50 52.7 126 54.3 90Conville Point, Quadra Island 50 11.4 125 8.5 97Sir Edmund Bay, Broughton Inlet 50 49.9 126 35.7 107Oil Bay, Read Island 50 9.4 125 8.7 113Midsummer Island 50 39.4 126 39.9 125Thorpe Point 50 34.8 127 36.6 133Power Bay, North Hardy Island 49 45.2 124 10.8 163Conville Bay, Quadra Island 50 10.8 125 9.0 235Swanson Island 50 37.2 126 42.4 356
Site Name: Latitude Longitude Number Sealions Killed
Penny Creek, Alberni Inlet 49 7.0 124 49.4 17McCall Islet 49 8.5 125 43.6 19Saranac Island 49 14.8 125 54.2 21Pinnace Channel, Hohoae Island 50 2.0 127 12.6 21Bawden Point, Herbert Chnl 49 18.3 126 0.5 26Dixon Bay, Shelter Inlet 49 24.2 126 9.2 27Amai Inlet, Amai Pt. 50 1.5 127 8.8 31Baxter Islet 49 8.0 125 47.0 34Dixie Cove, Hohoae Island 50 2.3 127 10.5 41Binns Island 49 20.4 125 56.9 41South Shelter, Flores Island 49 23.1 126 10.3 50Centre Cove, Whiteley Island 50 0.8 127 11.7 93Ross Passage 49 19.4 126 2.9 105

43
Quatsino Sound
Kyuquot Sound
Nootka Sound
Clayoquot Sound
Barkley Sound
Sooke Basin
Knight InletDiscovery Passage
Desolation Sound
Jervis Inlet
Sechelt Inlet
Broughton ArchipelagoQueen Charlotte Strait
JohnstoneStrait
NorthCoast
Saltspring Islands
Figure 1: Locations of BC Fish Farm Tenures (BC Fisheries, 2000b)
**Please note: Color Figures available on internet**

44
Figure 2: Salmon culture production in British Columbia (DFO statistics,http://www.ncr.dfo.ca/communic/statistics/aquacult/aqua_e.htm)
0
10000
20000
30000
40000
50000
60000
1986 1987 1988 1989 1990 1991 1992 1993 1994 1995 1996 1997 1998 1999Year
Har
vest
(ton
nes)
$0
$50
$100
$150
$200
$250
$300
Farm
gate
Val
ue (m
illio
ns)
HarvestFarmgate Value

45
Figure 3. Number of licenses issued per year, and number of license holders reporting predatorkills each year. 2001 data not included because data from the last quarter of the year isunavailable.
0
20
40
60
80
100
120
140
160
1991 1992 1993 1994 1995 1996 1997 1998 1999 2000
Num
ber o
f Sea
Lio
ns K
illed

46
Figure 4. Distribution of predator control licenses by geographic area by year. The geographicareas correspond with those used to assess harbour seal populations (for a map of locations,seeFigure 1 in Olesiuk 1999a). BROUGHT = Broughton Island Archipelago, NEQCSTR = eastportion of Queen Charlotte Strait, SWQCSTR = west portion of Queen Charlotte Strait,NWVANISL = northwest Vancouver Island, MWVANISL = middle west Vancouver Island,BARKLEYSD = Barkley Sound, SWVANISL = southwest Vancouver Island, JERVIS = JervisInlet, NEGULF = northeast Strait of Georgia, and GULFISL = Gulf Islands.
0%
10%
20%
30%
40%
50%
60%
70%
80%
90%
100%
1991 1992 1993 1994 1995 1996 1997 1998 1999 2000
Cum
ulat
ive
Perc
ent
UnsurveyedBROUGHTNEQCSTRSWQCSTRNWVANISLMWVANISLBARKLEYSDSWVANISLJERVISNEGULFGULFISL

47
Figure 5. Estimated number of harbour seals killed and estimated number that escaped or wereonly injured by year.
Figure 6. Estimated average number of harbour seals killed per licensed site, and per licensedsite reporting kills, by year.
0
2
4
6
8
10
12
14
1989 1990 1991 1992 1993 1994 1995 1996 1997 1998 1999 2000
Num
ber o
f Sea
ls K
illed
per
Site
Licensed SitesSites Reporting Kills
0100200300400500600700800900
1989
1990
1991
1992
1993
1994
1995
1996
1997
1998
1999
2000
Num
ber o
f Sea
ls
KilledInjured/Escaped

48
Figure 7. Estimated number of harbour seal kills by quarter by year (1991- third quarter of2001), showing that most kills occurred in the fourth quarter (October-December) and to a lesserextent in the first quarter (January-March). Interestingly, for reasons unknown, the seasonalpeak was less pronounced in 1999.
0
2
4
6
8
10
12
14
16
Jan Feb Mar Apr May Jun Jul Aug Sep Oct Nov Dec
Perc
ent o
f Sea
l Kill
s
Figure 8. Overall seasonal pattern of harbour seal kills by month, all years (1991- third quarter of2001) combined.
0
50
100
150
200
250
300
1991 1992 1993 1994 1995 1996 1997 1998 1999 2000 2001
Num
ber o
f Sea
ls K
illed

49
0
2
4
6
8
10
12
14
Jan Feb Mar Apr May Jun Jul Aug Sep Oct Nov Dec
Perc
ent R
ecov
ered
Figure 9. Recovery rate of harbour seals that were recorded as positively killed, all years (1991-third quarter of 2001) combined.

50
Figure 10. Trends in harbour seal abundance (squares) in all surveyed index areas outside theStrait of Georgia during 1970-2000 (modified from Olesiuk 1999a), compared to the number ofharbour seals killed (circles) for predator control at fish farms since the program began in 1990.
0
1000
2000
3000
4000
5000
6000
7000
1970 1975 1980 1985 1990 1995 2000
Year
Popu
latio
n Si
ze (I
ndex
Are
as)
0
100
200
300
400
500
600
700
800
900
Num
ber o
f Sea
ls K
illed
Population Size
Number Seals Killed

51
Figure 11. Level of harbour seal kills expressed as a percent of the maximum net productivitylevel (MNPL) by geographic area. The MNPL is the number of seal kills that could be sustained(assuming the kill is non-selective with respect to sex- and age-structure). The MNPL isestimated to be 11.4%, and occurs at 75% of carry capacity (Olesiuk 1999a). Populations declinewhen kills exceed 100% of MNPL and will only recover when kills are less than 100% ofMNPL.
0
50
100
150
200
250
300
1991 1992 1993 1994 1995 1996 1997 1998 1999
Perc
ent o
f MN
PLGULFISLNEGULFJERVISBARKLEYSDMWVANISLNWVANISLSWQCSTRNEQCSTRBROUGHTUnsurveyed

52
Figure 12. Relative distribution of harbour seal kills among sites by year and for all yearscombined (overall, thick black line), showing the uneven kill distribution among sites. Trendlines were calculated by ranking the number of kills by site from lowest to highest, and taking thecumulative sum as a function as the percent of licensed sites. An even distribution of kills wouldbe represented by a 1:1 line. The non-linear trends indicate that kills were not uniformlydistributed, but rather concentrated at a few sites. For example, the 50% of sites reporting thelowest kills accounted for less than 10% of the total number of seals killed, whereas the 10% ofsites reporting the highest kills accounted for 40-60% of the total number of seals killed. Over allyears combined, the concentration of kills at a few sites was not quite as pronounced, sincedifferent sites had the greatest kills in different years.
0
20
40
60
80
100
0 10 20 30 40 50 60 70 80 90 100
Cumulative Percent of Farms
Cum
ulat
ive
Perc
ent o
f Kill
s
1991199219931994199519961997199819992000Overall

53
Figure 13. Map showing distribution of salmon farms (circles) and known harbour sealhaulout sites (blue triangles). Colours indicate the level of harbour seal kills at each site.Green denotes the bottom 50% of sites that accounted for 12% of all kills (each site killeda total of less than 20 seals), yellow denotes the intermediate 40% of the sites thataccounted for 47% of the kills, and red denotes the top 10% of the sites that accounted for41% of all kills (sites ranged from 76-356 kills each).

54
Figure 14. Map showing distribution of salmon farms (green circles) and known harbourseal haulout sites (triangles). Blue denotes seal haulout sites of < 100 animals, tan of siteswith 100-500 animals, and red of sites with >500 animals.

55
0
20
40
60
80
100
120
140
160
180
1991 1992 1993 1994 1995 1996 1997 1998 1999 2000 2001
Num
ber S
eals
Kill
edLarsen Island
Midsummer Island
Sw anson Island
Eden Island
Total
Figure 15. Temporal trends in number of harbour seals killed at four Stolt Sea Farm sites in theBroughton Archipelago. This example shows the dramatic decline in number of pinnipeds killedwhen the company moved to large flex guard-dipped pens in the late 1990s.
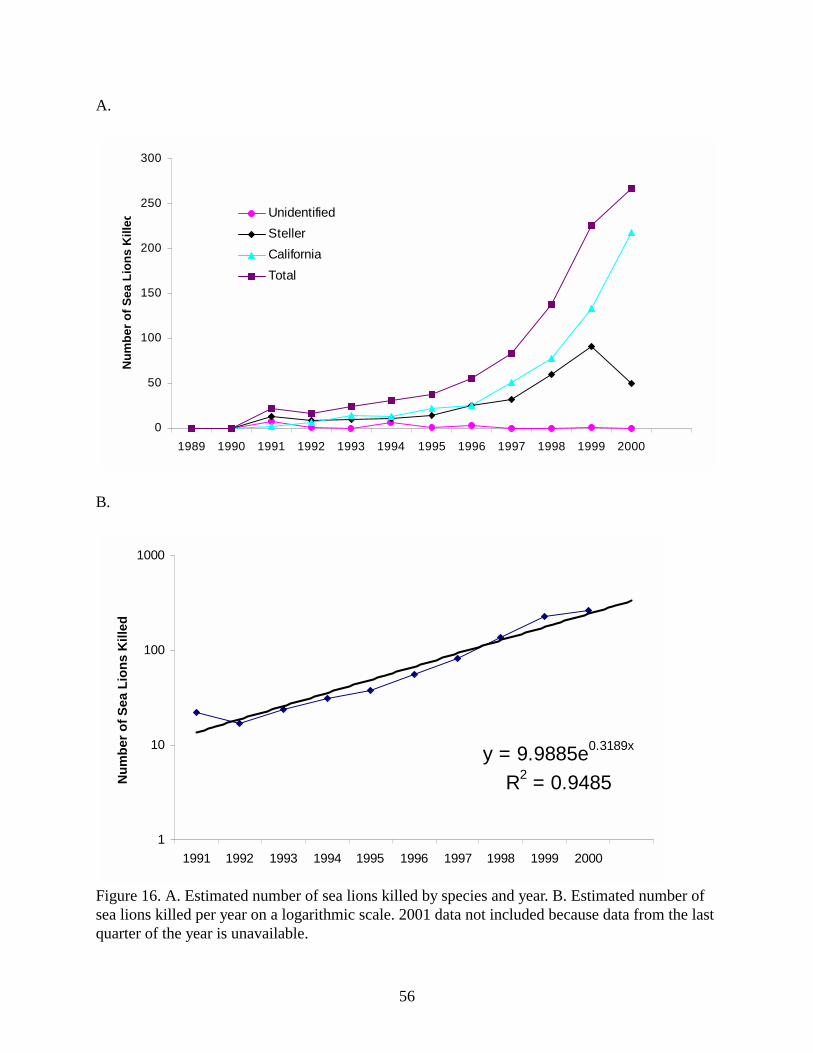
56
A.
B.
Figure 16. A. Estimated number of sea lions killed by species and year. B. Estimated number ofsea lions killed per year on a logarithmic scale. 2001 data not included because data from the lastquarter of the year is unavailable.
0
50
100
150
200
250
300
1989 1990 1991 1992 1993 1994 1995 1996 1997 1998 1999 2000
Num
ber o
f Sea
Lio
ns K
illed
UnidentifiedStellerCaliforniaTotal
y = 9.9885e0.3189x
R2 = 0.9485
1
10
100
1000
1991 1992 1993 1994 1995 1996 1997 1998 1999 2000
Num
ber o
f Sea
Lio
ns K
illed

57
Figure 17. Estimated average number of sea lions killed per licensed site, and per licensed sitereporting kills, by year. 2001 data not included because data from the last quarter of the year isunavailable.
Figure 18. Number of sea lions killed by quarter, showing that most kills occurred in the firstquarter (January-March) and to a lesser extent in the second quarter (April-June). Virtually nokills occur in the third quarter (July-September). Data from the last quarter of 2001 not available.
0
1
2
3
4
5
6
7
1989 1990 1991 1992 1993 1994 1995 1996 1997 1998 1999 2000Num
ber o
f Sea
Lio
ns K
illed
per
Site
Licensed SitesSites Reporting Kills
0
20
40
60
80
100
120
140
160
1991 1992 1993 1994 1995 1996 1997 1998 1999 2000 2001
Num
ber o
f Sea
Lio
ns K
illed

58
Figure 19. Seasonal distribution of sea lion kills, 1991 to fourth quarter of 2001.
Figure 20. Recovery Rate of sea lions that were recorded as being positively killed by month,1991 to fourth quarter of 2001.
0
5
10
15
20
25
30
Jan Feb Mar Apr May Jun Jul Aug Sep Oct Nov Dec
Perc
ent o
f Tot
alCalifornia StellerUnidentified
0
2
4
6
8
10
12
14
16
Jan Feb Mar Apr May Jun Jul Aug Sep Oct Nov Dec
Perc
ent R
ecov
ery
0
2
4
6
8
10
12
14
16
Jan Feb Mar Apr May Jun Jul Aug Sep Oct Nov Dec
Perc
ent R
ecov
ery

59
A.
0 50 100 150 200 250
GULFISL
NEGULF
BARKLEYSD
MWVANISL
NWVANISL
SWQCSTR
NEQCSTR
BROUGHT
Unsurveyed
Number of California Sea Lions
B.
Figure 21. Geographic distribution of sea lion kills from 1991 to mid-2000. A. California. B.Stellar. For a map of locations, see Figure 1 in Olesiuk 1999a: BROUGHT = Broughton IslandArchipelago, NEQCSTR = east portion of Queen Charlotte Strait, SWQCSTR = west portion ofQueen Charlotte Strait, NWVANISL = northwest Vancouver Island, MWVANISL = middle westVancouver Island, BARKLEYSD = Barkley Sound, NEGULF = northeast Strait of Georgia, andGULFISL = Gulf Islands.
0 50 100 150
GULFISL
NEGULF
BARKLEYSD
MWVANISL
NWVANISL
SWQCSTR
NEQCSTR
BROUGHT
Unsurveyed
Number of Steller Sea Lions

60
Figure 22. Relative distribution of sea lion kills among sites by year and for all years combined(overall, thick black line), showing the uneven distribution among sites. Trend lines werecalculated by ranking the number of kills by site from lowest to highest, and taking thecumulative sum as a function as the percent of licensed sites. An even distribution of kills wouldbe represented by a 1:1 line. The non-linear trends indicate that kills were not uniformlydistributed, but rather concentrated at a few sites. For example, in any given year the 80% ofsites reporting the lowest kills accounted for less than 10% of the total number of sea lions killed,whereas the 10% of sites reporting the highest kills accounted for 60-90% of the total number ofsea lions killed. Over all years combined, the concentration of kills at a few sites was not quiteas pronounced, since different sites had the greatest kills in different years.
0
20
40
60
80
100
0 10 20 30 40 50 60 70 80 90 100
Cumulative Percent of Sites
Cum
ulat
ive
Perc
ent o
f Sea
lion
Kill
s
1991199219931994199519961997199819992000Overall

61
Figure 23. Map showing distribution of salmon farms, coloured to indicate the level ofsea lion kills at each site. Blue denotes the site was in the bottom 90% of the sites thataccounted for 40% of all kills (each site killed a total of less than 15 se a lions), and reddenotes the site was in the top 10% of the sites, accounting for 60% of all kills (sitesranged from 16-105 kills each).

62
Appendix 1: The application form for a predator control licence. According to the DFO responseto the BC EAO Salmon Aquaculture Review, prior to issuance of a license, applicants mustdemonstrate that all reasonable non-destructive predator control measures were employed. On thelicense application form, however, there is no place to document those alternative controlmeasures.

63
Appendix 2: The format and conditions of DFO’s predator control licence.
Fisheries and Oceans CanadaMARINE MAMMAL PREDATOR LICENCE
No. XXX
PERMISSION IS HEREBY GIVEN by the Honourable Minister of Fisheries and Oceans Canada(hereinafter called
the “LICENSOR”) to:
COMPANYStreet Address
City, British Columbia Postal Code
(hereinafter called the “LICENSEE”) to kill, by means of firearms, seals and sea lions that are destroying fishbeing held or reared in sea cages of the “LICENSEE” at (location), for the period of January 1, (year) toDecember 31, (year). This licence is issued pursuant to subsection 4(1) of the Marine Mammal Regulationsand subsection 22(1) of the Fishery (General) Regulations.
Upon the following Terms and Conditions which the LICENSEE hereby agrees and accepts to perform and abideby:
1. For the permission hereby given, the LICENSEE shall pay to the LICENSOR, in advance an annual fee offive dollars ($5.00) or such other annual fee as the LICENSOR may in writing advise, made payable tothe Receiver General for Canada and sent to the Regional Aquaculture Coordinator, Pacific Region.
2. Only Harbour Seals, California Sea Lions and Stellar Sea Lions are permitted to be killed under the authority
of this Licence. 3. Only those seals or sea lions that are actually taking, or attempting to take fish being held or reared in sea
cages may be killed. 4. The area of killing is restricted to the immediate site of the sea cages and shall not occur in waters outside
the legal boundaries of the Lease or Licence of Occupation in which the sea cages and associatedinfrastructure reside.
5. Only employees of the LICENSEE who meet either of the following qualifications may kill seals or sea lionsunder the authority of this Licence:
(a) Having a valid Federal Firearms Acquisition Certificate (FAC); or,(b) Having a valid Federal Possession and Acquisition Licence (FPAL).
6. Persons killing seals or sea lions under authority of this Licence must carry documentation confirming thatthey meet one of the criteria listed in subsection (5) and produce it on demand of a Fishery Officer,Conservation Officer or Constable.
7. Firearms used to kill seals or sea lions shall have a muzzle velocity of not less than 1,800 feet per second,and a muzzle energy of not less than 1,100 foot pounds; or a 12 gauge shotgun, utilizing a single rifledslug.

64
8. Every attempt shall be made to retrieve all seals or sea lions killed under authority of this Licence. Theseanimals shall be retrieved from the water within 24 hours, biologically sampled according to instructionsprovided by the Pacific Biological Station (Marine Mammal Research), and then disposed of on shore byburial above the high water mark.
9. The LICENSEE shall submit quarterly written reports containing the following information:(a) The number of harbour seals killed;(b) The number and species of sea lions killed; and(c) The date each seal/sea lion was killed.
The report should be sent to: The Regional Aquaculture Coordinator, Pacific RegionFisheries and Oceans Canada360 - 555 West Hastings StreetVancouver, British Columbia V6B 5G3
10. This Licence may be cancelled forthwith at any time by either party; by the LICENSEE by notice in writingand delivered to or mailed addressed to the Regional Aquaculture Coordinator’s Office, Fisheries andOceans Canada; by the LICENSOR by notice in writing and delivered to or mailed addressed to theLICENSEE.
DATED AT Vancouver, British Columbia, this (day) day of (Month), (Year) A.D.
LICENCEE: _______________________________________________________________________________________(Company)
_______________________________________________________________________________________Regional Aquaculture Coordinatorfor the Minister of Fisheries and Oceans

65
Appendix 3: Current Pinniped Deterrent Observations (summarised from Fraker et al. 1998)
1. Primary Net Systems- mesh size exerts a significant influence, with small (1.7 – 2.2 cm) mesh nets being more
resistant to predators than large (3.3 – 4.4 cm) mesh nets.- mesh shape (square vs. diamond) is relevant because square hung nets are under more
tension and thus billow less and present a flatter surface to predators- age and strength of the net are related in that newer nets are stronger and less prone to
damage by predators- double bottom (shark guards) are useful adjuncts to primary nets. Dogfish are attracted
to the dead salmon that accumulate at the bottom of the cages. The sharks are persistent and oftencreate holes in the nets, which then provide opportunities for seals and sea lions to enter and forfarmed salmon to escape.
2. Secondary Predator Net System- the mesh size is too large to confine fish, but too small to permit seals and sea lions to
pass through- the most important requirement is for the predator net to be separated from the primary
netcage by enough space to allow for movement of the netcage in the currents, and be weightedeffectively to ensure that adequate separation is maintained in the strongest occurring currents.
- double bagging (placing one primary netcage into another) can be effective in frustratingseals, but because two relatively small mesh nets are next to each other, water flow to the fish isrestricted.
3. Visual Factors- white nets may interfere with the ability of predators to see fish.- net fouling organisms may inhibit predation by blocking the view of the net contents and
add weight, making it more difficult for billows to form in the nets- lighting at night may help fish to orient inside the netcage and maintain positions away
from the sides, where they are vunerable.
4. Acoustic Deterrence- ADDs are only usually effective for periods of weeks or months, after which the animals
began to ignore them.- the newer high amplitude ADDs project a more powerful signal that may cause
discomfort or pain at close range.- individual animals that have learned to feed at a site may not be deterred, but newer
ADDs appear to prevent new animals from becoming problem individuals.- Airmar Technology Corp has a triggering device under development that would activate
the ADDs only when the farm is under attack.
Evaluation of OptionsSeals and sea lions should be presented with an essentially rigid external primary netcage
surface. This does not mean that the system has to be absolutely flat and stiff, but that the

66
predators need to be presented with a netcage that lacks slack that may billow and that wouldallow fish to be confined or grasped. The absence of corners (i.e. circular) is also useful for thesame reasons.
Primary NetsThere are several ways of achieving the desired rigid net surface (Arnold 1992).a. Weighting and tensioning systems can be effective in increasing net rigidity. Extra horizontal
lines and ribs add overall rigidity and reduce the tendency for pockets to develop. Nets arecommonly treated with a red copper-based antifoulant, which hardens the fibres (Arnold1992). In combination with tensioning systems, this adds to the rigid surface.
b. Extra horizontal lines and ribs appear to reduce the ease with which pockets are formedwithin the netcage.
c. Rigid collars on net bottoms can help maintain net shape, but folds may still develop incentral parts of the net and the collars increase the difficulty of raising and lowering nets.
d. Semi-rigid netting is a strong durable material, which has inherent rigidity. Netcages madefrom semi-rigid netting are more expensive than those made from conventional material, butthey may also have a significantly longer useful life.
e. Solid materials such as fiberglass and PVC laminates have been used in constructingprototype cages that appear to be resistant to predators. New materials (i.e. Spectra) may bestronger and more durable, and even if more expensive, the extended life and effectivenessagainst predators may cost-effectively compensate.
f. Larger netcages appear to be effective in reducing predation because the surface area/unitvolume is much smaller.
g. Larger pens also use more, and therefore heavier, material that is more difficult to manipulate.h. Ocean-Spar tension cage systems are stable in currents up to 3 knots. The spar tensioning
system does not require complex weighting and has low stresses resulting in no complexdeformations. The resultant semi-rigid cage does not billow and presents seals and sea lionswith an essentially rigid flat surface.
i. Sargo and Future Sea Technologies Inc. have floating semi-enclosed and enclosed systemswhich exclude seals and sea lions. These systems require pumping water rather than naturalcurrents and tidal action to circulate water.
Predator Netsa. the effectiveness is a function of heavy weighting and net integrityb. whole system or modular predator nets are usually effectivec. predator nets around each primary netpen are the most effectived. a mesh size of 30 – 35 cm is appropriate
Curtain NetsCurtain nets are considered a poorer option than other exclusion nets, and since they have a highentanglement rate, Scottish Salmon Farmers Association guidelines recommend they be phasedout as soon as practicable. However, they are recognised as easier to deploy and maintain. Theuse of curtain nets as predator control is gradually being phased out and replaced with cage nettensioning (Arnold 1992).

67
Appendix 4: DFO instructions for reporting pinniped kills and obtaining biological samples fromkilled pinnipeds, and the quarterly kill statistics report form required to be submitted by fish farmoperators quarterly on an annual basis.

68

69

70

71

72

73
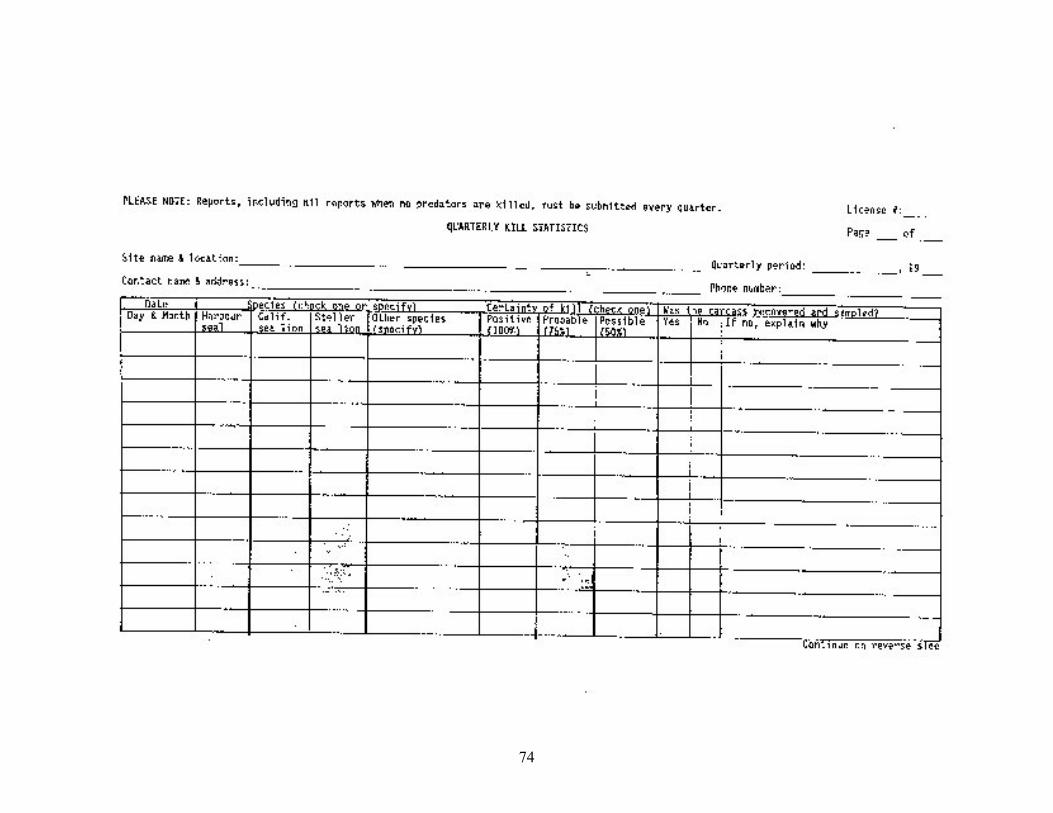
74