sample industry report
TRANSCRIPT
Technology, Media & Telecoms (UK)
Sample Industry Report
NB: Data used in this sample report is for illustration purposes only and is not necessarily reflective of the Technology, Media & Telecoms sector in the UK
Disclaimer:All information contained in this report is derived from Legal Monitor research and information available in the public domain. Worldwide Legal Research does not make any representations or warranties, expressed or implied, as to the accuracy or completeness of the data and information provided in this report. While Worldwide Legal Research has made every effort to ensure that the information in this report is correct, it does not assume any liability to any party for any loss or damage caused by the use of this report or any errors or omissions therein.
2 Sample Industry Market Report (© Worldwide Legal Research 2013)
Activity by Industry Sector - Technology, Media & Telecoms (2012) Deals and transactions analysis - Top 50 UK law firms by revenue (All Regions) 3Deals and transactions analysis - Top 1-10 UK law firms by revenue (All Regions) 4Deals and transactions analysis - Top 11-20 UK law firms by revenue (All Regions) 5Deals and transactions analysis - Top 21-30 UK law firms by revenue (All Regions) 6Deals and transactions analysis - Top 31-50 UK law firms by revenue (All Regions) 7Deals and transactions analysis - Top 50 UK law firms by revenue (UK) 8Deals and transactions analysis - Top 1-10 UK law firms by revenue (UK) 9Deals and transactions analysis - Top 11-20 UK law firms by revenue (UK 10Deals and transactions analysis - Top 21-30 UK law firms by revenue (UK) 11Deals and transactions analysis - Top 31-50 UK law firms by revenue (UK) 12Deals and transactions data table 13Data Methodology 16
Law Firm Partner Data - Technology, Media & Telecoms (2013)Partners across all regions 17Partners in the UK 19Partners in Continental Europe 21Partners in Eastern Europe 23Partners in Asia Pacific 25Partners in the Middle East 27Partners in North America 29Data table 31
Lateral Partner Analysis (2012)Lateral Partner Hires Analysis 32Lateral Partner Hires Analysis by Region 33Data table 34
Partner Promotions Analysis (2012)Partner Promotions Analysis 35Data table 36
Contents
Sample Industry Market Report (© Worldwide Legal Research 2013) 3
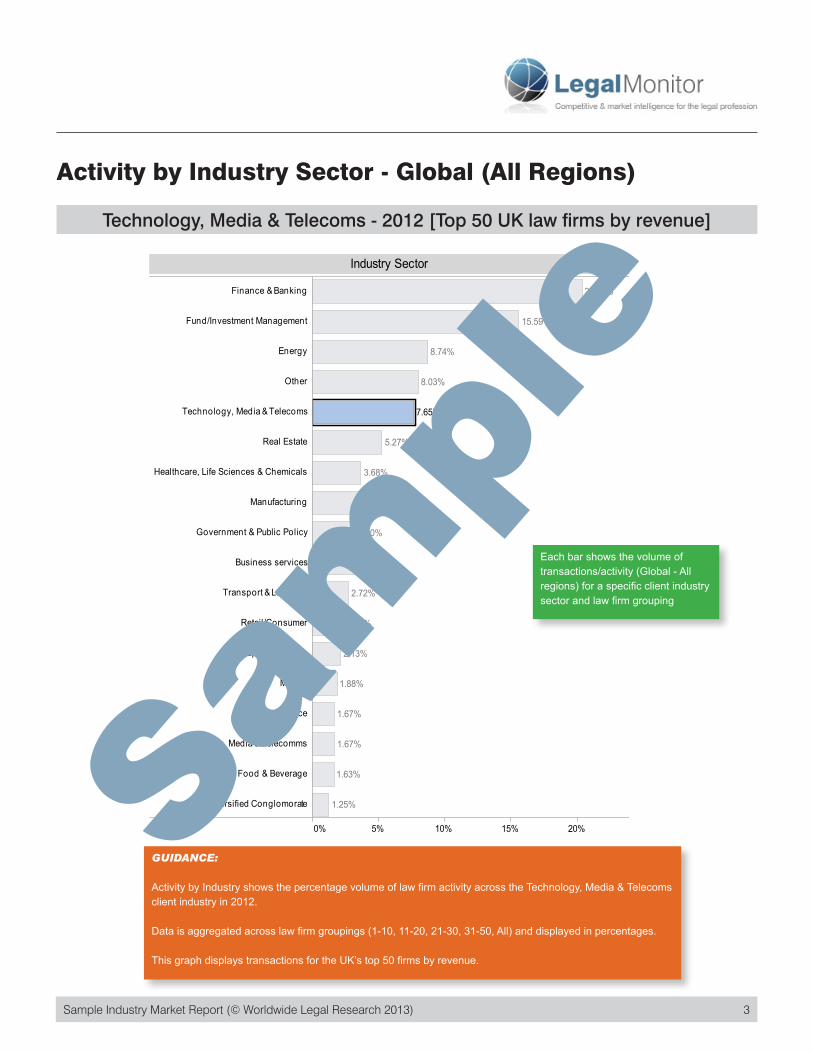
Activity by Industry Sector - Global (All Regions)
Select Date Range01/01/2012 to 31/12/2012
Law Firm GroupAll
Partner RegionAll
0% 5% 10% 15% 20%
Finance & Banking
Fund/Investment Management
Energy
Other
Technology, Media & Telecoms
Real Estate
Healthcare, Life Sciences & Chemicals
Manufacturing
Government & Public Policy
Business services
Transport & Logistics
Retail/Consumer
Sport & Leisure
Mining
Insurance
Technology, Media & Telecomms
Food & Beverage
Diversified Conglomorate 1.25%
1.63%
1.67%
1.67%
1.88%
2.13%
2.47%
2.72%
3.18%
3.30%
3.64%
3.68%
5.27%
8.03%
8.74%
15.59%
20.36%
7.65%
Industry Sector
Technology, Media & Telecoms - 2012 [Top 50 UK law firms by revenue]
Sam
ple
GUIDANCE:
Activity by Industry shows the percentage volume of law firm activity across the Technology, Media & Telecoms client industry in 2012.
Data is aggregated across law firm groupings (1-10, 11-20, 21-30, 31-50, All) and displayed in percentages.
This graph displays transactions for the UK’s top 50 firms by revenue.
Each bar shows the volume of transactions/activity (Global - All regions) for a specific client industry sector and law firm grouping
4 Sample Industry Market Report (© Worldwide Legal Research 2013)4 Sample Industry Market Report (© Worldwide Legal Research 2013)
Select Date Range01/01/2012 to 31/12/2012
Law Firm Group1-1011-2021-3031+
Partner RegionAll
0% 5% 10% 15% 20% 25%
Finance & Banking
Fund/Investment Management
Energy
Technology, Media & Telecoms
Real Estate
Other
Healthcare, Life Sciences & Chemicals
Manufacturing
Business services
Government & Public Policy
Retail/Consumer
Transport & Logistics
Mining
Food & Beverage
Sport & Leisure
Technology, Media & Telecomms
Insurance
Diversified Conglomorate 1.28%
1.74%
1.81%
1.81%
1.81%
2.19%
2.57%
2.80%
2.80%
2.80%
3.55%
3.85%
5.44%
5.74%
8.47%
13.68%
25.40%
7.33%
Industry Sector
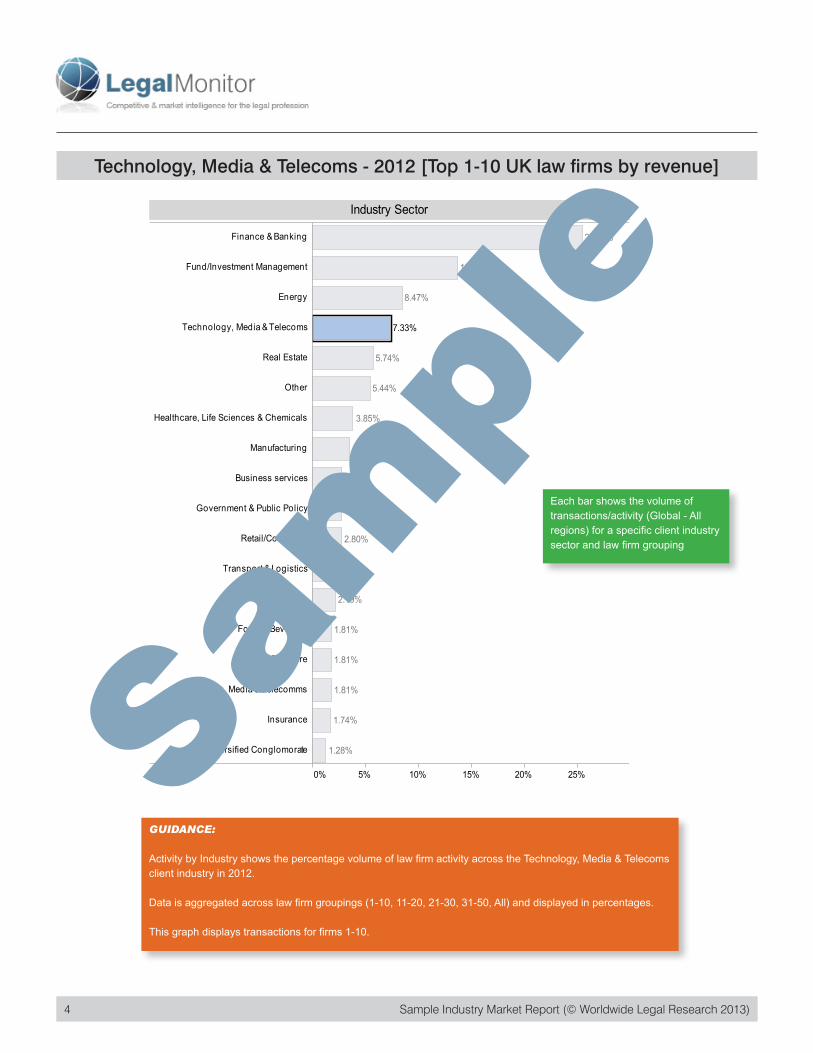
Technology, Media & Telecoms - 2012 [Top 1-10 UK law firms by revenue]
GUIDANCE:
Activity by Industry shows the percentage volume of law firm activity across the Technology, Media & Telecoms client industry in 2012.
Data is aggregated across law firm groupings (1-10, 11-20, 21-30, 31-50, All) and displayed in percentages.
This graph displays transactions for firms 1-10.
Sam
ple
Each bar shows the volume of transactions/activity (Global - All regions) for a specific client industry sector and law firm grouping
Sample Industry Market Report (© Worldwide Legal Research 2013) 5
Select Date Range01/01/2012 to 31/12/2012
Law Firm Group1-1011-2021-3031+
Partner RegionAll
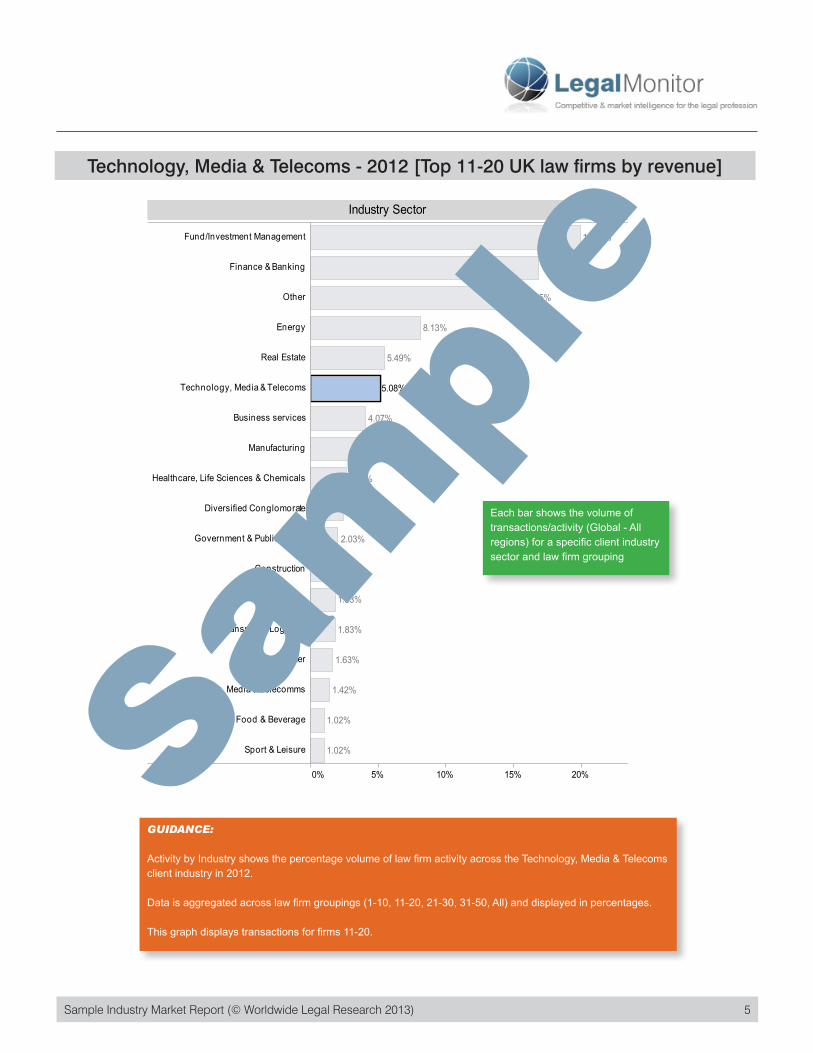
0% 5% 10% 15% 20%
Fund/Investment Management
Finance & Banking
Other
Energy
Real Estate
Technology, Media & Telecoms
Business services
Manufacturing
Healthcare, Life Sciences & Chemicals
Diversified Conglomorate
Government & Public Policy
Construction
Mining
Transport & Logistics
Retail/Consumer
Technology, Media & Telecomms
Food & Beverage
Sport & Leisure 1.02%
1.02%
1.42%
1.63%
1.83%
1.83%
1.83%
2.03%
2.44%
2.64%
4.07%
4.07%
5.49%
8.13%
15.45%
16.87%
19.92%
5.08%
Industry Sector
Technology, Media & Telecoms - 2012 [Top 11-20 UK law firms by revenue]
GUIDANCE:
Activity by Industry shows the percentage volume of law firm activity across the Technology, Media & Telecoms client industry in 2012.
Data is aggregated across law firm groupings (1-10, 11-20, 21-30, 31-50, All) and displayed in percentages.
This graph displays transactions for firms 11-20.
Sam
ple
Each bar shows the volume of transactions/activity (Global - All regions) for a specific client industry sector and law firm grouping
6 Sample Industry Market Report (© Worldwide Legal Research 2013)6 Sample Industry Market Report (© Worldwide Legal Research 2013)
Select Date Range01/01/2012 to 31/12/2012
Law Firm Group1-1011-2021-3031+
Partner RegionAll
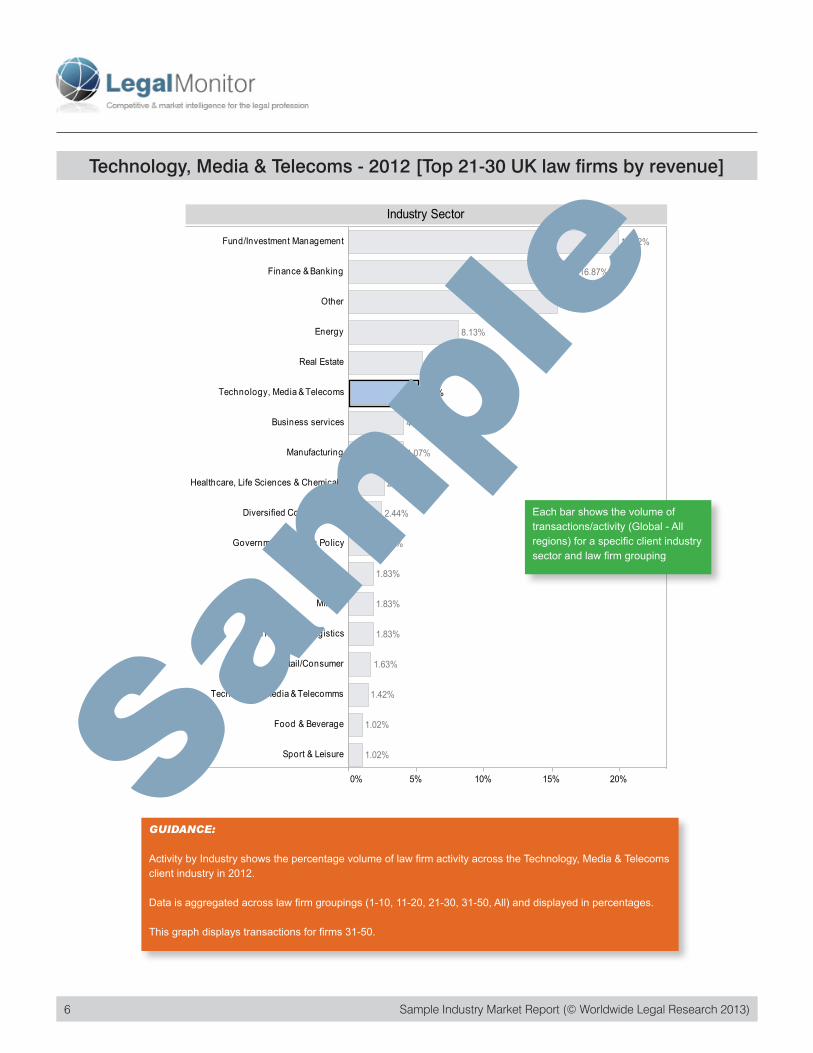
0% 5% 10% 15% 20%
Fund/Investment Management
Finance & Banking
Other
Energy
Real Estate
Technology, Media & Telecoms
Business services
Manufacturing
Healthcare, Life Sciences & Chemicals
Diversified Conglomorate
Government & Public Policy
Construction
Mining
Transport & Logistics
Retail/Consumer
Technology, Media & Telecomms
Food & Beverage
Sport & Leisure 1.02%
1.02%
1.42%
1.63%
1.83%
1.83%
1.83%
2.03%
2.44%
2.64%
4.07%
4.07%
5.49%
8.13%
15.45%
16.87%
19.92%
5.08%
Industry Sector
Technology, Media & Telecoms - 2012 [Top 21-30 UK law firms by revenue]
GUIDANCE:
Activity by Industry shows the percentage volume of law firm activity across the Technology, Media & Telecoms client industry in 2012.
Data is aggregated across law firm groupings (1-10, 11-20, 21-30, 31-50, All) and displayed in percentages.
This graph displays transactions for firms 31-50.
Sam
ple
Each bar shows the volume of transactions/activity (Global - All regions) for a specific client industry sector and law firm grouping
Sample Industry Market Report (© Worldwide Legal Research 2013) 7
Select Date Range01/01/2012 to 31/12/2012
Law Firm Group1-1011-2021-3031+
Partner RegionAll
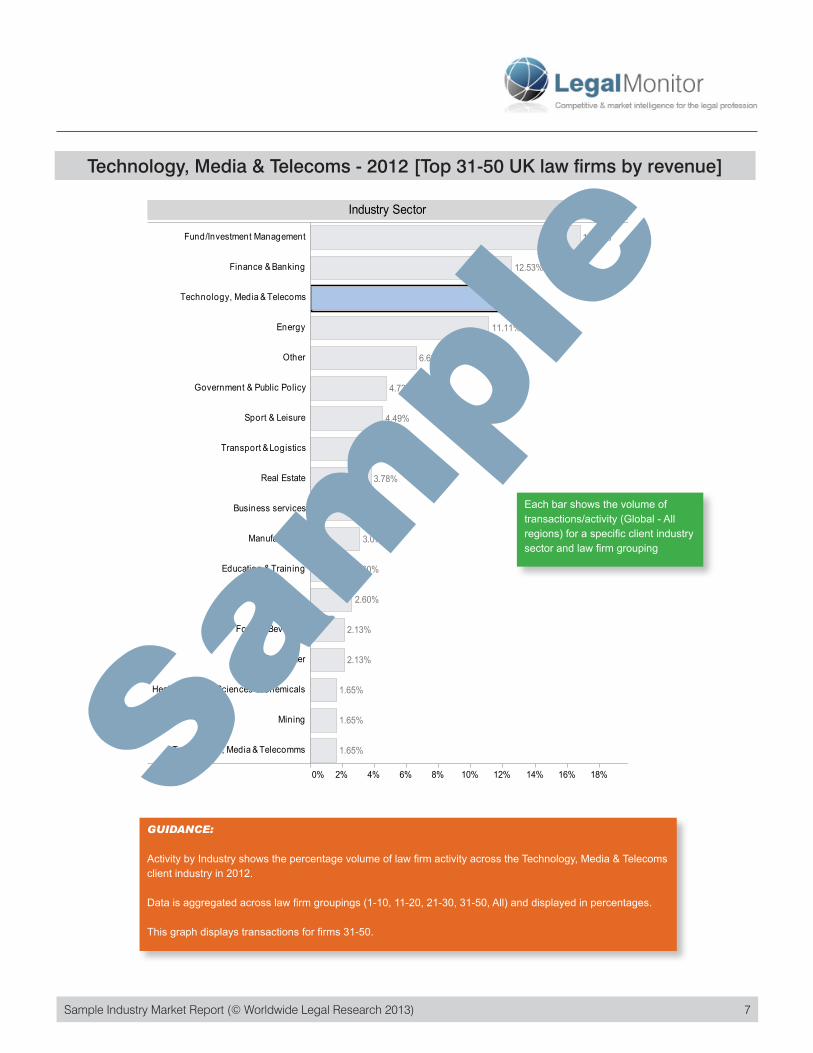
0% 2% 4% 6% 8% 10% 12% 14% 16% 18%
Fund/Investment Management
Finance & Banking
Technology, Media & Telecoms
Energy
Other
Government & Public Policy
Sport & Leisure
Transport & Logistics
Real Estate
Business services
Manufacturing
Education & Training
Insurance
Food & Beverage
Retail/Consumer
Healthcare, Life Sciences & Chemicals
Mining
Technology, Media & Telecomms 1.65%
1.65%
1.65%
2.13%
2.13%
2.60%
2.60%
3.07%
3.55%
3.78%
4.02%
4.49%
4.73%
6.62%
11.11%
12.53%
16.78%
12.06%
Industry Sector
Technology, Media & Telecoms - 2012 [Top 31-50 UK law firms by revenue]
GUIDANCE:
Activity by Industry shows the percentage volume of law firm activity across the Technology, Media & Telecoms client industry in 2012.
Data is aggregated across law firm groupings (1-10, 11-20, 21-30, 31-50, All) and displayed in percentages.
This graph displays transactions for firms 31-50.
Sam
ple
Each bar shows the volume of transactions/activity (Global - All regions) for a specific client industry sector and law firm grouping
8 Sample Industry Market Report (© Worldwide Legal Research 2013)
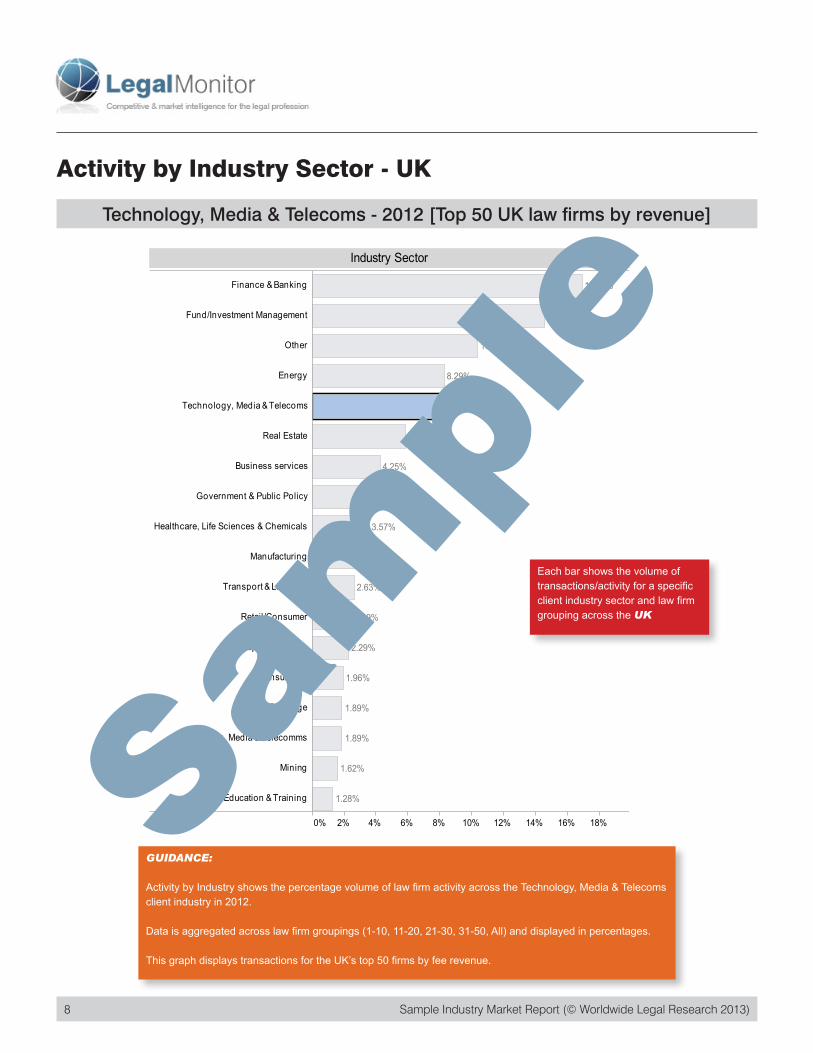
Activity by Industry Sector - UK
Select Date Range01/01/2012 to 31/12/2012
Law Firm GroupAll
Partner RegionAfricaAsia PacificContinental EuropeEastern EuropeEuropeMiddle EastNorth AmericaSouth AmericaUnspecified
0% 2% 4% 6% 8% 10% 12% 14% 16% 18%
Finance & Banking
Fund/Investment Management
Other
Energy
Technology, Media & Telecoms
Real Estate
Business services
Government & Public Policy
Healthcare, Life Sciences & Chemicals
Manufacturing
Transport & Logistics
Retail/Consumer
Sport & Leisure
Insurance
Food & Beverage
Technology, Media & Telecomms
Mining
Education & Training 1.28%
1.62%
1.89%
1.89%
1.96%
2.29%
2.49%
2.63%
3.03%
3.57%
3.78%
4.25%
5.87%
8.29%
10.38%
14.57%
16.93%
8.16%
Industry Sector
Technology, Media & Telecoms - 2012 [Top 50 UK law firms by revenue]
Sam
ple
GUIDANCE:
Activity by Industry shows the percentage volume of law firm activity across the Technology, Media & Telecoms client industry in 2012.
Data is aggregated across law firm groupings (1-10, 11-20, 21-30, 31-50, All) and displayed in percentages.
This graph displays transactions for the UK’s top 50 firms by fee revenue.
Each bar shows the volume of transactions/activity for a specific client industry sector and law firm grouping across the UK
Sample Industry Market Report (© Worldwide Legal Research 2013) 9
Select Date Range01/01/2012 to 31/12/2012
Law Firm Group1-1011-2021-3031+
Partner RegionAfricaAsia PacificContinental EuropeEastern EuropeEuropeMiddle EastNorth AmericaSouth AmericaUnspecified
0% 5% 10% 15% 20% 25%
Finance & Banking
Fund/Investment Management
Energy
Technology, Media & Telecoms
Other
Real Estate
Business services
Healthcare, Life Sciences & Chemicals
Government & Public Policy
Food & Beverage
Manufacturing
Retail/Consumer
Transport & Logistics
Mining
Technology, Media & Telecomms
Insurance
Sport & Leisure
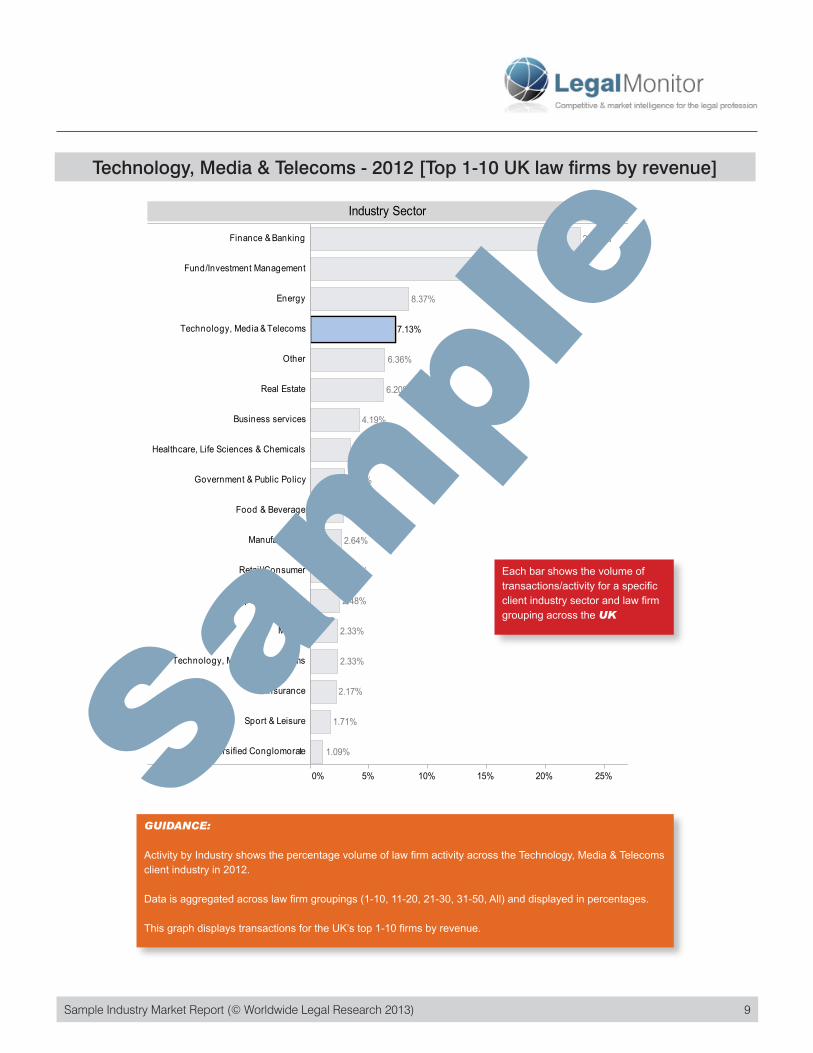
Diversified Conglomorate 1.09%
1.71%
2.17%
2.33%
2.33%
2.48%
2.64%
2.64%
2.79%
2.95%
3.41%
4.19%
6.20%
6.36%
8.37%
13.95%
22.95%
7.13%
Industry Sector
Technology, Media & Telecoms - 2012 [Top 1-10 UK law firms by revenue]Sa
mpl
eGUIDANCE:
Activity by Industry shows the percentage volume of law firm activity across the Technology, Media & Telecoms client industry in 2012.
Data is aggregated across law firm groupings (1-10, 11-20, 21-30, 31-50, All) and displayed in percentages.
This graph displays transactions for the UK’s top 1-10 firms by revenue.
Each bar shows the volume of transactions/activity for a specific client industry sector and law firm grouping across the UK
10 Sample Industry Market Report (© Worldwide Legal Research 2013)10 Sample Industry Market Report (© Worldwide Legal Research 2013)
Select Date Range01/01/2012 to 31/12/2012
Law Firm Group1-1011-2021-3031+
Partner RegionAfricaAsia PacificContinental EuropeEastern EuropeEuropeMiddle EastNorth AmericaSouth AmericaUnspecified
0% 5% 10% 15% 20% 25%
Other
Finance & Banking
Fund/Investment Management
Energy
Real Estate
Business services
Technology, Media & Telecoms
Manufacturing
Government & Public Policy
Construction
Healthcare, Life Sciences & Chemicals
Retail/Consumer
Transport & Logistics
Diversified Conglomorate
Technology, Media & Telecomms
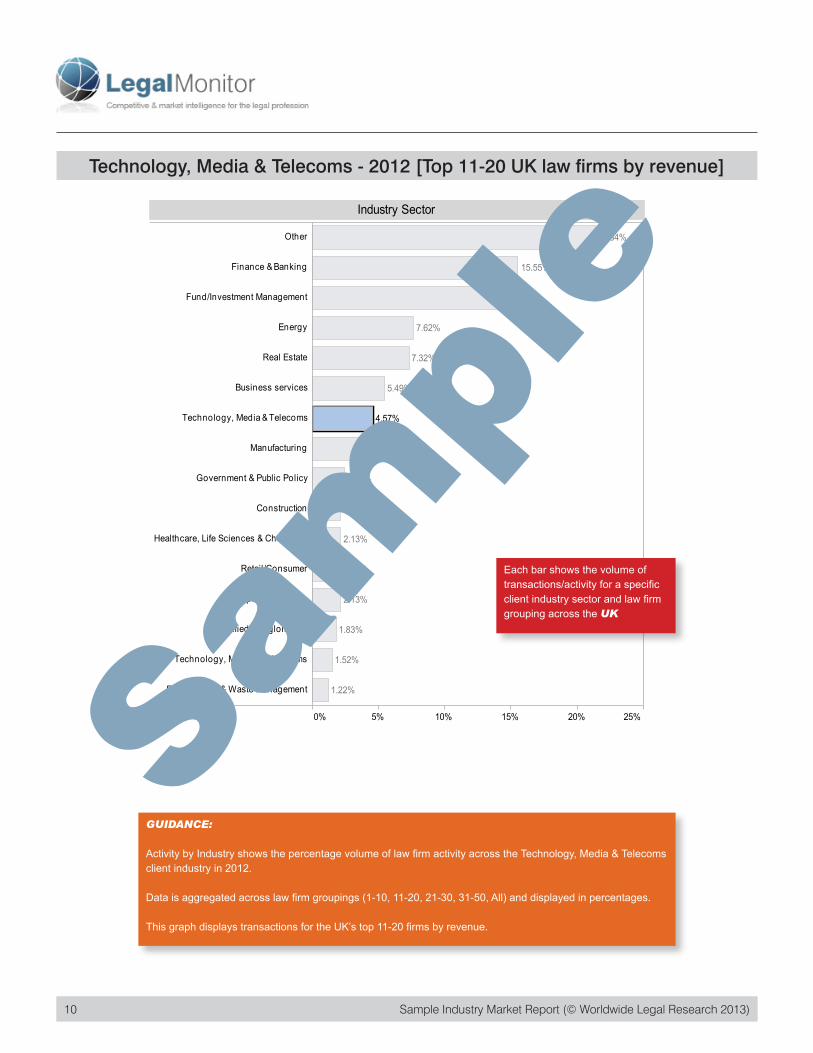
Environment & Waste Management 1.22%
1.52%
1.83%
2.13%
2.13%
2.13%
2.13%
2.44%
3.96%
5.49%
7.32%
7.62%
14.33%
15.55%
21.34%
4.57%
Industry Sector
Technology, Media & Telecoms - 2012 [Top 11-20 UK law firms by revenue]Sa
mpl
eGUIDANCE:
Activity by Industry shows the percentage volume of law firm activity across the Technology, Media & Telecoms client industry in 2012.
Data is aggregated across law firm groupings (1-10, 11-20, 21-30, 31-50, All) and displayed in percentages.
This graph displays transactions for the UK’s top 11-20 firms by revenue.
Each bar shows the volume of transactions/activity for a specific client industry sector and law firm grouping across the UK

Sample Industry Market Report (© Worldwide Legal Research 2013) 11
Select Date Range01/01/2012 to 31/12/2012
Law Firm Group1-1011-2021-3031+
Partner RegionAfricaAsia PacificContinental EuropeEastern EuropeEuropeMiddle EastNorth AmericaSouth AmericaUnspecified
0% 2% 4% 6% 8% 10% 12% 14% 16% 18%
Fund/Investment Management
Healthcare, Life Sciences & Chemicals
Other
Finance & Banking
Technology, Media & Telecoms
Energy
Government & Public Policy
Manufacturing
Real Estate
Retail/Consumer
Business services
Charity
Environment & Waste Management
Sport & Leisure
Transport & Logistics
Construction
Education & Training
Gaming 1.36%
1.36%
1.36%
2.04%
2.04%
2.04%
2.72%
2.72%
3.40%
4.76%
4.76%
6.12%
6.12%
10.20%
10.88%
11.56%
15.65%
6.80%
Industry Sector
Technology, Media & Telecoms - 2012 [Top 21-30 UK law firms by revenue]Sa
mpl
eGUIDANCE:
Activity by Industry shows the percentage volume of law firm activity across the Technology, Media & Telecoms client industry in 2012.
Data is aggregated across law firm groupings (1-10, 11-20, 21-30, 31-50, All) and displayed in percentages.
This graph displays transactions for the UK’s top 21-30 firms by revenue
Each bar shows the volume of transactions/activity for a specific client industry sector and law firm grouping across the UK
12 Sample Industry Market Report (© Worldwide Legal Research 2013)12 Sample Industry Market Report (© Worldwide Legal Research 2013)
Select Date Range01/01/2012 to 31/12/2012
Law Firm Group1-1011-2021-3031+
Partner RegionAfricaAsia PacificContinental EuropeEastern EuropeEuropeMiddle EastNorth AmericaSouth AmericaUnspecified
0% 2% 4% 6% 8% 10% 12% 14% 16% 18%
Fund/Investment Management
Technology, Media & Telecoms
Finance & Banking
Energy
Other
Government & Public Policy
Sport & Leisure
Real Estate
Business services
Transport & Logistics
Insurance
Education & Training
Food & Beverage
Manufacturing
Retail/Consumer
Healthcare, Life Sciences & Chemicals
Mining
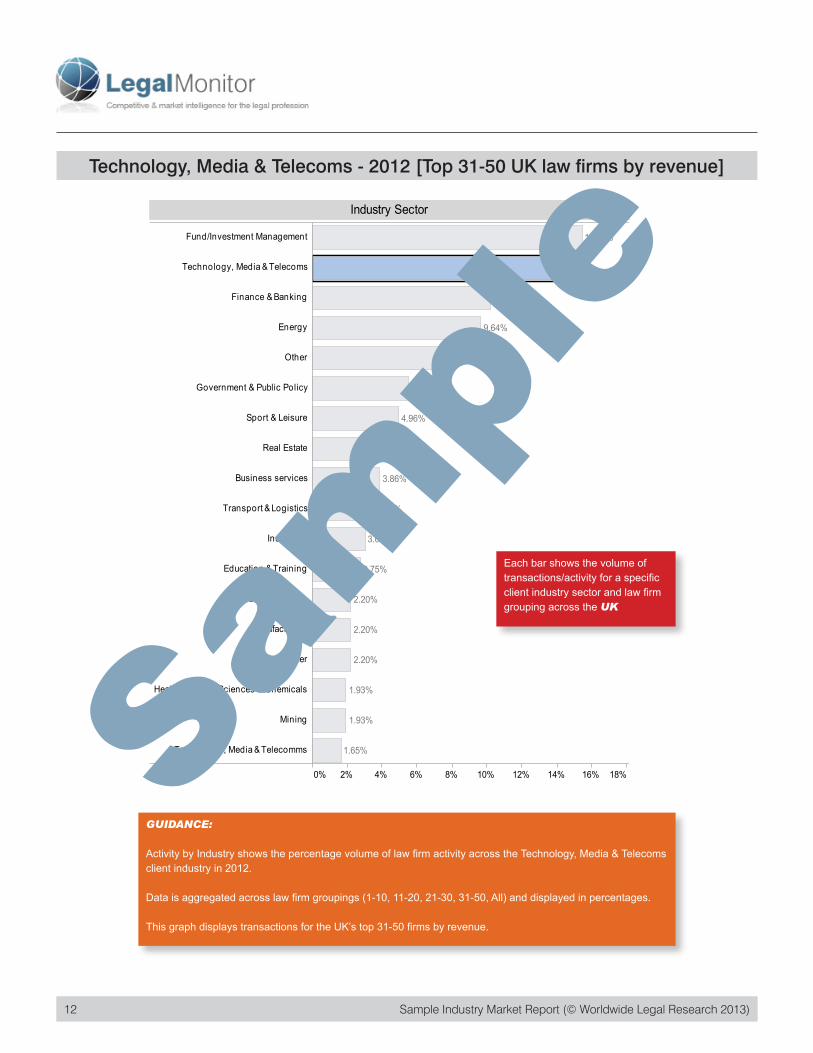
Technology, Media & Telecomms 1.65%
1.93%
1.93%
2.20%
2.20%
2.20%
2.75%
3.03%
3.58%
3.86%
4.41%
4.96%
5.51%
7.44%
9.64%
10.19%
15.43%
13.77%
Industry Sector
Technology, Media & Telecoms - 2012 [Top 31-50 UK law firms by revenue]Sa
mpl
eGUIDANCE:
Activity by Industry shows the percentage volume of law firm activity across the Technology, Media & Telecoms client industry in 2012.
Data is aggregated across law firm groupings (1-10, 11-20, 21-30, 31-50, All) and displayed in percentages.
This graph displays transactions for the UK’s top 31-50 firms by revenue.
Each bar shows the volume of transactions/activity for a specific client industry sector and law firm grouping across the UK
Sample Industry Market Report (© Worldwide Legal Research 2013) 13
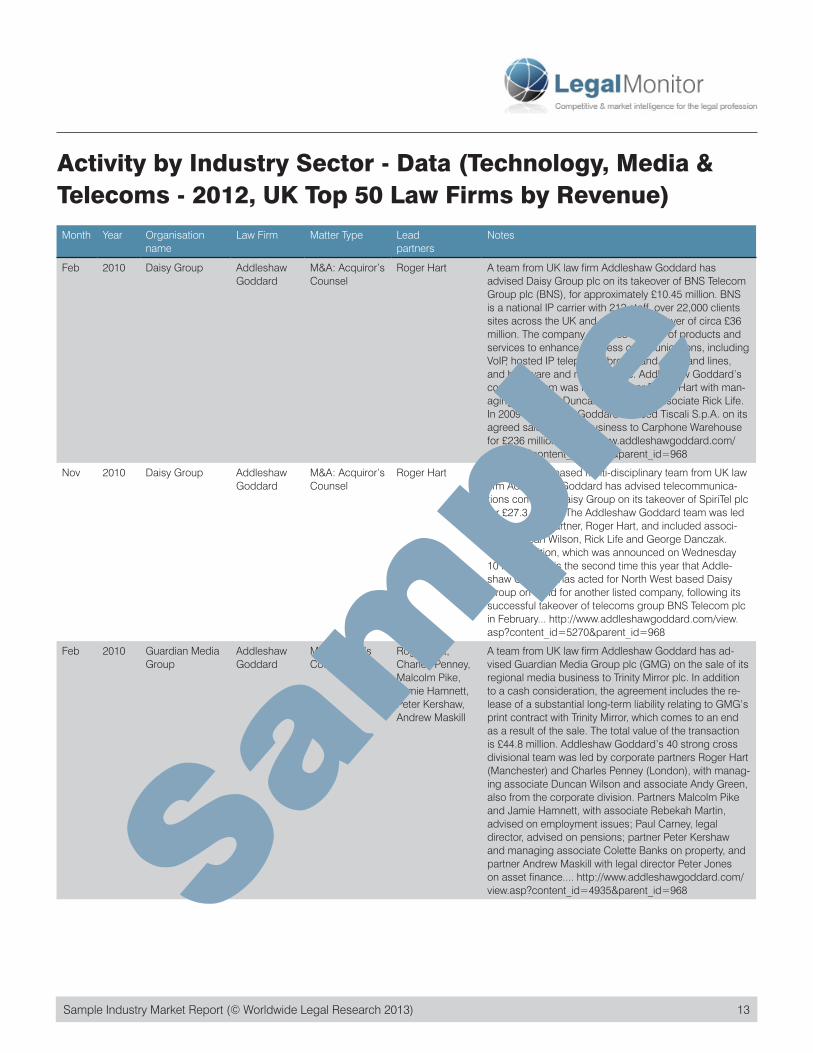
Activity by Industry Sector - Data (Technology, Media & Telecoms - 2012, UK Top 50 Law Firms by Revenue)Month Year Organisation
nameLaw Firm Matter Type Lead
partnersNotes
Feb 2010 Daisy Group Addleshaw Goddard
M&A: Acquiror’s Counsel
Roger Hart A team from UK law firm Addleshaw Goddard has advised Daisy Group plc on its takeover of BNS Telecom Group plc (BNS), for approximately £10.45 million. BNS is a national IP carrier with 212 staff, over 22,000 clients sites across the UK and an annual turnover of circa £36 million. The company provides a range of products and services to enhance business communications, including VoIP, hosted IP telephony, broadband, calls and lines, and hardware and maintenance. Addleshaw Goddard’s corporate team was led by partner Roger Hart with man-aging associate Duncan Wilson and associate Rick Life. In 2009 Addleshaw Goddard advised Tiscali S.p.A. on its agreed sale of its UK business to Carphone Warehouse for £236 million... http://www.addleshawgoddard.com/view.asp?content_id=4936&parent_id=968
Nov 2010 Daisy Group Addleshaw Goddard
M&A: Acquiror’s Counsel
Roger Hart A Manchester-based multi-disciplinary team from UK law firm Addleshaw Goddard has advised telecommunica-tions company Daisy Group on its takeover of SpiriTel plc for £27.3 million. The Addleshaw Goddard team was led by corporate partner, Roger Hart, and included associ-ates Duncan Wilson, Rick Life and George Danczak. The acquisition, which was announced on Wednesday 10 November, is the second time this year that Addle-shaw Goddard has acted for North West based Daisy Group on a bid for another listed company, following its successful takeover of telecoms group BNS Telecom plc in February... http://www.addleshawgoddard.com/view.asp?content_id=5270&parent_id=968
Feb 2010 Guardian Media Group
Addleshaw Goddard
M&A: Seller’s Counsel
Roger Hart, Charles Penney, Malcolm Pike, Jamie Hamnett, Peter Kershaw, Andrew Maskill
A team from UK law firm Addleshaw Goddard has ad-vised Guardian Media Group plc (GMG) on the sale of its regional media business to Trinity Mirror plc. In addition to a cash consideration, the agreement includes the re-lease of a substantial long-term liability relating to GMG’s print contract with Trinity Mirror, which comes to an end as a result of the sale. The total value of the transaction is £44.8 million. Addleshaw Goddard’s 40 strong cross divisional team was led by corporate partners Roger Hart (Manchester) and Charles Penney (London), with manag-ing associate Duncan Wilson and associate Andy Green, also from the corporate division. Partners Malcolm Pike and Jamie Hamnett, with associate Rebekah Martin, advised on employment issues; Paul Carney, legal director, advised on pensions; partner Peter Kershaw and managing associate Colette Banks on property, and partner Andrew Maskill with legal director Peter Jones on asset finance.... http://www.addleshawgoddard.com/view.asp?content_id=4935&parent_id=968Sa
mpl
e
14 Sample Industry Market Report (© Worldwide Legal Research 2013)14 Sample Industry Market Report (© Worldwide Legal Research 2013)
Month Year Organisation name
Law Firm Matter Type Lead partners
Notes
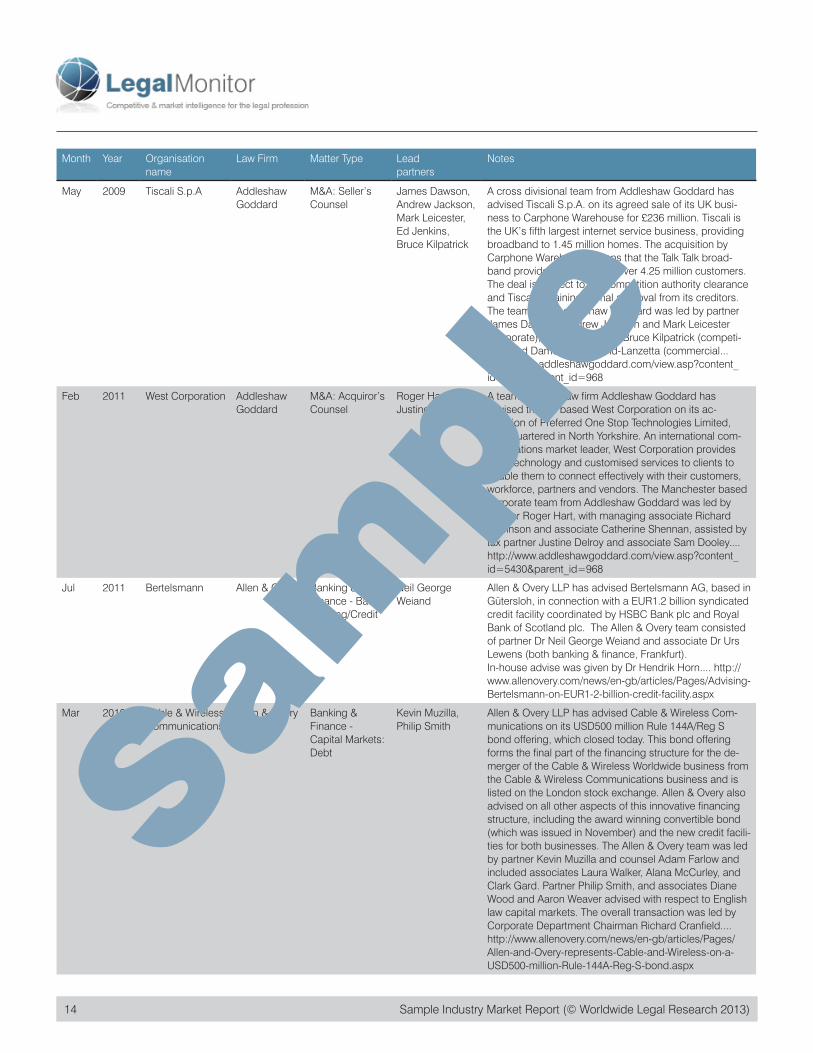
May 2009 Tiscali S.p.A Addleshaw Goddard
M&A: Seller’s Counsel
James Dawson, Andrew Jackson, Mark Leicester, Ed Jenkins, Bruce Kilpatrick
A cross divisional team from Addleshaw Goddard has advised Tiscali S.p.A. on its agreed sale of its UK busi-ness to Carphone Warehouse for £236 million. Tiscali is the UK’s fifth largest internet service business, providing broadband to 1.45 million homes. The acquisition by Carphone Warehouse means that the Talk Talk broad-band provider will now have over 4.25 million customers. The deal is subject to EU competition authority clearance and Tiscali obtaining formal approval from its creditors. The team from Addleshaw Goddard was led by partner James Dawson, Andrew Jackson and Mark Leicester (corporate), Ed Jenkins (tax), Bruce Kilpatrick (competi-tion) and Damon Rosamond-Lanzetta (commercial... http://www.addleshawgoddard.com/view.asp?content_id=4516&parent_id=968
Feb 2011 West Corporation Addleshaw Goddard
M&A: Acquiror’s Counsel
Roger Hart, Justine Delroy
A team from UK law firm Addleshaw Goddard has advised the US based West Corporation on its ac-quisition of Preferred One Stop Technologies Limited, headquartered in North Yorkshire. An international com-munications market leader, West Corporation provides both technology and customised services to clients to enable them to connect effectively with their customers, workforce, partners and vendors. The Manchester based corporate team from Addleshaw Goddard was led by partner Roger Hart, with managing associate Richard Robinson and associate Catherine Shennan, assisted by tax partner Justine Delroy and associate Sam Dooley.... http://www.addleshawgoddard.com/view.asp?content_id=5430&parent_id=968
Jul 2011 Bertelsmann Allen & Overy Banking & Finance - Bank Lending/Credit Facilities
Neil George Weiand
Allen & Overy LLP has advised Bertelsmann AG, based in Gütersloh, in connection with a EUR1.2 billion syndicated credit facility coordinated by HSBC Bank plc and Royal Bank of Scotland plc. The Allen & Overy team consisted of partner Dr Neil George Weiand and associate Dr Urs Lewens (both banking & finance, Frankfurt). In-house advise was given by Dr Hendrik Horn.... http://www.allenovery.com/news/en-gb/articles/Pages/Advising-Bertelsmann-on-EUR1-2-billion-credit-facility.aspx
Mar 2010 Cable & Wireless Communications
Allen & Overy Banking & Finance - Capital Markets: Debt
Kevin Muzilla, Philip Smith
Allen & Overy LLP has advised Cable & Wireless Com-munications on its USD500 million Rule 144A/Reg S bond offering, which closed today. This bond offering forms the final part of the financing structure for the de-merger of the Cable & Wireless Worldwide business from the Cable & Wireless Communications business and is listed on the London stock exchange. Allen & Overy also advised on all other aspects of this innovative financing structure, including the award winning convertible bond (which was issued in November) and the new credit facili-ties for both businesses. The Allen & Overy team was led by partner Kevin Muzilla and counsel Adam Farlow and included associates Laura Walker, Alana McCurley, and Clark Gard. Partner Philip Smith, and associates Diane Wood and Aaron Weaver advised with respect to English law capital markets. The overall transaction was led by Corporate Department Chairman Richard Cranfield....http://www.allenovery.com/news/en-gb/articles/Pages/Allen-and-Overy-represents-Cable-and-Wireless-on-a-USD500-million-Rule-144A-Reg-S-bond.aspx
Sam
ple
Sample Industry Market Report (© Worldwide Legal Research 2013) 15
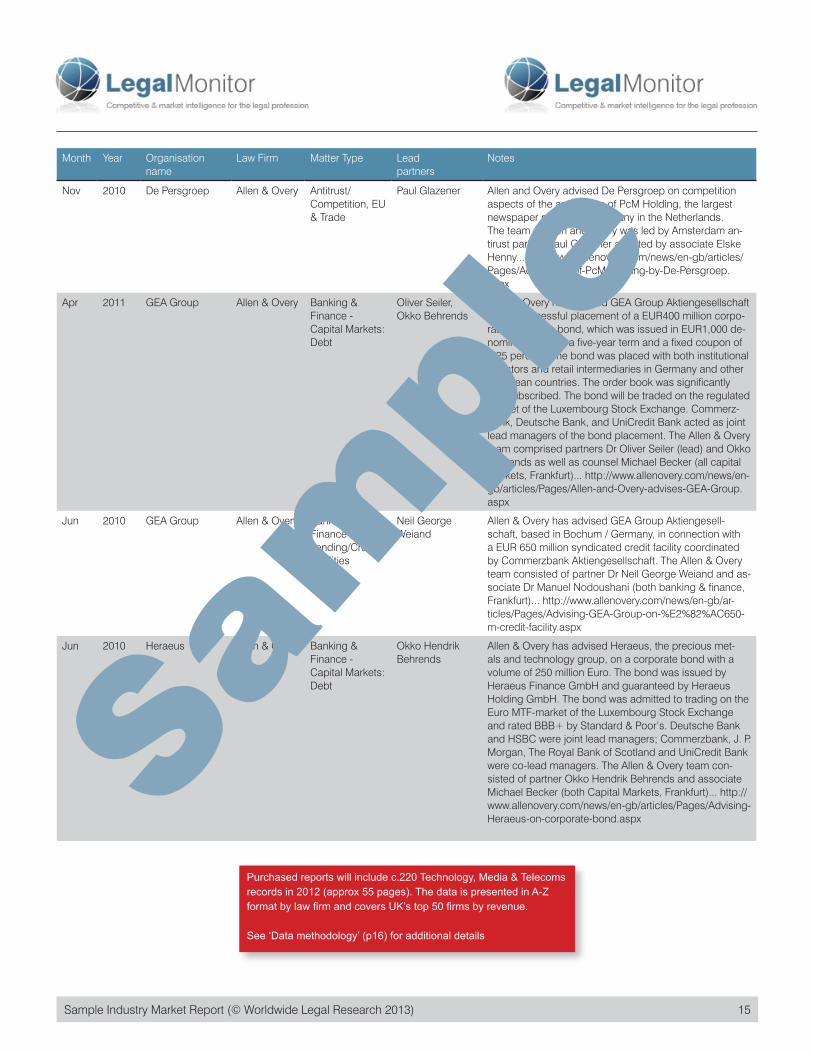
Purchased reports will include c.220 Technology, Media & Telecoms records in 2012 (approx 55 pages). The data is presented in A-Z format by law firm and covers UK’s top 50 firms by revenue.
See ‘Data methodology’ (p16) for additional details
Month Year Organisation name
Law Firm Matter Type Lead partners
Notes
Nov 2010 De Persgroep Allen & Overy Antitrust/ Competition, EU & Trade
Paul Glazener Allen and Overy advised De Persgroep on competition aspects of the acquisition of PcM Holding, the largest newspaper publishing company in the Netherlands. The team at Allen and Overy was led by Amsterdam an-tirust partner Paul Glazener assisted by associate Elske Henny... http://www.allenovery.com/news/en-gb/articles/Pages/Acquisition-of-PcM-Holding-by-De-Persgroep.aspx
Apr 2011 GEA Group Allen & Overy Banking & Finance - Capital Markets: Debt
Oliver Seiler, Okko Behrends
Allen & Overy has advised GEA Group Aktiengesellschaft on the successful placement of a EUR400 million corpo-rate bond. The bond, which was issued in EUR1,000 de-nominations, has a five-year term and a fixed coupon of 4.25 percent. The bond was placed with both institutional investors and retail intermediaries in Germany and other European countries. The order book was significantly oversubscribed. The bond will be traded on the regulated market of the Luxembourg Stock Exchange. Commerz-bank, Deutsche Bank, and UniCredit Bank acted as joint lead managers of the bond placement. The Allen & Overy team comprised partners Dr Oliver Seiler (lead) and Okko Behrends as well as counsel Michael Becker (all capital markets, Frankfurt)... http://www.allenovery.com/news/en-gb/articles/Pages/Allen-and-Overy-advises-GEA-Group.aspx
Jun 2010 GEA Group Allen & Overy Banking & Finance - Bank Lending/Credit Facilities
Neil George Weiand
Allen & Overy has advised GEA Group Aktiengesell-schaft, based in Bochum / Germany, in connection with a EUR 650 million syndicated credit facility coordinated by Commerzbank Aktiengesellschaft. The Allen & Overy team consisted of partner Dr Neil George Weiand and as-sociate Dr Manuel Nodoushani (both banking & finance, Frankfurt)... http://www.allenovery.com/news/en-gb/ar-ticles/Pages/Advising-GEA-Group-on-%E2%82%AC650-m-credit-facility.aspx
Jun 2010 Heraeus Allen & Overy Banking & Finance - Capital Markets: Debt
Okko Hendrik Behrends
Allen & Overy has advised Heraeus, the precious met-als and technology group, on a corporate bond with a volume of 250 million Euro. The bond was issued by Heraeus Finance GmbH and guaranteed by Heraeus Holding GmbH. The bond was admitted to trading on the Euro MTF-market of the Luxembourg Stock Exchange and rated BBB+ by Standard & Poor’s. Deutsche Bank and HSBC were joint lead managers; Commerzbank, J. P. Morgan, The Royal Bank of Scotland and UniCredit Bank were co-lead managers. The Allen & Overy team con-sisted of partner Okko Hendrik Behrends and associate Michael Becker (both Capital Markets, Frankfurt)... http://www.allenovery.com/news/en-gb/articles/Pages/Advising-Heraeus-on-corporate-bond.aspx Sam
ple
16 Sample Industry Market Report (© Worldwide Legal Research 2013)16 Sample Industry Market Report (© Worldwide Legal Research 2013)
Data methodologyThe underlying transactions data in this report (as illustrated
on p13-15 is taken from Market Tracker, a comprehensive
database of all publicly disclosed deals and representation
activity undertaken by the UK’s top 50 law firms by revenue.
The table below includes activity across 15 key commercial
practice areas and matter types, and more than 20 industry
sectors for the selected firm.
The data is collected from publicly available news stories and
press releases, and principally covers banking, funds, capital
market, real estate and M&A transactions. Typical sources include
law firm websites, legal publications and news aggregation sites.
Unlike other databases based on IPO activity, Market Tracker
monitors all key areas of commercial law activity. For each deal or
transaction, data includes the matter type of the activity, industry
sector of the client organisation and a synopsis of the associated
news story.
Date range for this report:
Jan 1st to Dec 31st - 2012
Matter Type Categories
• Antitrust/competition, EU & trade• Banking & Finance - Capital Markets: other• Banking & Finance - Capital Markets: Debt• Banking & Finance - Capital Markets: Equity• Equity sale/issuance, Initial Public Offerings (IPOs), • Banking & Finance - Capital Markets: Derivatives• Banking & Finance - Capital Markets: Restructuring/Insolvency• Banking & Finance - Capital Markets: Structured Finance• Banking & Finance - Real Estate Finance• Banking & Finance - Bank Lending/Credit Facilities• M&A• Mergers and acquisitions• M&A: Acquiror’s Counsel• M&A: Seller’s Counsel• Corporate• Environment & climate change• Employment & pensions• Financial Regulation• Fund/Investment Management• Insurance• Intellectual property• Tax• PPP/PFI• Planning & Development• Asset Sale: Acquiror’s Counsel• Asset Sale: Seller’s Counsel• JV/Alliance/Licence• Outsourcing/IT• Lease/Lettings
Data is provided in filter tables covering the following matter types
Sample Industry Market Report (© Worldwide Legal Research 2013) 17
Law Firm Partner DataLaw Firm Partner Data tracks the number of partners and fee
earners across practice area specialisms and geographical
locations across the top 50 UK firms by revenue. The data is
collected from publicly available biographical information on the
relevant law firm website.
Data range: Data was collected during a 3 week period in
January 2012 and January 2013. This sample only includes data
for 2012 - purchased reports will include the latest data for 2013
Regions covered: Africa; Asia Pacific; Continental Europe;
Eastern Europe; Middle East; Rest of World; South America;
Europe; North America
Select MeasureWeighted Value
RegionShow AllAfricaAsia PacificContinental EuropeEastern EuropeMiddle EastNorth AmericaSouth AmericaUK
Practice AreaAntitrust/Competition, EU & TradeBanking & FinanceCorporate/M&ADebt RecoveryEmployment & PensionsEnergy, Utilities, Natural Resourc..Environment & Climate ChangeFinancial RegulationFund/Investment ManagementHealthcare & PharmaceuticalInsolvencyInsuranceIntellectual PropertyLeisure & SportLitigation & ArbitrationMiningOtherPersonal InjuryPrivate Equity, Wealth & CharitiesPublic SectorReal Estate & ConstructionRegulatory & Public PolicyTaxTechnology, Media & TelecomsTransport & LogisticsWealth Management & Private Cli..
Weighted Value
0 20 40 60 80 100 120 140 160 180 200 220 240 260
DLA Piper
Bird & Bird
Hogan Lovells
SNR Denton
Taylor Wessing
Field Fisher Waterhouse
Pinsent Masons
Squire Sanders
Eversheds
Olswang
Osborne Clarke
Freshfields Bruckhaus Derin..
Norton Rose
Ashurst
Herbert Smith Freehills
Allen & Overy
CMS Cameron McKenna
Linklaters
Berwin Leighton Paisner
Wragge & Co
Simmons & Simmons
SJ Berwin
Herbert Smith
Charles Russell
Slaughter and May
Addleshaw Goddard
DAC Beachcroft
Dundas & Wilson
Hill Dickinson 2.50
3.00
3.33
3.33
3.50
3.50
3.67
4.33
5.67
5.83
6.33
6.83
7.42
7.50
7.67
8.00
9.83
10.08
10.50
12.83
15.08
16.75
17.00
19.50
19.83
22.00
26.67
33.67
55.58
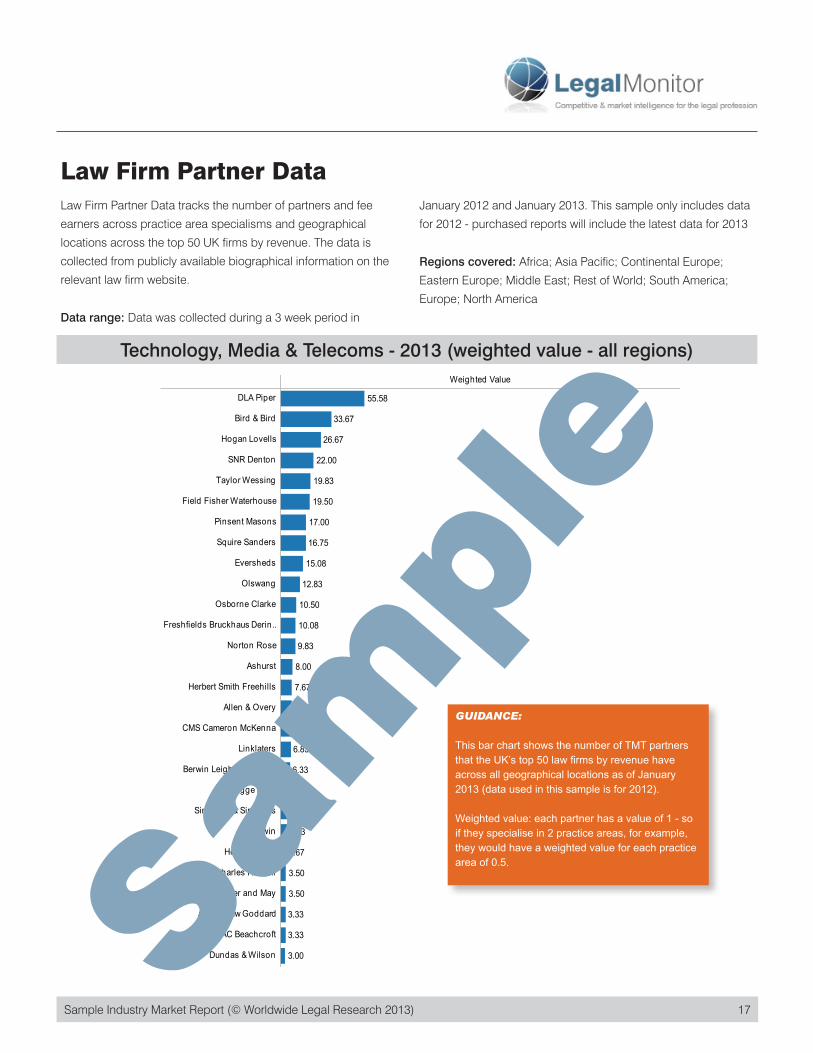
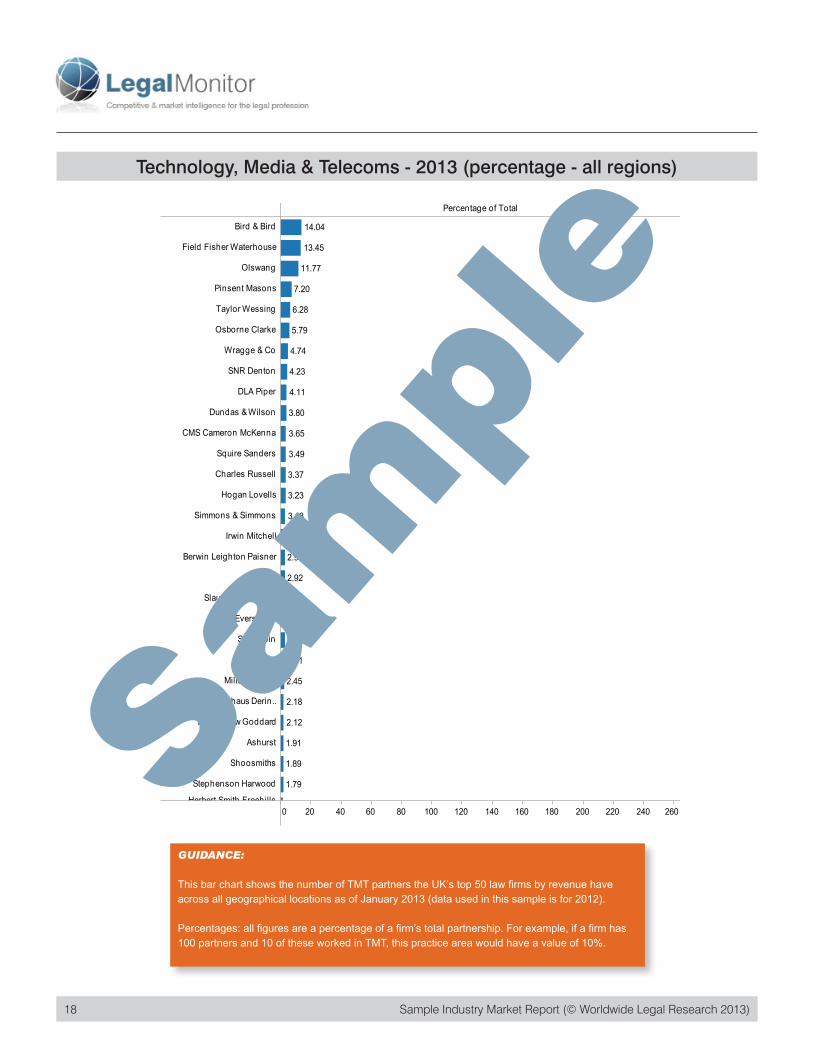
Technology, Media & TelecomsTechnology, Media & Telecoms - 2013 (weighted value - all regions)
Sam
ple
GUIDANCE:
This bar chart shows the number of TMT partners that the UK’s top 50 law firms by revenue have across all geographical locations as of January 2013 (data used in this sample is for 2012).
Weighted value: each partner has a value of 1 - so if they specialise in 2 practice areas, for example, they would have a weighted value for each practice area of 0.5.
18 Sample Industry Market Report (© Worldwide Legal Research 2013)18 Sample Industry Market Report (© Worldwide Legal Research 2013)
Select MeasurePercentage
RegionShow AllAfricaAsia PacificContinental EuropeEastern EuropeMiddle EastNorth AmericaSouth AmericaUK
Practice AreaAntitrust/Competition, EU & TradeBanking & FinanceCorporate/M&ADebt RecoveryEmployment & PensionsEnergy, Utilities, Natural Resourc..Environment & Climate ChangeFinancial RegulationFund/Investment ManagementHealthcare & PharmaceuticalInsolvencyInsuranceIntellectual PropertyLeisure & SportLitigation & ArbitrationMiningOtherPersonal InjuryPrivate Equity, Wealth & CharitiesPublic SectorReal Estate & ConstructionRegulatory & Public PolicyTaxTechnology, Media & TelecomsTransport & LogisticsWealth Management & Private Cli..
Percentage of Total
0 20 40 60 80 100 120 140 160 180 200 220 240 260
Bird & Bird
Field Fisher Waterhouse
Olswang
Pinsent Masons
Taylor Wessing
Osborne Clarke
Wragge & Co
SNR Denton
DLA Piper
Dundas & Wilson
CMS Cameron McKenna
Squire Sanders
Charles Russell
Hogan Lovells
Simmons & Simmons
Irwin Mitchell
Berwin Leighton Paisner
LG
Slaughter and May
Eversheds
SJ Berwin
Withers
Mills & Reeve
Freshfields Bruckhaus Derin..
Addleshaw Goddard
Ashurst
Shoosmiths
Stephenson Harwood
Herbert Smith Freehills 1.70
1.79
1.89
1.91
2.12
2.18
2.45
2.51
2.76
2.79
2.88
2.92
2.93
3.14
3.18
3.23
3.37
3.49
3.65
3.80
4.11
4.23
4.74
5.79
6.28
7.20
11.77
13.45
14.04
Technology, Media & TelecomsTechnology, Media & Telecoms - 2013 (percentage - all regions)Sa
mpl
eGUIDANCE:
This bar chart shows the number of TMT partners the UK’s top 50 law firms by revenue have across all geographical locations as of January 2013 (data used in this sample is for 2012).
Percentages: all figures are a percentage of a firm’s total partnership. For example, if a firm has 100 partners and 10 of these worked in TMT, this practice area would have a value of 10%.
Sample Industry Market Report (© Worldwide Legal Research 2013) 19
Select MeasureWeighted Value
RegionShow AllAfricaAsia PacificContinental EuropeEastern EuropeMiddle EastNorth AmericaSouth AmericaUK
Practice AreaAntitrust/Competition, EU & TradeBanking & FinanceCorporate/M&ADebt RecoveryEmployment & PensionsEnergy, Utilities, Natural Resourc..Environment & Climate ChangeFinancial RegulationFund/Investment ManagementHealthcare & PharmaceuticalInsolvencyInsuranceIntellectual PropertyLeisure & SportLitigation & ArbitrationMiningOtherPersonal InjuryPrivate Equity, Wealth & CharitiesPublic SectorReal Estate & ConstructionRegulatory & Public PolicyTaxTechnology, Media & TelecomsTransport & LogisticsWealth Management & Private Cli..
Weighted Value
0 20 40 60 80 100 120 140 160 180 200 220 240 260
DLA Piper
Field Fisher Waterhouse
Pinsent Masons
Eversheds
Bird & Bird
Olswang
Taylor Wessing
Berwin Leighton Paisner
SNR Denton
Wragge & Co
Squire Sanders
CMS Cameron McKenna
Linklaters
Osborne Clarke
Hogan Lovells
Charles Russell
Slaughter and May
Addleshaw Goddard
DAC Beachcroft
Simmons & Simmons
Dundas & Wilson
SJ Berwin
Herbert Smith
Allen & Overy
Freshfields Bruckhaus Derin..
Hill Dickinson
Mills & Reeve
Withers
Herbert Smith Freehills 2.33
2.50
2.50
2.50
2.50
2.50
2.83
3.00
3.00
3.33
3.33
3.33
3.50
3.50
3.83
4.00
4.00
4.83
5.17
5.33
6.33
6.33
7.33
8.00
9.00
9.33
15.00
15.00
21.00
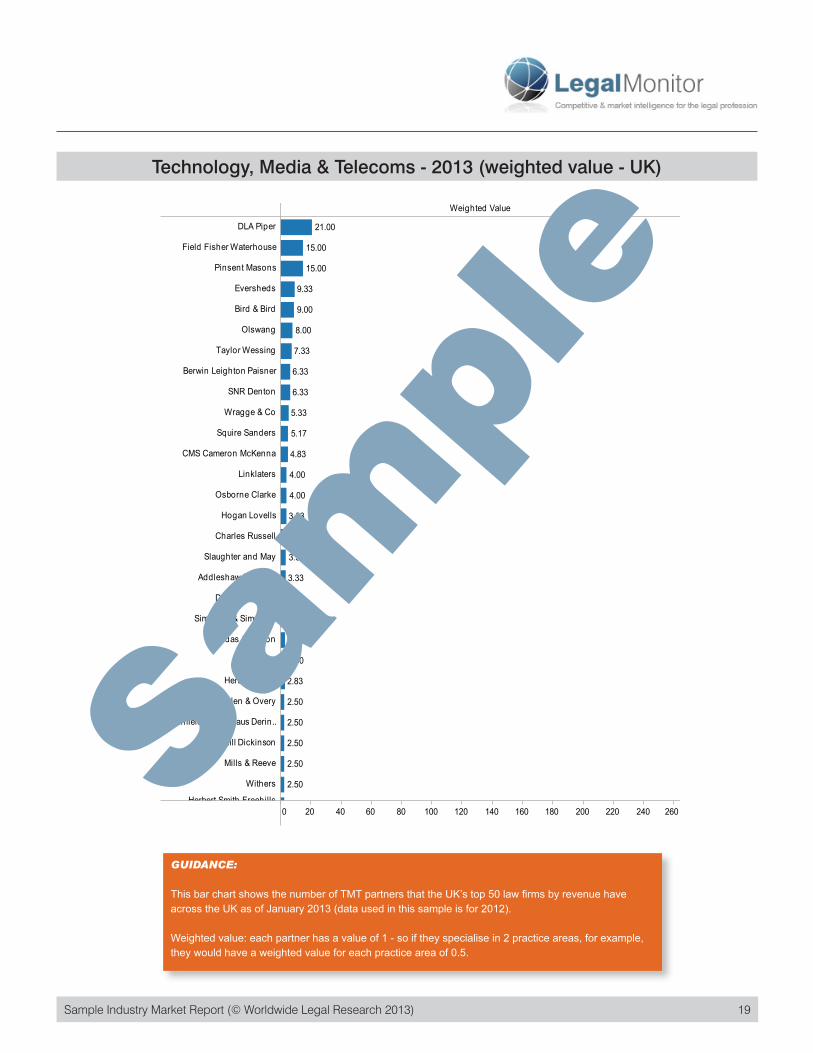
Technology, Media & TelecomsTechnology, Media & Telecoms - 2013 (weighted value - UK)Sa
mpl
eGUIDANCE:
This bar chart shows the number of TMT partners that the UK’s top 50 law firms by revenue have across the UK as of January 2013 (data used in this sample is for 2012).
Weighted value: each partner has a value of 1 - so if they specialise in 2 practice areas, for example, they would have a weighted value for each practice area of 0.5.

20 Sample Industry Market Report (© Worldwide Legal Research 2013)20 Sample Industry Market Report (© Worldwide Legal Research 2013)
Select MeasurePercentage
RegionShow AllAfricaAsia PacificContinental EuropeEastern EuropeMiddle EastNorth AmericaSouth AmericaUK
Practice AreaAntitrust/Competition, EU & TradeBanking & FinanceCorporate/M&ADebt RecoveryEmployment & PensionsEnergy, Utilities, Natural Resourc..Environment & Climate ChangeFinancial RegulationFund/Investment ManagementHealthcare & PharmaceuticalInsolvencyInsuranceIntellectual PropertyLeisure & SportLitigation & ArbitrationMiningOtherPersonal InjuryPrivate Equity, Wealth & CharitiesPublic SectorReal Estate & ConstructionRegulatory & Public PolicyTaxTechnology, Media & TelecomsTransport & LogisticsWealth Management & Private Cli..
Percentage of Total
0 20 40 60 80 100 120 140 160 180 200 220 240 260
Field Fisher Waterhouse
Bird & Bird
Olswang
DLA Piper
Pinsent Masons
Taylor Wessing
SNR Denton
Wragge & Co
Osborne Clarke
Withers
Dundas & Wilson
Squire Sanders
Charles Russell
Simmons & Simmons
Berwin Leighton Paisner
CMS Cameron McKenna
SJ Berwin
Irwin Mitchell
LG
Slaughter and May
Eversheds
Mills & Reeve
Hogan Lovells
Stephenson Harwood
Addleshaw Goddard
Linklaters
Shoosmiths
Herbert Smith
Travers Smith 1.65
1.66
1.89
2.07
2.12
2.38
2.43
2.45
3.05
3.13
3.15
3.17
3.19
3.38
3.39
3.45
3.54
3.60
3.80
4.17
4.32
5.03
5.56
7.19
7.28
7.33
9.76
11.84
14.02
Technology, Media & TelecomsTechnology, Media & Telecoms - 2013 (percentage - UK)Sa
mpl
eGUIDANCE:
This bar chart shows the number of TMT partners the UK’s top 50 law firms by revenue have across the UK as of January 2013 (data used in this sample is for 2012).
Percentages: all figures are a percentage of a firm’s total partnership. For example, if a firm has 100 partners and 10 of these worked in TMT, this practice area would have a value of 10%.
This is a headline
Sample Industry Market Report (© Worldwide Legal Research 2013) 21
Select MeasureWeighted Value
RegionShow AllAfricaAsia PacificContinental EuropeEastern EuropeMiddle EastNorth AmericaSouth AmericaUK
Practice AreaAntitrust/Competition, EU & TradeBanking & FinanceCorporate/M&ADebt RecoveryEmployment & PensionsEnergy, Utilities, Natural Resourc..Environment & Climate ChangeFinancial RegulationFund/Investment ManagementHealthcare & PharmaceuticalInsolvencyInsuranceIntellectual PropertyLeisure & SportLitigation & ArbitrationMiningOtherPersonal InjuryPrivate Equity, Wealth & CharitiesPublic SectorReal Estate & ConstructionRegulatory & Public PolicyTaxTechnology, Media & TelecomsTransport & LogisticsWealth Management & Private Cli..
Weighted Value
0 20 40 60 80 100 120 140 160 180 200 220 240 260
Bird & Bird
DLA Piper
Taylor Wessing
Hogan Lovells
Freshfields Bruckhaus Derin..
Osborne Clarke
Field Fisher Waterhouse
Eversheds
Olswang
Allen & Overy
Linklaters
Simmons & Simmons
Norton Rose
SJ Berwin
Squire Sanders
Ashurst
Herbert Smith Freehills
Wragge & Co
Clifford Chance
Herbert Smith
Berwin Leighton Paisner
Charles Russell
Clyde & Co
DAC Beachcroft
Hill Dickinson
Holman Fenwick Willan
Ince & Co
Irwin Mitchell
Kennedys 0.00
0.00
0.00
0.00
0.00
0.00
0.00
0.00
0.00
0.33
0.33
0.50
0.50
0.50
0.67
1.33
1.50
1.83
2.83
3.00
3.33
3.75
4.50
6.50
7.08
9.83
11.17
12.75
19.00
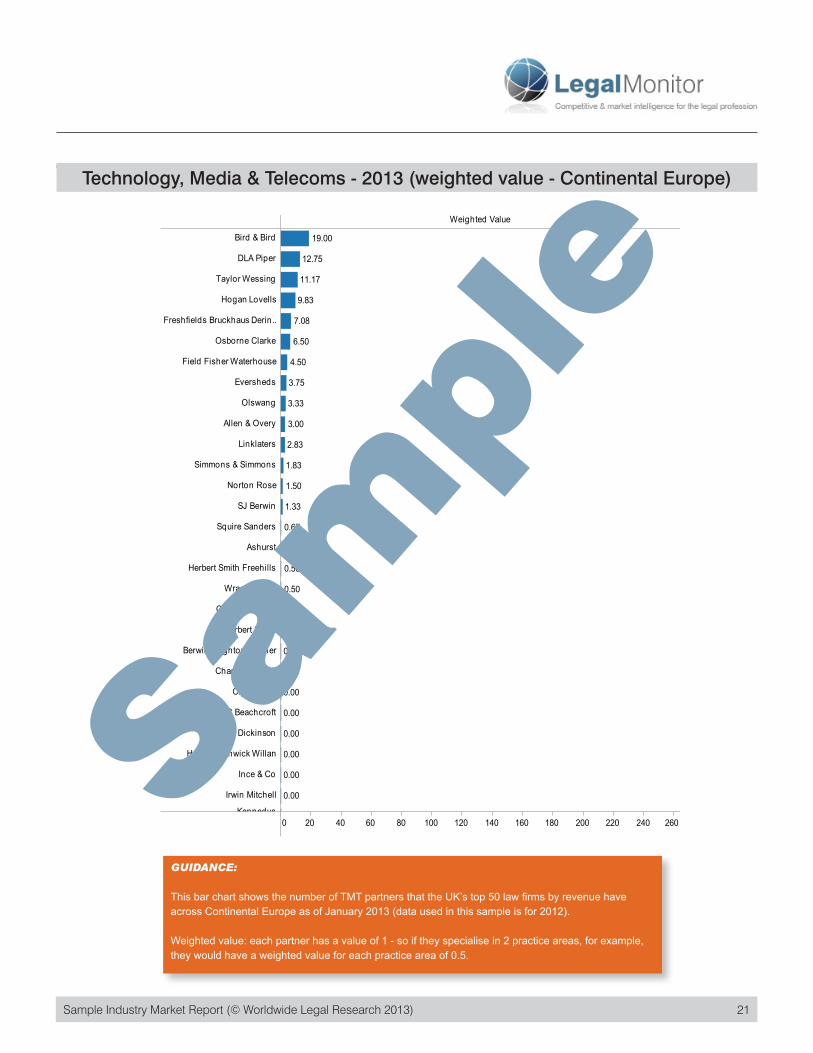
Technology, Media & TelecomsTechnology, Media & Telecoms - 2013 (weighted value - Continental Europe)
Sam
ple
GUIDANCE:
This bar chart shows the number of TMT partners that the UK’s top 50 law firms by revenue have across Continental Europe as of January 2013 (data used in this sample is for 2012).
Weighted value: each partner has a value of 1 - so if they specialise in 2 practice areas, for example, they would have a weighted value for each practice area of 0.5.
This is a headline
22 Sample Industry Market Report (© Worldwide Legal Research 2013)
Select MeasurePercentage
RegionShow AllAfricaAsia PacificContinental EuropeEastern EuropeMiddle EastNorth AmericaSouth AmericaUK
Practice AreaAntitrust/Competition, EU & TradeBanking & FinanceCorporate/M&ADebt RecoveryEmployment & PensionsEnergy, Utilities, Natural Resourc..Environment & Climate ChangeFinancial RegulationFund/Investment ManagementHealthcare & PharmaceuticalInsolvencyInsuranceIntellectual PropertyLeisure & SportLitigation & ArbitrationMiningOtherPersonal InjuryPrivate Equity, Wealth & CharitiesPublic SectorReal Estate & ConstructionRegulatory & Public PolicyTaxTechnology, Media & TelecomsTransport & LogisticsWealth Management & Private Cli..
Percentage of Total
0 20 40 60 80 100 120 140 160 180 200 220 240 260
Olswang
Bird & Bird
Field Fisher Waterhouse
Osborne Clarke
Taylor Wessing
DLA Piper
Hogan Lovells
Wragge & Co
Freshfields Bruckhaus Derin..
Eversheds
Simmons & Simmons
SJ Berwin
Norton Rose
Allen & Overy
Squire Sanders
Linklaters
Herbert Smith Freehills
Herbert Smith
Ashurst
Clifford Chance
Berwin Leighton Paisner
Charles Russell
Clyde & Co
DAC Beachcroft
Hill Dickinson
Holman Fenwick Willan
Ince & Co
Irwin Mitchell
Kennedys 0.00
0.00
0.00
0.00
0.00
0.00
0.00
0.00
0.00
0.17
0.68
1.04
1.52
1.67
1.67
1.79
1.88
2.34
2.84
3.00
3.04
3.57
5.43
6.01
6.27
7.39
11.84
14.18
14.49
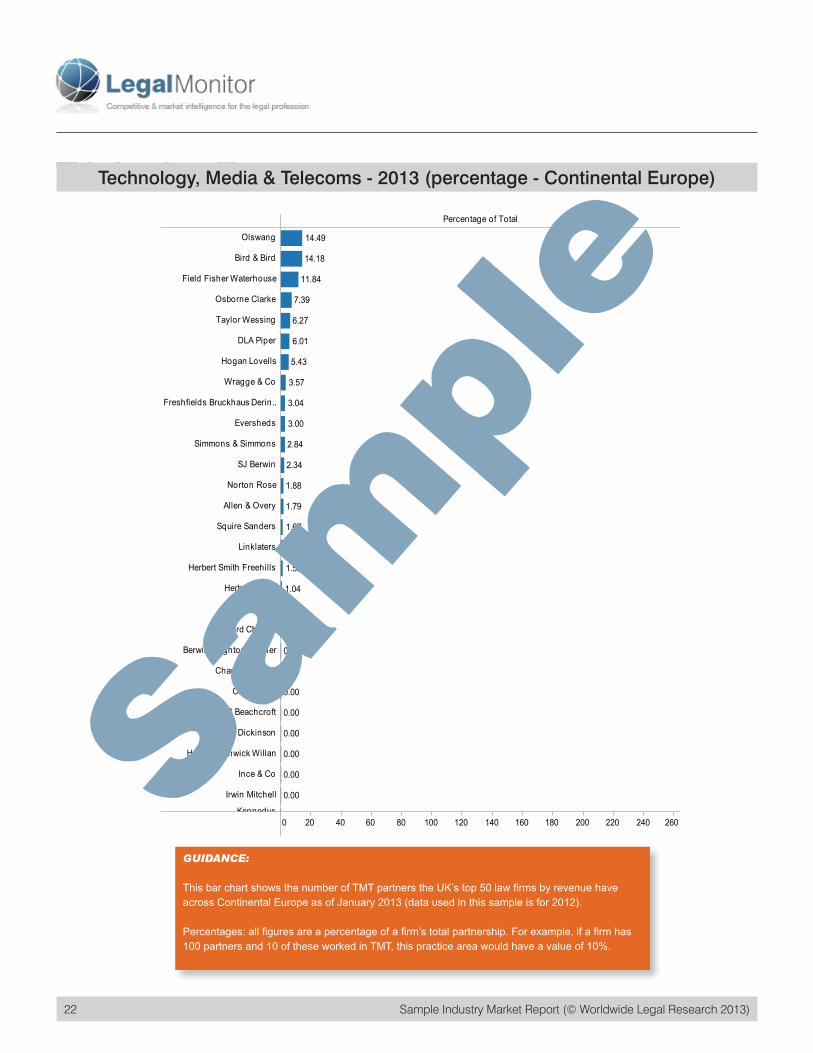
Technology, Media & TelecomsTechnology, Media & Telecoms - 2013 (percentage - Continental Europe)
Sam
ple
GUIDANCE:
This bar chart shows the number of TMT partners the UK’s top 50 law firms by revenue have across Continental Europe as of January 2013 (data used in this sample is for 2012).
Percentages: all figures are a percentage of a firm’s total partnership. For example, if a firm has 100 partners and 10 of these worked in TMT, this practice area would have a value of 10%.
Sample Industry Market Report (© Worldwide Legal Research 2013) 23
Select MeasureWeighted Value
RegionShow AllAfricaAsia PacificContinental EuropeEastern EuropeMiddle EastNorth AmericaSouth AmericaUK
Practice AreaAntitrust/Competition, EU & TradeBanking & FinanceCorporate/M&ADebt RecoveryEmployment & PensionsEnergy, Utilities, Natural Resourc..Environment & Climate ChangeFinancial RegulationFund/Investment ManagementHealthcare & PharmaceuticalInsolvencyInsuranceIntellectual PropertyLeisure & SportLitigation & ArbitrationMiningOtherPersonal InjuryPrivate Equity, Wealth & CharitiesPublic SectorReal Estate & ConstructionRegulatory & Public PolicyTaxTechnology, Media & TelecomsTransport & LogisticsWealth Management & Private Cli..
Weighted Value
0 20 40 60 80 100 120 140 160 180 200 220 240 260
CMS Cameron McKenna
Bird & Bird
DLA Piper
Eversheds
Squire Sanders
Hogan Lovells
Allen & Overy
Ashurst
Berwin Leighton Paisner
Clifford Chance
Clyde & Co
Freshfields Bruckhaus Derin..
Herbert Smith
Herbert Smith Freehills
LG
Linklaters
Norton Rose
SNR Denton 0.000
0.000
0.000
0.000
0.000
0.000
0.000
0.000
0.000
0.000
0.000
0.000
0.500
1.000
1.000
1.333
1.500
2.583
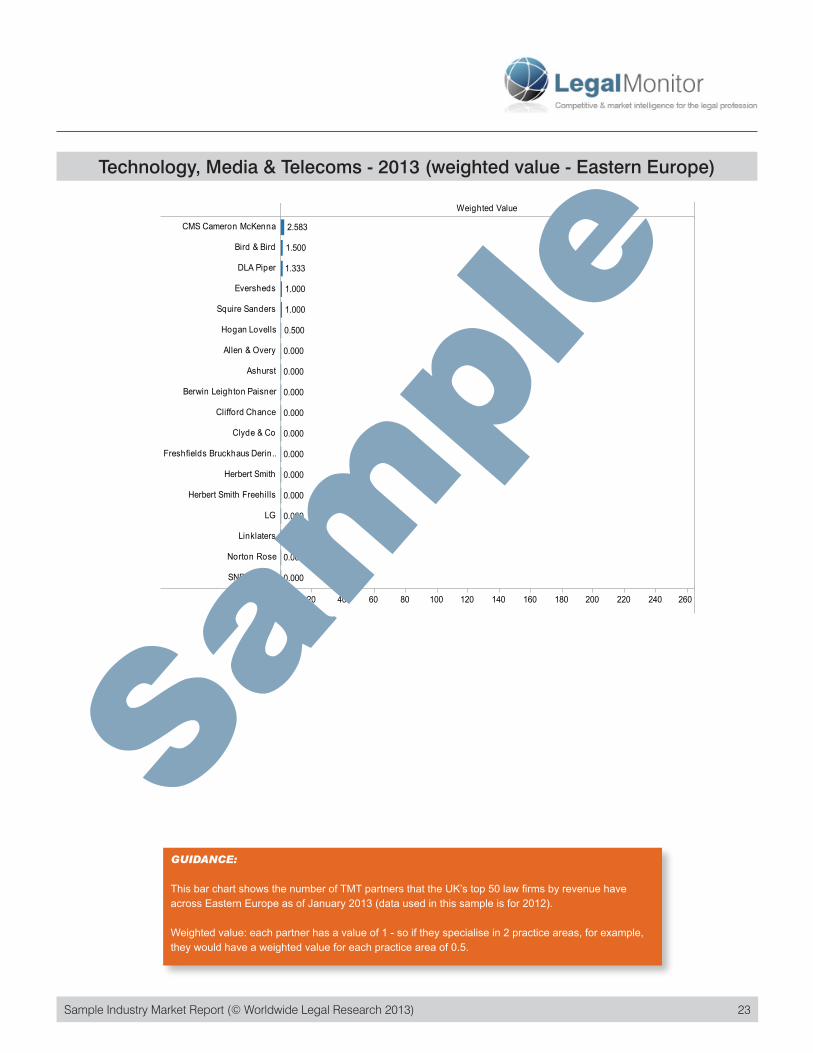
Technology, Media & TelecomsTechnology, Media & Telecoms - 2013 (weighted value - Eastern Europe)
Sam
ple
GUIDANCE:
This bar chart shows the number of TMT partners that the UK’s top 50 law firms by revenue have across Eastern Europe as of January 2013 (data used in this sample is for 2012).
Weighted value: each partner has a value of 1 - so if they specialise in 2 practice areas, for example, they would have a weighted value for each practice area of 0.5.
24 Sample Industry Market Report (© Worldwide Legal Research 2013)24 Sample Industry Market Report (© Worldwide Legal Research 2013)
Select MeasurePercentage
RegionShow AllAfricaAsia PacificContinental EuropeEastern EuropeMiddle EastNorth AmericaSouth AmericaUK
Practice AreaAntitrust/Competition, EU & TradeBanking & FinanceCorporate/M&ADebt RecoveryEmployment & PensionsEnergy, Utilities, Natural Resourc..Environment & Climate ChangeFinancial RegulationFund/Investment ManagementHealthcare & PharmaceuticalInsolvencyInsuranceIntellectual PropertyLeisure & SportLitigation & ArbitrationMiningOtherPersonal InjuryPrivate Equity, Wealth & CharitiesPublic SectorReal Estate & ConstructionRegulatory & Public PolicyTaxTechnology, Media & TelecomsTransport & LogisticsWealth Management & Private Cli..
Percentage of Total
0 20 40 60 80 100 120 140 160 180 200 220 240 260
Bird & Bird
CMS Cameron McKenna
DLA Piper
Squire Sanders
Hogan Lovells
Eversheds
Allen & Overy
Ashurst
Berwin Leighton Paisner
Clifford Chance
Clyde & Co
Freshfields Bruckhaus Derin..
Herbert Smith
Herbert Smith Freehills
LG
Linklaters
Norton Rose
SNR Denton 0.00
0.00
0.00
0.00
0.00
0.00
0.00
0.00
0.00
0.00
0.00
0.00
2.86
2.94
3.77
3.81
4.38
25.00
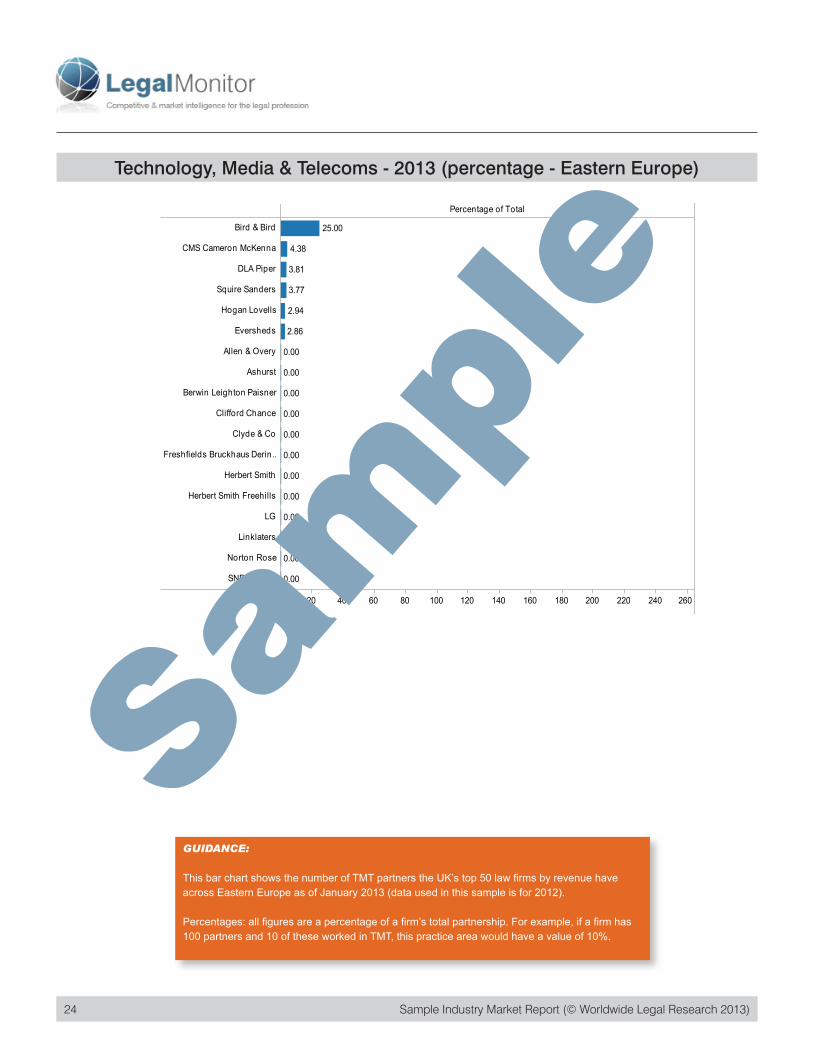
Technology, Media & TelecomsTechnology, Media & Telecoms - 2013 (percentage - Eastern Europe)
Sam
ple
GUIDANCE:
This bar chart shows the number of TMT partners the UK’s top 50 law firms by revenue have across Eastern Europe as of January 2013 (data used in this sample is for 2012).
Percentages: all figures are a percentage of a firm’s total partnership. For example, if a firm has 100 partners and 10 of these worked in TMT, this practice area would have a value of 10%.
Sample Industry Market Report (© Worldwide Legal Research 2013) 25
Select MeasureWeighted Value
RegionShow AllAfricaAsia PacificContinental EuropeEastern EuropeMiddle EastNorth AmericaSouth AmericaUK
Practice AreaAntitrust/Competition, EU & TradeBanking & FinanceCorporate/M&ADebt RecoveryEmployment & PensionsEnergy, Utilities, Natural Resourc..Environment & Climate ChangeFinancial RegulationFund/Investment ManagementHealthcare & PharmaceuticalInsolvencyInsuranceIntellectual PropertyLeisure & SportLitigation & ArbitrationMiningOtherPersonal InjuryPrivate Equity, Wealth & CharitiesPublic SectorReal Estate & ConstructionRegulatory & Public PolicyTaxTechnology, Media & TelecomsTransport & LogisticsWealth Management & Private Cli..
Weighted Value
0 20 40 60 80 100 120 140 160 180 200 220 240 260
Ashurst
Herbert Smith Freehills
DLA Piper
Bird & Bird
Norton Rose
Olswang
Taylor Wessing
Squire Sanders
Eversheds
Pinsent Masons
Hogan Lovells
Allen & Overy
Freshfields Bruckhaus Derin..
Herbert Smith
Kennedys
Berwin Leighton Paisner
Clifford Chance
Clyde & Co
DAC Beachcroft
Hill Dickinson
Holman Fenwick Willan
Ince & Co
Linklaters
Nabarro
Simmons & Simmons
SJ Berwin
Slaughter and May
SNR Denton
Stephenson Harwood 0.000
0.000
0.000
0.000
0.000
0.000
0.000
0.000
0.000
0.000
0.000
0.000
0.000
0.000
0.500
0.500
0.500
0.500
0.833
1.000
1.000
1.167
1.333
1.500
2.333
4.167
4.500
4.833
5.833
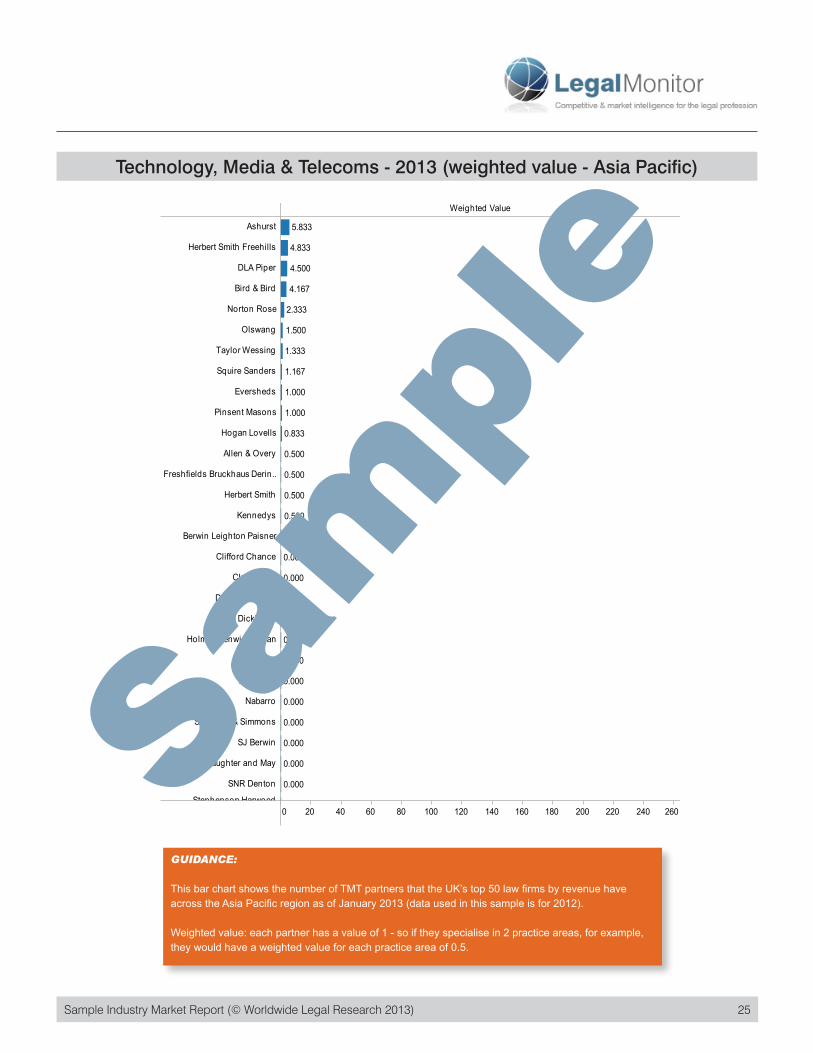
Technology, Media & TelecomsTechnology, Media & Telecoms - 2013 (weighted value - Asia Pacific)
Sam
ple
GUIDANCE:
This bar chart shows the number of TMT partners that the UK’s top 50 law firms by revenue have across the Asia Pacific region as of January 2013 (data used in this sample is for 2012).
Weighted value: each partner has a value of 1 - so if they specialise in 2 practice areas, for example, they would have a weighted value for each practice area of 0.5.
26 Sample Industry Market Report (© Worldwide Legal Research 2013)26 Sample Industry Market Report (© Worldwide Legal Research 2013)
Select MeasurePercentage
RegionShow AllAfricaAsia PacificContinental EuropeEastern EuropeMiddle EastNorth AmericaSouth AmericaUK
Practice AreaAntitrust/Competition, EU & TradeBanking & FinanceCorporate/M&ADebt RecoveryEmployment & PensionsEnergy, Utilities, Natural Resourc..Environment & Climate ChangeFinancial RegulationFund/Investment ManagementHealthcare & PharmaceuticalInsolvencyInsuranceIntellectual PropertyLeisure & SportLitigation & ArbitrationMiningOtherPersonal InjuryPrivate Equity, Wealth & CharitiesPublic SectorReal Estate & ConstructionRegulatory & Public PolicyTaxTechnology, Media & TelecomsTransport & LogisticsWealth Management & Private Cli..
Percentage of Total
0 20 40 60 80 100 120 140 160 180 200 220 240 260
Olswang
Bird & Bird
Eversheds
Pinsent Masons
Taylor Wessing
Squire Sanders
Ashurst
DLA Piper
Herbert Smith Freehills
Hogan Lovells
Freshfields Bruckhaus Derin..
Kennedys
Norton Rose
Herbert Smith
Allen & Overy
Berwin Leighton Paisner
Clifford Chance
Clyde & Co
DAC Beachcroft
Hill Dickinson
Holman Fenwick Willan
Ince & Co
Linklaters
Nabarro
Simmons & Simmons
SJ Berwin
Slaughter and May
SNR Denton
Stephenson Harwood 0.00
0.00
0.00
0.00
0.00
0.00
0.00
0.00
0.00
0.00
0.00
0.00
0.00
0.00
0.76
1.16
1.18
1.92
2.00
2.03
2.14
2.69
2.73
3.72
4.17
4.76
6.67
18.25
37.50
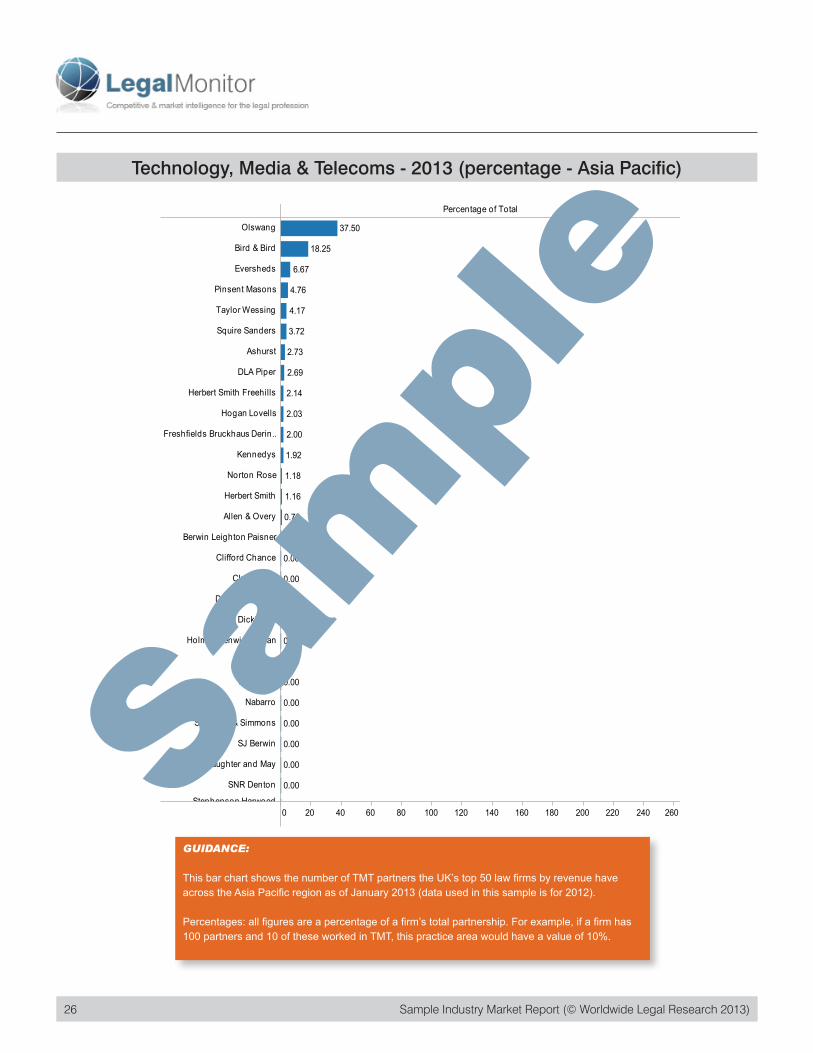
Technology, Media & TelecomsTechnology, Media & Telecoms - 2013 (percentage - Asia Pacific)Sa
mpl
eGUIDANCE:
This bar chart shows the number of TMT partners the UK’s top 50 law firms by revenue have across the Asia Pacific region as of January 2013 (data used in this sample is for 2012).
Percentages: all figures are a percentage of a firm’s total partnership. For example, if a firm has 100 partners and 10 of these worked in TMT, this practice area would have a value of 10%.
Sample Industry Market Report (© Worldwide Legal Research 2013) 27
Select MeasureWeighted Value
RegionShow AllAfricaAsia PacificContinental EuropeEastern EuropeMiddle EastNorth AmericaSouth AmericaUK
Practice AreaAntitrust/Competition, EU & TradeBanking & FinanceCorporate/M&ADebt RecoveryEmployment & PensionsEnergy, Utilities, Natural Resourc..Environment & Climate ChangeFinancial RegulationFund/Investment ManagementHealthcare & PharmaceuticalInsolvencyInsuranceIntellectual PropertyLeisure & SportLitigation & ArbitrationMiningOtherPersonal InjuryPrivate Equity, Wealth & CharitiesPublic SectorReal Estate & ConstructionRegulatory & Public PolicyTaxTechnology, Media & TelecomsTransport & LogisticsWealth Management & Private Cli..
Weighted Value
0 20 40 60 80 100 120 140 160 180 200 220 240 260
DLA Piper
Allen & Overy
Norton Rose
Pinsent Masons
SNR Denton
Simmons & Simmons
Ashurst
Berwin Leighton Paisner
Bird & Bird
Charles Russell
Clifford Chance
Clyde & Co
Eversheds
Freshfields Bruckhaus Derin..
Herbert Smith
Herbert Smith Freehills
Hogan Lovells
Holman Fenwick Willan
Ince & Co
Kennedys
LG
Linklaters
SJ Berwin
Squire Sanders
Taylor Wessing
Trowers & Hamlins
Wragge & Co 0.000
0.000
0.000
0.000
0.000
0.000
0.000
0.000
0.000
0.000
0.000
0.000
0.000
0.000
0.000
0.000
0.000
0.000
0.000
0.000
0.000
0.500
1.000
1.000
1.000
1.000
2.000
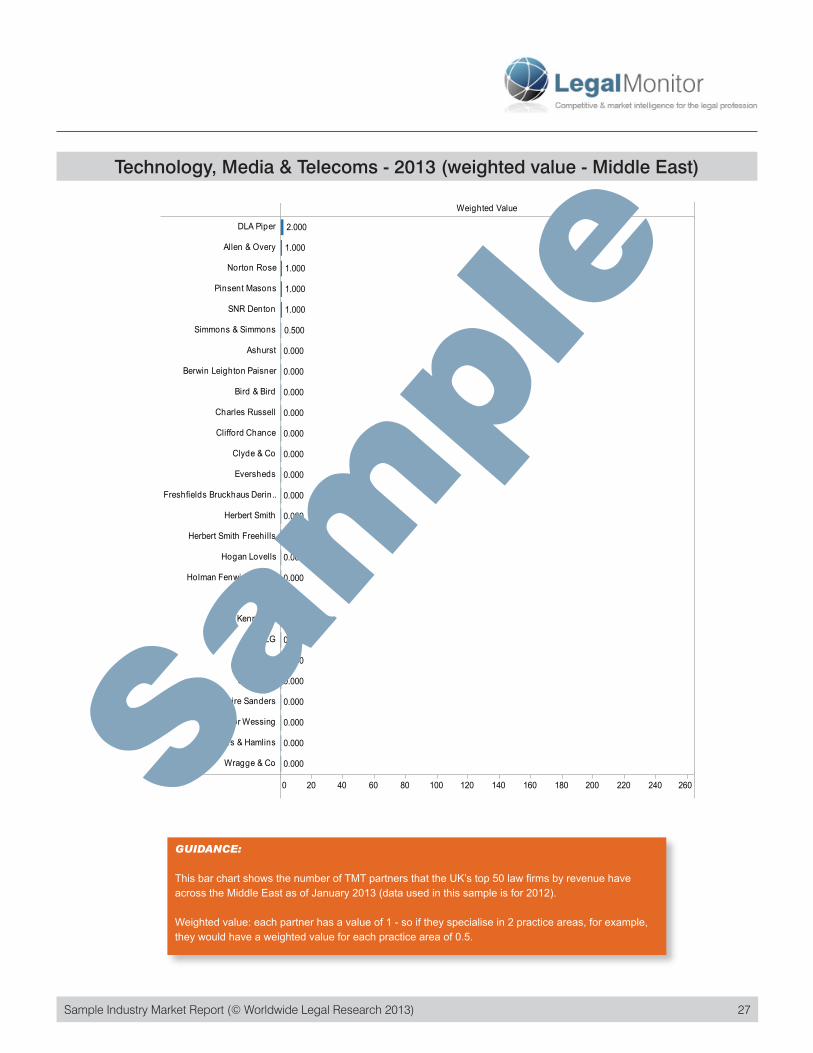
Technology, Media & TelecomsTechnology, Media & Telecoms - 2013 (weighted value - Middle East)
Sam
ple
GUIDANCE:
This bar chart shows the number of TMT partners that the UK’s top 50 law firms by revenue have across the Middle East as of January 2013 (data used in this sample is for 2012).
Weighted value: each partner has a value of 1 - so if they specialise in 2 practice areas, for example, they would have a weighted value for each practice area of 0.5.

28 Sample Industry Market Report (© Worldwide Legal Research 2013)28 Sample Industry Market Report (© Worldwide Legal Research 2013)
Select MeasurePercentage
RegionShow AllAfricaAsia PacificContinental EuropeEastern EuropeMiddle EastNorth AmericaSouth AmericaUK
Practice AreaAntitrust/Competition, EU & TradeBanking & FinanceCorporate/M&ADebt RecoveryEmployment & PensionsEnergy, Utilities, Natural Resourc..Environment & Climate ChangeFinancial RegulationFund/Investment ManagementHealthcare & PharmaceuticalInsolvencyInsuranceIntellectual PropertyLeisure & SportLitigation & ArbitrationMiningOtherPersonal InjuryPrivate Equity, Wealth & CharitiesPublic SectorReal Estate & ConstructionRegulatory & Public PolicyTaxTechnology, Media & TelecomsTransport & LogisticsWealth Management & Private Cli..
Percentage of Total
0 20 40 60 80 100 120 140 160 180 200 220 240 260
Pinsent Masons
Norton Rose
Simmons & Simmons
DLA Piper
Allen & Overy
SNR Denton
Ashurst
Berwin Leighton Paisner
Bird & Bird
Charles Russell
Clifford Chance
Clyde & Co
Eversheds
Freshfields Bruckhaus Derin..
Herbert Smith
Herbert Smith Freehills
Hogan Lovells
Holman Fenwick Willan
Ince & Co
Kennedys
LG
Linklaters
SJ Berwin
Squire Sanders
Taylor Wessing
Trowers & Hamlins
Wragge & Co 0.00
0.00
0.00
0.00
0.00
0.00
0.00
0.00
0.00
0.00
0.00
0.00
0.00
0.00
0.00
0.00
0.00
0.00
0.00
0.00
0.00
3.70
4.17
7.69
9.09
10.00
11.11
Technology, Media & TelecomsTechnology, Media & Telecoms - 2013 (percentage - Middle East)Sa
mpl
eGUIDANCE:
This bar chart shows the number of TMT partners the UK’s top 50 law firms by revenue have across the Middle East as of January 2013 (data used in this sample is for 2012).
Percentages: all figures are a percentage of a firm’s total partnership. For example, if a firm has 100 partners and 10 of these worked in TMT, this practice area would have a value of 10%.
Sample Industry Market Report (© Worldwide Legal Research 2013) 29
Select MeasureWeighted Value
RegionShow AllAfricaAsia PacificContinental EuropeEastern EuropeMiddle EastNorth AmericaSouth AmericaUK
Practice AreaAntitrust/Competition, EU & TradeBanking & FinanceCorporate/M&ADebt RecoveryEmployment & PensionsEnergy, Utilities, Natural Resourc..Environment & Climate ChangeFinancial RegulationFund/Investment ManagementHealthcare & PharmaceuticalInsolvencyInsuranceIntellectual PropertyLeisure & SportLitigation & ArbitrationMiningOtherPersonal InjuryPrivate Equity, Wealth & CharitiesPublic SectorReal Estate & ConstructionRegulatory & Public PolicyTaxTechnology, Media & TelecomsTransport & LogisticsWealth Management & Private Cli..
Weighted Value
0 20 40 60 80 100 120 140 160 180 200 220 240 260
DLA Piper
Allen & Overy
Norton Rose
Pinsent Masons
SNR Denton
Simmons & Simmons
Ashurst
Berwin Leighton Paisner
Bird & Bird
Charles Russell
Clifford Chance
Clyde & Co
Eversheds
Freshfields Bruckhaus Derin..
Herbert Smith
Herbert Smith Freehills
Hogan Lovells
Holman Fenwick Willan
Ince & Co
Kennedys
LG
Linklaters
SJ Berwin
Squire Sanders
Taylor Wessing
Trowers & Hamlins
Wragge & Co 0.000
0.000
0.000
0.000
0.000
0.000
0.000
0.000
0.000
0.000
0.000
0.000
0.000
0.000
0.000
0.000
0.000
0.000
0.000
0.000
0.000
0.500
1.000
1.000
1.000
1.000
2.000
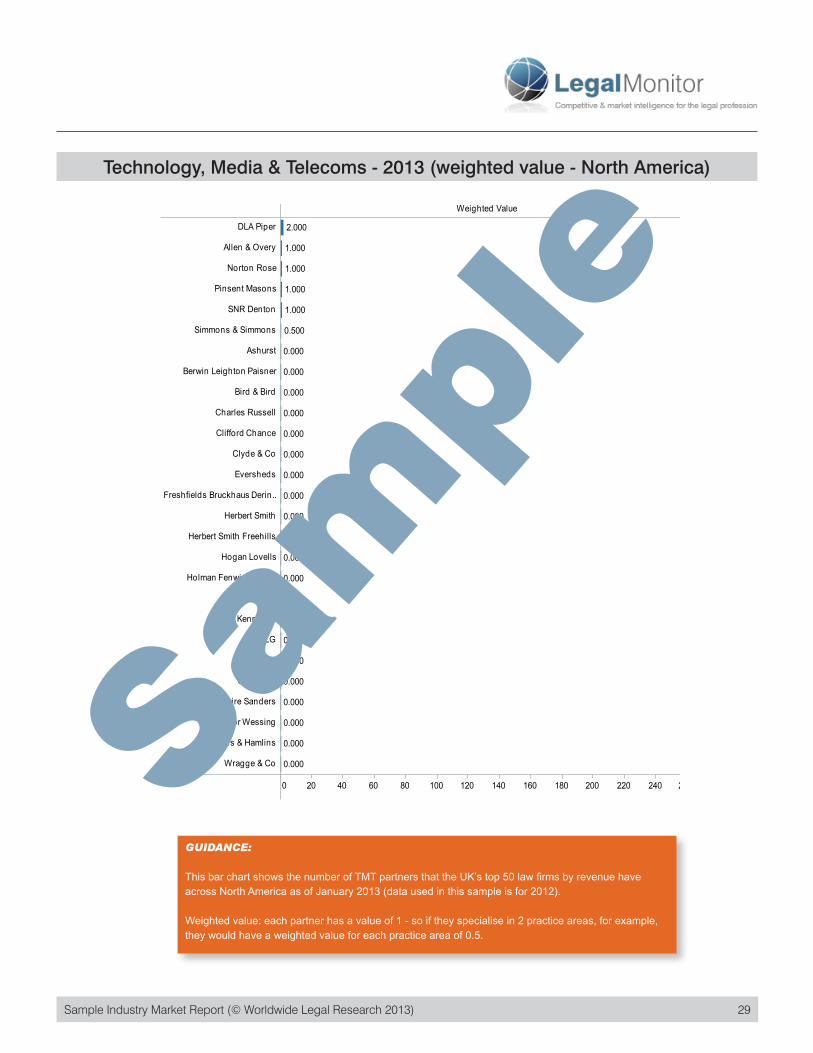
Technology, Media & TelecomsTechnology, Media & Telecoms - 2013 (weighted value - North America)
Sam
ple
GUIDANCE:
This bar chart shows the number of TMT partners that the UK’s top 50 law firms by revenue have across North America as of January 2013 (data used in this sample is for 2012).
Weighted value: each partner has a value of 1 - so if they specialise in 2 practice areas, for example, they would have a weighted value for each practice area of 0.5.
30 Sample Industry Market Report (© Worldwide Legal Research 2013)30 Sample Industry Market Report (© Worldwide Legal Research 2013)
Select MeasurePercentage
RegionShow AllAfricaAsia PacificContinental EuropeEastern EuropeMiddle EastNorth AmericaSouth AmericaUK
Practice AreaAntitrust/Competition, EU & TradeBanking & FinanceCorporate/M&ADebt RecoveryEmployment & PensionsEnergy, Utilities, Natural Resourc..Environment & Climate ChangeFinancial RegulationFund/Investment ManagementHealthcare & PharmaceuticalInsolvencyInsuranceIntellectual PropertyLeisure & SportLitigation & ArbitrationMiningOtherPersonal InjuryPrivate Equity, Wealth & CharitiesPublic SectorReal Estate & ConstructionRegulatory & Public PolicyTaxTechnology, Media & TelecomsTransport & LogisticsWealth Management & Private Cli..
Percentage of Total
0 20 40 60 80 100 120 140 160 180 200 220 240 260
Pinsent Masons
Norton Rose
Simmons & Simmons
DLA Piper
Allen & Overy
SNR Denton
Ashurst
Berwin Leighton Paisner
Bird & Bird
Charles Russell
Clifford Chance
Clyde & Co
Eversheds
Freshfields Bruckhaus Derin..
Herbert Smith
Herbert Smith Freehills
Hogan Lovells
Holman Fenwick Willan
Ince & Co
Kennedys
LG
Linklaters
SJ Berwin
Squire Sanders
Taylor Wessing
Trowers & Hamlins
Wragge & Co 0.00
0.00
0.00
0.00
0.00
0.00
0.00
0.00
0.00
0.00
0.00
0.00
0.00
0.00
0.00
0.00
0.00
0.00
0.00
0.00
0.00
3.70
4.17
7.69
9.09
10.00
11.11
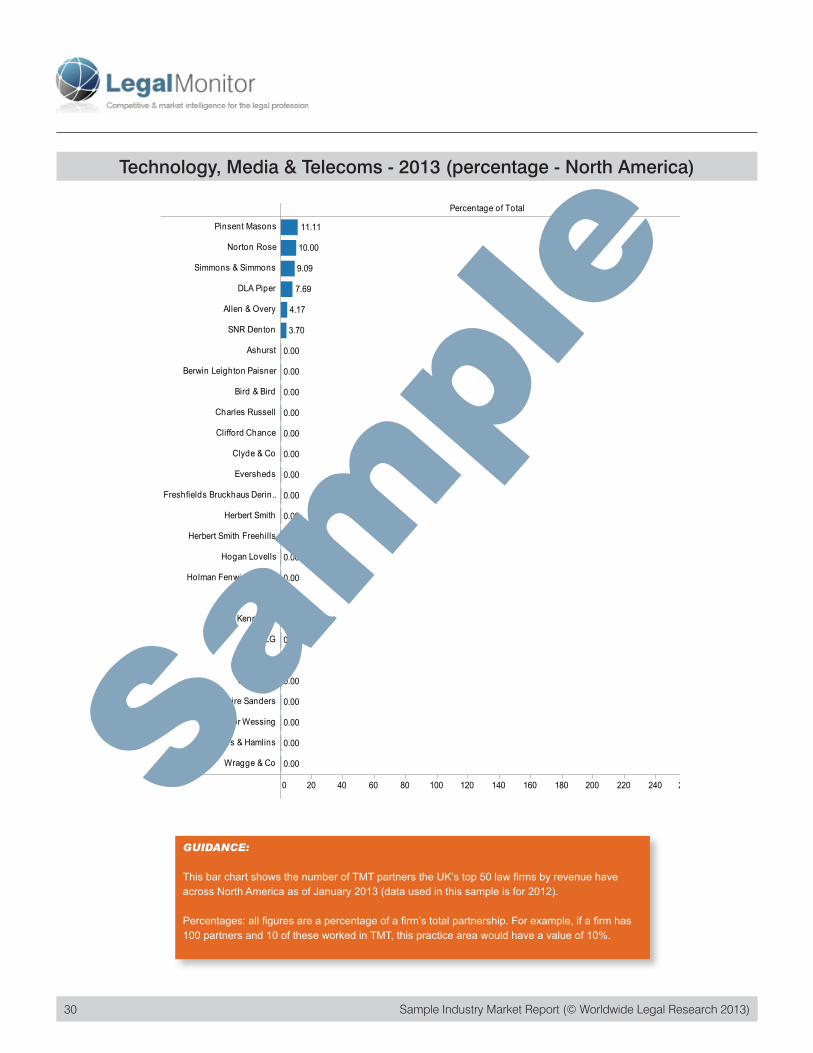
Technology, Media & TelecomsTechnology, Media & Telecoms - 2013 (percentage - North America)
Sam
ple
GUIDANCE:
This bar chart shows the number of TMT partners the UK’s top 50 law firms by revenue have across North America as of January 2013 (data used in this sample is for 2012).
Percentages: all figures are a percentage of a firm’s total partnership. For example, if a firm has 100 partners and 10 of these worked in TMT, this practice area would have a value of 10%.
Sample Industry Market Report (© Worldwide Legal Research 2013) 31
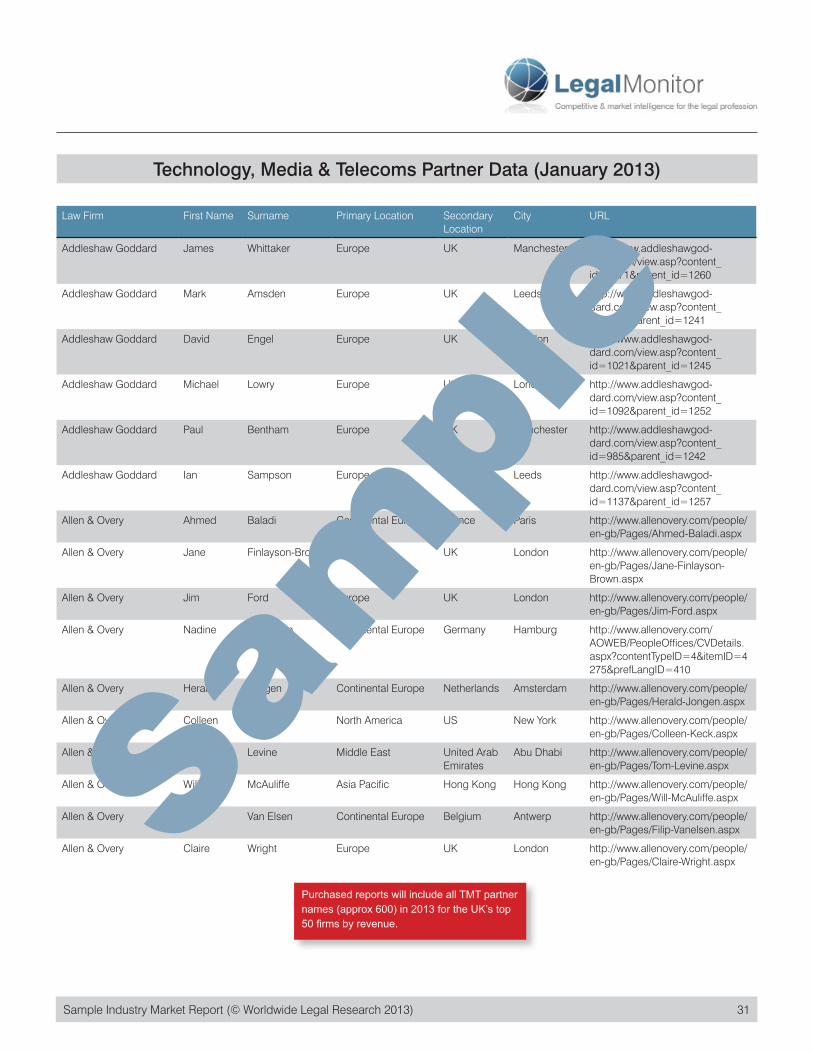
Technology, Media & Telecoms Partner Data (January 2013)
Purchased reports will include all TMT partner names (approx 600) in 2013 for the UK’s top 50 firms by revenue.
Law Firm First Name Surname Primary Location Secondary Location
City URL
Addleshaw Goddard James Whittaker Europe UK Manchester http://www.addleshawgod-dard.com/view.asp?content_id=1171&parent_id=1260
Addleshaw Goddard Mark Amsden Europe UK Leeds http://www.addleshawgod-dard.com/view.asp?content_id=977&parent_id=1241
Addleshaw Goddard David Engel Europe UK London http://www.addleshawgod-dard.com/view.asp?content_id=1021&parent_id=1245
Addleshaw Goddard Michael Lowry Europe UK London http://www.addleshawgod-dard.com/view.asp?content_id=1092&parent_id=1252
Addleshaw Goddard Paul Bentham Europe UK Manchester http://www.addleshawgod-dard.com/view.asp?content_id=985&parent_id=1242
Addleshaw Goddard Ian Sampson Europe UK Leeds http://www.addleshawgod-dard.com/view.asp?content_id=1137&parent_id=1257
Allen & Overy Ahmed Baladi Continental Europe France Paris http://www.allenovery.com/people/en-gb/Pages/Ahmed-Baladi.aspx
Allen & Overy Jane Finlayson-Brown Europe UK London http://www.allenovery.com/people/en-gb/Pages/Jane-Finlayson-Brown.aspx
Allen & Overy Jim Ford Europe UK London http://www.allenovery.com/people/en-gb/Pages/Jim-Ford.aspx
Allen & Overy Nadine Herrmann Continental Europe Germany Hamburg http://www.allenovery.com/AOWEB/PeopleOffices/CVDetails.aspx?contentTypeID=4&itemID=4275&prefLangID=410
Allen & Overy Herald Jongen Continental Europe Netherlands Amsterdam http://www.allenovery.com/people/en-gb/Pages/Herald-Jongen.aspx
Allen & Overy Colleen Keck North America US New York http://www.allenovery.com/people/en-gb/Pages/Colleen-Keck.aspx
Allen & Overy Tom Levine Middle East United Arab Emirates
Abu Dhabi http://www.allenovery.com/people/en-gb/Pages/Tom-Levine.aspx
Allen & Overy Will McAuliffe Asia Pacific Hong Kong Hong Kong http://www.allenovery.com/people/en-gb/Pages/Will-McAuliffe.aspx
Allen & Overy Filip Van Elsen Continental Europe Belgium Antwerp http://www.allenovery.com/people/en-gb/Pages/Filip-Vanelsen.aspx
Allen & Overy Claire Wright Europe UK London http://www.allenovery.com/people/en-gb/Pages/Claire-Wright.aspx
Sam
ple
32 Sample Industry Market Report (© Worldwide Legal Research 2013)
Year2012
Regional BreakdownNo Regional Breakdown
Firm Filter TypeTop 50 Firms Only
Select Practice AreaTechnology, Media & Telecoms
% or ActualNumber of Partners
No Regional Breakdown Selected
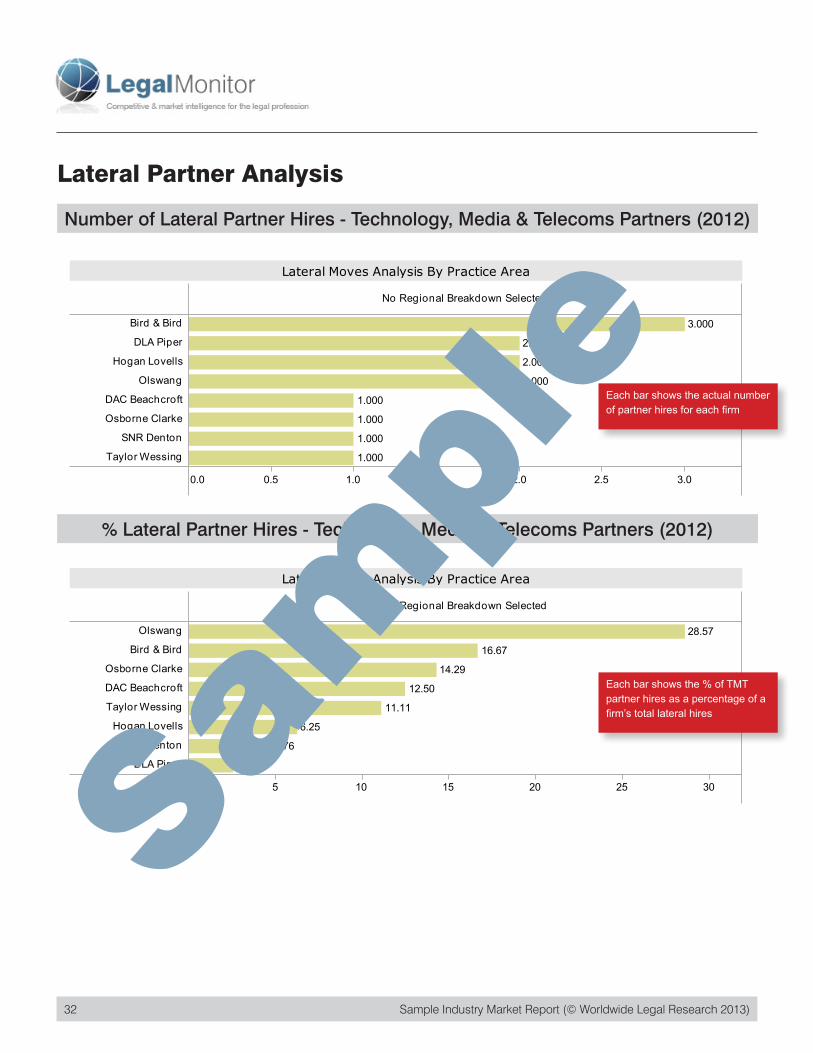
0.0 0.5 1.0 1.5 2.0 2.5 3.0
Bird & Bird
DLA Piper
Hogan Lovells
Olswang
DAC Beachcroft
Osborne Clarke
SNR Denton
Taylor Wessing 1.000
1.000
1.000
1.000
2.000
2.000
2.000
3.000
Lateral Moves Analysis By Practice Area
ColourNo Regional Breakdown Selected
Lateral Partner Analysis
Number of Lateral Partner Hires - Technology, Media & Telecoms Partners (2012)
Year2012
Regional BreakdownNo Regional Breakdown
Firm Filter TypeTop 50 Firms Only
Select Practice AreaTechnology, Media & Telecoms
% or Actual% of Total Partners
No Regional Breakdown Selected
0 5 10 15 20 25 30
Olswang
Bird & Bird
Osborne Clarke
DAC Beachcroft
Taylor Wessing
Hogan Lovells
SNR Denton
DLA Piper 2.56
4.76
6.25
11.11
12.50
14.29
16.67
28.57
Lateral Moves Analysis By Practice Area
ColourNo Regional Breakdown Selected
% Lateral Partner Hires - Technology, Media & Telecoms Partners (2012)
Each bar shows the actual number of partner hires for each firm
Each bar shows the % of TMT partner hires as a percentage of a firm’s total lateral hires
Sam
ple
Sample Industry Market Report (© Worldwide Legal Research 2013) 33
Year2012
Regional BreakdownRegional Breakdown
Firm Filter TypeTop 50 Firms Only
Select Practice AreaTechnology, Media & Telecoms
% or ActualNumber of Partners
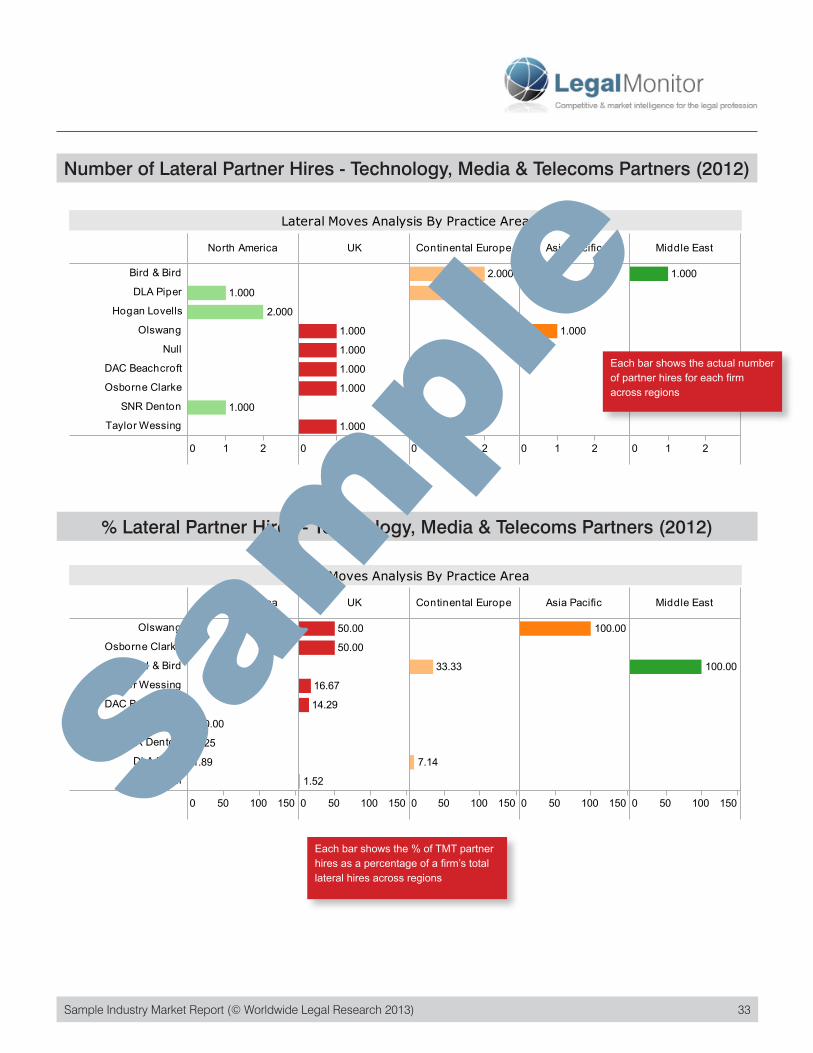
North America UK Continental Europe Asia Pacific Middle East
0 1 2 0 1 2 0 1 2 0 1 2 0 1 2
Bird & Bird
DLA Piper
Hogan Lovells
Olswang
Null
DAC Beachcroft
Osborne Clarke
SNR Denton
Taylor Wessing
1.000
2.000
1.000
1.000
1.000
1.000
1.000
1.000
1.000
2.000
1.000
1.000
Lateral Moves Analysis By Practice Area
ColourNorth America
UK
Continental Euro..
Asia Pacific
Middle East
Number of Lateral Partner Hires - Technology, Media & Telecoms Partners (2012)
Year2012
Regional BreakdownRegional Breakdown
Firm Filter TypeTop 50 Firms Only
Select Practice AreaTechnology, Media & Telecoms
% or Actual% of Total Partners
North America UK Continental Europe Asia Pacific Middle East
0 50 100 150 0 50 100 150 0 50 100 150 0 50 100 150 0 50 100 150
Olswang
Osborne Clarke
Bird & Bird
Taylor Wessing
DAC Beachcroft
Hogan Lovells
SNR Denton
DLA Piper
Null
1.89
6.25
10.00
1.52
14.29
16.67
50.00
50.00
7.14
33.33
100.00
100.00
Lateral Moves Analysis By Practice Area
ColourNorth America
UK
Continental Euro..
Asia Pacific
Middle East
% Lateral Partner Hires - Technology, Media & Telecoms Partners (2012)
Each bar shows the actual number of partner hires for each firm across regions
Each bar shows the % of TMT partner hires as a percentage of a firm’s total lateral hires across regions
Sam
ple
This is a headline
34 Sample Industry Market Report (© Worldwide Legal Research 2013)
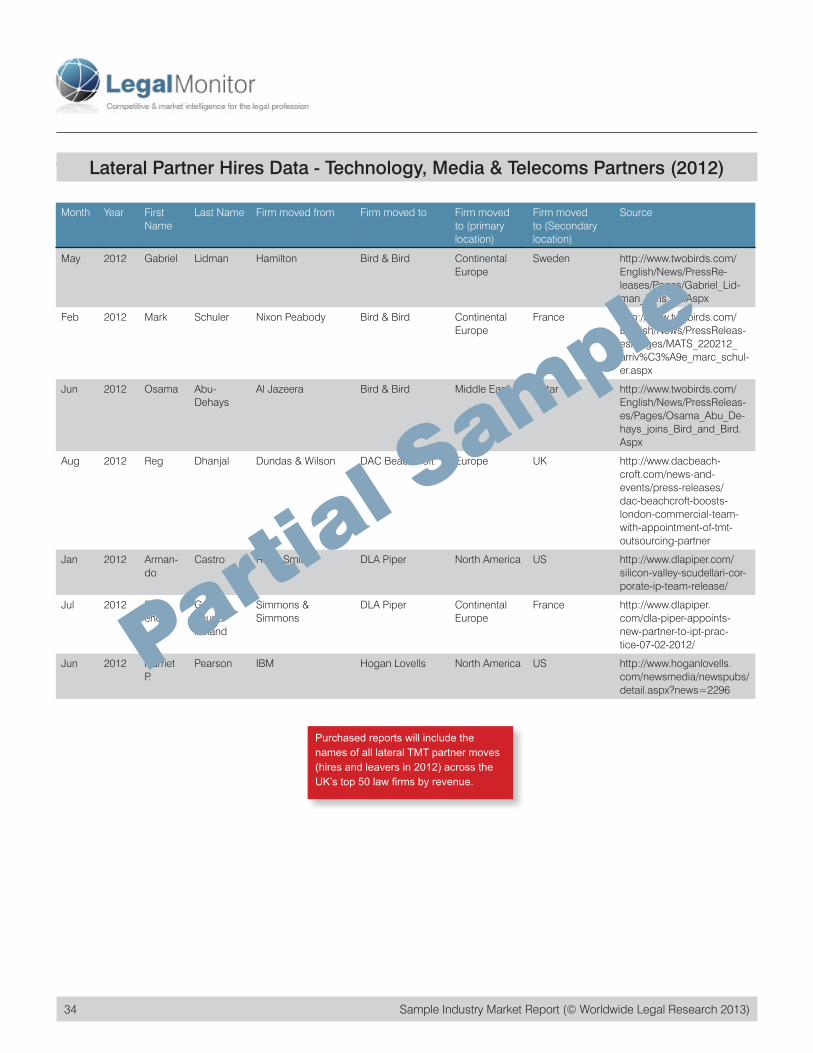
Lateral Partner Hires Data - Technology, Media & Telecoms Partners (2012)
Purchased reports will include the names of all lateral TMT partner moves (hires and leavers in 2012) across the UK’s top 50 law firms by revenue.
Month Year First Name
Last Name Firm moved from Firm moved to Firm moved to (primary location)
Firm moved to (Secondary location)
Source
May 2012 Gabriel Lidman Hamilton Bird & Bird Continental Europe
Sweden http://www.twobirds.com/English/News/PressRe-leases/Pages/Gabriel_Lid-man_joins_us.Aspx
Feb 2012 Mark Schuler Nixon Peabody Bird & Bird Continental Europe
France http://www.twobirds.com/English/News/PressReleas-es/Pages/MATS_220212_arriv%C3%A9e_marc_schul-er.aspx
Jun 2012 Osama Abu-Dehays
Al Jazeera Bird & Bird Middle East Qatar http://www.twobirds.com/English/News/PressReleas-es/Pages/Osama_Abu_De-hays_joins_Bird_and_Bird.Aspx
Aug 2012 Reg Dhanjal Dundas & Wilson DAC Beachcroft Europe UK http://www.dacbeach-croft.com/news-and-events/press-releases/dac-beachcroft-boosts-london-commercial-team-with-appointment-of-tmt-outsourcing-partner
Jan 2012 Arman-do
Castro Reed Smith DLA Piper North America US http://www.dlapiper.com/silicon-valley-scudellari-cor-porate-ip-team-release/
Jul 2012 Flor-ence
Guth-freund-Roland
Simmons & Simmons
DLA Piper Continental Europe
France http://www.dlapiper.com/dla-piper-appoints-new-partner-to-ipt-prac-tice-07-02-2012/
Jun 2012 Harriet P.
Pearson IBM Hogan Lovells North America US http://www.hoganlovells.com/newsmedia/newspubs/detail.aspx?news=2296
Partial S
ample
Sample Industry Market Report (© Worldwide Legal Research 2013) 35
Partial S
ample% or ActualNumber of Partners
Year2012
No Regional Breakdown
Practice AreaAntitrust/Competition, EU & TradeBanking & FinanceCorporate/M&AEmployment & PensionsEnergy, Utilities, Natural ResourcesEnvironment & Climate ChangeFinancial RegulationFund/Investment ManagementGovernment & Public PolicyHealthcare & Life SciencesInsuranceIntellectual PropertyLitigation & ArbitrationOtherPersonal InjuryPrivate Equity, Wealth and CharitiesPublic SectorReal Estate & ConstructionTaxTechnology, Media & TelecomsTransport & LogisticsWealth Management & Private Client
Firm NameBird & BirdHogan LovellsSquire SandersTaylor WessingTrowers & Hamlins
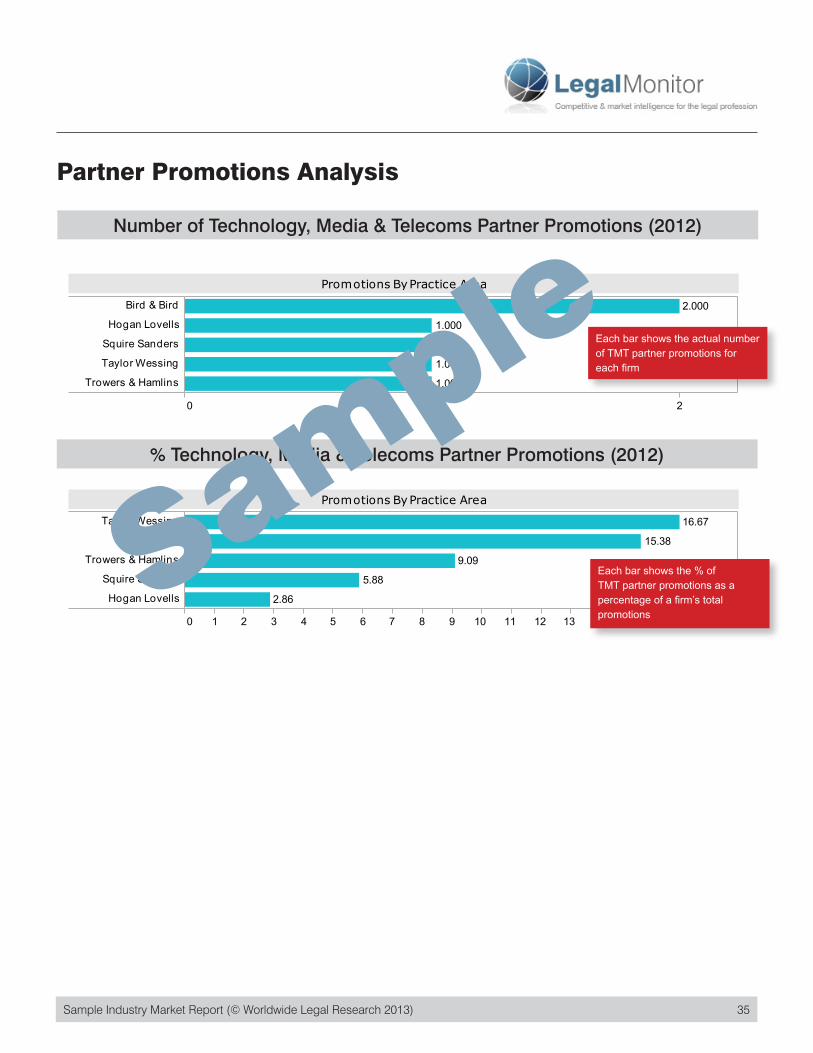
0 1 2
Bird & Bird
Hogan Lovells
Squire Sanders
Taylor Wessing
Trowers & Hamlins 1.000
1.000
1.000
1.000
2.000
Promotions By Practice Area
RegionsNo Regional Breakdown Selected
Partner Promotions Analysis
Number of Technology, Media & Telecoms Partner Promotions (2012)
% Technology, Media & Telecoms Partner Promotions (2012)
% or Actual% of Total Partners
Year2012
No Regional Breakdown
Practice AreaAntitrust/Competition, EU & TradeBanking & FinanceCorporate/M&AEmployment & PensionsEnergy, Utilities, Natural ResourcesEnvironment & Climate ChangeFinancial RegulationFund/Investment ManagementGovernment & Public PolicyHealthcare & Life SciencesInsuranceIntellectual PropertyLitigation & ArbitrationOtherPersonal InjuryPrivate Equity, Wealth and CharitiesPublic SectorReal Estate & ConstructionTaxTechnology, Media & TelecomsTransport & LogisticsWealth Management & Private Client
Firm NameBird & BirdHogan LovellsSquire SandersTaylor WessingTrowers & Hamlins
0 1 2 3 4 5 6 7 8 9 10 11 12 13 14 15 16 17 18
Taylor Wessing
Bird & Bird
Trowers & Hamlins
Squire Sanders
Hogan Lovells 2.86
5.88
9.09
15.38
16.67
Promotions By Practice Area
RegionsNo Regional Breakdown Selected
Each bar shows the actual number of TMT partner promotions for each firm
Each bar shows the % of TMT partner promotions as a percentage of a firm’s total promotions
Sample
36 Sample Industry Market Report (© Worldwide Legal Research 2013)36 Sample Industry Market Report (© Worldwide Legal Research 2013)
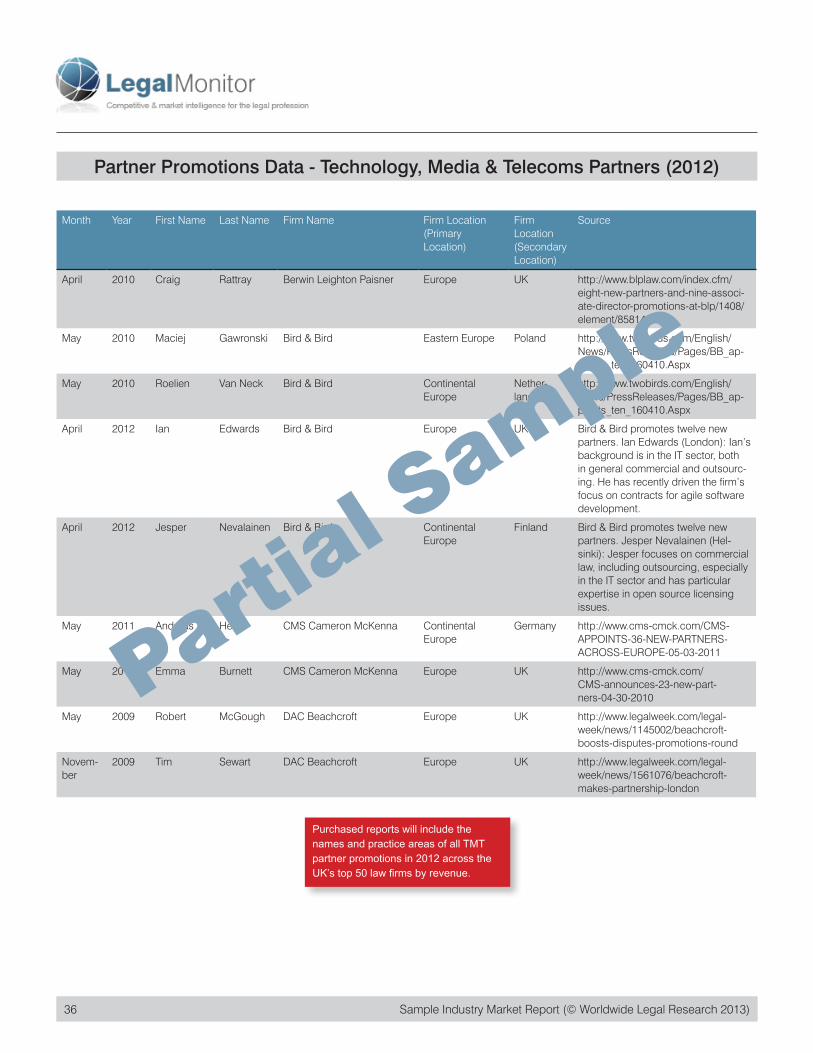
Partner Promotions Data - Technology, Media & Telecoms Partners (2012)
Month Year First Name Last Name Firm Name Firm Location (Primary Location)
Firm Location (Secondary Location)
Source
April 2010 Craig Rattray Berwin Leighton Paisner Europe UK http://www.blplaw.com/index.cfm/eight-new-partners-and-nine-associ-ate-director-promotions-at-blp/1408/element/85814
May 2010 Maciej Gawronski Bird & Bird Eastern Europe Poland http://www.twobirds.com/English/News/PressReleases/Pages/BB_ap-points_ten_160410.Aspx
May 2010 Roelien Van Neck Bird & Bird Continental Europe
Nether-lands
http://www.twobirds.com/English/News/PressReleases/Pages/BB_ap-points_ten_160410.Aspx
April 2012 Ian Edwards Bird & Bird Europe UK Bird & Bird promotes twelve new partners. Ian Edwards (London): Ian’s background is in the IT sector, both in general commercial and outsourc-ing. He has recently driven the firm’s focus on contracts for agile software development.
April 2012 Jesper Nevalainen Bird & Bird Continental Europe
Finland Bird & Bird promotes twelve new partners. Jesper Nevalainen (Hel-sinki): Jesper focuses on commercial law, including outsourcing, especially in the IT sector and has particular expertise in open source licensing issues.
May 2011 Andreas Heim CMS Cameron McKenna Continental Europe
Germany http://www.cms-cmck.com/CMS-APPOINTS-36-NEW-PARTNERS-ACROSS-EUROPE-05-03-2011
May 2010 Emma Burnett CMS Cameron McKenna Europe UK http://www.cms-cmck.com/CMS-announces-23-new-part-ners-04-30-2010
May 2009 Robert McGough DAC Beachcroft Europe UK http://www.legalweek.com/legal-week/news/1145002/beachcroft-boosts-disputes-promotions-round
Novem-ber
2009 Tim Sewart DAC Beachcroft Europe UK http://www.legalweek.com/legal-week/news/1561076/beachcroft-makes-partnership-london
Purchased reports will include the names and practice areas of all TMT partner promotions in 2012 across the UK’s top 50 law firms by revenue.
Partial S
ample