sampling frequency for water quality monitoring
TRANSCRIPT

State Water Survey Division AQUATIC CHEMISTRY SECTION
Illinois Department of Energy and Natural Resources
SWS Contract Report 279
SAMPLING FREQUENCY FOR WATER QUALITY MONITORING
by
Robert H. Harmeson and
Michael J. Barcelona
Grant No. R-804337
Project Officer Richard L. Bateman
Coordination and Analysis Staff Advanced Monitoring Systems Division
Environmental Monitoring Systems Laboratory Las Vegas, Nevada 89114
November 1981
Champaign, Illinois

DISCLAIMER
This report has been reviewed by the Environmental Monitoring Systems Laboratory, U.S. Environmental Protection Agency, and approved for publication. Approval does not signify that the contents necessarily reflect the views and policies of the U.S. Environmental Protection Agency, nor does mention of trade names or commercial products constitute endorsement or recommendation for use.
i
ABSTRACT
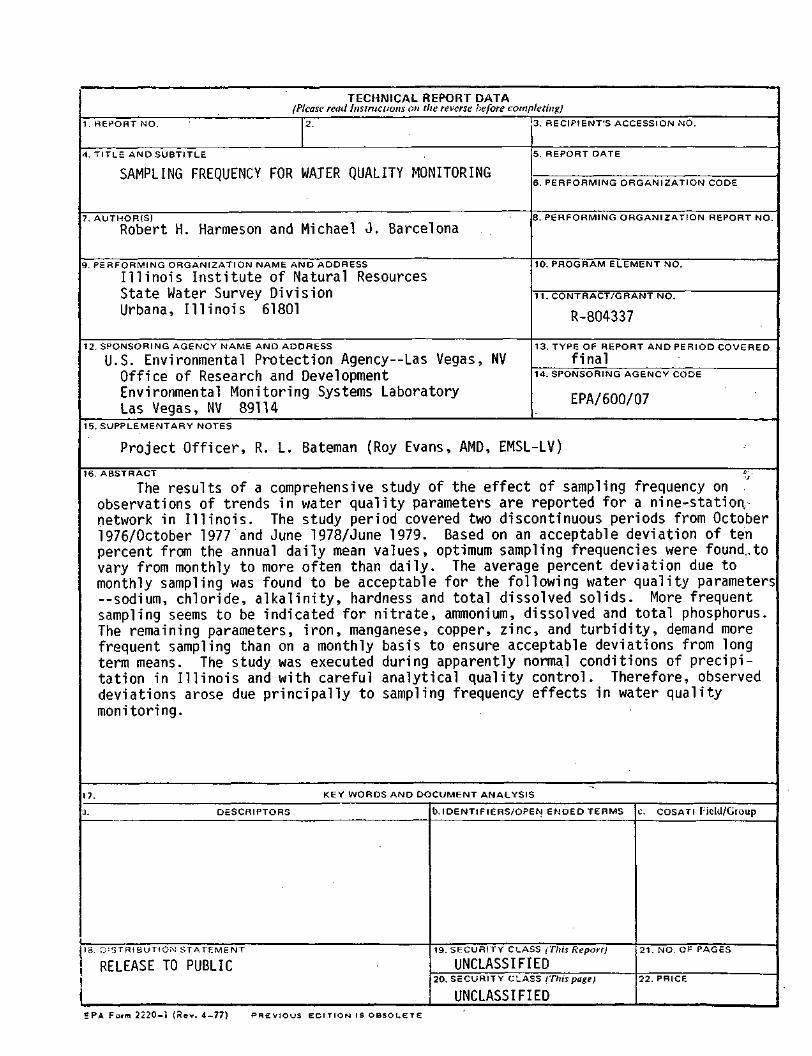
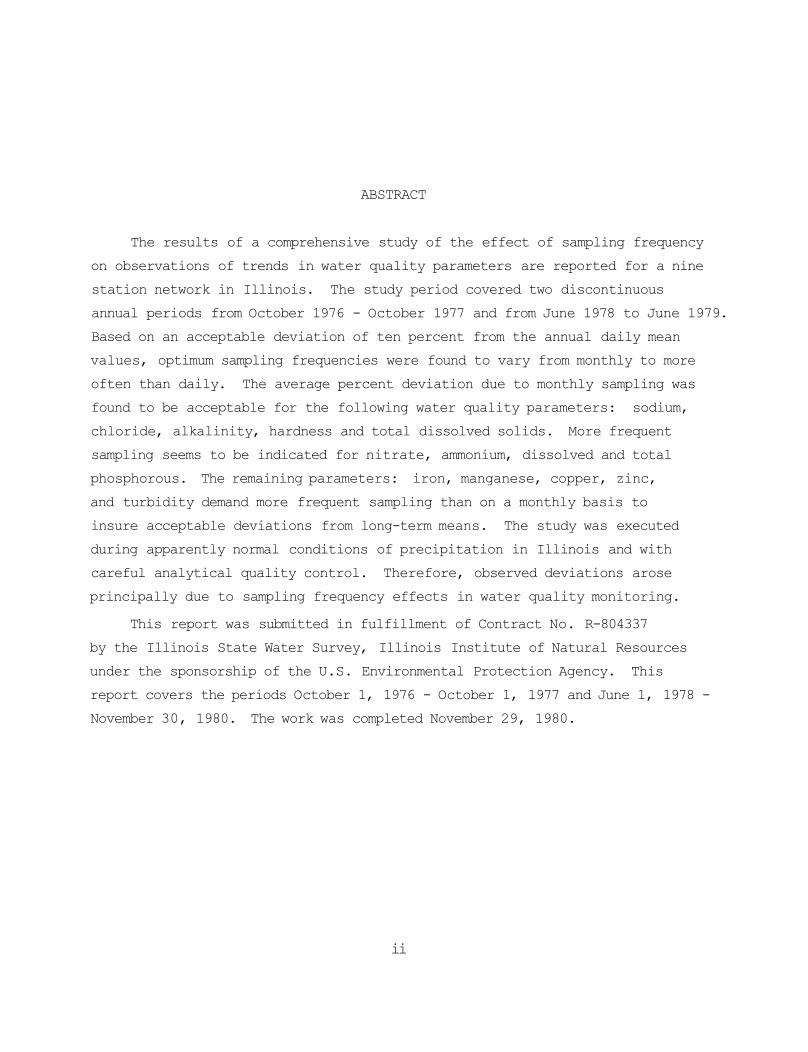
The results of a comprehensive study of the effect of sampling frequency on observations of trends in water quality parameters are reported for a nine station network in Illinois. The study period covered two discontinuous annual periods from October 1976 - October 1977 and from June 1978 to June 1979. Based on an acceptable deviation of ten percent from the annual daily mean values, optimum sampling frequencies were found to vary from monthly to more often than daily. The average percent deviation due to monthly sampling was found to be acceptable for the following water quality parameters: sodium, chloride, alkalinity, hardness and total dissolved solids. More frequent sampling seems to be indicated for nitrate, ammonium, dissolved and total phosphorous. The remaining parameters: iron, manganese, copper, zinc, and turbidity demand more frequent sampling than on a monthly basis to insure acceptable deviations from long-term means. The study was executed during apparently normal conditions of precipitation in Illinois and with careful analytical quality control. Therefore, observed deviations arose principally due to sampling frequency effects in water quality monitoring.
This report was submitted in fulfillment of Contract No. R-804337 by the Illinois State Water Survey, Illinois Institute of Natural Resources under the sponsorship of the U.S. Environmental Protection Agency. This report covers the periods October 1, 1976 - October 1, 1977 and June 1, 1978 -November 30, 1980. The work was completed November 29, 1980.
ii

CONTENTS
Abstract . ii Figures iv Tables v Acknowledgments vi
1. Introduction . 1 2. Conclusions 7 3. Recommendations 8 4. Program Objectives 9 5. Statistical Methods and Results 10 6. Analytical Quality Control 83 7. Field Conditions During the Field Study . . . . 84
References 88
iii

FIGURES
Number Page
1 Map of Illinois showing sampling sites 2
2 Departures of Illinois monthly precipitation from normal during the study period 85
3 Deviation of Illinois regional discharge values from 29-year medians during the study period 86
iv

TABLES
Number Page
1 Analytical Methods Used for Water Quality Parameter Determinations 5
2 Iron (Fe) Parameter Analyzed 11 3 Manganese (Mn) Parameter Analyzed 14 4 Ammonium (NH4) Parameter Analyzed 17 5 Copper (Cu) Parameter Analyzed 20 6 Zinc (Zn) Parameter Analyzed 23 7 Phosphorus, D (P, D) Parameter Analyzed 26 8 Total Phosphorus (P, T) Parameter Analyzed 29 9 Nitrate (NO3) Parameter Analyzed 32 10 Sodium (Na) Parameter Analyzed 35 11 Chloride (Cl) Parameter Analyzed 38 12 Alkalinity Parameter Analyzed 41 13 Total Hardness Parameter Analyzed 44 14 Total Dissolved Solids (TFR) Parameter Analyzed 47 15 Nonfilterable Residue (NFR) Parameter Analyzed 50 16 Turbidity Parameter Analyzed . . 53 17 Total Organic Carbon (TOC) Parameter Analyzed 56 18 pH Parameter Analyzed 59 19 Temperature (°C) Parameter Analyzed 62 20 Discharge (cfs) Parameter Analyzed 65 21 Probability (Percent) of Finding Extreme 1-Day Percentile
Concentrations with Less Frequent Sampling Intervals (Percent Probability/Sampling Frequency) 67
22 Average Percent Deviations from 1-Day Baseline Loads 72
v

ACKNOWLEDGMENTS
The professional assistance of Messrs. R. Sinclair, C. Lonnquist, L. Henley and J. C. Whitney, as well as their staff, is greatly appreciated. The authors also wish to thank the personnel of the Louisville, Decatur, Canton, and Eureka municipal water supplies; the investor-owned Kankakee and Pontiac water supplies; employees of the Commonwealth-Edison Company who operate the Dresden Nuclear Power Station; employees of the Libby-Owens-Ford Glass Company at the Naplate Factory near Ottawa; and both laboratory and power plant employees of the Metropolitan Sanitary District of Greater Chicago connected with the hydroelectric plant near Lockport. Without their assistance, daily sampling on the scale carried out would have been prohibitively expensive if not impossible. The authors further wish to thank Pamela C. Beavers for her careful typing of the manuscript.
vi

SECTION 1
INTRODUCTION
SCOPE OF THE WORK
The design of a water quality monitoring network is dependent on many factors. Principal factors for consideration include: climate, variability in flow regimes, watershed usage and physiographic characteristics, as well as the time frame over which observations are to be made. The assumption made in this study is that the reliable observation of long-term water quality trends requires some minimum sampling frequency to insure known variability for each observation relative to an annual mean. This is not the direction one would follow to detect accidental or illegal incidents of short duration.
SAMPLING STATION LOCATIONS AND DESCRIPTIONS
Sampling locations were determined largely by the availability of municipal or industrial water plants whose operators were willing and able to cooperate in the collection and storage of daily samples and which were located within a reasonable driving distance of the Illinois State Water Survey's Champaign-Urbana laboratory. The sites are described below with reference to Figure 1.
The municipality of Louisville is located in Effingham County and takes its water supply from the Little Wabash River at Latitude 38°46'23.0" -Longitude 088°29'50.0". The watershed area upstream of this location is approximately 745 sq mi (1930 sq km). The primary station number for data records filed in ST0RET is 48901 for this station. (311)
The Kankakee Water Company is located in Kankakee County at Latitude 41°06'14" - Longitude 087°51'15" and takes water from the Kankakee River. The watershed area above this station is approximately 4810 sq mi (12,458 sq km). The primary station number for these ST0RET records is 48902. (511)
1

Figure 1. Map of Illinois showing sampling sites.
2
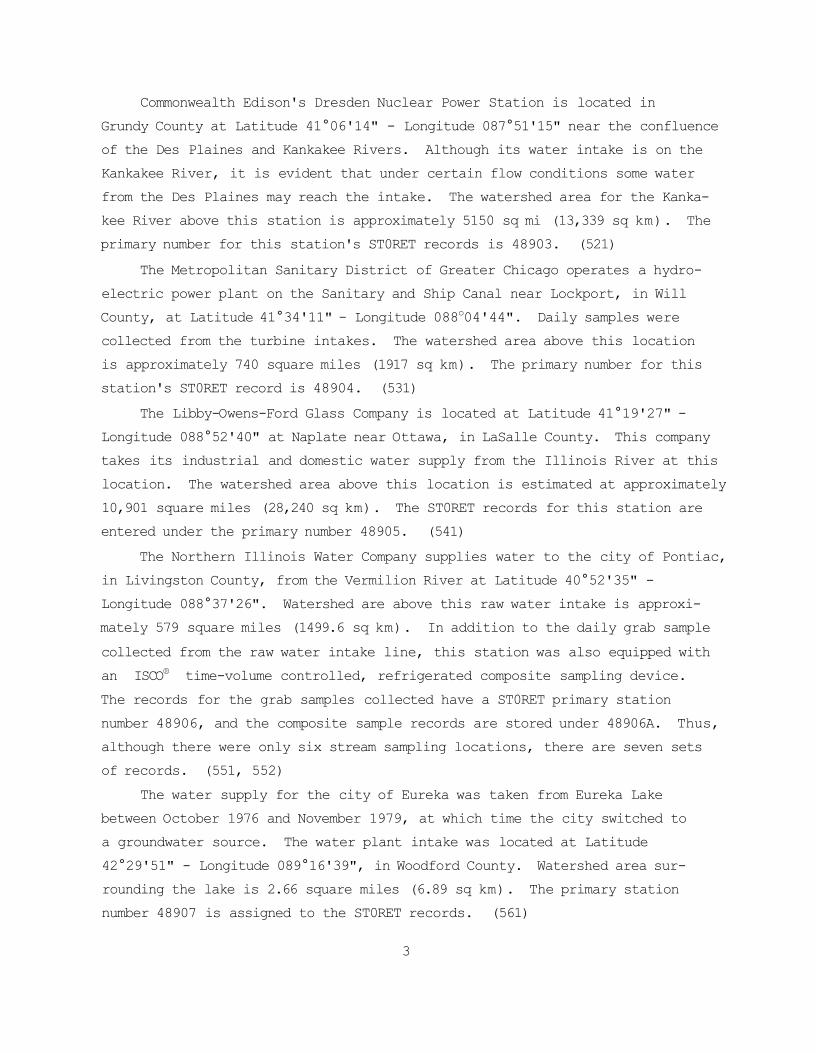
Commonwealth Edison's Dresden Nuclear Power Station is located in Grundy County at Latitude 41°06'14" - Longitude 087°51'15" near the confluence of the Des Plaines and Kankakee Rivers. Although its water intake is on the Kankakee River, it is evident that under certain flow conditions some water from the Des Plaines may reach the intake. The watershed area for the Kankakee River above this station is approximately 5150 sq mi (13,339 sq km). The primary number for this station's ST0RET records is 48903. (521)
The Metropolitan Sanitary District of Greater Chicago operates a hydroelectric power plant on the Sanitary and Ship Canal near Lockport, in Will County, at Latitude 41°34'11" - Longitude 088o04'44". Daily samples were collected from the turbine intakes. The watershed area above this location is approximately 740 square miles (1917 sq km). The primary number for this station's ST0RET record is 48904. (531)
The Libby-Owens-Ford Glass Company is located at Latitude 41°19'27" -Longitude 088°52'40" at Naplate near Ottawa, in LaSalle County. This company takes its industrial and domestic water supply from the Illinois River at this location. The watershed area above this location is estimated at approximately 10,901 square miles (28,240 sq km). The ST0RET records for this station are entered under the primary number 48905. (541)
The Northern Illinois Water Company supplies water to the city of Pontiac, in Livingston County, from the Vermilion River at Latitude 40°52'35" -Longitude 088°37'26". Watershed are above this raw water intake is approximately 579 square miles (1499.6 sq km). In addition to the daily grab sample collected from the raw water intake line, this station was also equipped with an ISCO® time-volume controlled, refrigerated composite sampling device. The records for the grab samples collected have a ST0RET primary station number 48906, and the composite sample records are stored under 48906A. Thus, although there were only six stream sampling locations, there are seven sets of records. (551, 552)
The water supply for the city of Eureka was taken from Eureka Lake between October 1976 and November 1979, at which time the city switched to a groundwater source. The water plant intake was located at Latitude 42°29'51" - Longitude 089°16'39", in Woodford County. Watershed area surrounding the lake is 2.66 square miles (6.89 sq km). The primary station number 48907 is assigned to the ST0RET records. (561)
3

The Canton municipal water supply is taken from a lake in Fulton County at Latitude 40°33'44" - Longitude 089°58'32". Watershed area on this lake is approximately 15.2 square miles (39.4 sq km). The primary station number for these STØRET records is 48908. (571)
Decatur's municipal water supply is taken from Lake Decatur in Macon County at Latitude 39°49'37" - Longitude 088°57'15". The lake's watershed area is approximately 925 square miles (2396 sq km). STØRET data are filed under the primary station number 48909. (581)
A comprehensive review of the watershed characteristics for the lake sampling sites is contained in reference (1).
SAMPLING COLLECTION AND STORAGE TECHNIQUES
At the beginning of each year of sample collections, each location was visited and provided with a 2-week supply of numbered, tagged, and prepared sample bottles together with instructions for collecting and storing daily samples under refrigeration. Each sampling location was then visited weekly by couriers from the Water Survey who picked up those samples collected in the preceding week and transported them to the Urbana laboratory for analysis. At the same time, the couriers left a fresh supply of prepared sample collection bottles. During the courier's weekly visits to each sampling location, field measurements were made for dissolved oxygen concentrations and the water temperatures at which those concentrations were determined.
Sample integrity was maintained by providing each individual station with specifically prepared sampling containers. Each daily sample was collected in a series of three bottles: one 500 milliliter (mL) container containing 0.5 mL of nitric acid (from which concentrations of total iron, total manganese, sodium, copper, and zinc were determined); one 960 mL container treated with 2 mL of sulfuric acid (from which concentrations of ammonium, nitrate, and total organic carbon were determined); and one 960 mL untreated container (from which concentrations of alkalinity, hardness, chloride, total filtrable residue, nonfiltrable residue, dissolved and total ortho -plus hydrolyzable phosphate, conductivity and turbidity were determined). All samples were maintained in a refrigerated state from time of collection until analyses were made in the laboratory. Where possible, local cooperators provided daily temperature and pH readings. All water temperature readings
4

have been converted to degrees Celsius (°C). Results of daily millipore coliform counts were obtained from the local water plant operators at Pontiac for 1976 to 1977, and at Decatur for both 1976 to 1977, and for 1978 to 1979.
ANALYTICAL TECHNIQUES USED
Analytical determinations were made by the techniques tabulated in Table 1.
Table 1. Analytical Methods Used for Water Quality Parameter Determinations Parameter Analytical Method
Ammonium (NH4) Standard Methods - Distillation-Nesslerization Nitrate (NO3) Chromotropic Acid Method Total Organic Carbon (TOC) Oceanography International Method Alkalinity (as CaCO3) Titrimetric - Methyl Orange Endpoint Method Hardness (as CaCO3) EDTA Titration Method Chloride (Cl) Mohr Method (Titrimetric w/AgNO3) Conductivity (TFR) Wheatstone Bridge Total Filtrable Residue (TFR) Residue on evaporation at 180°C Total Filtrable Residue (TFR) Residue on evaporation at 104°C Nonfiltrable Residue (NFR) Standard Method at 104°C Ortho Plus Hydrolyzable Phosphate, Dissolved -
as Phosphorous (0 + HPO4, D) Bismuth Method
Ortho Plus Hydrolyzable Phosphate, Total -as Phosphorous
(0 + HPO4, T) Bismuth Method Total Iron (Fe) Atomic Absorption Spectrophotometry Total Manganese (Mn) Atomic Absorption Spectrophotometry Sodium (Na) Atomic Absorption Spectrophotometry Copper (Cu) Atomic Absorption Spectrophotometry Zinc (Zn) Atomic Absorption Spectrophotometry Turbidity Nephelometric (Hach Turbidimeter) Dissolved Oxygen - mg/L (YSI - meter) PARAMETER CODE NUMBERS
In order to avoid any ambiguities regarding analytical results, all data were entered and stored using the following Environmental Protection Agency (ST0RET) parameter code numbers:
5
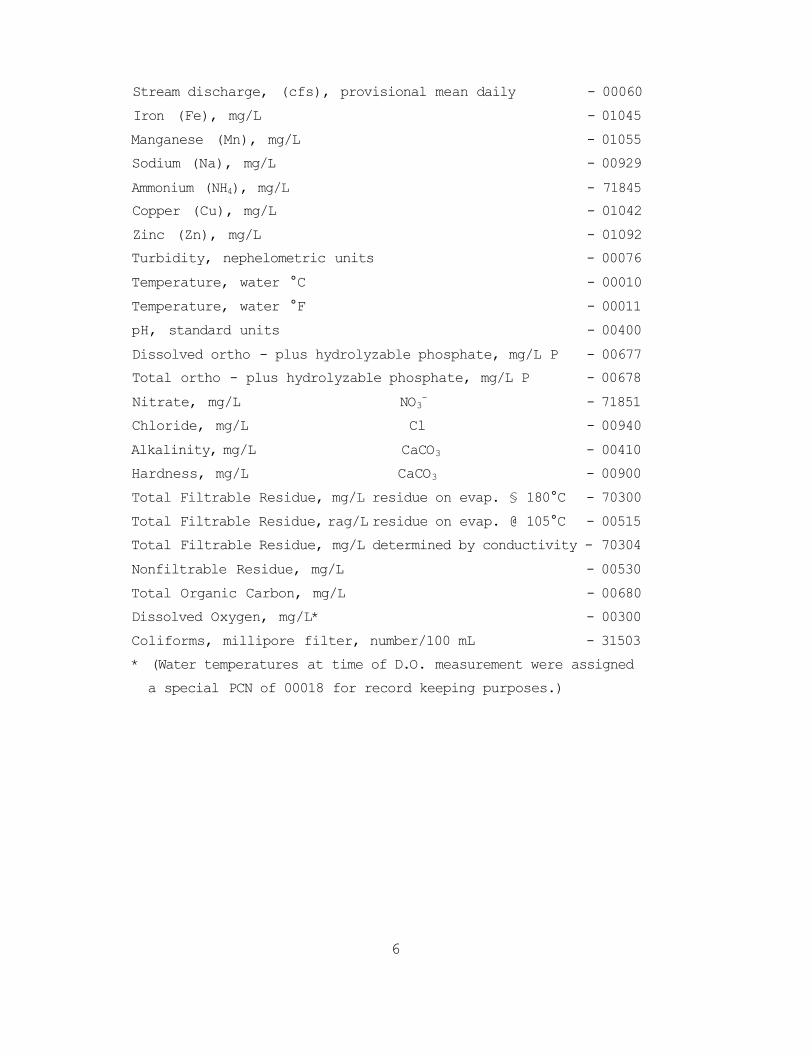
Stream discharge, (cfs), provisional mean daily - 00060 Iron (Fe), mg/L - 01045 Manganese (Mn), mg/L - 01055 Sodium (Na), mg/L - 00929 Ammonium (NH4), mg/L - 71845 Copper (Cu), mg/L - 01042 Zinc (Zn), mg/L - 01092 Turbidity, nephelometric units - 00076 Temperature, water °C - 00010 Temperature, water °F - 00011 pH, standard units - 00400 Dissolved ortho - plus hydrolyzable phosphate, mg/L P - 00677 Total ortho - plus hydrolyzable phosphate, mg/L P - 00678 Nitrate, mg/L NO3- - 71851 Chloride, mg/L Cl - 00940 Alkalinity, mg/L CaCO3 - 00410 Hardness, mg/L CaCO3 - 00900 Total Filtrable Residue, mg/L residue on evap. § 180°C - 70300 Total Filtrable Residue, rag/L residue on evap. @ 105°C - 00515 Total Filtrable Residue, mg/L determined by conductivity - 70304 Nonfiltrable Residue, mg/L - 00530 Total Organic Carbon, mg/L - 00680 Dissolved Oxygen, mg/L* - 00300 Coliforms, millipore filter, number/100 mL - 31503 * (Water temperatures at time of D.O. measurement were assigned a special PCN of 00018 for record keeping purposes.)
6

SECTION 2 CONCLUSIONS
1) Results of grab and of composite sampling on the Vermilion River (551, 552) indicate generally equal reliability, implying that future choices between the two methods can be made on the basis of convenience, availability, and cost.
2) Comparison of results from the two annual samplings from differing calendar periods indicate that statistics generated were generally similar and not greatly different from each other. This fact is supported by the available climatic data which closely represents the 29-year normal in the study region.
3) Monthly sampling frequency is reasonable for long-term monitoring of trends in conservative parameters, such as: sodium, chloride, hardness, alkalinity, and total dissolved solids. This is most defensible for perennial streams and shallow lakes with low (<200) ratios of watershed to lake surface areas. The above parameters were found to vary on a daily basis <±50% from annual means.
4) The optimum sampling frequency for reactive (nonconservative) parameters must be determined by careful consideration of sampling sites and watershed characteristics. These parameters varied on much shorter time-frames and from 1-100 times the annual mean values.
7

SECTION 3
RECOMMENDATIONS
The study clearly demonstrates that, under similar conditions, monthly sampling is sufficient to monitor long-term trends in general water quality parameters. Further research should be encouraged in delimiting the most important considerations for long-term monitoring of reactive species and those parameters of biological significance. Although much has been made of peak flow-related variations, there remains much to learn about groundwater influences on stream water quality due to base flow contributions.
8

SECTION 4
PROGRAM OBJECTIVES
The primary objective of the research was to attempt to establish the minimum sampling frequencies necessary for evaluation of short-term trends in surface water quality of Illinois streams and impoundments. Additional attempts were intended to evaluate the validity of traditionally, or historically, used statistics developed from monitoring and/or surveillance programs.
The proposed research would have collected daily samples at a number of stream and lake locations, over a continuous 2-year period. Daily values were intended as the "population" or baseline values. From this population were drawn values which would have resulted from 2-day, 4-day, 7-day, 14-day, and 28-day sampling frequencies over each of the 1-year(+) sampling periods. Thus, there were two 2-day sample sets, four 4-day sets, seven 7-day sets, fourteen 14-day sets, and twenty-eight 28-day sets, for each of the two sampling periods.
The sampling project started October 4, 1976, at six stream and three lake stations and was intended to continue until October 1978. However, federal funding lapsed in October 1977 and the project was dismantled from that time until June 1978, when funding was reinstated, and continued through June 1979.
The purpose of the program further included careful observance of quality control procedures and consideration of the "uniqueness" of the field data to insure the following objectives:
1) that variability in the data set results principally from variance due to sampling frequency not analytical error, and
2) that field conditions during the study period were representative of the historical normal in the region.
9

SECTION 5
STATISTICAL METHODS AND RESULTS
CALCULATION OF STATISTICS
Because of the tremendous quantity of data which were collected and manipulated in this study, computer programs (DAY 3 and LOAD Z) were written and used for tabulation, and statistical analysis.
All daily results of parameter determinations for the 10 sampling stations were ranked separately for the two 1-year(+) sampling periods. From these rankings were calculated the 10-, 20-, 30-, 40-, 50-, 60-, 70-, 80-, and 90-percentile, mean, minimum, and maximum statistics. These are shown as the 90-, 50-, 10-percentile, mean, maximum, and minimum values in Tables 2-20 in the column headed "Base value concentrations (1-day)." The program (Day 3) then generated synthetic data sets for 2-day, 4-day, 7-day, 14-day, and 28-day sampling frequencies, as well as for 3 of every 5 days, and 5 of every 7 days. The values in these synthetic data sets were similarly ranked and their 10-, 20-, 30-, 40-, 50-, 60-, 70-, 80-, and 90-percentile, and mean statistics calculated. These statistics were then compared with those for the baseline (1-day) and the average percent deviations (APD) (absolute value) from the baseline values were calculated. Absolute values were used in order to ignore positive and negative deviations which occurred in many cases.
At the same time, calculations were also made which determined the percent probability of finding any baseline percentile concentration with each of the less frequent (than the 1-day set) sampling sets. These are summarized in Table 21, which shows all that were less than 100%.
INTERPRETATION OF RESULTS
Average percent deviations (APD) from the baseline sampling (1-day) results appear in the last seven columns of Tables 2-20 under the headings
10

Tabic 2. Iron (Pe) Parameter Analyzed

Table 2. Iron (Fe) (Continued)
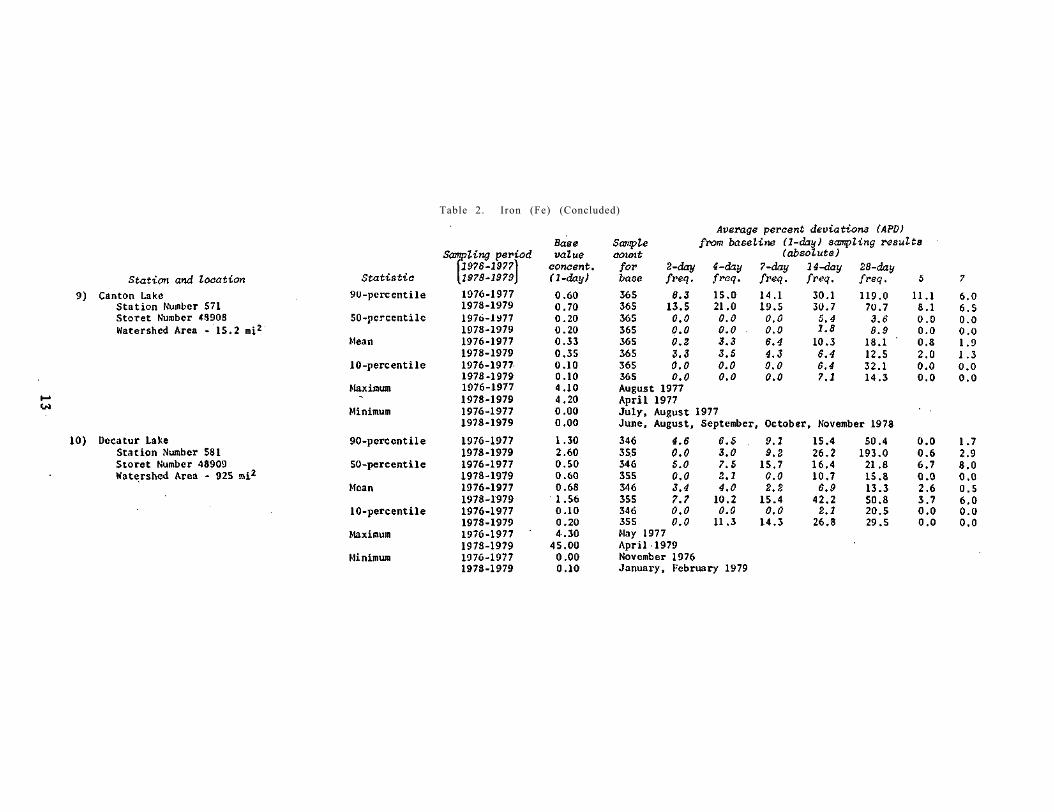
Table 2. Iron (Fe) (Concluded)

Table 3. Manganese (Mn) Parameter Analyzed

Table 3. Manganese (Mn) (Continued)
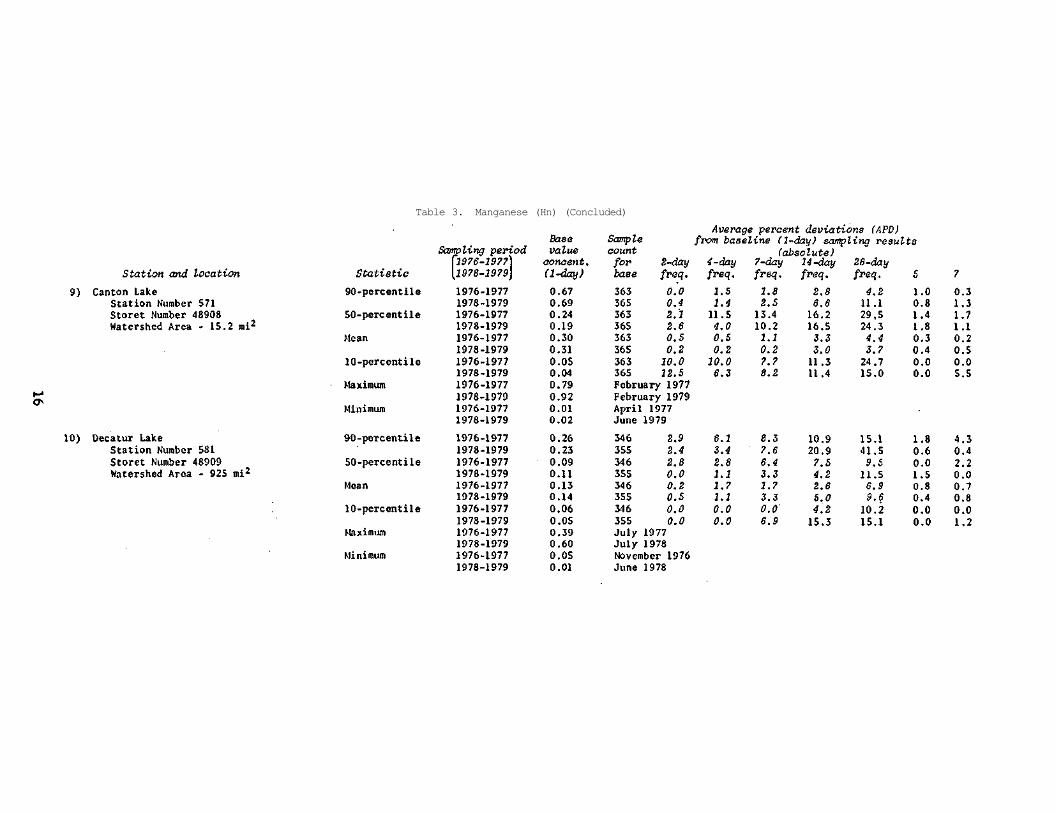
Table 3. Manganese (Hn) (Concluded)

Table 4. Ammonium (NH4) Parameter Analyzed
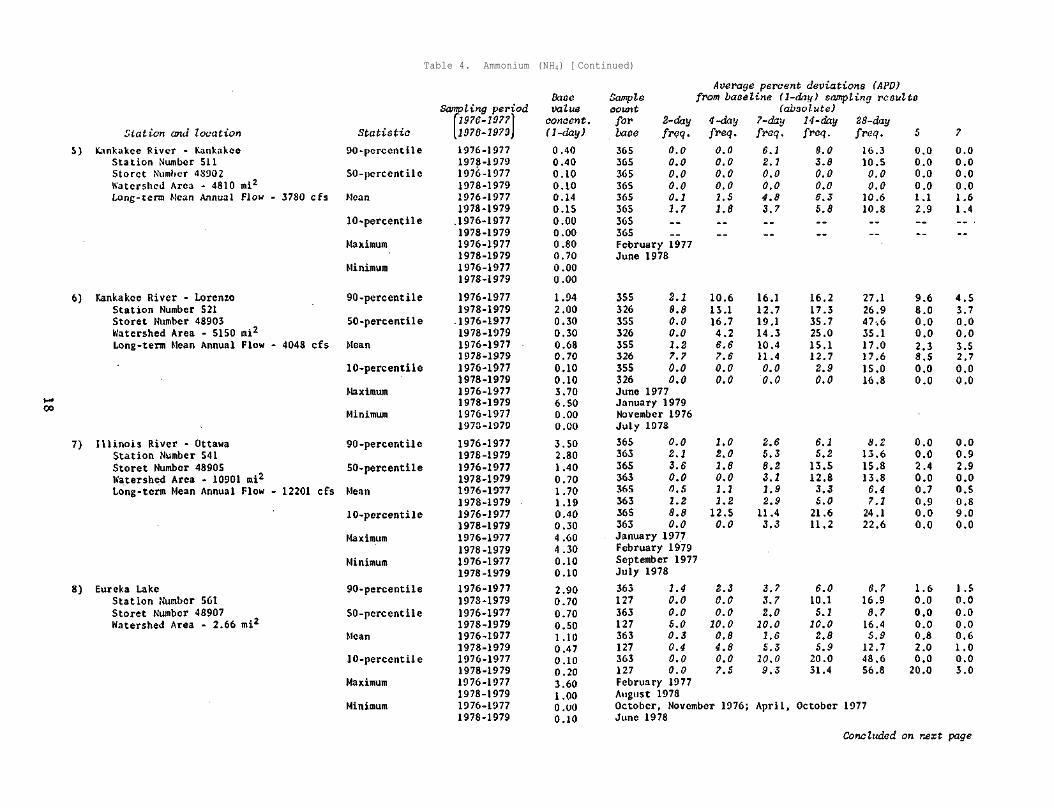
Table 4. Ammonium (NH4) [Continued)

Table 4. Ammonium (NH4) (Concluded)

Table 5. Copper (Cu) Parameter Analyzed

Table 5. Copper (Cu) (Continued)

Table 5. Copper (Cu) (Concluded)

Table 6. Zinc (Zn) Parameter Analyzed

Table 6. Zinc (Zn) (Continued)

Table 6. Zinc (Zn) (Concluded)

Table 7. Phosphorus, D (P, D) Parameter Analyzed

Table 7. Phosphorus, D (P, D) (Continued)

Table 7. Phosphorus, D (P, D) (Concluded)

Table 8 . Total Phosphorus (P, T) Parameter Analyzed

Table 8. Total Phosphorus (P, T) (Continued)

Table 8. Total Phosphorus (P, T) (Concluded)

Table 9. Nitrate (NO3) Parameter Analyzed

Table 9. Nitrate (NO3) (Continued)

Table 9. Nitrate (NO3) (Concluded)

Table 10. Sodium (Na) Parameter Analyzed

Table 10. Sodium (Na) (Continued)

Table 10. Sodium (Na) (Concluded)

Table 11. Chloride (Cl) Parameter Analyzed

Table 11. Chloride (Cl) (Continued)

Table 11. Chloride (Cl) (Concluded)

Table 12. Alkalinity Parameter Analyzed

Table 12. Alkalinity (Continued)

Table 12. Alkalinity (Concluded)

Table 13. Total Hardness Parameter Analyzed

Table 13. Total Hardness (Continued)

Table 13. Total Hardness (Concluded)

Table 14. Total Dissolved Solids (TFR) Parameter Analyzed

Table 14. Total Dissolved Solids (TFR) (Continued)

Table 14. Total Dissolved Solids (TFR) (Concluded)
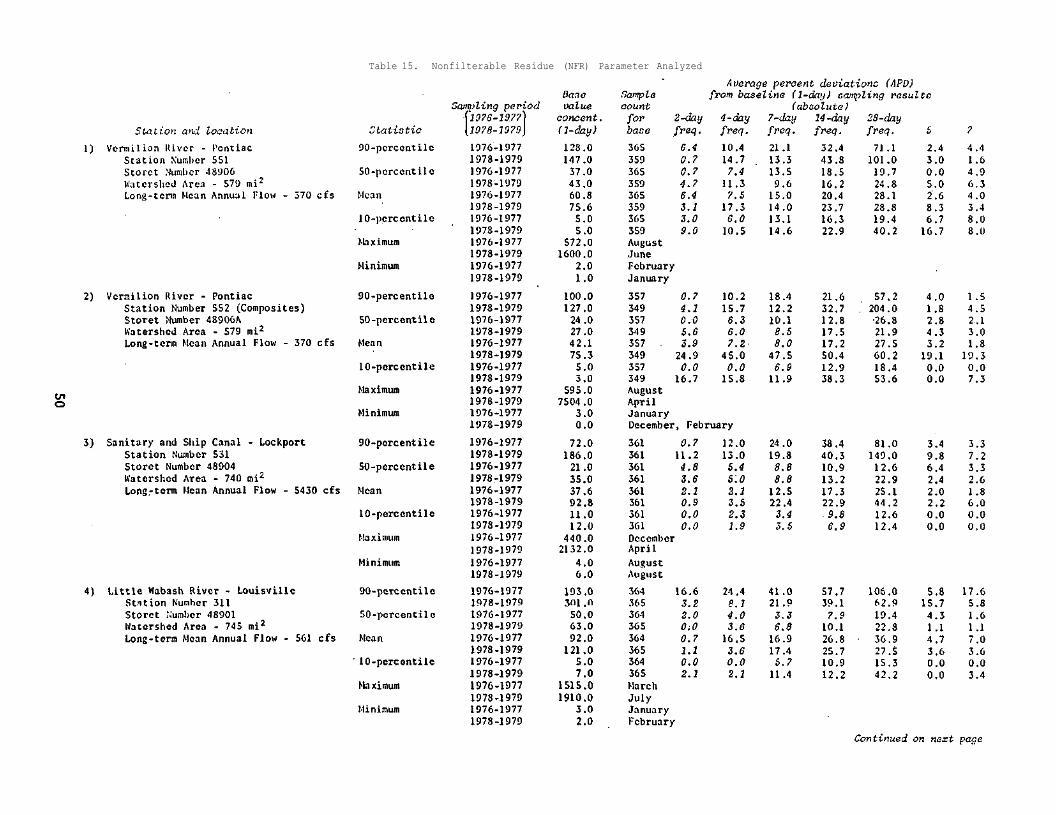
Table 15. Nonfilterable Residue (NFR) Parameter Analyzed

Table 15. Nonfilterable Residue (NFR) (Continued)

Table 15. Nonfilterable Residue (NFR) (Concluded)

Table 16. Turbidity Parameter Analyzed

Table 16. Turbidity (Continued)

Table 16. Turbidity (Concluded)

Table 17. Total Organic Carbon (TOC) Parameter Analyzed

Table 17. Total Organic Carbon (TOC) (Continued)

Table 17. Total Organic Carbon (TOC) (Concluded)

Table 18. pH Parameter Analyzed

Table 18. pH (Continued)

Table 18. pH (Concluded)

Table 19. Temperature (°C) Parameter Analyzed

Table 19. Temperature (°C) (Continued)

Table 19. Temperature (°C) (Concluded)

Table 20. Discharge (cfs) Parameter Analyzed

Table 20. Discharge (cfs) (Concluded)

Table 21. Probability (Percent) of Finding Extreme 1-Day Percentile Concentrations with Less Frequent Sampling Intervals
(Percent Probability/Sampling Frequency)

Table 21. (Continued)

Table 2 1 . (Continued)

Table 21 . (Continued)

Table 21. (Concluded)

Table 22. Average Percent Deviat ions from 1-Day Basel ine Loads Station Tons/yr/sq mi APD from base value
551-76/77 base value 2-day 4-day 7-day 14-day 28-day FE NC .91124E+00 .60 4.94 10.49 32.61 54.97 MN NC .16113E-01 .25 8.34 7.96 26.57 48.73 NA C .20117E+01 .18 .54 3.51 11.16 20.17 NH4N NC .28966E-02 1.32 33.58 54.26 64.82 435.84 CU NC .11129E-04 21.06 26.41 36.71 95.45 326.32 ZN NC .19498E-02 3.16 30.04 53.34 84.82 224.60 TURB -- .16399E+02 2.79 4.11 10.11 30.91 51.64 PHOSD NC .50211E-02 1.40 16.20 38.05 69.94 136.21 PHOST NC .22979E-01 3.40 6.49 4.42 25.10 41.98 N03N NC .19809E+01 .65 5.09 6.58 23.77 40.60 CL C .47497E+01 .27 .81 4.22 12.16 23.06 ALK C .46013E+02 .29 1.02 4.02 12.59 26.44 HARD C .71597E+02 .29 .97 3.50 12.47 25.56
-TDM3 C .80293E+02 .28 .86 3.54 12.55 25.07 NFR -- .32196E+02 3.30 3.39 12.75 28.99 52.00 TOC -- .19529E+01 .34 4.63 8.05 23.70 40.79
Station 551-78/79
FE NC .23256E+01 2.90 11.91 24.78 41.62 69.87 MN NC .37886E-01 4.20 10.40 17.68 31.59 46.15 NA ' C .40792E+01 .28 2.28 5.97 8.15 23.25 NH4N NC .26096E-01 13.65 13.61 34.67 77.38 193.30 CU NC .16575E-03 1.15 29.31 129.97 313.59 889.96 ZN NC .16796E-01 19.75 24.91 72.42 148.72 238.43 TURB -- .33534E+02 1.31 17.35 22.87 46.60 72.63 PHOSD NC .77626E-02 25.00 24.99 42.48 65.93 343.87 PHOST NC .63759E-01 4.66 7.72 16.70 33.56 67.81 N03N NC .70768E+01 2.04 4.11 10.62 14.51 47.11 CL C .12208E+02 .34 3.58 6.96 12.11 25.18 ALK C .11467E+03 .32 2.90 7.58 11.10 24.60 HARD C .18127E+03 .34 3.31 7.51 11.29 24.64 TDM3 C .20607E+03 .26 2.97 7.17 11.19 25.54 NFR -- .67340E+02 .56 17.82 25.52 51.16 77.05 TOC -- .52974E+01 2.04 12.07 17.67 33.40 66.71
Continued on next page
72

Table 22. (Continued)
Station Tons/yr/sq mi APD from base value 552-76/77 base value 2-day 4-day 7-day 14-day 28-day
FE NC .72370E+00 6.60 6.69 14.87 35.13 55.24 MN NC .10010E-01 6.67 9.82 30.13 35.21 43.69 NA C .20449E+01 .39 .67 4.33 13.55 22.62 NH4N NC .28930E-02 11.98 32.70 30.75 100.77 599.18 CU NC .59061E-05 19.06 20.06 84.79 120.06 378.80 ZN NC .23522E-04 47.03 89.94 120.14 164.10 456.37 TURB -- .12998E+02 3.93 4.23 18.34 33.79 53.47 PHOSD NC .42800E-02 9.79 18.60 17.61 66.42 107.60 PHOST NC .19206E-01 1.09 2.55 8.82 29.44 42.07 N03N NC .20304E+01 .64 5.36 8.05 23.08 41.86 CL C .48464E+01 .38 1.12 5.18 13.84 24.65 ALK C .44433E+02 .29 2.06 4.13 13.44 29.63 HARD C .70206E+02 .29 1.43 4.16 13.22 27.06 TDM3 C .7S976E+02 .32 1.27 4.50 13.79 27.47 NFR -- .22234E+02 4.60 8.07 20.84 35.62 55.53 TOC -- .17864E+01 .42 2.39 13.48 25.27 42.96
Station 552-78/79
FE NC .22473E+01 .55 18.31 9.30 37.87 108.19 MN NC .36893E-01 3.00 13.69 8.02 23.29 58.93 NA C .42603E+01 .30 4.47 6.26 9.59 28.34 NH4N NC .40566E-01 13.36 24.71 42.40 73.07 758.27 CU NC .49365E-03 26.66 33.48 58.08 145.47 342.29 ZN NC .15445E-02 .73 29.93 57.60 102.32 266.12 TURB -- .32498E+02 2.72 20.91 11.42 38.46 120.60 PHOSD NC .81738E-02 21.52 36.70 45.35 86.30 859.97 PHOST NC .56943E-01 10.56 12.33 19.20 44.81 136.75 N03N NC .71288E+01 .88 1.92 5.07 16.60 54.95 CL C .12684E+02 .76 3.81 6.75 11.24 30.87 ALK C .11667E+03 .53 3.04 6.02 9.89 28.02 HARD C .18806E+03 .48 3.82 5.64 10.52 29.52 TDM3 C .21494E+03 .55 3.51 5.83 10.88 30.11 NFR -- .63577E+02 6.55 20.17 20.04 42.71 192.27 TOC -- .49491E+01 1.06 6.35 15.23 32.49 79.40
Continued on next page
73

Table 22. (Continued) Station Tons/yr/sq mi APD from base value
531-76/77 base value 2-day 4-day 7-day 14-day 28-day FE NC .41496E+01 3.57 3.55 16.49 17.33 23.S3 MN NC .22564E+00 . 2.49 2.49 8.27 9.49 13.58 NA C .26235E+03 2.42 2.45 5.06 5.69 8.65 NH4N NC .15355E+02 2.24 2.25 2.92 5.60 9.51 CU NC .31831E-01 .64 12.90 22.20 52.77 72.47 ZN NC .60934E+00 5.13 5.13 10.48 11.08 18.07 TURB -- .61598E+02 6.87 6.89 14.42 16.06 22.25 PHOSD NC .21516E+01 2.40 2.68 3.27 6.06 11.04 PHOST NC .28487E+01 3.02 3.42 6.07 7.50 13.37 N03N NC .66235E+01 3.86 4.16 13.33 13.75 15.65 CL C .32379E+03 2.28 2.31 4.68 5.55 8.85 ALK C .62913E+03 2.73 2.74 4.18 5.61 9.21 HARD C .83112E+03 2.15 2.16 4.16 5.46 8.88 TDM3 C .17060E+04 2.28 2.29 4.09 5.32 8.40 NFR — .11425E+03 8.54 8.51 18.34 21.01 27.65 TOC -- .42524E+02 2.94 3.43 7.01 7.81 13.92
Station 531-78/79 FE NC .86173E+01 .16 9.72 12.24 26.07 48.08 MN NC .38250E+00 .56 5.63 6.46 14.16 26.50 NA . C . .35429E+03 .84 2.91 3.38 8.12 14.44 NH4N NC .15694E+02 1.35 2.00 6.25 9.33 10.57 CU NC .77329E-01 .8.10 30.19 27.32 42.35 74.86 ZN NC .82209E+00 1.12 8.24 8.72 17.70 35.18 TURB -- .11121E+03 .86 6.87 8.34 18.25 36.07 PHOSD NC .253700+01 .87 3.19 6.22 8.26 12.49 PHOST NC .40307E+01 1.10 3.96 4.72 11.57 22.51 N03N. NC .85535E+01 .48 3.00 9.67 17.84 23.95 CL C .44535E+03 .12 2.55 2.96 11.06 16.43 ALK C .81200E+03 .78 2.61 4.22 8.71 13.20 HARD C .11494E+04 .69 2.33 4.06 9.33 14.25 TDM3 C .23217E+04 .87 2.60 3.29 8.34 13.90 NFR -- .23123E+03 2.79 9.05 10.26 22.78 44.32 TOC -- .593880+02 ' 2.41 8.76 6.81 15.11 27.70
Continued on next page
74

T a b l e 2 2 . ( C o n t i n u e d )
Station Tons/yv/sq mi APD from base value 311-76/77 base value 2-day 4-day 7-day 14-day 28-day
FE NC .65711E+00 7.47 18 .39 50 .67 119.94 155 .03 MN NC .55329E-01 3.22 18 .03 3 0 . 3 7 66 .19 8 2 . 1 4 NA C .26895E+01 4.21 6.21 2 0 . 0 1 3 3 . 7 0 4 0 . 0 7 NH4N NC .23123E-01 13 .20 1 3 . 2 6 1 6 . 6 5 68 .84 8 9 . 7 3 CU NC .31264E-04 4 2 . 9 1 6 9 . 8 3 52 .19 237.77 5 2 2 . 7 5 ZN NC .59906E-04 23 .00 6 2 . 3 3 204 .21 590 .19 281 .76 TURB -- .14972E+02 5.55 2 0 . 4 3 51 .80 124 .70 161 .92 PHOSD NC .18979E-01 1.36 1 4 . 4 6 69 .71 156 .15 201 .05 PHOST NC .44552E-01 4.60 1 4 . 7 3 3 9 . 5 0 8 4 . 8 8 108 .36 N03N NC .15329E+00 3.57 9.07 3 0 . 5 2 6 6 . 0 3 7 8 . 7 1 CL C .38653E+01 4.29 5.28 1 9 . 3 9 33 .92 4 1 . 8 1 ALK C .15509E+02 3.30 6.45 19 .44 3 3 . 0 2 4 1 . 1 7 HARD C .22677E+02 3.80 6.46 19 .94 35 .30 4 3 . 5 6 TDM3 C .34088E+02 3.79 6.48 20 .59 37 .42 4 4 . 5 8 NFR -- .29076E+02 5.53 24 .21 51 .60 133 .02 182 .75 TOC — .23681E+01 3.27 1 2 . 2 5 3 6 . 2 8 8 0 . 2 5 100 .90
Station 311-78/79
FE NC .25107E+01 .70 3.70 23 .97 6 2 . 2 1 104 .34 MN NC .14725E+00 2.24 3.95 18 .51 34 .07 5 0 . 0 9 NA C .85560E+01 1.82 1.83 .6.92 12 .11 26 .07 NII4N NC .16886E+00 10 .92 1 1 . 2 2 16 .20 35 .40 123 .26 CU NC .12764E-01 3.10 1 3 . 6 1 4 0 . 1 3 62 .32 8 0 . 6 9 ZN NC .10383E-01 9.11 4 9 . 5 8 4 8 . 9 6 65 .89 164 .03 TURB -- .46151E+02 .49 2.94 27 .18 68 .72 130 .31 PIIOSD NC .37695E-01 23 .70 22 .94 29 .22 69 .89 176 .87 PHOST NC .11800E+00 .37 1.59 23 .73 41 .99 9 3 . 3 8 NO3N NC .97671E+00 .39 1.21 8.36 31 .16 6 7 . 2 7 CL C .12334E+02 .25 1.48 8.08 12 .32 3 1 . 5 5 ALK C .61955E+02 .86 1.83 9.23 16 .39 3 1 . 7 2 HARD C .94100E+02 1.68 1.90 7.91- 15 .27 31 .67 TDM3 C .13363E+03 1.59 1.95 8.12 15 .10 3 3 . 4 9 NFR -- .75258E+02 .49 3.66 26 .73 68 .75 120 .20 TOC -- .75575E+01 1.65 4.23 18 .32 4 4 . 0 6 8 8 . 4 9
Continued on next page
75

Table 22 . (Continued) Station Tons/yr/sq mi APD from base value
511-76/77 base value 2-day 4-day 7-day 14-day 28-day FE NC .71593E+00 1.18 2.90 11.13 12.45 18.24 MN NC .5S645E-01 .27 2.42 5.74 6.80 9.37 NA C .47700E+01 .25 1.34 .80 1.64 3.81 NH4N NC .11520E-01 10.03 30.99 40.72 74.62 133.83 CU NC .28567E-01 3.17 3.73 7.39 8.28 11.00 ZN NC .46092E-04 5.13 30.10 45.44 84.06 272.26 TURB -- .94634E+01 .36 3.47 10.16 10.74 19.99 PHOSD NC .39639E-02 11.99 12.30 46.37 69.31 244.88 PIIOST NC .23051E-01 3.81 5.55 5.33 33.38 69.42 N03N NC .12636E+01 .80 2.70 4.75 10.07 12.45 CL C .11035E+02 .10 1.00 .80 3.35 4.37 ALK C .10401E+03 .51 .52 .78 2.50 3.83 HARD C .16860E+03 .36 .46 .80 2.36 3.91 TDM3 C .18773E+03 .35 .44 .74 2.43 3.76 NFR -- .15597E+02 2.37 4.27 12.14 16.13 24.19 TOC -- .45516E+01 .19 1.86 6.29 6.55 11.87
Station 511-78/79
FE NC .11582E+01 1.05 2.32 11.25 28.77 56.96 MN NC .95302E-01 1.87 2.15 6.82 14.52 34.56 NA C .S0705E+01 .57 1.80 3.30 7.90 20.55 NH4N . NC .18127E+00 8.12 8.27 18.28 36.37 129.37 CU NC .40102E-01 .23 .48 10.06 13.78 22.05 ZN NC .20234E-03 62.13 63.18 27.06 168.90 550.38 TURB -- .14456E+02 3.75 5.47 15.74 36.17 69.97 PIIOSD NC .20571E-02 7.53 29.40 25.91 32.82 188.84 PIIOST NC .30526E-01 3.98 6.75 39.15 70.19 84.28 NO3N. NC .25833E+01 .94 2.05 5.17 13.83 38.45 CL C , .19884E+02 .12 1.37 3.20 7.89 21.47 ALK C .15984E+03 .18 1.76 3.12 5.29 12.23 HARD C .26696E+03 .28 1.77 2.26 6.11 14.32 TDM3 C .30610E+03 .11 1.71 2.61 6.59 15.91 NFR -- .20840E+02 12.91 17.63 22.34 36.08 81.84 TOC -- .72127E+01 2.74 3.12 7.63 13.98 33.66
Continued on next page
76

Table 22 . (Continued)
Station Tons/yv/sq mi APD from base value 521-76/77 base value 2-day . 4-day 7-day 14-day 28-day
FE NC .85921E+00 3.88 4.96 .5.33 8.26 18.87 MN NC .54910E-01 1.70 3.95 2.92 3.91 9.49 . NA C .66081E+01 .49 1.04 4.20 5.24 6.88 NH4N NC .81119E-01 1.90 11.02 28.36 40.42 43.54 CU NC .70590E-04 7.81 14.81 38.42 132.78 253.50 ZN NC .23537E-03 26.28 73.18 49.21 69.72 158.23 TURB -- .13190E+02 3.23 3.28 5.16 7.72 18.12 PIIOSD NC .28595E-01 9.18 8.04 9.46 17.73 26.79 PHOST NC .60877E-01 1.95 2.52 6.04 10.80 14.58 N03N NC .17015E+01 .20 1.50 4.32 11.12 12.98 CL C .13807E+02 .76 .81 2.89 3.53 4.96 ALK C .10042E+03 .28 .45 1.06 2.91 5.24 HARD C .16250E+03 .63 .92 .96 3.53 5.11 TDM3 C .18950E+03 .61 .84 1.21 2.93 4.46 NFR -- .23314E+02 2.94 3.33 5.00 7.19 18.13 TOC -- .46755E+01 .70 1.17 3.16 3.84 8.69
Station 521-78/79
FE NC .14304E+01 .84 9.24 16.98 57.63 86.91 MN NC .74399E-01 .22 6.69 10.45 34.15 50.85 NA C .11106E+02 1.14 2.93 5.81 7.29 15.09 NH4N NC .21677E+00 .79 9.85 5.12 26.94 38.28 CU NC .10582E-02 24.35 37.20 49.11 268.63 741.18 ZN NC .60023E-02 10.44 17.35 53.36 111.10 243.05 TURB -- .18175E+02 4.82 10.54 15.57 54.14 91.08 PIIOSD NC .17662E-01 11.30 15.27 22.23 78.70 113.44 PHOST NC .92843E-01 1.27 4.99 16.29 32.27 42.95 N03N NC .33972E+01 .39 3.65 3.83 16.83 .47 .89 CL C .25053E+02 .65 2.50 5.48 5.98 16.42 ALK C .15457E+03 .61 1.48 2.47 4.98 14.56 HARD C .25880E+03 .51 1.09 2.91 5.24 15.43 TDM3 C .31504E+03 .32 .74 2.81 5.37 16.89 NFR -- .29093E+02 4.65 12.04 15.51 .65.70 94.86 TOC -- .72411E+01 1.16 2.73 9.72 26.07 46.48
Concluded on next page
77
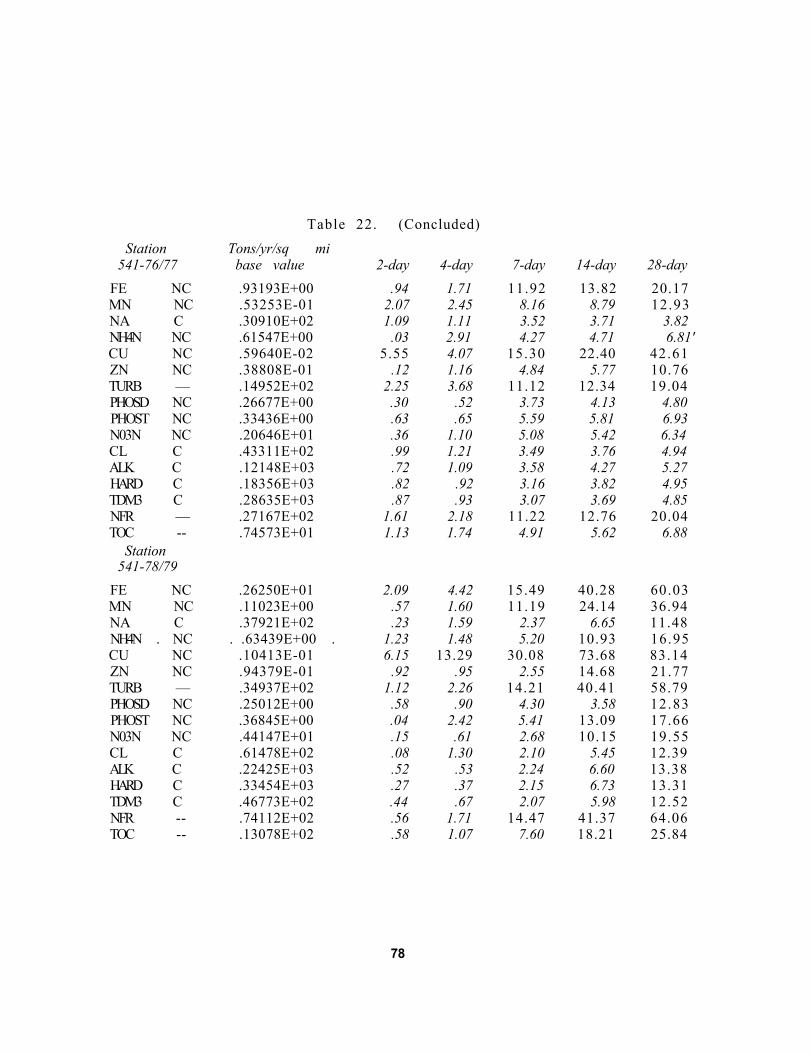
Table 22. (Concluded)
Station Tons/yr/sq mi 541-76/77 base value 2-day 4-day 7-day 14-day 28-day
FE NC .93193E+00 .94 1.71 11.92 13.82 20.17 MN NC .53253E-01 2.07 2.45 8.16 8.79 12.93 NA C .30910E+02 1.09 1.11 3.52 3.71 3.82 NH4N NC .61547E+00 .03 2.91 4.27 4.71 6.81' CU NC .59640E-02 5.55 4.07 15.30 22.40 42.61 ZN NC .38808E-01 .12 1.16 4.84 5.77 10.76 TURB — .14952E+02 2.25 3.68 11.12 12.34 19.04 PHOSD NC .26677E+00 .30 .52 3.73 4.13 4.80 PHOST NC .33436E+00 .63 .65 5.59 5.81 6.93 N03N NC .20646E+01 .36 1.10 5.08 5.42 6.34 CL C .43311E+02 .99 1.21 3.49 3.76 4.94 ALK C .12148E+03 .72 1.09 3.58 4.27 5.27 HARD C .18356E+03 .82 .92 3.16 3.82 4.95 TDM3 C .28635E+03 .87 .93 3.07 3.69 4.85 NFR — .27167E+02 1.61 2.18 11.22 12.76 20.04 TOC -- .74573E+01 1.13 1.74 4.91 5.62 6.88
Station 541-78/79
FE NC .26250E+01 2.09 4.42 15.49 40.28 60.03 MN NC .11023E+00 .57 1.60 11.19 24.14 36.94 NA C .37921E+02 .23 1.59 2.37 6.65 11.48 NH4N . NC . .63439E+00 . 1.23 1.48 5.20 10.93 16.95 CU NC .10413E-01 6.15 13.29 30.08 73.68 83.14 ZN NC .94379E-01 .92 .95 2.55 14.68 21.77 TURB — .34937E+02 1.12 2.26 14.21 40.41 58.79 PHOSD NC .25012E+00 .58 .90 4.30 3.58 12.83 PHOST NC .36845E+00 .04 2.42 5.41 13.09 17.66 N03N NC .44147E+01 .15 .61 2.68 10.15 19.55 CL C .61478E+02 .08 1.30 2.10 5.45 12.39 ALK C .22425E+03 .52 .53 2.24 6.60 13.38 HARD C .33454E+03 .27 .37 2.15 6.73 13.31 TDM3 C .46773E+02 .44 .67 2.07 5.98 12.52 NFR -- .74112E+02 .56 1.71 14.47 41.37 64.06 TOC -- .13078E+02 .58 1.07 7.60 18.21 25.84
78

2-day freq., 4-day freq., 7-day freq., 14-day freq., 28-day freq., 5 (3 of 5-day frequency), and 7 (5 of 7-day ferquency). These deviations are shown only for the 90-, 50-, 10-percentile, and mean values.
Table 2, 1) Station 551, lines 1-12 is reviewed below as an example of the information to be obtained from the tables. Lines 3 and 5, and 4 and 6 in the base value column indicate that in both 1976/77 and 1978/79, the distribution of iron concentrations at this station was positively skewed since mean values exceeded median values. Absolute ranges of concentrations observed were 0.2 to 26 mg/L (1976-1977) and 0.1 to 48 mg/L (1978-1979). Months of occurrence indicate the two 1-year sampling periods were also dissimilar in this respect. For the 1976-1977 period, average percent deviations of the 2-day sampling frequency results were 3.3 percent from the baseline concentration of 3.68 mg/L; 4-day results were 8.3% from baseline; 7-day results were 14.9% from baseline; 14-day results were 34.1% from baseline; 28-day results were 83.4% from baseline; 5 (3 of 5) results 5.3%; and 7 (5 of 7) 3.5%. Respective percentages of deviation from baseline for 1978-1979 are 5.8, 16.5, 21.6, 44.2, 92.8, 7.1, and 5.9. Changeover from italics between 8.3 and 14.9 on the first line and 5.8 and 16.5 on the second show the limit of sampling frequency that one must accept if 10%, or less, deviation from the baseline statistic is tolerable. In this example, if 10% deviation were acceptable for the 90-percentile iron value, 4-day sampling frequency in 1976-1977 and 2-day frequency in 1978-1979 might have produced the desired results. However it is well to recall that these are average percent deviations and extreme deviation could have exceeded the average. Lines 3 and 4 indicate that a 4-day sampling frequency in 1976-1977, and a 7-day frequency in 1978-1979 might have produced 50-percentile values deviating 10%, or less, from the respective 1-day values of 1.1 and 1.5 mg/L. Lines 5 and 6 indicate that 2-day sampling frequencies were required in both 1976-1977 and 1978-1979 to produce mean values deviating 10%, or less, from the 1-day mean iron values of 1.83 and 2.5 mg/L. Lines 7 and 8 indicate that 14-day sampling periods could have been used to find 10-percentile values which deviated 10% or less from the 1-day value of 0.2 and 0.2 mg/L. The remainder of the tables have been treated in the same manner, i.e. a typeface changeover has been made between sampling frequency columns at an arbitrarily selected level of 10%, or less, average deviation.
79
Items 1) and 2) for each table are for the Vermilion River at Pontiac. The first (station 551) contains statistics for data from grab samples, while the second (station 552) has statistics derived from composite samples. Comparison of data for these two stations permits evaluation of the relative efficiency and reliability of the two methods of sample collection. Note that in both sampling periods, the water plant operators were more reliable in collecting grab samples. However, it must be noted that the effect of composite versus grab sampling on the analytical results is to diminish extreme high values. The nature of this time integrated sample further entails the failure to detect "slugs" associated with sudden precipitation events. Flow proportional sampling can avoid the latter bias.
Tables 2 through 9 contain APD's for those parameters which are defined as nonconservative, Tables 10 through 14 are for conservative parameters, and Tables 15 through 20 for parameters which cannot clearly be described as either conservative or nonconservative.
Table 21 lists the average percent deviations (APD) of calculated frequency weighted mean loads (FWML) from the baseline 1-day FWML. The loads were computed by the computer program "LOADZ" which modifies a manual method obtained from R. L. Evans who had used an adaptation of C. E. Simmons. (2)
DISCUSSION OF RESULTS
Comparison of all 1) and 2) items (Vermilion R.) of Tables 2, 3, 4, 5, 6, 7, 8, 9, 10, 11, 12, 13, 14, 15, 16, 17, 18, and 19 indicate relatively little difference in results obtained by choosing between manual (grab) and machine (composite) sampling. In both the 1976-1977 and 1978-1979 sampling periods, more grab samples were collected because of intermittent failures of the mechanical sampler which was unattended, and was serviced only weekly by the Water Survey courier.
A choice between use of medians (50-percentile) or means as a statistical measure of water quality and of water quality trends is difficult. In either streams or lakes and with conservative parameters (sodium, chloride, alkalinity, hardness, and total dissolved solids), the APD's listed in Tables 10 through 14 indicate that it really makes little difference which statistic is used and that 28-day sampling frequencies will produce results nearly as "good" (10% or less average deviation) as could be obtained by
80

daily sample collection. This also is generally true for total organic carbon, pH, and water temperatures (Tables 17 through 19) , and to a lesser degree for nitrate (Table 9), ammonium (Table 10), and dissolved and total phosphorous (Tables 7 through 8). This observation has been borne out by Loftis and Ward applying an independent statistical approach to data from this study. (3) They arrived at the conclusion that, ignoring seasonal variation and serial correlation, monthly sampling would result in ~8% error for: hardness, total dissolved solids, TOC, and nitrate.
However, investigations of the nonconservative parameters iron, manganese, copper, zinc, and the nondefined, nonfiltrable residue and turbidity should be approached with care in the choice of mean or median as well as for sampling frequency. Apparently in the more quiescent, integrated water bodies, lakes and large, steady flowing or controlled streams, sampling frequencies can be extended to the longer periods (14 and 28 days) without danger of introducing deviation from population means or medians. Water bodies with normally low concentrations of parameters such as copper and zinc will require frequent sampling to avoid large percentage deviations.
Sampling programs intended for monitoring or surveillance of the occurrence of extreme (high) concentrations of constituents could make use : of the 90-percentile statistics keeping in mind the probabilities of observing high values at the less-frequent sampling intervals. There are seeming paradoxes with regard to the 90-percentile concentrations. Again, Tables 2 through 19 indicate that the conservative constituents sodium, chloride alkalinity, hardness, total dissolved solids, and such nondefined parameters as pH and temperature can be monitored with monthly (28-day) sampling without incurring substantial deviations from the results obtained by daily sampling. Other constituents apparently must be monitored daily or at 2-, 4-, or 7-day intervals to avoid over 10% average deviation. On the other hand, if single extreme values are being sought, or monitored, Table 20 seems to indicate that even with least frequent sampling intervals the probability of discovering extreme values is high.
The average percent deviations from the base 1-day values of the 2- to 28-day frequency-weighted mean constituent loads for the stream stations are shown in Table 21. Again, the conservative (marked C) constituent loads are better estimated from the long-frequency sampling schedules than are the
81

nonconservative (NC) and nondefined (X) constituents. However, in any case, the variability of both discharge and concentration are involved in these calculations which decreases the acceptable sampling interval to avoid high average percent deviation from the base (1-day) period. Extreme care must be used in interpreting the loads calculated from long interval sampling programs because there is absolutely no way of determining whether the results are over- or underestimating the true situation.
There is currently high interest in suspended sediments as sources of water pollution. Annual nonfiltrable residue loads, shown as NFR in Table 22, are often computed as a surrogate measure of existing sediment pollution. Such calculations are inherently misleading in that there has not been established any direct relationship between soil loss from watersheds and suspended sediment transport by streams.
82

SECTION 6
ANALYTICAL QUALITY CONTROL
The precision and accuracy of the analytical determinations made during the course of the project were carefully monitored by routine in-lab blanks, sample-splits and duplicates, as well as participation in USEPA Interlaboratory Performance Evaluation Studies, (003 and WP004). In addition to the normal procedures, strict checks were kept on individual analysts since the funding lapse in the middle of the project caused a serious turnover in personnel.
Precision checks were made on samples split at the time of sampling and after delivery to the laboratory. So long as preservation procedures could be maintained no significant deviation from published reproducibility of the methods used were observed. Occasionally, turbidity values were found to deviate by greater than ±10% in very heavily loaded samples. This seemed to result from settling and agglomeration of suspended materials which could not be adequately retrieved (scraped) from the sample bottles.
The accuracy of individual parameter determinations was insured by maintaining stocks of standard solutions which were used for both daily analytical work and in the analysis of samples from the agency. The performance of the laboratory was within acceptable limits for all parameters determined in this study.
Checks for internal consistency of each sample results were also performed. This check involves a mass balance calculation of dissolved mineral parameters determined analytically as compared to the value for total dissolved solids (corrected for carbonates). If an unacceptable deviation from the mass balance was noted, critical parameters were repeated.
We are confident therefore that observed deviations in the values of the parameters were dominated by natural variability in the stream (or lake) water quality at the time of sampling.
83
SECTION 7
FIELD CONDITIONS DURING THE STUDY PERIOD
INTRODUCTION
Interpretation of the results of this study has been performed with little consideration of the seasonal, discharge or physiographic factors that markedly affect short-term variability in water quality parameters. Due to the immense quantity of high quality data collected in this study, we feel that some consideration of these variable factors will prove useful to future extensions of this work.
Regional Factors
The study results most directly apply to temperate zone areas of little topographic relief and to watersheds with heavy agricultural usage. The study period included the bitterly cold winter of 1978-1979. However, long-term meteorological investigations suggest that the period as being more "normally" cold in a decade of unusually warm winters. (4)
Precipitation in the "corn belt" shows considerable variability in areal and temporal extent. The variability is most critical in small watersheds (stations: 551, 552, 561, 571) encompassing less than 600 sq mi (~1500 sq km). Nonetheless, monthly precipitation in the region during the study period closely followed the historical normal distribution. (5) This is clearly shown in Figure 2 in which the departures from 29-year monthly normals are plotted versus time for state regions in which sampling was conducted. In only May and August of 1977, were departures greater than ±3 inches (±7.6 cm) observed. This level of variability (~10%) is that typically encountered in Illinois between reporting stations within dense rain gauge networks. (6)
Monthly river discharges during the sampling period show somewhat greater variations on a regional basis (Figure 3). The variability is due in part to
84

Figure 2. Departures of Illinois monthly precipitation from normal during the study period.

Figure 3. Deviation of Illinois regional discharge values from 29-year medians during the study period.

the location of discharge gaging stations for which a long-term record is available. (7) The Central Region (Sangamon R.) station is that most similar to the study watersheds and shows less than ±20% deviation from the historical record.
Lacustrine Factors Predictably the lake stations (501, 571, and 581) showed less short-term
water quality variability than did those on rivers. This observation is a direct result of flow conditions, since the principal outlets of the lakes were to drinking water treatment facilities. All these sites are man-made impoundments, as are most Illinois lakes. Fine structures in the levels of water quality parameters as a function of time were found to be more closely related to periods of seasonal stagnation and overturn than to rainfall or discharge events. In-lake processes driven by wind, temperature and nutrient inputs must be considered in any future work along these lines. Water quality monitoring programs designed for glacial lakes simply do not apply to the situation in this region. This conclusion is supported by recent efforts to extend historical classifications to Illinois Lakes. (7)
Riverine Factors
The river stations utilized in this study run the gamut of stream types in regard to flow regimes. The Lockport Canal (531) is a controlled flow structure maintained by withdrawals for Lake Michigan and generally showed very poor water quality. The other perrenial streams (511, 521, 541, 551 and 552) exhibited water quality variability reasonably well correlated with runoff events. Conservative parameters identified in Section 5 varied <±50% over the annual periods and less than 20% of their extreme values occurred during periods of peak flow. This of course does not include serial correlations on trailing edges of peak discharge hydrographs. Variations noted for "flashier" streams (station 511) were accentuated for all parameters during peak discharge periods. Little substantive interpretation can be offered on the nature of water quality variations for the nonconservative or undefined parameters.
87

REFERENCES
1. Illinois Environmental Protection Agency. Assessment and Classification of Illinois Lakes. Volumes 1 and 2. Springfield, Illinois, 1978. 520 pp.
2. Simmons, C. E. Sediment Characteristics of Streams in Eastern Piedmont and Western Coastal Plain Regions of North Carolina. U. S. Geological Survey Water Supply Paper 1798-0. 1976. 32 pp.
3. Loftis, J. S., and R. C. Ward. Sampling Frequency Selection for Regulating Water Quality Monitoring. Water Resources Bulletin. American Water Resources Association 16(3):501-507, 1980.
4. Climatology Section, Illinois State Water Survey, personal communication.
5. NOAA, (National Oceanic and Atmospheric Administration, U. S. Department of Commerce). Climatological Data: Annual Summary for Illinois. Volume 84 and preceding numbers. Environmental Data and Information Service. National Climatic Center, Asheville, North Carolina, 1979.
6. Stout, G. E. Natural Variability of Storm, Seasonal and Annual Precipitation. Journal Irrig. and Drainage Division. Proceedings of American Society of Civil Engineers, March, 1960. pp. 127-138.
7. U. S. Geological Survey, Water Resources Data for Illinois. Data Reports for Water Year 1977, 1978, 1979.
8. Roseboom, D. P., R. L. Evans, W. Wang, T. A. Butts, and R. M. Twait. Classifying Illinois Impoundments: An Examination of Techniques for Assessing Lake Bottom Conditions. Illinois State Water Survey. Contract Report Number 215. Prepared for the Illinois Environmental Protection Agency, Urbana, Illinois, 1979. 155 pp.
88