sandbox modeling of the shallow tunnel face collapse · sandbox modeling of the shallow tunnel face...
TRANSCRIPT

RIVISTA ITALIANA DI GEOTECNICA 1/2009
Sandbox modeling of the shallow tunnel face collapse
Pavlos Vardoulakis*, Maria Stavropoulou**, George Exadaktylos*
SummaryThe objective of the present work is the experimental, analytical and numerical investigation of the face instability
mechanism of shallow circular cylindrical tunnels that are excavated in frictional geomaterials characterized by small cohe-sion. For the experimental investigation a small scale sandbox model has been constructed. Subsequently, experimentshave been carried out at 1g using the same dry sand and changing each time the overburden height above the crown of thetunnel. In a first attempt to derive a simple analytical equation relating the maximum subsidence occurring at the variousstratigraphic horizons above the tunnel imparted by the horizontal tunnel face retreat, the model test results were analyzedutilizing the Dimensional Analysis and Displacement Diffusion theories. The resulting analytical equation, that is remark-ably simple, could be useful for the design and construction stages of shallow tunnels were the subsidence and face move-ments or face pressure exerted by the TBM are monitored, as well as for the validation of numerical codes. The experi-mental results were also compared with numerical results obtained by virtue of the FLAC3D code. It was found that the bestagreement of experimental and numerical data is achieved for elastic modulus of the dry sand equal to 130 MPa that wasalso inferred independently from triaxial compression test results.
Keywords: shallow tunnels, face instability, physical modeling, sandbox testing, dimensional analysis, displacement diffu-sion, tunnel collapse.
1. Introduction
Tunneling projects are technologically chal-lenging projects. The construction of shallow road,metro or railway tunnels under urban areas aroundthe world has considerably increased during thepast two decades. The reasons for going under-ground are many; for example to increase thespeed of transportation of the citizens, to cope withincreasing number of new inhabitants in megaci-ties, to considerably decrease the pollution fromtraffic, and to free the ground space for the inhab-itants to name a few. For example Barcelona’s pop-ulation increased from 3 million to 4 million dur-ing the last years with a consequence 9 more metrotunnels plus 2 hydrotunnels to be currently underconstruction or planned to be constructed in thenext few years), to free ground space from trafficetc. The diameter of Tunnel Boring Machines(TBM’s) and particularly slurry shields, mixshieldsand Earth Pressure Balanced (EPB) machines thatare most usually used for the driving of shallow
tunnels in soft ground is continuously increasing;e.g. 14.87 m slurry shield in Groene Hart, Nether-lands, 14.14 m slurry shield in Tokio Bay Aqua-Line, Japan, 14.2 m diameter mixshields in Ham-burg, Germany and Moscow Lefortovo, Russia,13.21 m diameter mixshield in Kuala Lumpur,Malasia etc., 12 m diameter EPB’s are currentlyused for the construction of L9 metro line in Bar-celona, 15 m diameter EPB machine is also cur-rently used for the construction of the Madridmetro extension etc. It is envisaged that in the im-mediate future TBM’s with a diameter of 20 m ormore will be used in tunneling.
In many cases a TBM may encounter a loosegeological material (i.e. soil or heavily fracturedrock), therefore a pressure should be applied onthe tunnel’s face to prevent its instability or exces-sive ground surface subsidence. This pressurecould be originated from compressed air, slurrymixture (slurry shields principle) or the excavatedgeomaterial itself mixed with foams and additivesto give to the material in the excavation chamberthe desired rheological properties (EPB workingprinciple). There is a long list of shallow tunnelcollapses in urban areas mostly occured using theNew Austrian Tunneling Method (NATM) or morecorrectly “open front” or “cyclical tunnel excava-tion” in loose ground; one collapse every 10 km onaverage during the construction of Hannover-Würzburg line of German Rail, many collapses
* Department of Mineral Resources Engineering, Technical University of Crete, Chania, Greece, [email protected]
** Department of Dynamic, Tectonic and Applied Geology, Facul-ty of Geology, University of Athens, Greece, [email protected]
10 VARDOULAKIS - STAVROPOULOU - EXADAKTYLOS
RIVISTA ITALIANA DI GEOTECNICA
during the construction of the Heathrow tunnel,two collapses during construction of Athens metrotunnel etc.
The assessment of the safety of shallow under-ground excavations in soft ground, both for tunnelconstruction and mining, usually requires solu-tions of two separate predictive problems. Firstly,it is necessary to determine the stability of the ex-cavation, for the safety of those at the surface andunderground. Secondly, to prevent damage to sur-face or subsurface structures, it is also necessary todetermine the pattern of ground deformationsthat will result from the construction works. Thispaper deals with the second of these problems; theaim is to understand how the release of pressureapplied to the tunnel face through a controlled re-treat of the rigid support of the face, is transferredto the higher stratigraphic layers above the crownof the tunnel and finally to the ground surface. Forthis purpose a special small-scale sandbox devicehas been created and then several experimentswith dry sand were carried-out at three overburdenheight to tunnel diameter ratios. Subsequently,fundamental principles of Dimensional Analysisand Displacement Diffusion Theories have beenapplied in order to derive a simple dimensionlessrelationship for the dependence of the maximumsubsidence of any stratigraphic layer above theshallow tunnel on the horizontal displacement ofthe rigid tunnel support. It is shown during theprocess of the derivation of the analytical formulathat the subsidence of the dry sand above the re-treating vertical tunnel face is a diffusive process.Finally, preliminary numerical simulations withFLAC3D [ITASCA, 2002] were executed and the firstresults are found in close agreement with the ex-periments.
2. Experimental Set-up
2.1. Physical and mechanical parameters of the model ma-terial
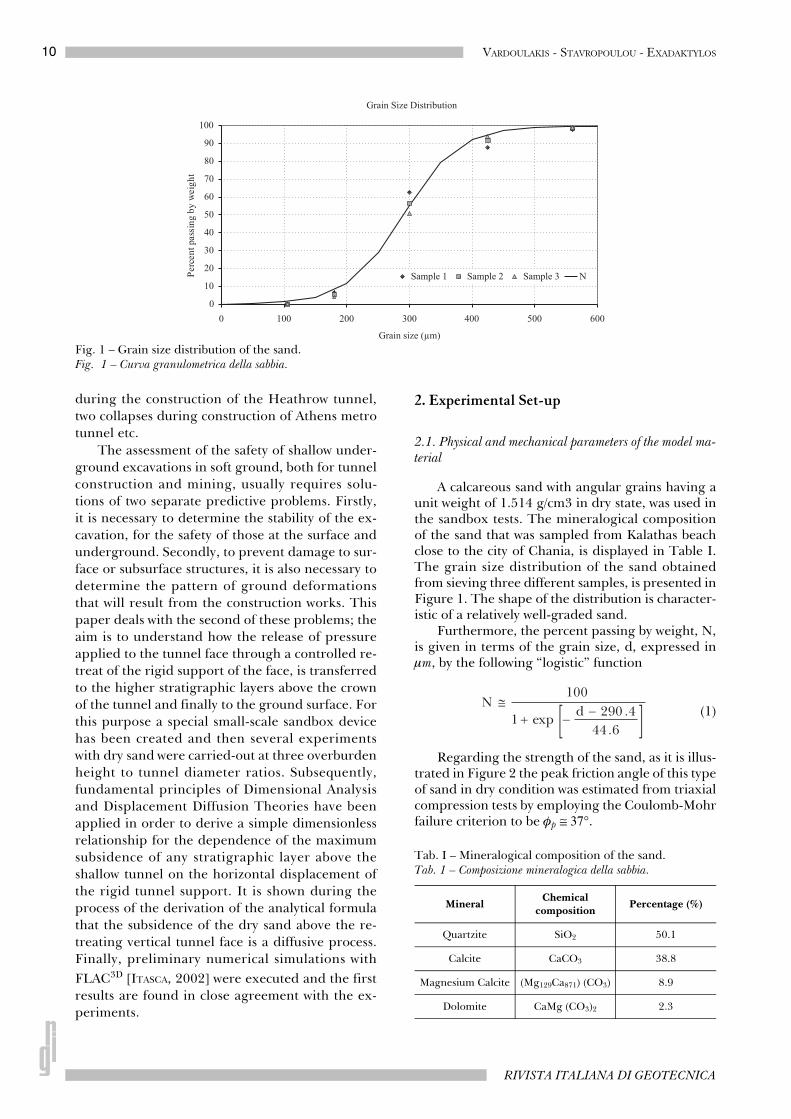
A calcareous sand with angular grains having aunit weight of 1.514 g/cm3 in dry state, was used inthe sandbox tests. The mineralogical compositionof the sand that was sampled from Kalathas beachclose to the city of Chania, is displayed in Table I.The grain size distribution of the sand obtainedfrom sieving three different samples, is presented inFigure 1. The shape of the distribution is character-istic of a relatively well-graded sand.
Furthermore, the percent passing by weight, N,is given in terms of the grain size, d, expressed inμm, by the following “logistic” function
(1)
Regarding the strength of the sand, as it is illus-trated in Figure 2 the peak friction angle of this typeof sand in dry condition was estimated from triaxialcompression tests by employing the Coulomb-Mohrfailure criterion to be φp ≅ 37°.
Tab. I – Mineralogical composition of the sand.Tab. 1 – Composizione mineralogica della sabbia.
MineralChemical
compositionPercentage (%)
Quartzite SiO2 50.1
Calcite CaCO3 38.8
Magnesium Calcite (Mg129Ca871) (CO3) 8.9
Dolomite CaMg (CO3)2 2.3
Fig. 1 – Grain size distribution of the sand.Fig. 1 – Curva granulometrica della sabbia.

11SANDBOX MODELING OF THE SHALLOW TUNNEL FACE COLLAPSE
GENNAIO - MARZO 2009
The modulus of elasticity of the dry sand wasalso evaluated from the triaxial compression tests byfitting straight lines to the unloading-reloadingloops performed in each test. As it may be seen fromthe diagram of Figure 3 the calculated elastic mod-ulus of the sand clearly displays a more or less linearpressure-dependency. This line has been extrapo-lated for pressures lower than 200 kPa down to fewkPa’s which is the magnitude of mean pressure oc-curring at the tunnel crown level of the sandbox ex-periments for H/D=0.5, 1 and 2. From the same fig-ure it may be inferred with some caution that theelastic modulus, E, of the sand at sufficient smallmean normal stress, p, is E≅130 MPa, (p/E)→ 0. It isworth mentioning, that this order of magnitude ofthe elastic modulus of sand is in accordance with nu-merical simulations that predict the same more orless settlements above the tunnel that will be pre-sented in Section 4 of this paper.
Finally, the dilatancy angle of the sand, which isherein denoted as usual by the lowercase Greek let-
ter ψ, was estimated from a series of direct sheartests on more or less loosely pluviated dry sand witha unit weight of γd=1.514g/cm3, by measuring thevertical and horizontal displacements. As it is shown
Fig. 2 – Mohr envelopes of sand obtained from triaxial compression tests and bestfitted Coulomb-Mohr linear failure cri-terion. Fig. 2 – Inviluppo di rottura di Mohr per la sabbia ottenuto con prove di compressione triassiale e interpolazione con la retta di Mohr- Coulomb.
Fig. 3 – Linear dependence of the elastic modulus of the dry sand on mean normal stress inferred from the triaxial com-pression tests. The variables of the best fitted linear eqn y and x refer to E and p, respectively. Fig. 3 – Andamento lineare del modulo elastico della sabbia asciutta in funzione della pressione normale media dedotto da prove di compressione triassiale. Le variabili della retta di interpolazione, y e x, si riferiscono rispettivemente a E e p.
Fig. 4 – A thin slice of thickness d of a sheared granularmaterial that exhibits dilatancy (increase of volume andporosity), in which ·uv=∂ uv, ·uh =∂ uh for time-indepen-dent deformations. Fig. 4 – Un sottile strato di materiale granulare, di spessore d, sottoposto a deformazione di taglio e manifestante comportamento dilatante (aumento di volume e porosità), con ·uv=∂ uv, ·uh =∂ uh per spostamenti indipendenti dal tempo.

12 VARDOULAKIS - STAVROPOULOU - EXADAKTYLOS
RIVISTA ITALIANA DI GEOTECNICA
in Figure 4 the dilatancy angle can be estimatedfrom the following formula
(2)
where uv, uh denote vertical and horizontal displace-ments.
The dependence of the vertical displacement onthe horizontal displacement during the three sheartests are illustrated in Figure 5. Best-fitted polyno-mial curves shown in the same figure are subse-quently used for the computation of the slope ∂uv/∂uh and then through Equation (2) for the construc-tion of the diagram illustrated in Figure 6 that refers
to the variation of the tangent of the mobilized dila-tancy angle (dilatancy coefficient) with the horizon-tal displacement for the three tests at hand. Fromthis diagram it was inferred that the peak dilatancyangles of the sand are ψp≅6.4°, 6.3° and 5o, for thedirect shear tests corresponding to a applied nor-mal stresses of 30, 46 and 60 kPa, respectively. Inthe same figure the evolution of the mobilized fric-tion coefficient of the dry sand with the horizontaldisplacement for the three tests at hand, is also dis-played.
It was found that for this particular quartziticsand the following approximate empirical relationholds true
ψp ≈ φp – 31° (3)
Fig. 5 – The variation of the vertical displacement with the horizontal displacement for the three direct shear tests. Thevariables of the best fitted linear eqn namely y and x refer to uv and uh, respectively. Fig. 5 – L'andamento dello spostamento verticale in funzione dello spostamento orizzontale per le tre prove di taglio diretto. Le variabili della retta di interpolazione, y e x, si riferiscono rispettivamente a uv e uh.
Fig. 6 – The variation of the mobilized friction coefficient (tangent of the friction angle φ) and of the mobilized dilatancycoefficient (tangent of the dilatancy angle ψ) of the sand with the horizontal displacement for the three direct shear testsat hand.Fig. 6 – L'andamento approssimativo del coefficiente di attrito mobilitato (tangente dell'angolo di attrito φ) e del coefficiente di dilatanza mobilitata (tangente dell'angolo di dilatanza ψ) della sabbia in funzione dello spostamento orizzontale per le tre prove di taglio diretto.

13SANDBOX MODELING OF THE SHALLOW TUNNEL FACE COLLAPSE
GENNAIO - MARZO 2009
It may be shown that the two hypotheses of Tay-lor’s theory [TAYLOR, 1948] lead to the result that agranular material that is characterized by internalfriction and dilatancy, may be considered to behaveequivalently, from an energetic point of view, with amaterial that obeys Coulomb’s friction law and de-forms in an isochoric manner. The internal frictionangle φeq of this equivalent material is given by thefollowing equation
tan φeq = tan φ – tan ψ (4)
From the direct shear tests we may deduce thefollowing values of strength parameters of the looseKalathas sand: (a) a peak friction angle φp = 37° thatis in accordance with that obtained independentlyfrom the triaxial compression tests, (b) a peak dila-tancy angle ψp ≅ 6°, (c) a critical state friction angleφc ≅ 35°, and (d) a Taylor’s equivalent friction angleφeq ≅ 33°.
2.2. Description of the sandbox device
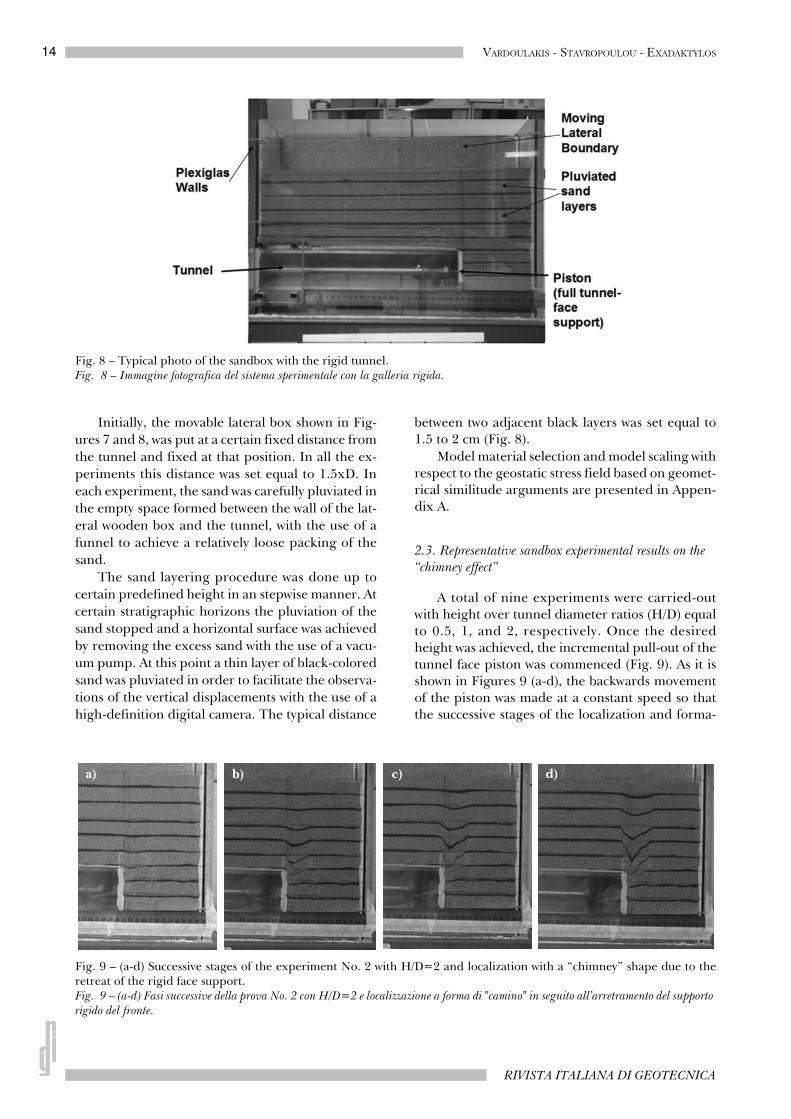
A special sandbox device was created to simulateTBM-driven shallow tunnels in a frictional groundcharacterized by a small cohesion (see Appendix A).As it is illustrated in Figure 7, only one-half of thetunnel cross-section was simulated using this device,since the problem under investigation is symmetri-cal in the vertical plane passing through the tunnelaxis. As may be seen in the same figure this designpermits also the observations and measurements ofdisplacements of the sand both along the longitudi-nal axial of the tunnel and on a vertical plane nor-
mal to the tunnel axis. The dimensions of the sand-box are 54x152x60 cm whereas the casing materialwas waterproof wood in order to be able to performexperiments with wet sand, as well.
After the construction of the wooden box, dou-ble-sheeted transparent glasses were fixed on thethree sides of it (two lateral sides and in the front)to facilitate observations during the experiments.The inner sheet is a crystalline glass and the outeris a Plexiglas with thicknesses of 0.5 and 1 cm, re-spectively. The insertion of the inner crystallineglass was done in order on one hand to reduce theinterfacial friction between the transparent wallswith the quartzitic sand, and on the other hand toavoid the scratching of the surface of the Plexiglasduring each sand pluviation. After fixing theglasses on the box, a semi-circular hole with a diam-eter of D=7 cm was opened on the two lateral glass-walls and at the contacts of these lateral walls withthe front glass wall (Fig. 7). Through that hole atube was subsequently fixed that was also madefrom Plexiglas. In that tube a piston was insertedwith a rigid face which could be pushed inwards orpulled outwards with help of a screw (see Fig. 8).This experimental configuration corresponds to atunnel excavation with a shield machine immedi-ately followed by a lining of concrete rings, in sucha manner that a fully rigidly supported tunnel pe-riphery and face to occur. Face instability may besimulated by pulling outwards the piston thus im-posing a certain movement of the tunnel face (i.e.extrusion of the tunnel face).
Fig. 7 – Drawing of the sandbox device. All dimensions in cm. Sand fills the space prescribed by the moving lateral bound-ary, the three vertical Plexiglas walls and the bottom wooden floor. Fig. 7 – Schema del modello in scala ridotta. Le dimensioni sono in cm. La sabbia riempie il volume definito dalle pareti laterali mobili, le tre pareti verticali in Plexiglas, e il fondo in legno.
14 VARDOULAKIS - STAVROPOULOU - EXADAKTYLOS
RIVISTA ITALIANA DI GEOTECNICA
Initially, the movable lateral box shown in Fig-ures 7 and 8, was put at a certain fixed distance fromthe tunnel and fixed at that position. In all the ex-periments this distance was set equal to 1.5xD. Ineach experiment, the sand was carefully pluviated inthe empty space formed between the wall of the lat-eral wooden box and the tunnel, with the use of afunnel to achieve a relatively loose packing of thesand.
The sand layering procedure was done up tocertain predefined height in an stepwise manner. Atcertain stratigraphic horizons the pluviation of thesand stopped and a horizontal surface was achievedby removing the excess sand with the use of a vacu-um pump. At this point a thin layer of black-coloredsand was pluviated in order to facilitate the observa-tions of the vertical displacements with the use of ahigh-definition digital camera. The typical distance
between two adjacent black layers was set equal to1.5 to 2 cm (Fig. 8).
Model material selection and model scaling withrespect to the geostatic stress field based on geomet-rical similitude arguments are presented in Appen-dix A.
2.3. Representative sandbox experimental results on the “chimney effect”
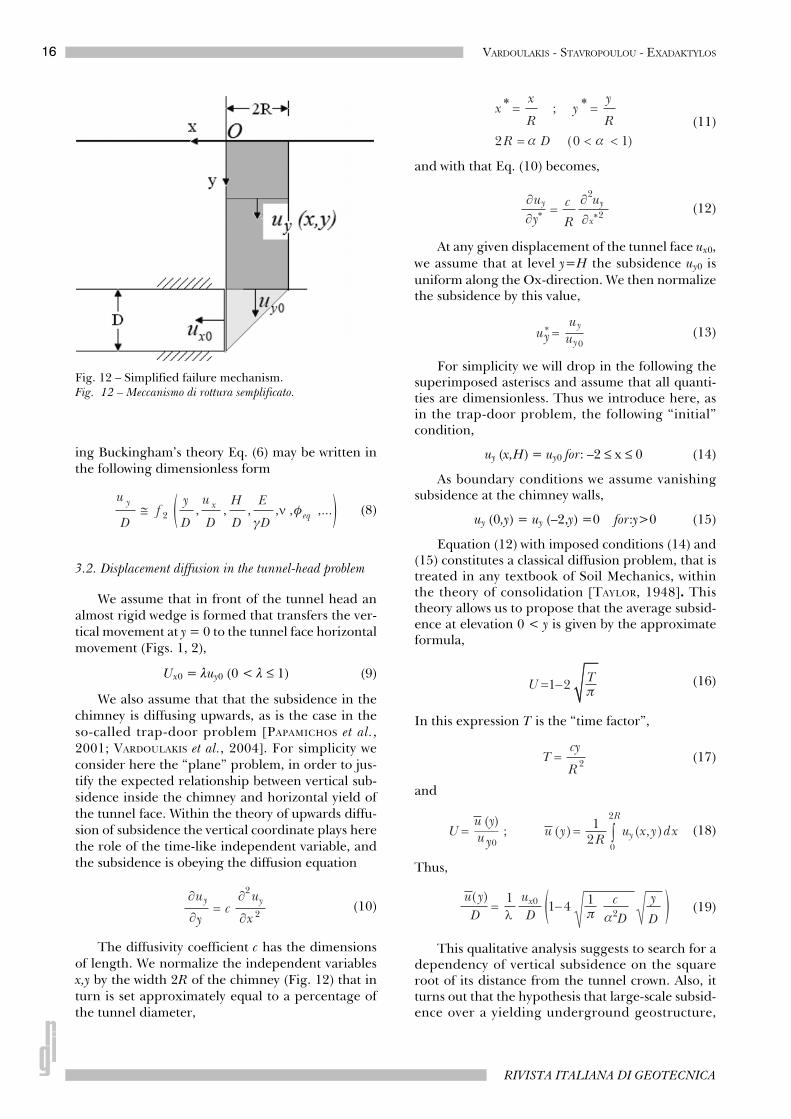
A total of nine experiments were carried-outwith height over tunnel diameter ratios (H/D) equalto 0.5, 1, and 2, respectively. Once the desiredheight was achieved, the incremental pull-out of thetunnel face piston was commenced (Fig. 9). As it isshown in Figures 9 (a-d), the backwards movementof the piston was made at a constant speed so thatthe successive stages of the localization and forma-
Fig. 8 – Typical photo of the sandbox with the rigid tunnel.Fig. 8 – Immagine fotografica del sistema sperimentale con la galleria rigida.
a) b) c) d)
Fig. 9 – (a-d) Successive stages of the experiment No. 2 with H/D=2 and localization with a “chimney” shape due to theretreat of the rigid face support.Fig. 9 – (a-d) Fasi successive della prova No. 2 con H/D=2 e localizzazione a forma di "camino" in seguito all’arretramento del supporto rigido del fronte.

15SANDBOX MODELING OF THE SHALLOW TUNNEL FACE COLLAPSE
GENNAIO - MARZO 2009
tion of the “chimney” in the front and above the faceof the tunnel could be easily observed.
At certain stages of the experiment photographswhere taken that were later analyzed in order to finda correlation between tunnel-face displacement andsurface subsidence in the front and above the tunnel.The processing of the photographs and the meas-urements on them were made with the use of an au-todesc design application as it is shown in Figure 10.The accuracy of the measurements of vertical dis-placements of the sand, as well of the horizontal dis-placement of the face using this technique was of theorder of the 1÷2 mm. The collected data were sub-sequently stored in spreadsheets in order to find thecorrelation between the various dimensionless pa-rameters of the problem at hand.
3. Dimensional Analysis of the experimental data
3.1. Basic equations
It is assumed that the maximum vertical subsid-ence uy of the various sand layers is a function of ywhich is the distance of this layer from the free sur-face, the horizontal displacement of the tunnel facesupport ux, the geometrical characteristics of thegiven problem shown in Figure 11, namely the diam-eter D of the tunnel, and the height of the overbur-den H, and finally from the properties of the sand,such as the elastic modulus, Poisson’s ratio ν, unitweight, friction and dilatancy angles. That is to say,
Uy ≅ f0 (y,ux,H,D,φ,ψ,E,ν,γ, …) (5)
The above equation may be further simplifiedby assuming isochoric deformations ψ ≅ 0 by adopt-ing Taylor’s equivalent sand concept with equiva-lent internal friction angle φeq,
Uy ≅ f1 (y,ux,H,D,φeq,E,ν,γ, …) (6)
The dimensions of the problem are length andforce. Buckingham’s theorem which is used in di-mensional analysis, states that [HORNING, 2006]: ifN2 is the total number of the variables of the prob-lem and that N3 is the number of the standard di-mensions that are needed to express the dimensionsof all the variables, then the number of the inde-pendent dimensionless variables that describe theproblem N1 is given by the relationship
N1 = N2– N3 (7)
Since in our case from Eq. (6) N2 = 9 and N3=2,then according to Eq. (7) N1 = 7. Therefore, apply-
Fig. 10 – Processing of a photographic image with an autodesk design application to measure vertical displacements. Notethat the photos were initially brought up-to-scale so that the measurements would have the maximum accuracy.Fig. 10 – Trattamento dell'immagine fotografica con un'applicazione grafica autodesk, per la misurazione degli spostamenti verticali. Si noti che le fotografie sono state preliminarmente sottoposte ad ingrandimento al fine di ottenere la massima precisione delle misure.
Fig. 11 – Geometrical parameters of the problem.Fig. 11 – Parametri geometrici del problema.
16 VARDOULAKIS - STAVROPOULOU - EXADAKTYLOS
RIVISTA ITALIANA DI GEOTECNICA
ing Buckingham’s theory Eq. (6) may be written inthe following dimensionless form
(8)
3.2. Displacement diffusion in the tunnel-head problem
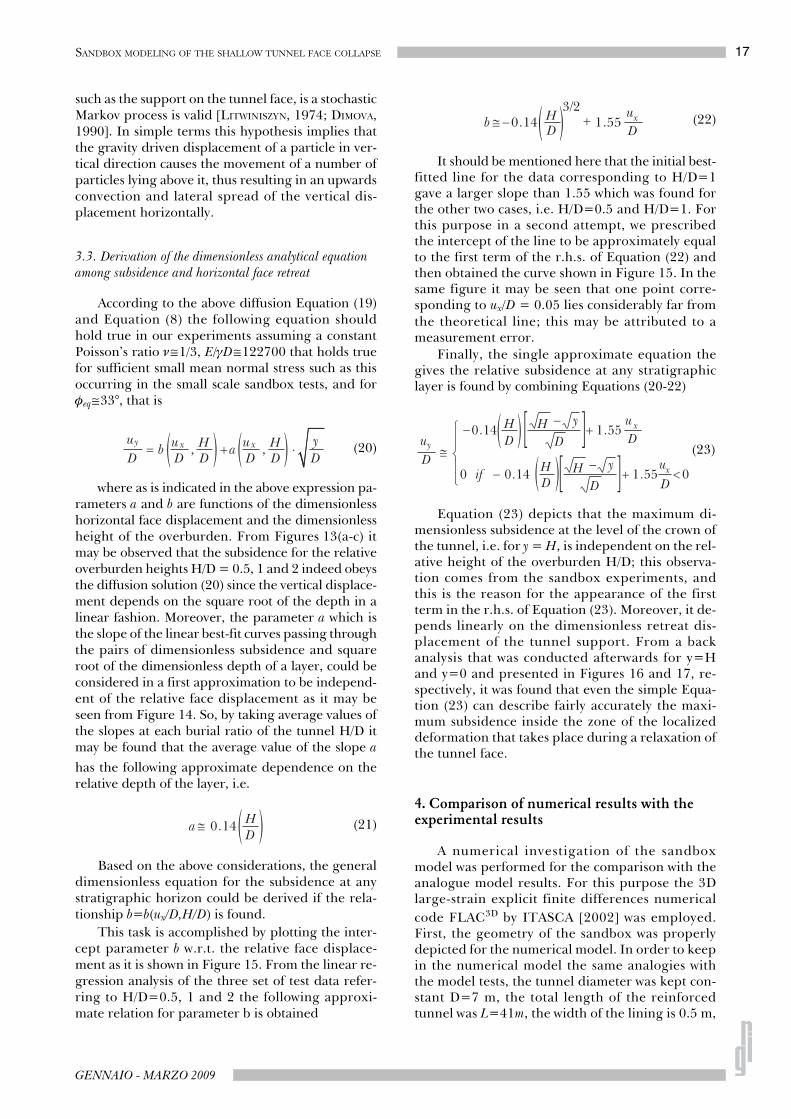
We assume that in front of the tunnel head analmost rigid wedge is formed that transfers the ver-tical movement at y = 0 to the tunnel face horizontalmovement (Figs. 1, 2),
Ux0 = λuy0 (0 < λ ≤ 1) (9)
We also assume that that the subsidence in thechimney is diffusing upwards, as is the case in theso-called trap-door problem [PAPAMICHOS et al.,2001; VARDOULAKIS et al., 2004]. For simplicity weconsider here the “plane” problem, in order to jus-tify the expected relationship between vertical sub-sidence inside the chimney and horizontal yield ofthe tunnel face. Within the theory of upwards diffu-sion of subsidence the vertical coordinate plays herethe role of the time-like independent variable, andthe subsidence is obeying the diffusion equation
(10)
The diffusivity coefficient c has the dimensionsof length. We normalize the independent variablesx,y by the width 2R of the chimney (Fig. 12) that inturn is set approximately equal to a percentage ofthe tunnel diameter,
(11)
and with that Eq. (10) becomes,
(12)
At any given displacement of the tunnel face ux0,we assume that at level y=H the subsidence uy0 isuniform along the Ox-direction. We then normalizethe subsidence by this value,
(13)
For simplicity we will drop in the following thesuperimposed asteriscs and assume that all quanti-ties are dimensionless. Thus we introduce here, asin the trap-door problem, the following “initial”condition,
uy (x,H) = uy0 for: –2 ≤ x ≤ 0 (14)
As boundary conditions we assume vanishingsubsidence at the chimney walls,
uy (0,y) = uy (–2,y) =0 for:y>0 (15)
Equation (12) with imposed conditions (14) and(15) constitutes a classical diffusion problem, that istreated in any textbook of Soil Mechanics, withinthe theory of consolidation [TAYLOR, 1948]. Thistheory allows us to propose that the average subsid-ence at elevation 0 < y is given by the approximateformula,
(16)
In this expression T is the “time factor”,
(17)
and
(18)
Thus,
(19)
This qualitative analysis suggests to search for adependency of vertical subsidence on the squareroot of its distance from the tunnel crown. Also, itturns out that the hypothesis that large-scale subsid-ence over a yielding underground geostructure,
Fig. 12 – Simplified failure mechanism.Fig. 12 – Meccanismo di rottura semplificato.
17SANDBOX MODELING OF THE SHALLOW TUNNEL FACE COLLAPSE
GENNAIO - MARZO 2009
such as the support on the tunnel face, is a stochasticMarkov process is valid [LITWINISZYN, 1974; DIMOVA,1990]. In simple terms this hypothesis implies thatthe gravity driven displacement of a particle in ver-tical direction causes the movement of a number ofparticles lying above it, thus resulting in an upwardsconvection and lateral spread of the vertical dis-placement horizontally.
3.3. Derivation of the dimensionless analytical equation among subsidence and horizontal face retreat
According to the above diffusion Equation (19)and Equation (8) the following equation shouldhold true in our experiments assuming a constantPoisson’s ratio ν≅1/3, E/γD≅122700 that holds truefor sufficient small mean normal stress such as thisoccurring in the small scale sandbox tests, and forφeq≅33°, that is
(20)
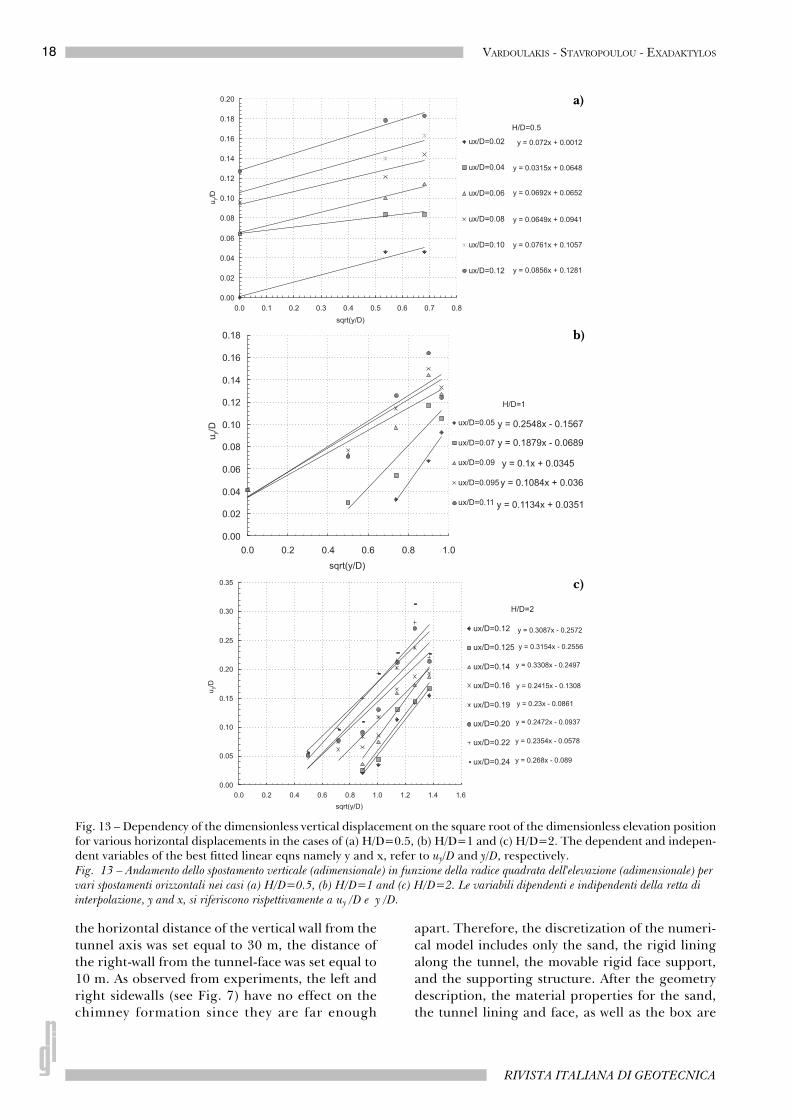
where as is indicated in the above expression pa-rameters a and b are functions of the dimensionlesshorizontal face displacement and the dimensionlessheight of the overburden. From Figures 13(a-c) itmay be observed that the subsidence for the relativeoverburden heights H/D = 0.5, 1 and 2 indeed obeysthe diffusion solution (20) since the vertical displace-ment depends on the square root of the depth in alinear fashion. Moreover, the parameter a which isthe slope of the linear best-fit curves passing throughthe pairs of dimensionless subsidence and squareroot of the dimensionless depth of a layer, could beconsidered in a first approximation to be independ-ent of the relative face displacement as it may beseen from Figure 14. So, by taking average values ofthe slopes at each burial ratio of the tunnel H/D itmay be found that the average value of the slope ahas the following approximate dependence on therelative depth of the layer, i.e.
(21)
Based on the above considerations, the generaldimensionless equation for the subsidence at anystratigraphic horizon could be derived if the rela-tionship b=b(ux/D,H/D) is found.
This task is accomplished by plotting the inter-cept parameter b w.r.t. the relative face displace-ment as it is shown in Figure 15. From the linear re-gression analysis of the three set of test data refer-ring to H/D=0.5, 1 and 2 the following approxi-mate relation for parameter b is obtained
(22)
It should be mentioned here that the initial best-fitted line for the data corresponding to H/D=1gave a larger slope than 1.55 which was found forthe other two cases, i.e. H/D=0.5 and H/D=1. Forthis purpose in a second attempt, we prescribedthe intercept of the line to be approximately equalto the first term of the r.h.s. of Equation (22) andthen obtained the curve shown in Figure 15. In thesame figure it may be seen that one point corre-sponding to ux/D = 0.05 lies considerably far fromthe theoretical line; this may be attributed to ameasurement error.
Finally, the single approximate equation thegives the relative subsidence at any stratigraphiclayer is found by combining Equations (20-22)
(23)
Equation (23) depicts that the maximum di-mensionless subsidence at the level of the crown ofthe tunnel, i.e. for y = H, is independent on the rel-ative height of the overburden H/D; this observa-tion comes from the sandbox experiments, andthis is the reason for the appearance of the firstterm in the r.h.s. of Equation (23). Moreover, it de-pends linearly on the dimensionless retreat dis-placement of the tunnel support. From a backanalysis that was conducted afterwards for y=Hand y=0 and presented in Figures 16 and 17, re-spectively, it was found that even the simple Equa-tion (23) can describe fairly accurately the maxi-mum subsidence inside the zone of the localizeddeformation that takes place during a relaxation ofthe tunnel face.
4. Comparison of numerical results with the experimental results
A numerical investigation of the sandboxmodel was performed for the comparison with theanalogue model results. For this purpose the 3Dlarge-strain explicit finite differences numericalcode FLAC3D by ITASCA [2002] was employed.First, the geometry of the sandbox was properlydepicted for the numerical model. In order to keepin the numerical model the same analogies withthe model tests, the tunnel diameter was kept con-stant D=7 m, the total length of the reinforcedtunnel was L=41m, the width of the lining is 0.5 m,
18 VARDOULAKIS - STAVROPOULOU - EXADAKTYLOS
RIVISTA ITALIANA DI GEOTECNICA
the horizontal distance of the vertical wall from thetunnel axis was set equal to 30 m, the distance ofthe right-wall from the tunnel-face was set equal to10 m. As observed from experiments, the left andright sidewalls (see Fig. 7) have no effect on thechimney formation since they are far enough
apart. Therefore, the discretization of the numeri-cal model includes only the sand, the rigid liningalong the tunnel, the movable rigid face support,and the supporting structure. After the geometrydescription, the material properties for the sand,the tunnel lining and face, as well as the box are
a)
b)
c)
Fig. 13 – Dependency of the dimensionless vertical displacement on the square root of the dimensionless elevation positionfor various horizontal displacements in the cases of (a) H/D=0.5, (b) H/D=1 and (c) H/D=2. The dependent and indepen-dent variables of the best fitted linear eqns namely y and x, refer to uy/D and y/D, respectively.Fig. 13 – Andamento dello spostamento verticale (adimensionale) in funzione della radice quadrata dell'elevazione (adimensionale) per vari spostamenti orizzontali nei casi (a) H/D=0.5, (b) H/D=1 and (c) H/D=2. Le variabili dipendenti e indipendenti della retta di interpolazione, y and x, si riferiscono rispettivamente a uy /D e y /D.

19SANDBOX MODELING OF THE SHALLOW TUNNEL FACE COLLAPSE
GENNAIO - MARZO 2009
defined. The dry sand with unit weight γd=1.514g/cm3 is modeled as an elastic-perfectly plastic Cou-lombic, purely frictional material with a non-asso-ciative flow rule, and with a constant friction anddilatancy angles of φ=37° and ψ=6°, respectively.The Poisson’s ratio for sand was put equal to ν=0.3and its elastic modulus E=130MPa as was inferredfrom the triaxial cell tests (see Fig. 3). For the bet-ter simulation of the experiment, the concrete lin-ing of the tunnel and the TBM head on the tunnelface were simulated as rigid bodies. Roller bound-ary conditions that keep horizontal displacementsequal to zero are prescribed along the four verticalboundary walls that hold the sandpack. The topsurface is stress-free whereas the nodes of the bot-
tom surface of the model are all fixed in both di-mensions.
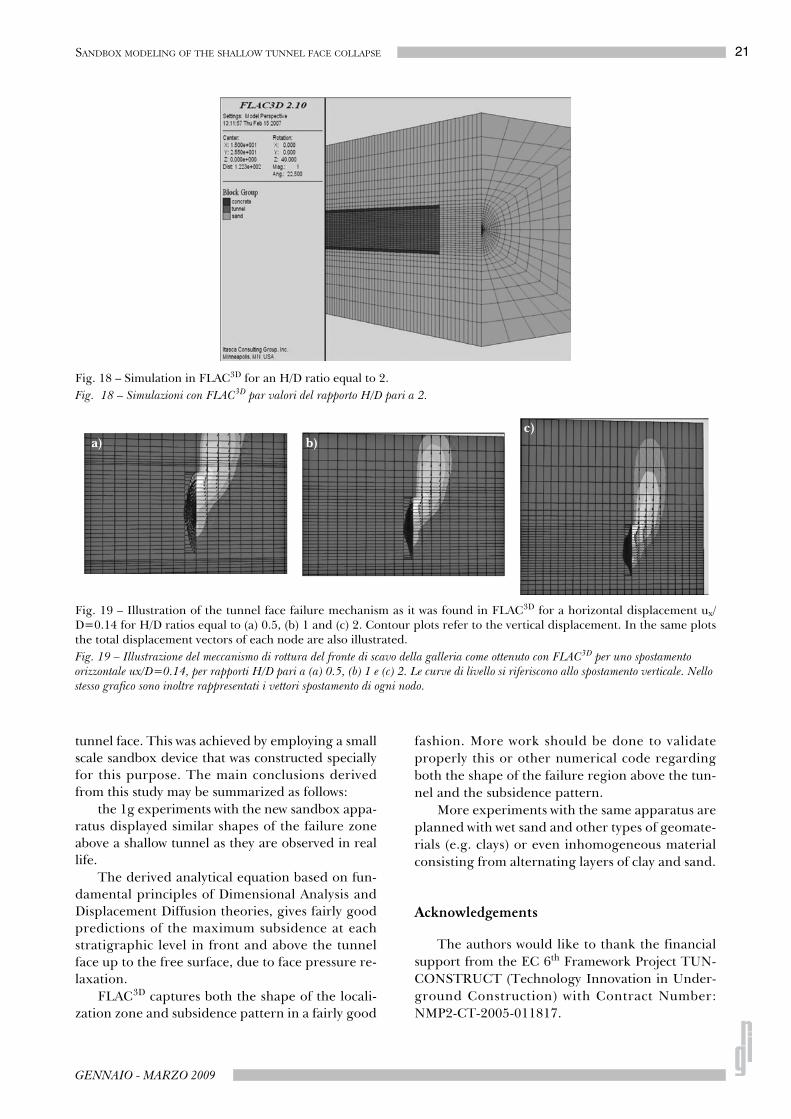
Each simulation was conducted in two phases: aninitial analysis to establish initial equilibrium underthe influence of gravitational body forces, and bound-ary restraints, followed by a phase during which thedisplacement velocity is imposed on the face supportin a stepwise manner in small time increments. Thegrid employed in the numerical model is illustrated inFigure 18 for the case of H/D=2.
The next stage of the simulation was the back-ward (relaxing) displacement of the tunnel face ux.Following that, the code was left to reach equilib-rium again. After the solution of the model for eachH/D ratio it was made clear that the failure zone infront and above the tunnel resemble to the ones that
Fig. 14 – Variation of the slope parameter a on the dimensionless displacement of the face ux/D.Fig. 14 – Andamento del parametro di pendenza a in funzione dello spostamento (adimensionale) del fronte ux /D.
Fig. 15 – Linear dependence of the intercept b on the relative face displacement for the three H/D ratios. The dependentand independent variables of the fitted linear eqns namely y and x, refer to parameter b and ux/D, respectively.Fig. 15 – Andamento lineare dell'intercetta b in funzione dello spostamento relativo del fronte per i tre valori del rapporto H/D. Le variabili dipendenti e indipendenti della retta d'interpolazione, y e x, si riferiscono rispettivamente ai parametri b e ux /D.
20 VARDOULAKIS - STAVROPOULOU - EXADAKTYLOS
RIVISTA ITALIANA DI GEOTECNICA
where observed during the experiments (i.e.Figs. 19 (a-c).
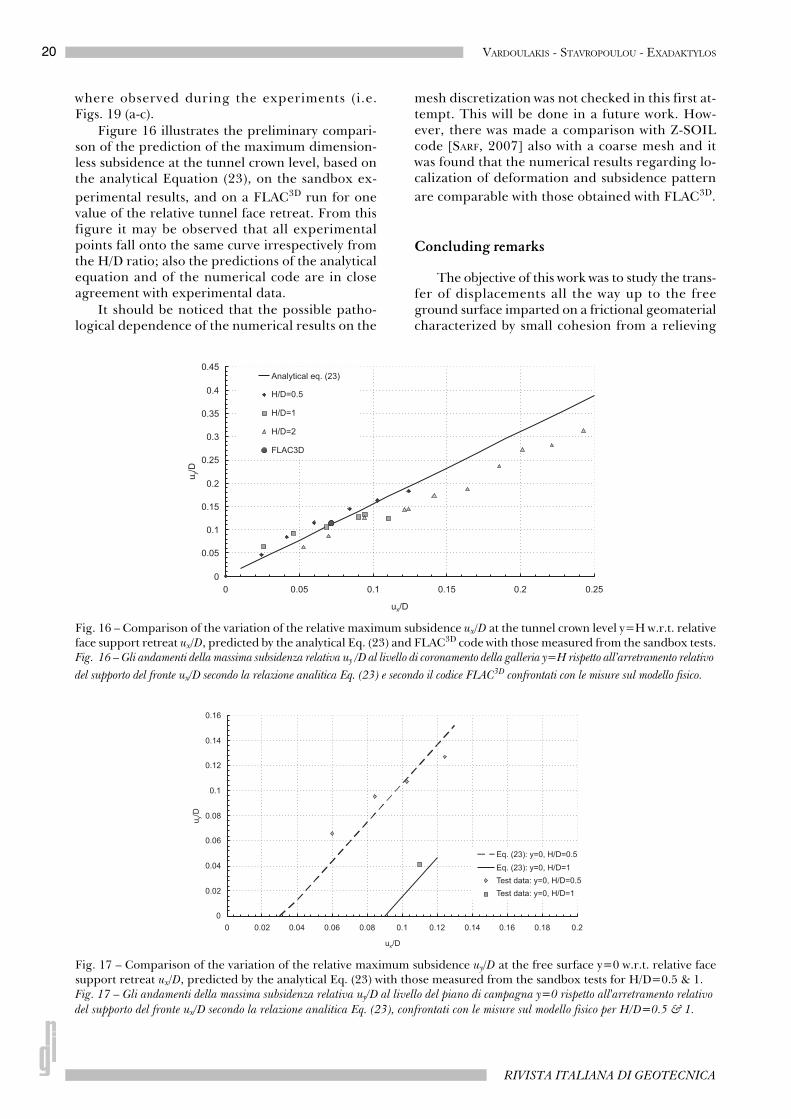
Figure 16 illustrates the preliminary compari-son of the prediction of the maximum dimension-less subsidence at the tunnel crown level, based onthe analytical Equation (23), on the sandbox ex-perimental results, and on a FLAC3D run for onevalue of the relative tunnel face retreat. From thisfigure it may be observed that all experimentalpoints fall onto the same curve irrespectively fromthe H/D ratio; also the predictions of the analyticalequation and of the numerical code are in closeagreement with experimental data.
It should be noticed that the possible patho-logical dependence of the numerical results on the
mesh discretization was not checked in this first at-tempt. This will be done in a future work. How-ever, there was made a comparison with Z-SOILcode [SARF, 2007] also with a coarse mesh and itwas found that the numerical results regarding lo-calization of deformation and subsidence patternare comparable with those obtained with FLAC3D.
Concluding remarks
The objective of this work was to study the trans-fer of displacements all the way up to the freeground surface imparted on a frictional geomaterialcharacterized by small cohesion from a relieving
Fig. 16 – Comparison of the variation of the relative maximum subsidence ux/D at the tunnel crown level y=H w.r.t. relativeface support retreat ux/D, predicted by the analytical Eq. (23) and FLAC3D code with those measured from the sandbox tests.Fig. 16 – Gli andamenti della massima subsidenza relativa uy /D al livello di coronamento della galleria y=H rispetto all’arretramento relativo del supporto del fronte ux/D secondo la relazione analitica Eq. (23) e secondo il codice FLAC3D confrontati con le misure sul modello fisico.
Fig. 17 – Comparison of the variation of the relative maximum subsidence uy/D at the free surface y=0 w.r.t. relative facesupport retreat ux/D, predicted by the analytical Eq. (23) with those measured from the sandbox tests for H/D=0.5 & 1.Fig. 17 – Gli andamenti della massima subsidenza relativa uy/D al livello del piano di campagna y=0 rispetto all'arretramento relativo del supporto del fronte ux/D secondo la relazione analitica Eq. (23), confrontati con le misure sul modello fisico per H/D=0.5 & 1.
21SANDBOX MODELING OF THE SHALLOW TUNNEL FACE COLLAPSE
GENNAIO - MARZO 2009
tunnel face. This was achieved by employing a smallscale sandbox device that was constructed speciallyfor this purpose. The main conclusions derivedfrom this study may be summarized as follows:
the 1g experiments with the new sandbox appa-ratus displayed similar shapes of the failure zoneabove a shallow tunnel as they are observed in reallife.
The derived analytical equation based on fun-damental principles of Dimensional Analysis andDisplacement Diffusion theories, gives fairly goodpredictions of the maximum subsidence at eachstratigraphic level in front and above the tunnelface up to the free surface, due to face pressure re-laxation.
FLAC3D captures both the shape of the locali-zation zone and subsidence pattern in a fairly good
fashion. More work should be done to validateproperly this or other numerical code regardingboth the shape of the failure region above the tun-nel and the subsidence pattern.
More experiments with the same apparatus areplanned with wet sand and other types of geomate-rials (e.g. clays) or even inhomogeneous materialconsisting from alternating layers of clay and sand.
Acknowledgements
The authors would like to thank the financialsupport from the EC 6th Framework Project TUN-CONSTRUCT (Technology Innovation in Under-ground Construction) with Contract Number:NMP2-CT-2005-011817.
Fig. 18 – Simulation in FLAC3D for an H/D ratio equal to 2.Fig. 18 – Simulazioni con FLAC3D par valori del rapporto H/D pari a 2.
a) b)c)
Fig. 19 – Illustration of the tunnel face failure mechanism as it was found in FLAC3D for a horizontal displacement ux/D=0.14 for H/D ratios equal to (a) 0.5, (b) 1 and (c) 2. Contour plots refer to the vertical displacement. In the same plotsthe total displacement vectors of each node are also illustrated.Fig. 19 – Illustrazione del meccanismo di rottura del fronte di scavo della galleria come ottenuto con FLAC3D per uno spostamento orizzontale ux/D=0.14, per rapporti H/D pari a (a) 0.5, (b) 1 e (c) 2. Le curve di livello si riferiscono allo spostamento verticale. Nello stesso grafico sono inoltre rappresentati i vettori spostamento di ogni nodo.

22 VARDOULAKIS - STAVROPOULOU - EXADAKTYLOS
RIVISTA ITALIANA DI GEOTECNICA
References
CARTER N.L. et al. (Eds.) (1981) - Mechanics of deforma-tion of crustal rocks: Historical development. In: Me-chanical Behavior of Crustal Rocks-The HandinVolume (Ed. Americal Geophysical Union, 1-9).
DIMOVA V.L. (1990) - Some direct and inverse problemsin applied geomechanics. Ph.D. Thesis, University ofMining & Geology, Sofia.
HORNING H.G. (2006) - Dimensional Analysis. Dover.HUBBERT M.K. (1937) - Theory of scale models as applied
to the study of geologic structures. Geol. Soc. Am.Bull., 48, pp. 1459-1520.
ITASCA CONSULTING GROUP (2002) - FLAC3D, Fast La-grangian Analysis of Continua in 3 Dimensions: User’sGuide. Minneapolis, Minnesota, USA.
LITWINISZYN J. (1974) - Stochastic Methods in the Me-chanics of Granular Bodies. Springer-Verlag, Wien.
PAPAMICHOS E., VARDOULAKIS I AND HEIL L.K. (2001) -Overburden modeling above a compacting reservoir us-ing a trap door apparatus. Physics and Chemistry ofthe Earth, Part A-Solid Earth and Geodesy, 26(nn.1-2), pp. 69-74.
SARF J.L. Personal communication.TAYLOR D.W. (1948) - Fundamentals of Soil Mechanics.
John Wiley.VARDOULAKIS I., VAIRAKTARIS E., PAPAMICHOS E. (2004)
- Subsidence diffusion–convection: I. The direct prob-lem, Comput. Methods Appl. Mech. Engrg. 193,pp. 2745-2760.
Appendix A
The geometric dimension (i.e. the diameters ofthe tunnel) DP of the prototype (P) is scaled down ina small-scale lab model test (M) to the value DM Forexample 1cm in the model may represent 2m in full-scale tunneling. That is to say our case ofDM=0.07m of the model corresponds to DP=14mtunnel diameter in full-scale, which is not an unreal-istic value. In that case the geometric scale is
(A.1)
Eq. (8) is the analytic expression of the depend-ence of the subsidence above tunnel, Similitude re-quirements imply that for yP≅2g/cm3 and yM =1.514g/cm3
(A.2)
and for a cohesive Coulombic material with cohe-sion c
(A.3)
Eqs. (A.2) and (A.3) mean that the deformationaland cohesive properties of the model material mustbe also down-scaled to the same extent as the geo-metric dimensions. In order to satisfy these modellaws, one must use as model material a material thathas a very low elasticity and strength. This observa-tion suggests to select cohesionless sand as modelmaterial (HUBBERT, 1937; CARTER et al.,1981) at leastfor the satisfaction of the low strength criterion.
Similarly, for the vertical geostatic stress σy = γ·y
(A.4)
This means that the 1g sandbox tests simulatelarge enough stresses occurring in real-life and nocentrifuge tests are necessary to artificially increasethe gravity.
Modellazione in scala ridotta del collasso del fronte di scavo di gallerie superficiali
SommarioIl presente lavoro ha come obiettivo lo studio per via
sperimentale, numerica e analitica del meccanismo di instabilità del fronte di scavo di gallerie cilindriche a sezione circolare scavate in geomateriali attritivi caratterizzati da debole coesione. Un modello fisico a scala ridotta è stato realizzato appositamente per lo studio sperimentale. In seguito, le prove sono state effettuate in condizioni di gravità normale, sulla stessa sabbia asciutta e cambiando ad ogni prova l'altezza del riempimento al di sopra del coronamento della galleria. Per un primo tentativo di derivazione di una semplice relazione analitica descrittiva dei valori massimi della subsidenza in corrispondenza di vari orizzonti stratigrafici al disopra della galleria e indotti dall'arretramento del fronte di scavo, i risultati delle prove su modello fisico sono stati analizzati con l'ausilio delle teorie dell'analisi dimensionale e della diffusione degli spostamenti. La relazione analitica che ne risulta, particolarmente semplice, si propone come strumento di ausilio nelle fasi di progetto ed esecuzione di gallerie superficiali nei casi in cui siano monitorati la subsidenza e i movimenti del fronte di scavo o la pressione sul fronte esercitata dalla fresa meccanica (TBM), così come ai fini della validazione di codici di calcolo. I risultati delle prove sperimentali sono inoltre confrontati con valori numerici ottenuti tramite il codice FLAC3D. Ne risulta che il migliore accordo tra dati numerici e misure sperimentali si ottiene in corrispondenza di un valore del modulo elastico della sabbia asciutta pari a 130 Mpa, dedotto inoltre indipendentemente dai risultati delle prove di compressione triassiale.Parole chiave: gallerie superficiali, instabilità del fronte di scavo, modellazione fisica in scala ridotta, analisi dimensionale, diffusione degli spostamenti, collasso di gallerie.