saratoga “building a leadership legacy” north carolina healthcare human resource assoc roi of...
Post on 19-Dec-2015
215 views
TRANSCRIPT

Saratoga
“Building a Leadership Legacy”
North Carolina HealthcareHuman Resource AssocROI of Human Capital

Saratoga
Agenda
– Over view of Saratoga Institute – Current Workplace Trends – ROI of Human Capital– What Employer of Choice Companies are
Doing

Saratoga
Saratoga Institute
Helping clients improve profitability and
productivity through the strategic
application of human capital intelligence

Saratoga
Saratoga InstituteWho Are We?
– Founded in 1977 by Dr. Jac Fitz-enz
– Based on over twenty years experience in human capital research
– Data and interviews from over 900 companies in 19 industries
– Over 1 million data elements from potential, current and past employees
– Relies on continuing academic research and studies

Saratoga Worldwide10 affiliates reaching clients in 25 countries
Australia
U.K.
Malaysia Micronesia
PhilippinesVenezuela
Belgium - France - Germany - Italy - Netherlands Portugal - Spain - Sweden - Switzerland
Singapore
UruguayArgentina
Chile New Zealand
Mexico Guatemala
Canada
SI
Indonesia
Hong Kong
Australia
Brazil
South Africa
Saratoga
What We Do
– Publisher of the world’s largest database of human capital intelligence
– Experts in Employee Commitment Surveys and Consulting
– Thought leaders in the human capital industry
– Design and implement Human Capital programs

The Big Picture
Current Workplace Trends

Saratoga
The People Problem
100 80 60 40 20 0 20 40 60
GDP +96%
BIRTHS -33%
1965 1998

Saratoga
The TrendsEscalating Costs
1997 2000 2002 2005
Cost/Hire 2228 3072 3655 4529 -exempt 6481 8932
10,581 13,054Time to Start 58 78 92 113
Voluntary Sep 1-3 yrs 26% 30% 33% 38% Training Invest Factor 441 495 549 630
*Data based on research from Saratoga Institute
Saratoga
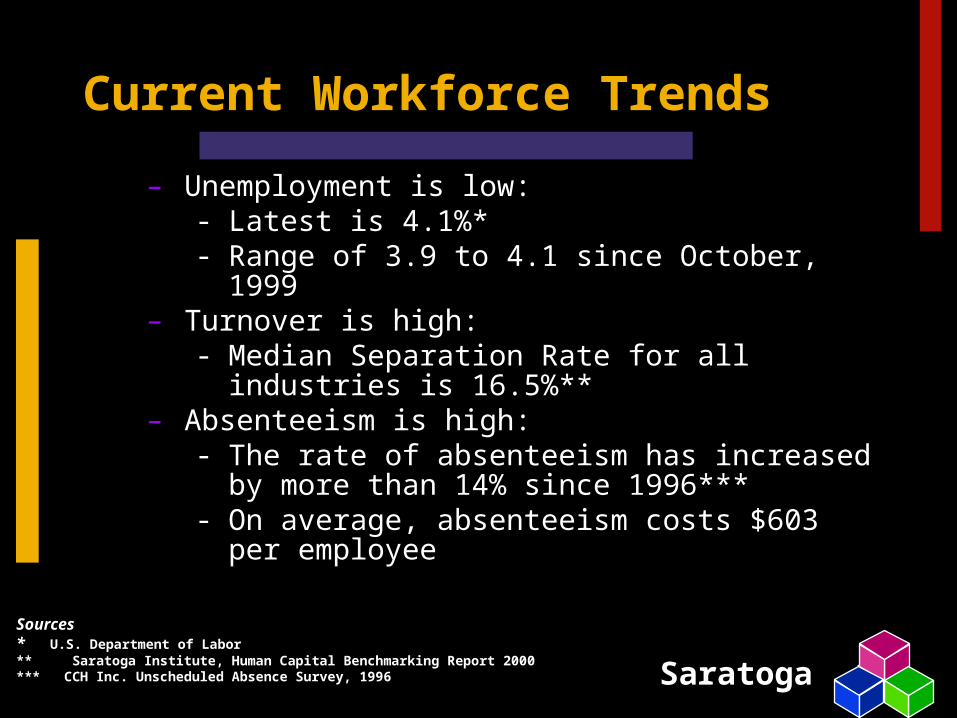
Current Workforce Trends
– Unemployment is low: - Latest is 4.1%*- Range of 3.9 to 4.1 since October, 1999
– Turnover is high:- Median Separation Rate for all
industries is 16.5%**– Absenteeism is high:
- The rate of absenteeism has increased by more than 14% since 1996***
- On average, absenteeism costs $603 per employee
Sources* U.S. Department of Labor** Saratoga Institute, Human Capital Benchmarking Report 2000*** CCH Inc. Unscheduled Absence Survey, 1996

Saratoga
Hospitals / Healthcare Industry Current Status
Voluntary Separations by Length of Service
0 -1 year 32.9%
1+ - 3 years 29.2%
3+ - 5 years 11.1%
5+ - 10 years 12.0%
10+ years 12.3%
Source: Saratoga Institute 2000 Benchmark Data
Turnover in early time frames leads to increased staffing and training costs

Saratoga
Hospitals / Healthcare Industry Current Status
Add Rate: Number of new jobs added last year
National Median 6.4%
Highest 21.7% (services industry)
Lowest 1.4% (chemicals/petroleum industry)
Hospitals/Healthcare 2.9%
Source: Saratoga Institute 2000 Benchmark Data
Industry in slow growth period

Saratoga
Hospitals / Healthcare Industry Current Status
Replacement Rate: Number of jobs needing replacement hires last year
National Median 13.8%
Highest 22.7% (services industry)
Lowest 4.7% (manufacturing industry)
Hospitals/Healthcare 21.7%
Source: Saratoga Institute 2000 Benchmark Data
Industry has very high turnover

Saratoga
Generation 1996 2000
Pre-Baby Boom (Born before 1946)Pre-Baby Boom (Born before 1946) 26% 26% 15%15% 6% 6%
Baby Boom (1946-64)Baby Boom (1946-64) 50%50% 50%50% 50%50%
Generation X (1964-)Generation X (1964-) 24%24% 35%35% 44%44%
2005
Current Workforce TrendsChanging Demographics
-Key talent aging-Median age increased from 28 in 1970 to 35 today to 40 by 2010
-2001 Baby Boomers become eligible for early retirement
-6.5 million will turn 55 by 2002 -15% decline in 35-44 year olds over the next 15 yearsDespite the tight labor market, only 65% of the companies today actively
recruit older workers to fill their vacancies

Saratoga
Current Workforce TrendsChanging Demographics
– 75% of the jobs of the future will be knowledge based jobs
– and yet...– 75% of current workforce (age 25 to 34) have not
completed college
– 70% of workforce will not be college graduates in the next decade
– 21% of the current adult population has only basic literacy skills
– 75% of workers will need retraining within the decade 1997 2000 2002 2005
Training Invest Factor $441 $495 $549 $630

Saratoga
Today’s OrganizationStruggling with Employee Commitment
– Profound Organizational Upheaval– Uncertainty– Lack of A Clear Corporate Vision– Mergers and Acquisitions Activity– Intense Competition for Talent– Changes in Executive Management
– Pressure to Deliver Results– Share holder value– Impact of Unfilled Jobs– Struggle to maintain work/life balance
– Decreased Productivity– Apathy– High levels of turnover

Saratoga
Five Most Negative Gaps
Concern GAP Upper mgmt leadership skills 2.32
Current bonus or add’l pay plans 2.26 Earnings potential 2.12
Company stability 2.16 Company loyalty to employees
2.12

Saratoga
Current Workforce Trends
Maintaining a competitive advantage means focusing on:
- Recruitment- Retention- Becoming an “Employer of
Choice”

ROI of Human Capital
Saratoga’s Approach

Saratoga
In A Knowledge Economy, The Primary Profit
Lever is
People

Saratoga
The Secondary Profit Lever Is
Information
-Hard and Soft Data-Employee Opinions-Saratoga Institute Human Capital Benchmarks

Saratoga
Information Is Power
Without Objective Data, People Have Opinions
With Objective Data,People Have Competitive Advantage

Saratoga
Importance Of Intangibles
“...the factors most important to economic growth and societal wealth are intangible, such as intellectual capital, research and development, brand names and human capital.”
Unseen Wealth: Report of the Brookings Task Force on Understanding Intangible Sources of Value
Saratoga
Measurement State Of The Art
“81% stated their performance measurement system is not well aligned with corporate strategies”*
* Cap Gemini Ernst & Young Center for Business Innovation - 2000

Saratoga
Uses For Hard Data
Communicate Performance Expectations
See (vs. “feel”) & Understand Outcomes
Compare to Standards / Benchmarks
Identify Performance Gaps
Recognize & Reward Performance
Support Resource Allocation Decisions

Saratoga
Performance Analysis
Unit Cost of Products & Services
Cycle Time of Key Processes
Volume of Output over Input
Error or Defect Rates (Quality)
Customer Satisfaction Scores

Saratoga
System Linkage
Enterprise Goals
Knowledge ManagementBusiness Unit PQS Objectives
HC ManagementAcquire - Maintain - Develop - Retain

Saratoga
HUMAN CAPITAL MANAGEMENTHire CostPay TimeSupport VolumeDevelop QualityRetain Reaction
OPERATING OBJECTIVES
Service: Customer Satisfaction
Quality: Six SigmaProductivity: Unit Cost
ENTERPRISE GOALS
Financial: Profit - EPS Position: Market ShareBrand: Sign of QualityReputation: Employer of Choice
Human Capital
Value Chain
1
2
3
4
Saratoga
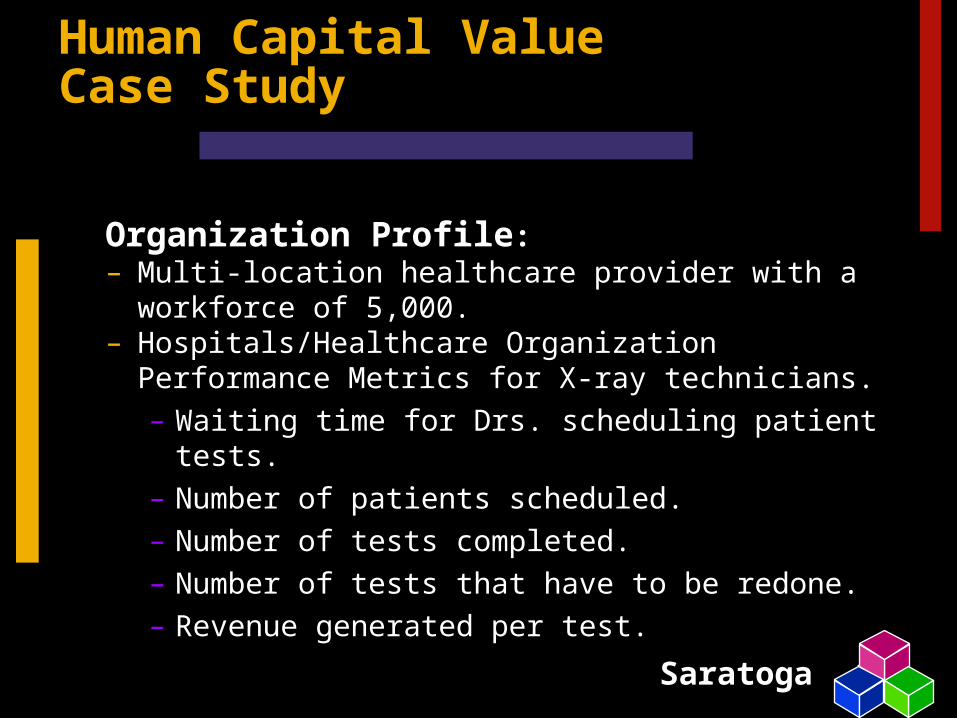
Human Capital Value Case Study
Organization Profile:– Multi-location healthcare provider with a
workforce of 5,000.– Hospitals/Healthcare Organization
Performance Metrics for X-ray technicians.– Waiting time for Drs. scheduling patient
tests.– Number of patients scheduled.– Number of tests completed.– Number of tests that have to be redone.– Revenue generated per test.

Saratoga
Human Capital Value Case Study
Human Resource Management:– Management responsible for recruiting and
interviewing.– Criteria for hire may vary depending on
urgency of need for X-ray technician staff.– Criteria for needed skills vary.– Division HR supports managers once
candidates are identified. Provides screening support and assistance with hiring technicians: background checks, offer and processing of new hire paperwork.
Saratoga
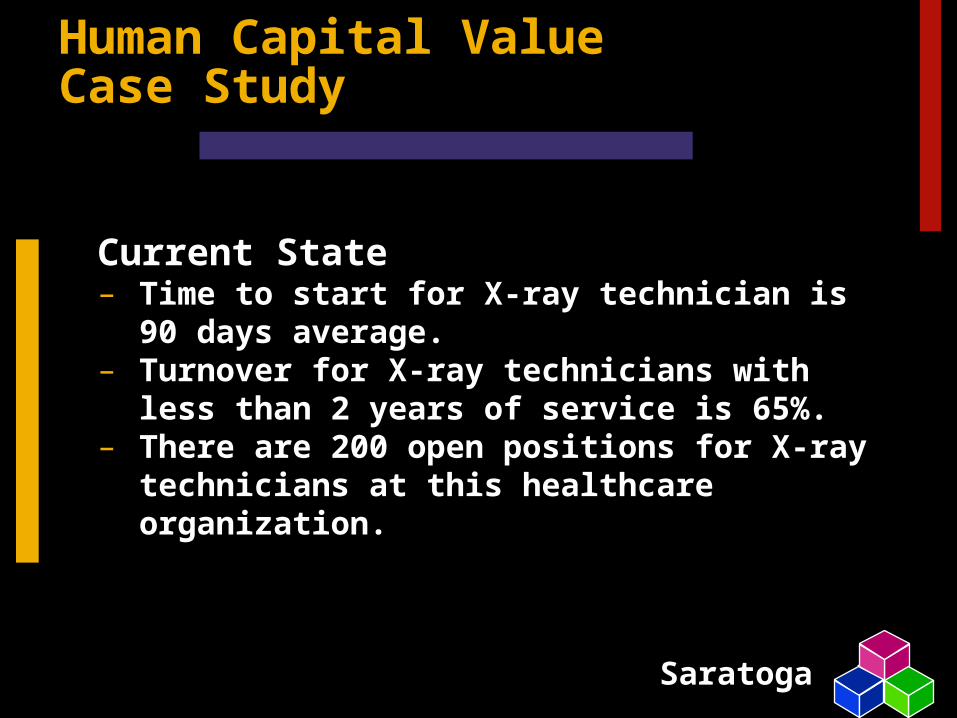
Human Capital Value Case Study
Current State– Time to start for X-ray technician is 90
days average.– Turnover for X-ray technicians with less
than 2 years of service is 65%.– There are 200 open positions for X-ray
technicians at this healthcare organization.

Saratoga
Human Capital Value Case Study
Missed OrganizationPerformance Metrics
Time to Start 90 DaysInconsistent Hiring Criteria
X-Ray Technician Team Customer
Delayed scheduling timeRedone tests
Penalties for delays
Missed PerformanceGoals
Fewer customers servedLess revenue per test

Saratoga
Cost of the Turnover GapUsing the Saratoga Data
Average Cost Per Hire for Hospital/Healthcare Industry $ 1,254
Multiply by 200 open positions with average time of 1 quarter to fill
Results in turnover costs of at least $250,800 per quarter
Cost Per Hire Source: Saratoga Institute 2000 Benchmark Data
Cost Per Hire measures the average dollars spent on hiring costs per employee hired.
Extending Tenure Measurably Decreases Costs

Saratoga
Cost of the Turnover GapUsing the Saratoga Data
Median Revenue Factor for Hospital/Healthcare Industry$ 102,438
Divided by 4 = revenue per FTE per quarter $ 25,609
Multiply by 200 open positions with average time of 1 quarter to fill
Results in revenue loss of $5,121,800 per quarter
Revenue Factor Source: Saratoga Institute 2000 Benchmark Data
Revenue Factor measures the dollars of revenuegenerated per FTE annually (productivity measure)
Reducing Time to Start Can Increase Revenue

Saratoga
Human Capital Data Management
SupportWorkforce Planning Acquisition Retention
Evaluate the Effect
Development

Saratoga
Human Resource Data Points
Cost
Time
Quantity
Quality
Reaction
Staffing
Time to Fill Cost/Trainee Hr Turnover by LOS
Mgr Satisfac. Trainee Response Turnover Reason
No. Hired No. Trained Turnover Rate
Hire Rating Skills Attained Readiness
Cost / Hire Cost / Trainee Cost / Turnover
Developing Retaining
Saratoga
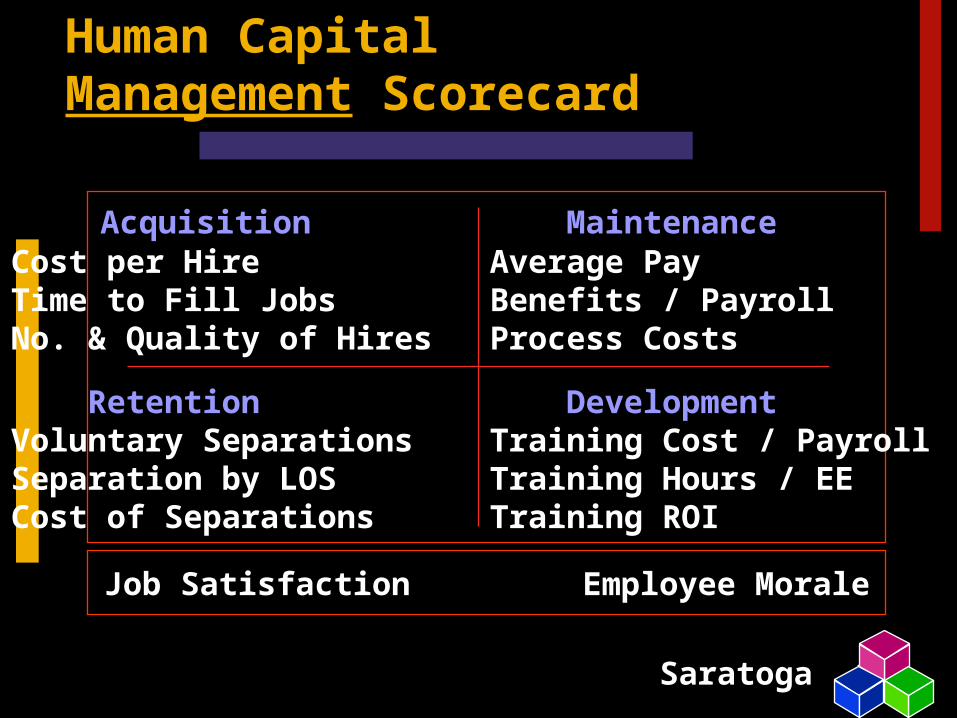
Human Capital Management Scorecard
Acquisition MaintenanceCost per Hire Average PayTime to Fill Jobs Benefits / PayrollNo. & Quality of Hires Process Costs
Retention DevelopmentVoluntary Separations Training Cost / PayrollSeparation by LOS Training Hours / EECost of Separations Training ROI
Job Satisfaction Employee Morale
Saratoga
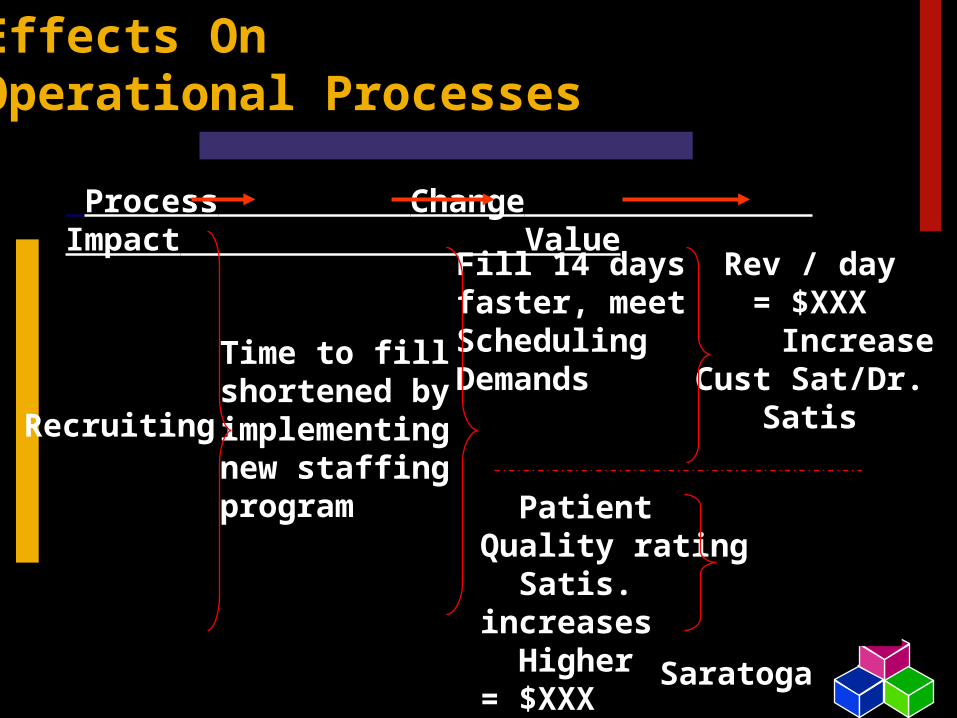
Effects On Operational Processes
Process Change Impact Value
Patient Quality rating Satis. increases Higher = $XXX
Recruiting
Time to fillshortened byimplementingnew staffingprogram
Fill 14 daysfaster, meet Scheduling Demands
Rev / day= $XXX
Increase Cust Sat/Dr.
Satis
Saratoga
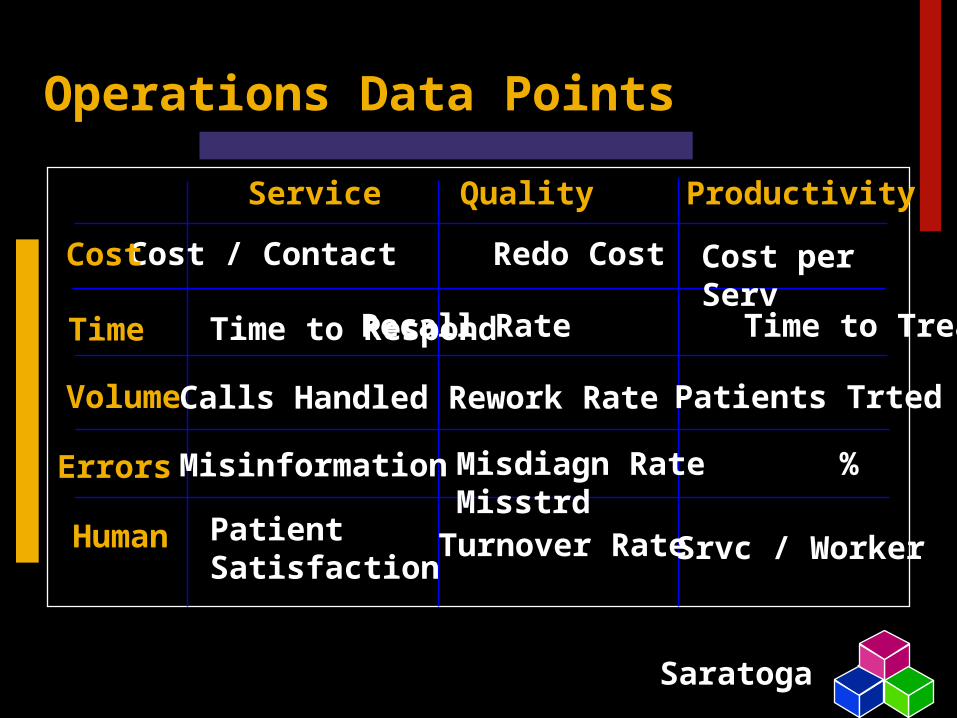
Operations Data Points
Service Quality Productivity
Cost per Serv
Time to Respond
Patients Trted
Misdiagn Rate % Misstrd
PatientSatisfaction
Cost / Contact Redo Cost
Recall Rate Time to Treat
Calls Handled
Misinformation
Turnover Rate Srvc / Worker
Rework Rate
Time
Errors
Human
Volume
Cost
Saratoga
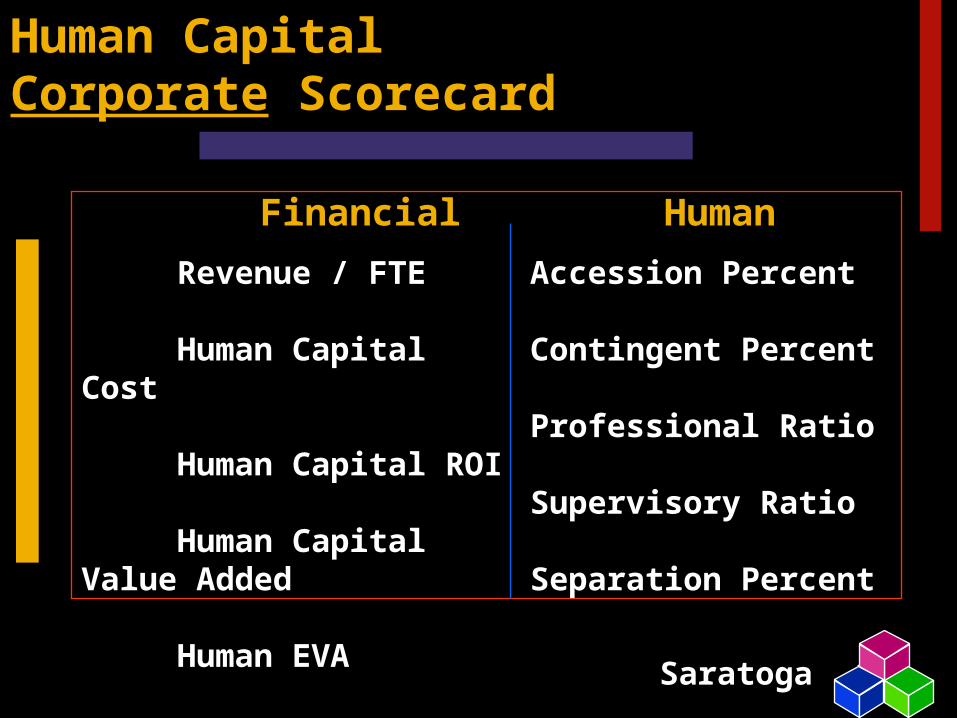
Human Capital Corporate Scorecard
Financial
Revenue / FTE
Human Capital Cost
Human Capital ROI
Human Capital Value Added
Human EVA
Human
Accession Percent
Contingent Percent
Professional Ratio
Supervisory Ratio
Separation Percent

Saratoga
“If you don’t measure
your results,
Robert GalvinRetired Chairman
Motorola
you’re only practicing.”
Saratoga
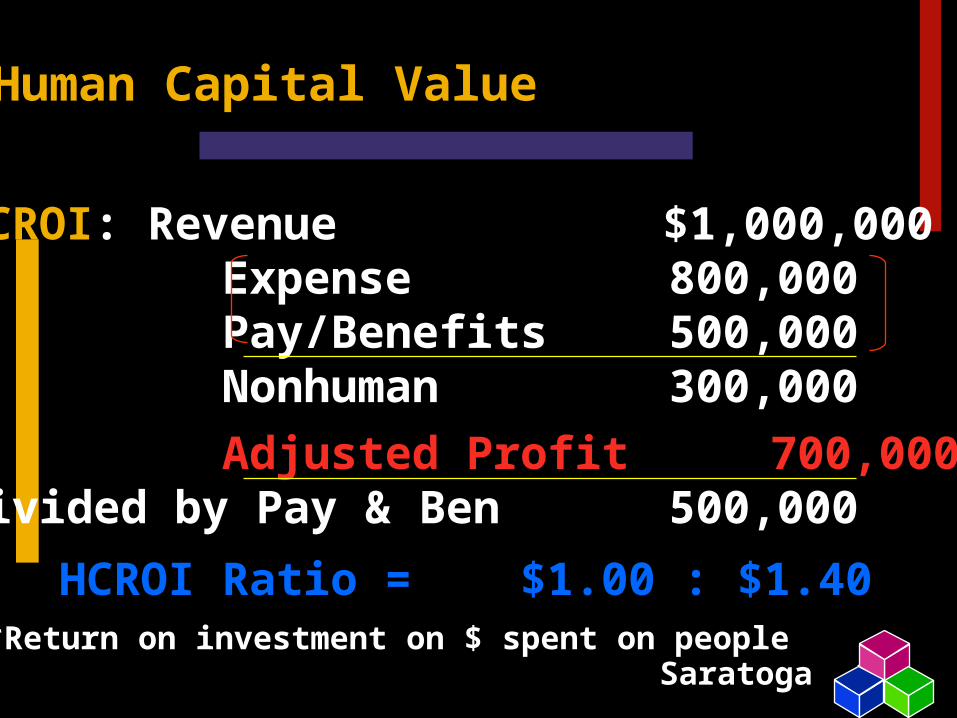
Human Capital Value
HCROI: Revenue $1,000,000 Expense 800,000 Pay/Benefits 500,000 Nonhuman 300,000
Adjusted Profit 700,000Divided by Pay & Ben 500,000
HCROI Ratio = $1.00 : $1.40 *Return on investment on $ spent on people
Saratoga
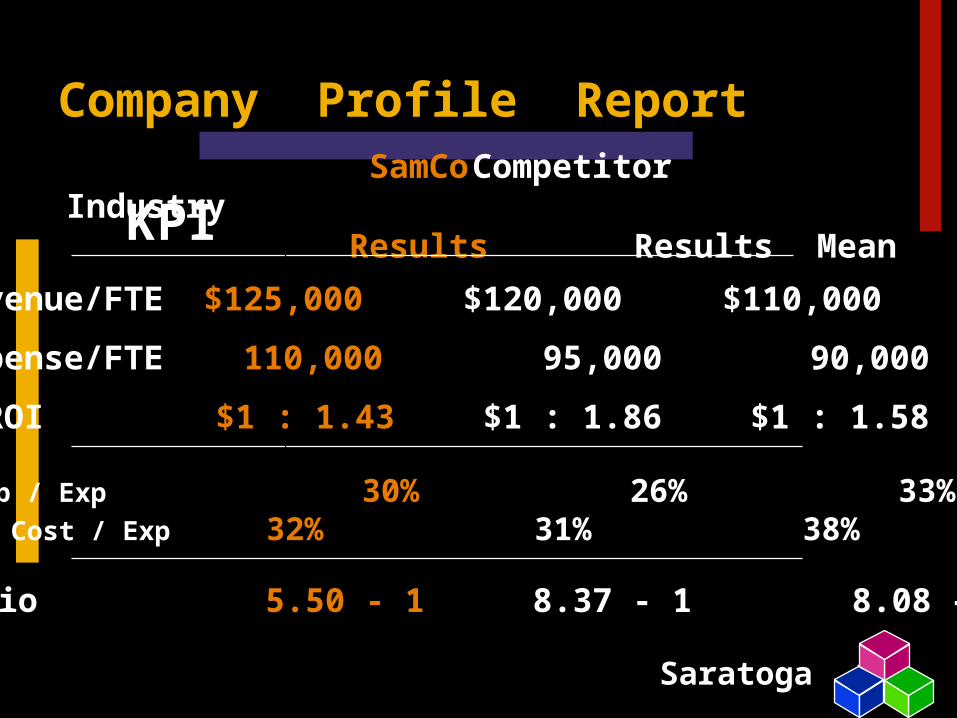
Company Profile Report SamCo Competitor
Industry Results Results MeanKPI
Revenue/FTE $125,000 $120,000 $110,000
Expense/FTE 110,000 95,000 90,000
HCROI $1 : 1.43 $1 : 1.86 $1 : 1.58
Ttl Comp / Exp 30% 26% 33%Ttl Lbr Cost / Exp 32% 31% 38%
Mgt Ratio 5.50 - 1 8.37 - 1 8.08 – 1

Saratoga
Hire / Retention Report SamCo Competitor
Industry Results Results Mean
KPI Hire Rate 17.1% 11.6% 18.4% Add (Grow) 2.8 5.5 8.3 Replace 14.3 6.1 10.1
CPH - EX $8,573 $9,847 $9,010Fill Time - EX 38 68 65
T/O - EX 7.5% 3.6% 6.6%
Training Comp 1.12% 1.45% 1.86%HR Investment 0.39% 0.85% 0.68%Less time and $ spent on Human Capital side of the org.
Saratoga
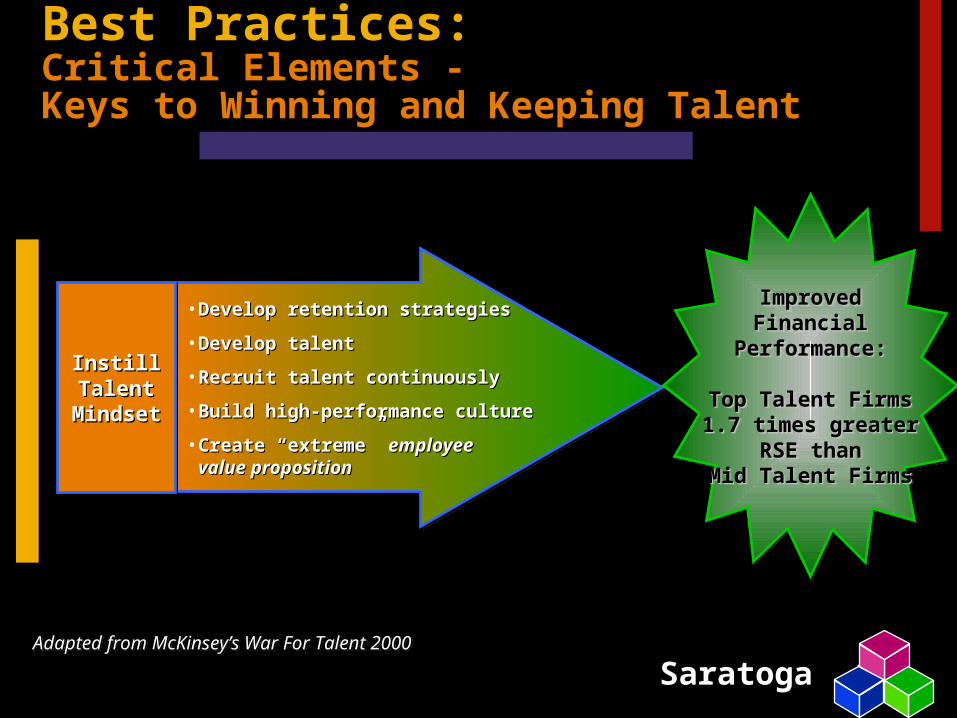
Best Practices: Critical Elements -Keys to Winning and Keeping Talent
• Develop retention strategiesDevelop retention strategies
• Develop talentDevelop talent
• Recruit talent continuouslyRecruit talent continuously
• Build high-performance cultureBuild high-performance culture
• Create “extreme” Create “extreme” employeeemployeevalue propositionvalue proposition
• Develop retention strategiesDevelop retention strategies
• Develop talentDevelop talent
• Recruit talent continuouslyRecruit talent continuously
• Build high-performance cultureBuild high-performance culture
• Create “extreme” Create “extreme” employeeemployeevalue propositionvalue proposition
Adapted from McKinsey’s War For Talent 2000Adapted from McKinsey’s War For Talent 2000
InstillInstillTalentTalent
MindsetMindset
InstillInstillTalentTalent
MindsetMindset
ImprovedImprovedFinancialFinancial
Performance:Performance:
Top Talent FirmsTop Talent Firms1.7 times greater1.7 times greater
RSE thanRSE thanMid Talent FirmsMid Talent Firms
ImprovedImprovedFinancialFinancial
Performance:Performance:
Top Talent FirmsTop Talent Firms1.7 times greater1.7 times greater
RSE thanRSE thanMid Talent FirmsMid Talent Firms

Saratoga
Employee Dissatisfaction
Voluntary Terminations*
Compensation 19%Supervision16%Opportunity 12%Leadership12%
* 14,180 interviews from 50 companies in 2000

Saratoga
Revenue & Expense Headcount & FTEs HR Department Cost & FTE Ratio Compensation Cost Management Benefits Cost Management Staffing Costs - Time - Volume Separation Rates & Costs Training Costs & Volume Employee Values & Needs
Benchmark Database
Industry
Size
Region
Growth

Saratoga
What Successful Organizations Are Doing
– Retain Key Talent - Attract, Assimilate, Develop
– Effectively Manage Workforce Costs– Distinguish Between Core and Non-Core
Capabilities– Measure the Impact of Human Capital – Implement Efficient Technology Solutions– Foster High Levels of Employee Commitment

Saratoga
Saratoga’s Value PropositionV
alu
e
Time
Assessment
Execution
Strategy
Intelligence
Information
Data

Saratoga
If you measure it, you can understand it.
If you understand it, you can improve it.