sas based analytics for electric utilities in...
TRANSCRIPT
Company Confidential - For Internal Use Only
Copyright © 2012, SAS Insti tute Inc. Al l r ights reserved.
SAS BASED ANALYTICS FOR ELECTRIC
UTILITIES IN INDIA
GEO SMART INDIA, 3RD MARCH
Company Confidential - For Internal Use Only
Copyright © 2012, SAS Insti tute Inc. Al l r ights reserved.
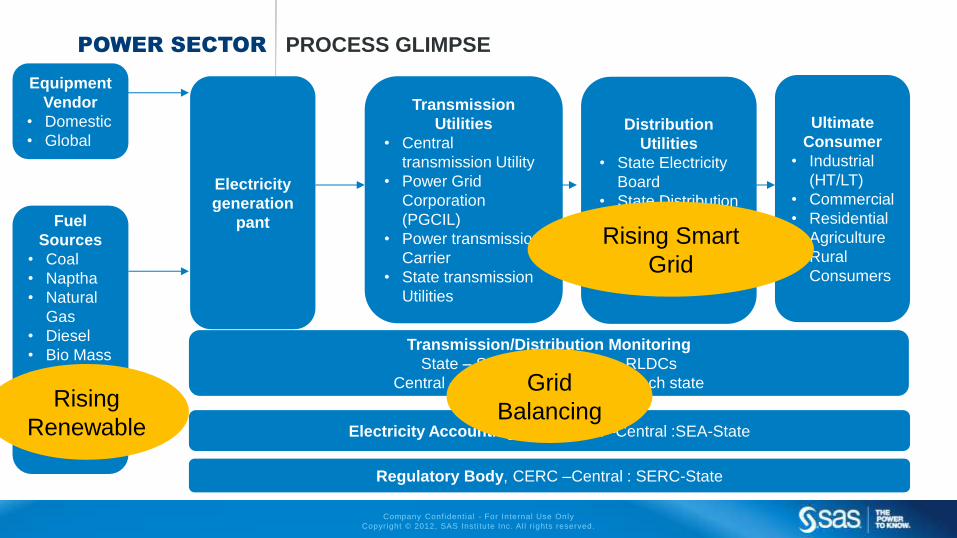
POWER SECTOR PROCESS GLIMPSE
Fuel
Sources
• Coal
• Naptha
• Natural
Gas
• Diesel
• Bio Mass
• Hydro
• Wind
• Solar
Electricity
generation
pant
Equipment
Vendor
• Domestic
• Global
Transmission
Utilities
• Central
transmission Utility
• Power Grid
Corporation
(PGCIL)
• Power transmission
Carrier
• State transmission
Utilities
Distribution
Utilities
• State Electricity
Board
• State Distribution
Utility
• Private
Distribution
Utility
Ultimate
Consumer
• Industrial
(HT/LT)
• Commercial
• Residential
• Agriculture
• Rural
Consumers
Regulatory Body, CERC –Central : SERC-State
Electricity Accounting Body ,CEA –Central :SEA-State
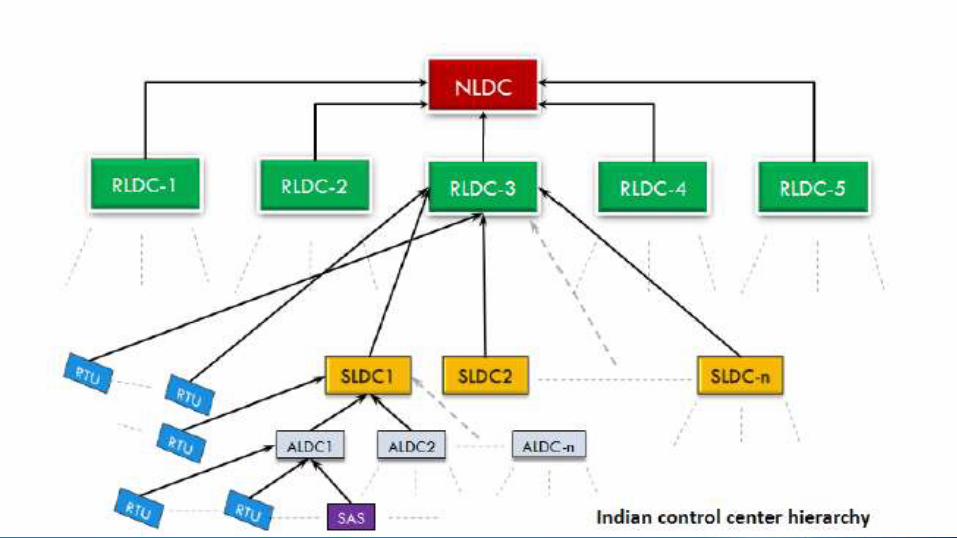
Transmission/Distribution Monitoring
State – SLDC , Regional 5 – RLDCs
Central -1 NLDC, local ALDC for each state Rising
Renewable
Rising Smart
Grid
Grid
Balancing
Company Confidential - For Internal Use Only
Copyright © 2012, SAS Insti tute Inc. Al l r ights reserved.
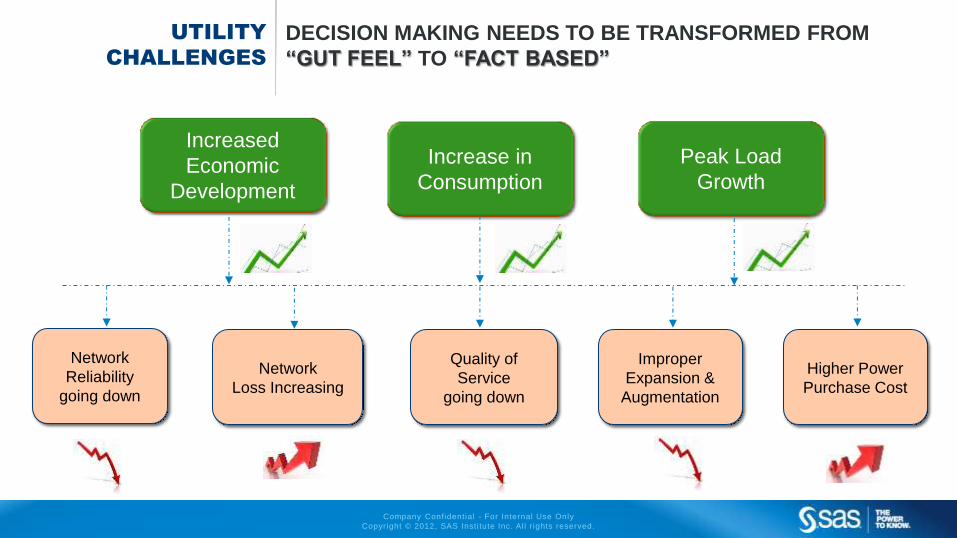
UTILITY
CHALLENGES
DECISION MAKING NEEDS TO BE TRANSFORMED FROM
“GUT FEEL” TO “FACT BASED”
Increase in
Consumption
Peak Load
Growth
Network
Reliability
going down
Network
Loss Increasing
Quality of
Service
going down
Improper
Expansion &
Augmentation
Increased
Economic
Development
Higher Power
Purchase Cost
Company Confidential - For Internal Use Only
Copyright © 2012, SAS Insti tute Inc. Al l r ights reserved.
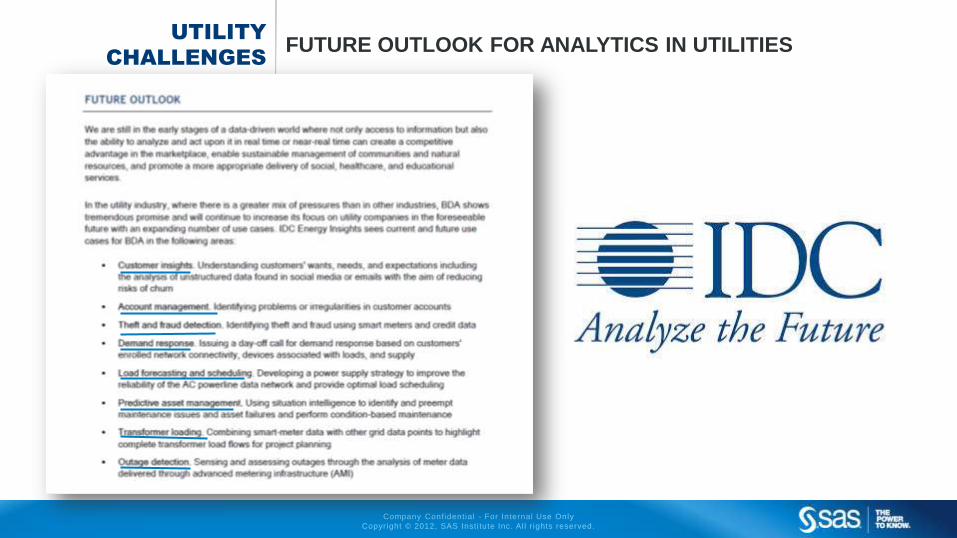
UTILITY
CHALLENGES FUTURE OUTLOOK FOR ANALYTICS IN UTILITIES
Company Confidential - For Internal Use Only
Copyright © 2012, SAS Insti tute Inc. Al l r ights reserved.
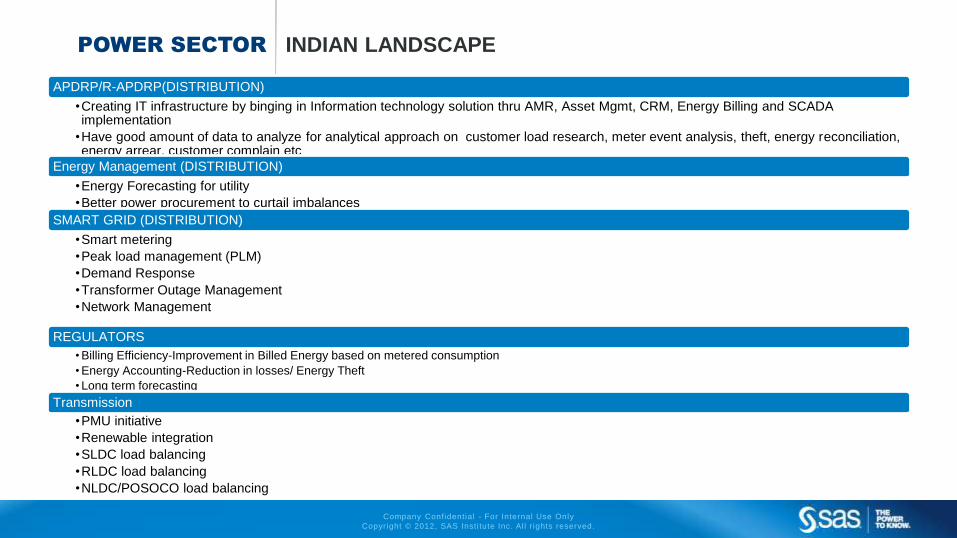
POWER SECTOR INDIAN LANDSCAPE
APDRP/R-APDRP(DISTRIBUTION)
•Creating IT infrastructure by binging in Information technology solution thru AMR, Asset Mgmt, CRM, Energy Billing and SCADA implementation
•Have good amount of data to analyze for analytical approach on customer load research, meter event analysis, theft, energy reconciliation, energy arrear, customer complain etc
Energy Management (DISTRIBUTION)
•Energy Forecasting for utility
•Better power procurement to curtail imbalances
SMART GRID (DISTRIBUTION)
•Smart metering
•Peak load management (PLM)
•Demand Response
•Transformer Outage Management
•Network Management
REGULATORS
• Billing Efficiency-Improvement in Billed Energy based on metered consumption
• Energy Accounting-Reduction in losses/ Energy Theft
• Long term forecasting
Transmission
•PMU initiative
•Renewable integration
•SLDC load balancing
•RLDC load balancing
•NLDC/POSOCO load balancing
Company Confidential - For Internal Use Only
Copyright © 2012, SAS Insti tute Inc. Al l r ights reserved.
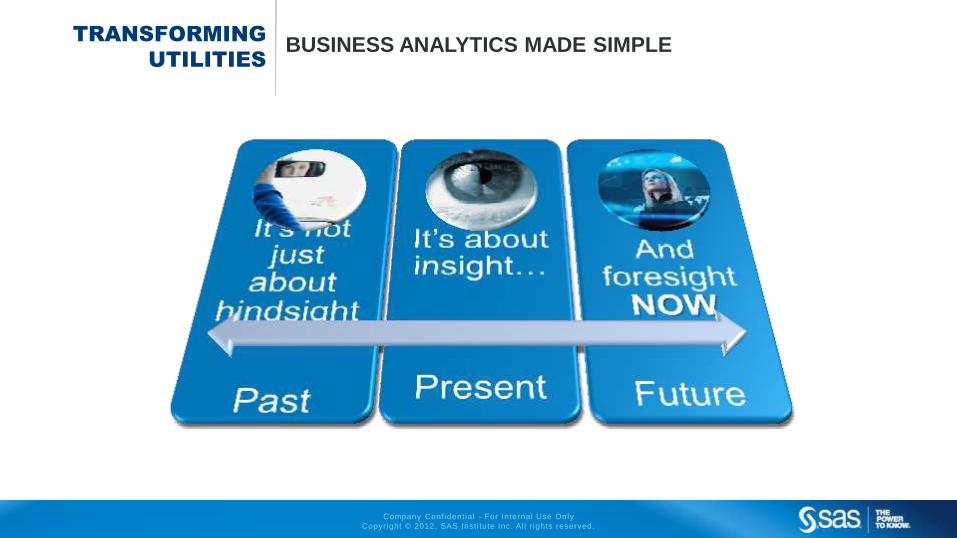
TRANSFORMING
UTILITIES
BUSINESS ANALYTICS MADE SIMPLE

Company Confidential - For Internal Use Only
Copyright © 2012, SAS Insti tute Inc. Al l r ights reserved. www.SAS.com
RAPDRP /IPDS & REGULATORS
Company Confidential - For Internal Use Only
Copyright © 2012, SAS Insti tute Inc. Al l r ights reserved.
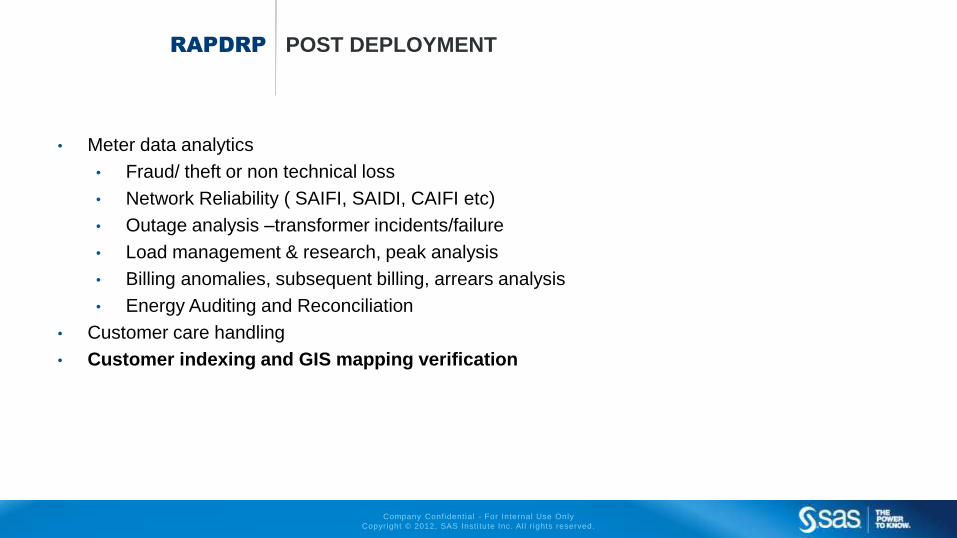
RAPDRP POST DEPLOYMENT
• Meter data analytics
• Fraud/ theft or non technical loss
• Network Reliability ( SAIFI, SAIDI, CAIFI etc)
• Outage analysis –transformer incidents/failure
• Load management & research, peak analysis
• Billing anomalies, subsequent billing, arrears analysis
• Energy Auditing and Reconciliation
• Customer care handling
• Customer indexing and GIS mapping verification
Company Confidential - For Internal Use Only
Copyright © 2012, SAS Insti tute Inc. Al l r ights reserved.
ENERGY MANAGEMENT
Company Confidential - For Internal Use Only
Copyright © 2012, SAS Insti tute Inc. Al l r ights reserved.
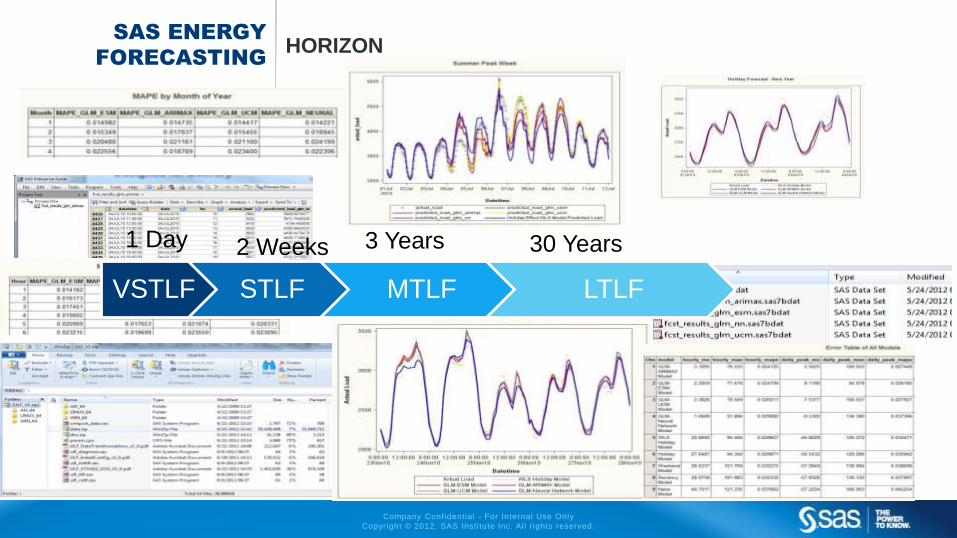
SAS ENERGY
FORECASTING HORIZON
VSTLF STLF MTLF LTLF
1 Day 2 Weeks 3 Years 30 Years
Company Confidential - For Internal Use Only
Copyright © 2012, SAS Insti tute Inc. Al l r ights reserved.
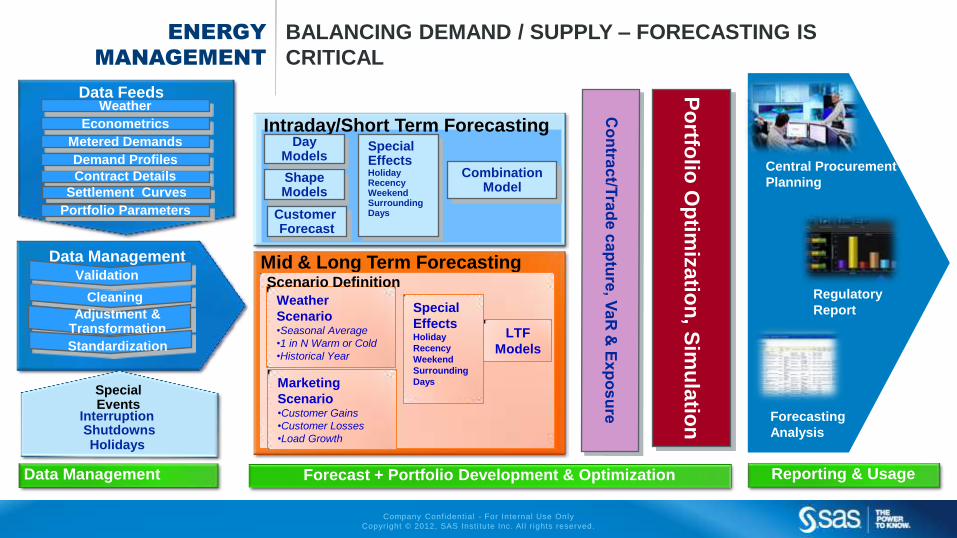
BALANCING DEMAND / SUPPLY – FORECASTING IS
CRITICAL
Data Management
Cleaning
Adjustment & Transformation
Validation
Standardization
Intraday/Short Term Forecasting
Shape Models
Day Models
Combination Model
Customer Forecast
Mid & Long Term Forecasting
Weather
Scenario •Seasonal Average
•1 in N Warm or Cold
•Historical Year
Marketing
Scenario •Customer Gains
•Customer Losses
•Load Growth
Scenario Definition
LTF
Models
Econometrics
Metered Demands
Weather
Contract Details
Demand Profiles
Data Feeds
Data Management
Po
rtfolio
Op
timiz
atio
n, S
imu
latio
n Shutdowns
Holidays
Interruption
Special Events
Settlement Curves
Forecast + Portfolio Development & Optimization Reporting & Usage
Special Effects Holiday Recency Weekend Surrounding Days
Portfolio Parameters
Special
Effects Holiday
Recency
Weekend
Surrounding
Days
ENERGY
MANAGEMENT
Central Procurement
Planning
Regulatory
Report
Forecasting
Analysis
Company Confidential - For Internal Use Only
Copyright © 2012, SAS Insti tute Inc. Al l r ights reserved.
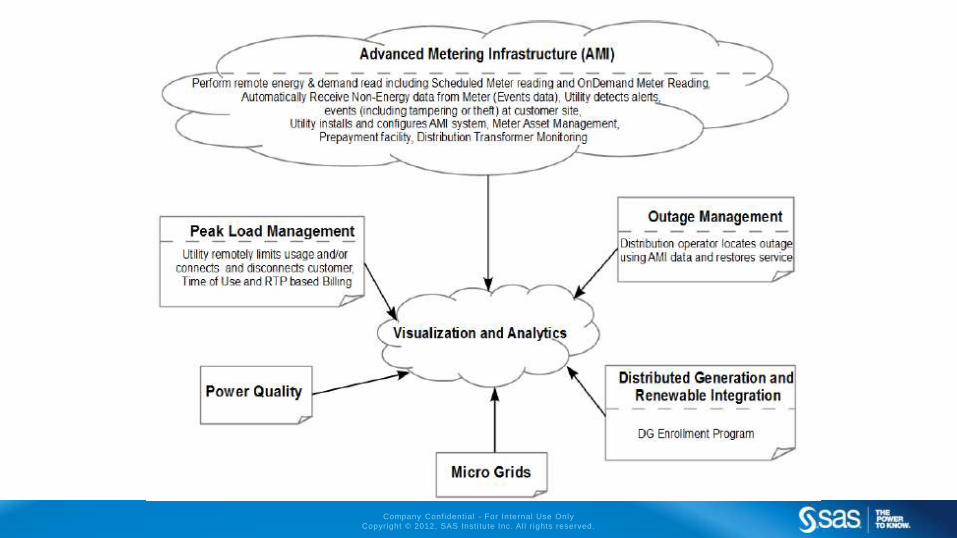
SMART GRID/AMI (ADVANCED METERING
INFRASTRUCTURE)
Company Confidential - For Internal Use Only
Copyright © 2012, SAS Insti tute Inc. Al l r ights reserved.
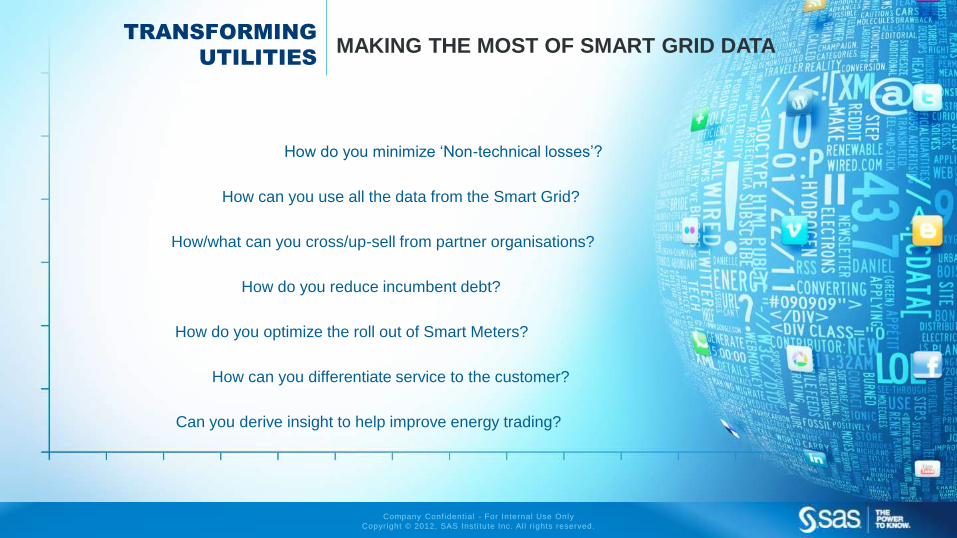
How do you optimize the roll out of Smart Meters?
How can you differentiate service to the customer?
How do you minimize ‘Non-technical losses’?
How can you use all the data from the Smart Grid?
How/what can you cross/up-sell from partner organisations?
How do you reduce incumbent debt?
Can you derive insight to help improve energy trading?
TRANSFORMING
UTILITIES MAKING THE MOST OF SMART GRID DATA
Company Confidential - For Internal Use Only
Copyright © 2012, SAS Insti tute Inc. Al l r ights reserved.
Company Confidential - For Internal Use Only
Copyright © 2012, SAS Insti tute Inc. Al l r ights reserved.
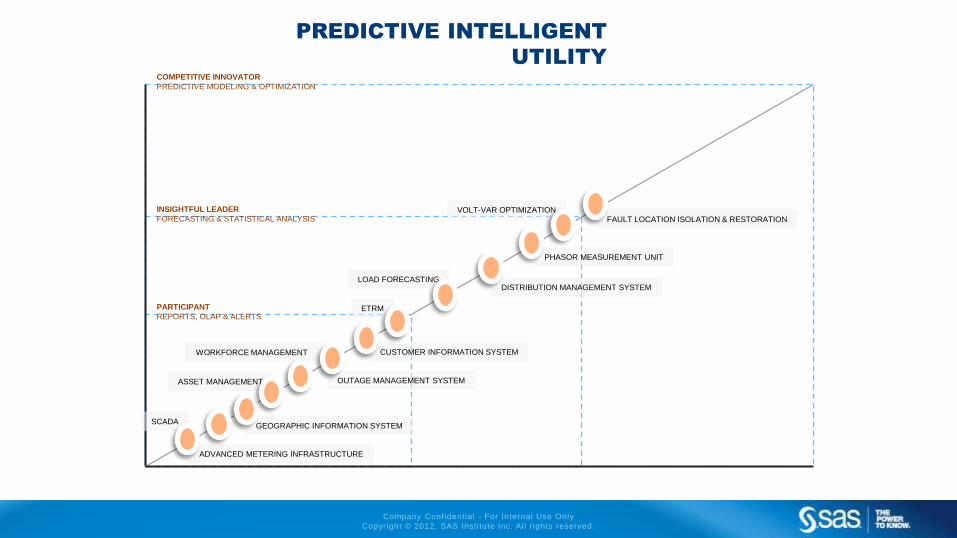
PREDICTIVE INTELLIGENT
UTILITY
ASSET MANAGEMENT
DISTRIBUTION MANAGEMENT SYSTEM
WORKFORCE MANAGEMENT CUSTOMER INFORMATION SYSTEM
PARTICIPANT
REPORTS, OLAP & ALERTS
INSIGHTFUL LEADER
FORECASTING & STATISTICAL ANALYSIS
COMPETITIVE INNOVATOR
PREDICTIVE MODELING & OPTIMIZATION
VOLT-VAR OPTIMIZATION
PHASOR MEASUREMENT UNIT
OUTAGE MANAGEMENT SYSTEM
GEOGRAPHIC INFORMATION SYSTEM SCADA
FAULT LOCATION ISOLATION & RESTORATION
ETRM
LOAD FORECASTING
ADVANCED METERING INFRASTRUCTURE
Company Confidential - For Internal Use Only
Copyright © 2012, SAS Insti tute Inc. Al l r ights reserved.
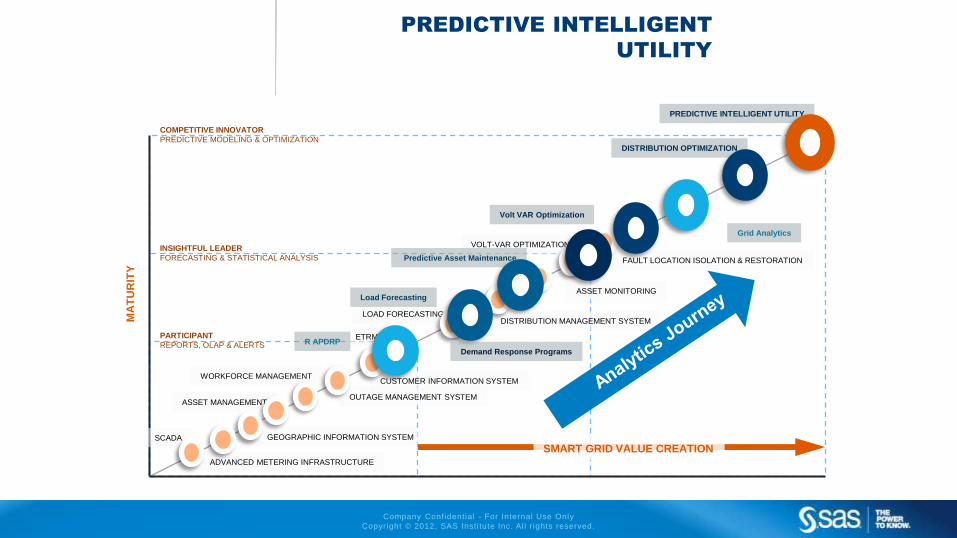
PREDICTIVE INTELLIGENT
UTILITY
ASSET MANAGEMENT
DISTRIBUTION MANAGEMENT SYSTEM
WORKFORCE MANAGEMENT CUSTOMER INFORMATION SYSTEM
PARTICIPANT
REPORTS, OLAP & ALERTS
INSIGHTFUL LEADER
FORECASTING & STATISTICAL ANALYSIS
COMPETITIVE INNOVATOR
PREDICTIVE MODELING & OPTIMIZATION
VOLT-VAR OPTIMIZATION
ASSET MONITORING
OUTAGE MANAGEMENT SYSTEM
GEOGRAPHIC INFORMATION SYSTEM SCADA
FAULT LOCATION ISOLATION & RESTORATION
ETRM
LOAD FORECASTING
ADVANCED METERING INFRASTRUCTURE
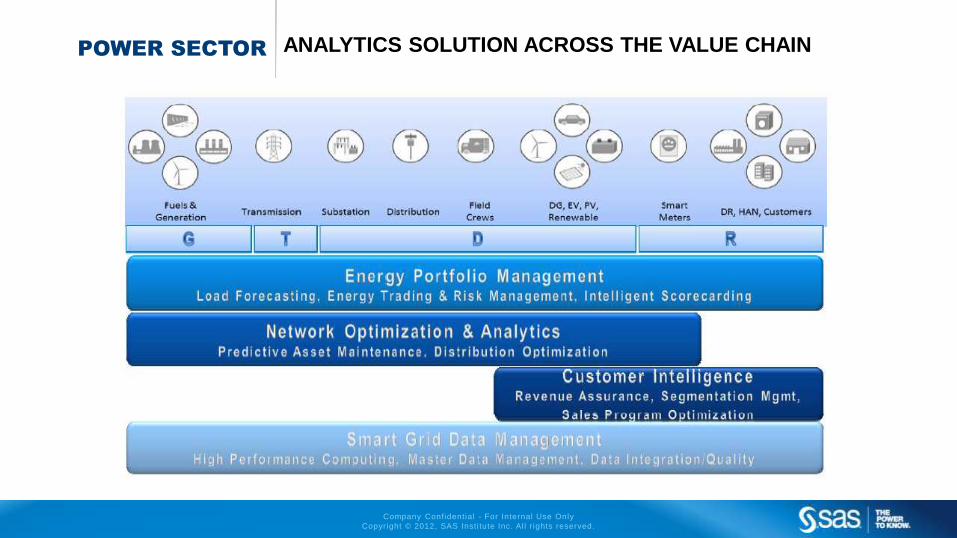
SMART GRID VALUE CREATION
Load Forecasting
DISTRIBUTION OPTIMIZATION
Predictive Asset Maintenance
Volt VAR Optimization
R APDRP
Grid Analytics
PREDICTIVE INTELLIGENT UTILITY
MA
TU
RIT
Y
Demand Response Programs
Company Confidential - For Internal Use Only
Copyright © 2012, SAS Insti tute Inc. Al l r ights reserved.
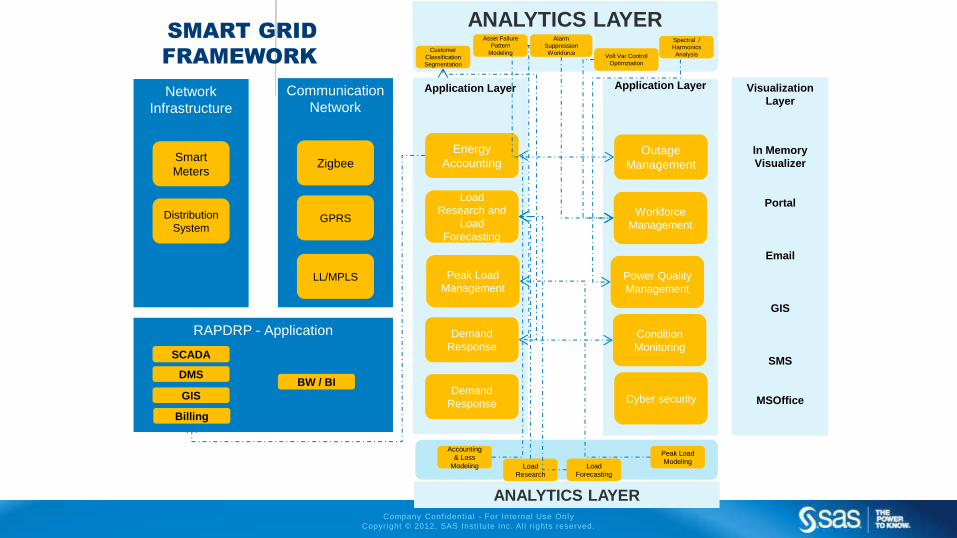
RAPDRP - Application
SMART GRID
FRAMEWORK
ANALYTICS LAYER
Network
Infrastructure
Smart
Meters
Distribution
System
DMS
Communication
Network
Zigbee
GPRS
LL/MPLS
Application Layer
Energy
Accounting
Load
Research and
Load
Forecasting
Demand
Response
Peak Load
Management
Application Layer
Outage
Management
Workforce
Management
Cyber security Demand
Response
SCADA
GIS
Billing
BW / BI
Power Quality
Management
Accounting
& Loss
Modeling Load
Research
Load
Forecasting
Peak Load
Modeling
Customer
Classification
Segmentation
Alarm
Suppression
Workforce Volt Var Control
Optimziation
Spectral /
Harmonics
Analysis
Condition
Monitoring
Visualization
Layer
In Memory
Visualizer
Portal
GIS
SMS
MSOffice
Asset Failure
Pattern
Modeling
ANALYTICS LAYER
Company Confidential - For Internal Use Only
Copyright © 2012, SAS Insti tute Inc. Al l r ights reserved.
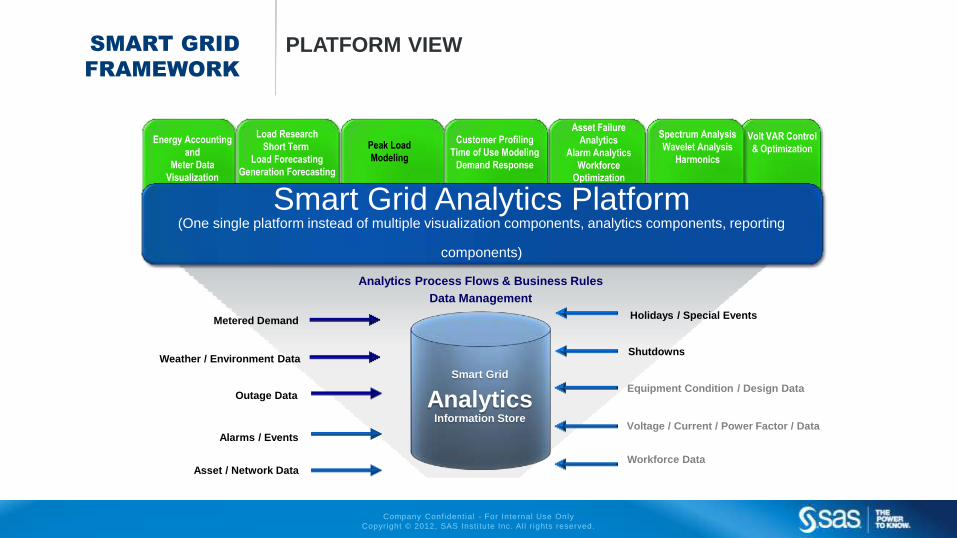
SMART GRID
FRAMEWORK
PLATFORM VIEW
Alarms / Events
Asset / Network Data
Outage Data
Metered Demand
Weather / Environment Data
Workforce Data
Holidays / Special Events
Equipment Condition / Design Data
Shutdowns
Smart Grid
Analytics Information Store
Voltage / Current / Power Factor / Data
Analytics Process Flows & Business Rules
Data Management
Asset Failure
Analytics
Alarm Analytics
Workforce
Optimization
Peak Load
Modeling
Energy Accounting
and
Meter Data
Visualization
Load Research
Short Term
Load Forecasting
Generation Forecasting
Customer Profiling
Time of Use Modeling
Demand Response
Smart Grid Analytics Platform (One single platform instead of multiple visualization components, analytics components, reporting
components)
Volt VAR Control
& Optimization
Spectrum Analysis
Wavelet Analysis
Harmonics
Company Confidential - For Internal Use Only
Copyright © 2012, SAS Insti tute Inc. Al l r ights reserved.
TRANSMISSION /RENEWABLE
Company Confidential - For Internal Use Only
Copyright © 2012, SAS Insti tute Inc. Al l r ights reserved.
Company Confidential - For Internal Use Only
Copyright © 2012, SAS Insti tute Inc. Al l r ights reserved.
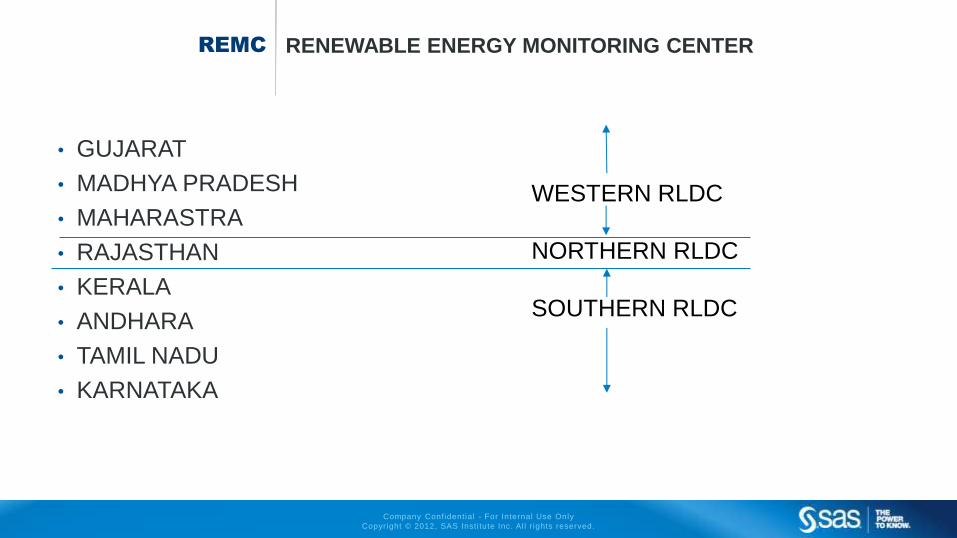
REMC RENEWABLE ENERGY MONITORING CENTER
• GUJARAT
• MADHYA PRADESH
• MAHARASTRA
• RAJASTHAN
• KERALA
• ANDHARA
• TAMIL NADU
• KARNATAKA
WESTERN RLDC
NORTHERN RLDC
SOUTHERN RLDC
Company Confidential - For Internal Use Only
Copyright © 2012, SAS Insti tute Inc. Al l r ights reserved.
Company Confidential - For Internal Use Only
Copyright © 2012, SAS Insti tute Inc. Al l r ights reserved.
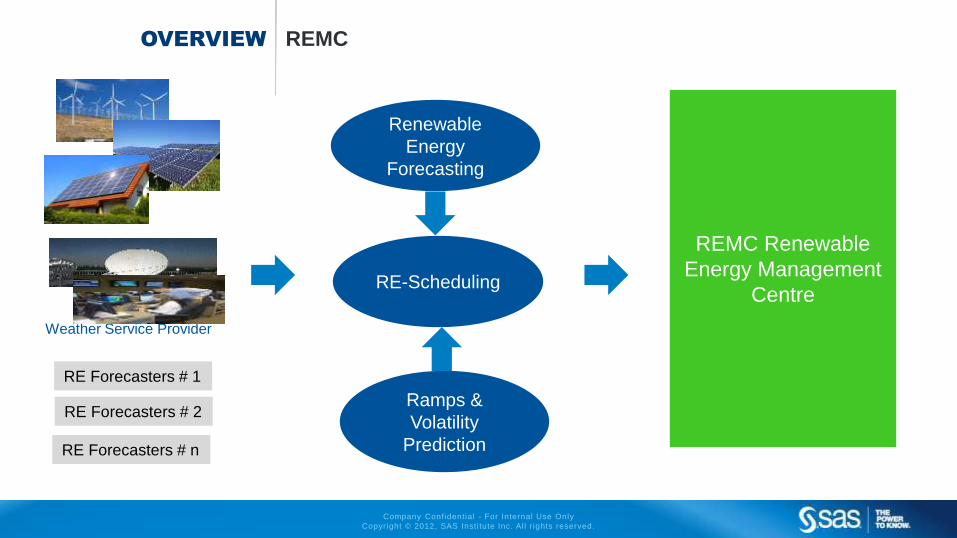
OVERVIEW REMC
Ramps &
Volatility
Prediction
Renewable
Energy
Forecasting
REMC Renewable
Energy Management
Centre
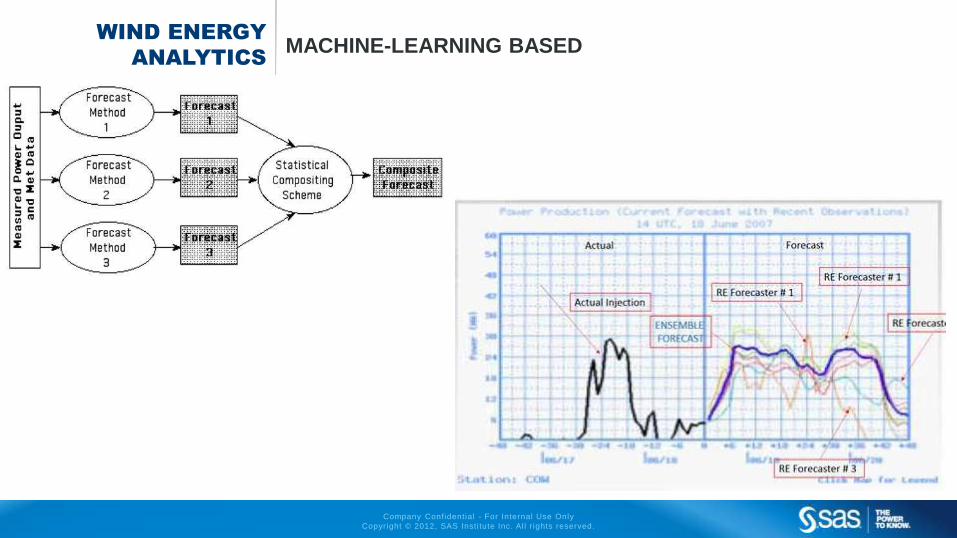
RE Forecasters # 1
RE Forecasters # 2
RE Forecasters # n
Weather Service Provider
RE-Scheduling
Company Confidential - For Internal Use Only
Copyright © 2012, SAS Insti tute Inc. Al l r ights reserved.
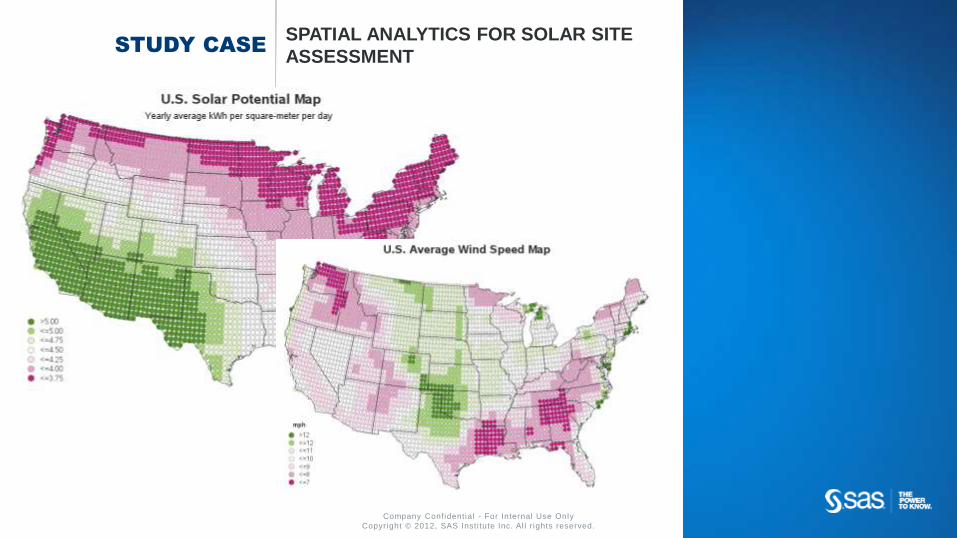
STUDY CASE SPATIAL ANALYTICS FOR SOLAR SITE
ASSESSMENT
Company Confidential - For Internal Use Only
Copyright © 2012, SAS Insti tute Inc. Al l r ights reserved.
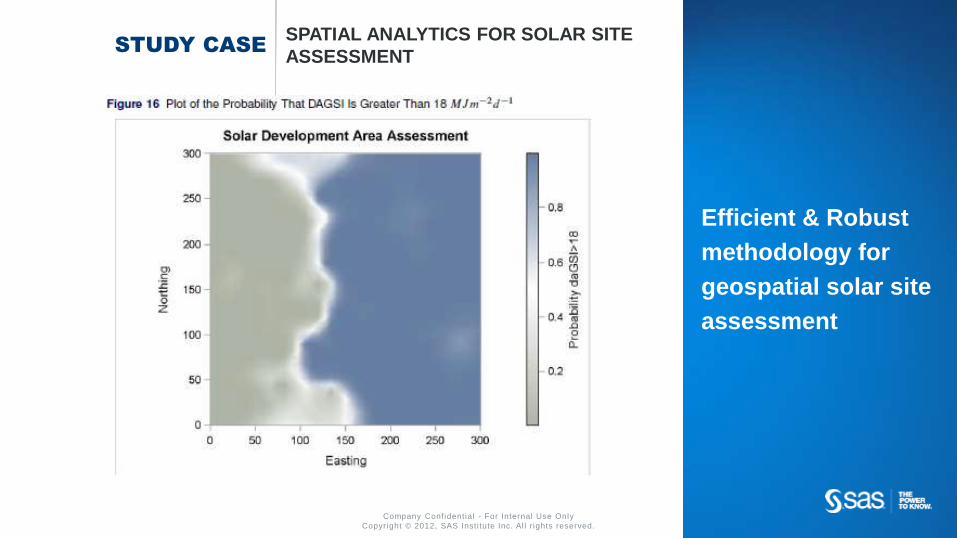
STUDY CASE SPATIAL ANALYTICS FOR SOLAR SITE
ASSESSMENT
Efficient & Robust
methodology for
geospatial solar site
assessment
Company Confidential - For Internal Use Only
Copyright © 2012, SAS Insti tute Inc. Al l r ights reserved.
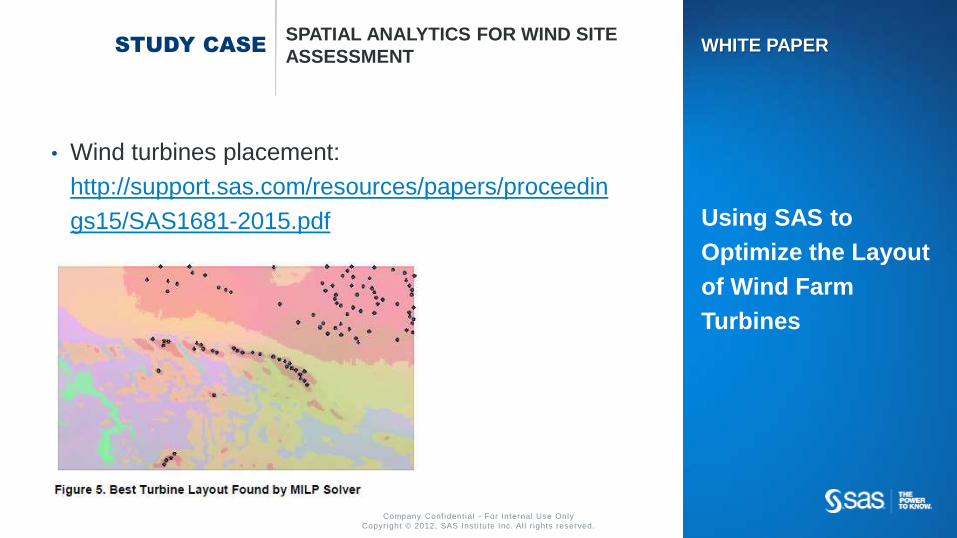
STUDY CASE SPATIAL ANALYTICS FOR WIND SITE
ASSESSMENT
• Wind turbines placement:
http://support.sas.com/resources/papers/proceedin
gs15/SAS1681-2015.pdf
WHITE PAPER
Using SAS to
Optimize the Layout
of Wind Farm
Turbines
Company Confidential - For Internal Use Only
Copyright © 2012, SAS Insti tute Inc. Al l r ights reserved.
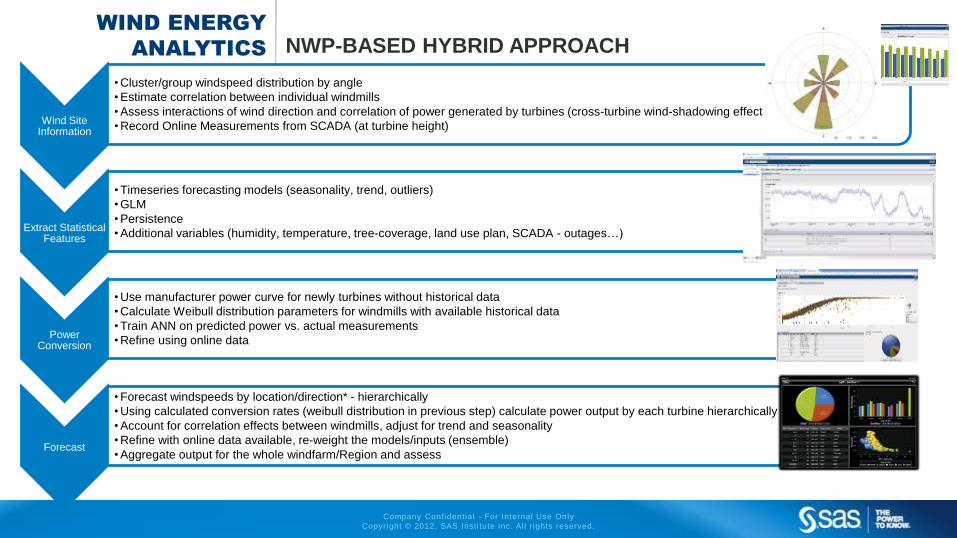
WIND ENERGY
ANALYTICS NWP-BASED HYBRID APPROACH
Wind Site Information
• Cluster/group windspeed distribution by angle
• Estimate correlation between individual windmills
• Assess interactions of wind direction and correlation of power generated by turbines (cross-turbine wind-shadowing effect
• Record Online Measurements from SCADA (at turbine height)
Extract Statistical Features
• Timeseries forecasting models (seasonality, trend, outliers)
• GLM
• Persistence
• Additional variables (humidity, temperature, tree-coverage, land use plan, SCADA - outages…)
Power Conversion
• Use manufacturer power curve for newly turbines without historical data
• Calculate Weibull distribution parameters for windmills with available historical data
• Train ANN on predicted power vs. actual measurements
• Refine using online data
Forecast
• Forecast windspeeds by location/direction* - hierarchically
• Using calculated conversion rates (weibull distribution in previous step) calculate power output by each turbine hierarchically
• Account for correlation effects between windmills, adjust for trend and seasonality
• Refine with online data available, re-weight the models/inputs (ensemble)
• Aggregate output for the whole windfarm/Region and assess
Company Confidential - For Internal Use Only
Copyright © 2012, SAS Insti tute Inc. Al l r ights reserved.
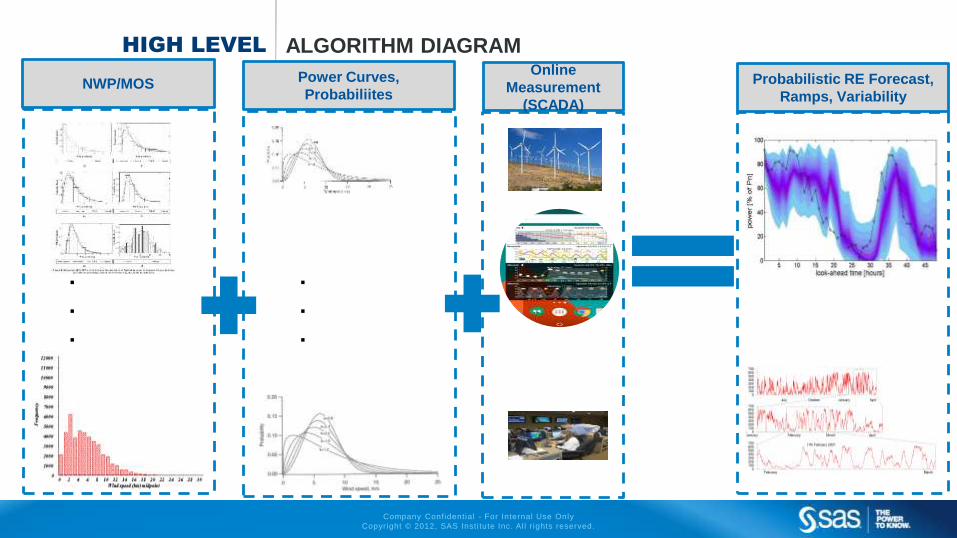
HIGH LEVEL ALGORITHM DIAGRAM
.
.
.
.
.
.
NWP/MOS Power Curves,
Probabiliites
Online
Measurement
(SCADA)
Probabilistic RE Forecast,
Ramps, Variability
Company Confidential - For Internal Use Only
Copyright © 2012, SAS Insti tute Inc. Al l r ights reserved.
WIND ENERGY
ANALYTICS MACHINE-LEARNING BASED
Company Confidential - For Internal Use Only
Copyright © 2012, SAS Insti tute Inc. Al l r ights reserved.
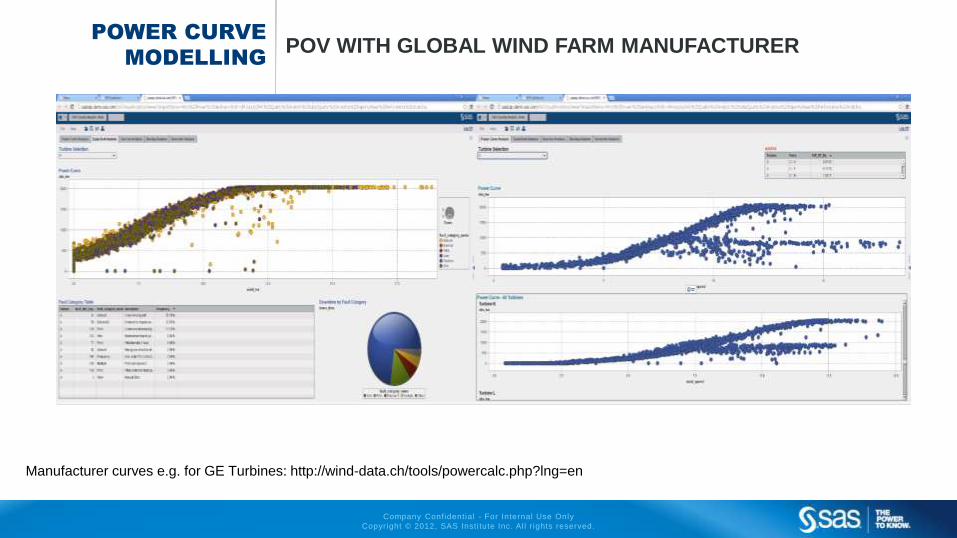
POWER CURVE
MODELLING POV WITH GLOBAL WIND FARM MANUFACTURER
Manufacturer curves e.g. for GE Turbines: http://wind-data.ch/tools/powercalc.php?lng=en
Company Confidential - For Internal Use Only
Copyright © 2012, SAS Insti tute Inc. Al l r ights reserved.
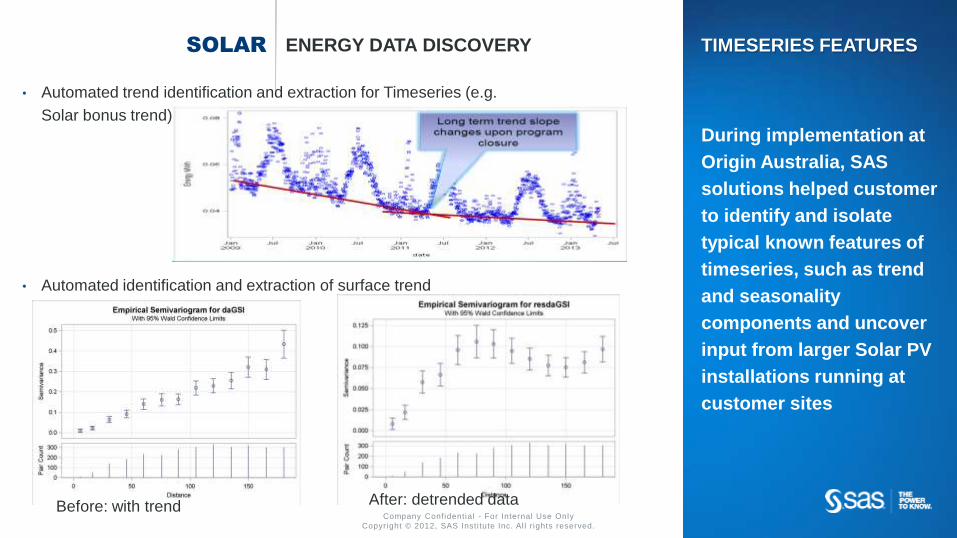
SOLAR ENERGY DATA DISCOVERY
• Automated trend identification and extraction for Timeseries (e.g.
Solar bonus trend)
TIMESERIES FEATURES
During implementation at
Origin Australia, SAS
solutions helped customer
to identify and isolate
typical known features of
timeseries, such as trend
and seasonality
components and uncover
input from larger Solar PV
installations running at
customer sites
• Automated identification and extraction of surface trend
Before: with trend After: detrended data
Company Confidential - For Internal Use Only
Copyright © 2012, SAS Insti tute Inc. Al l r ights reserved.
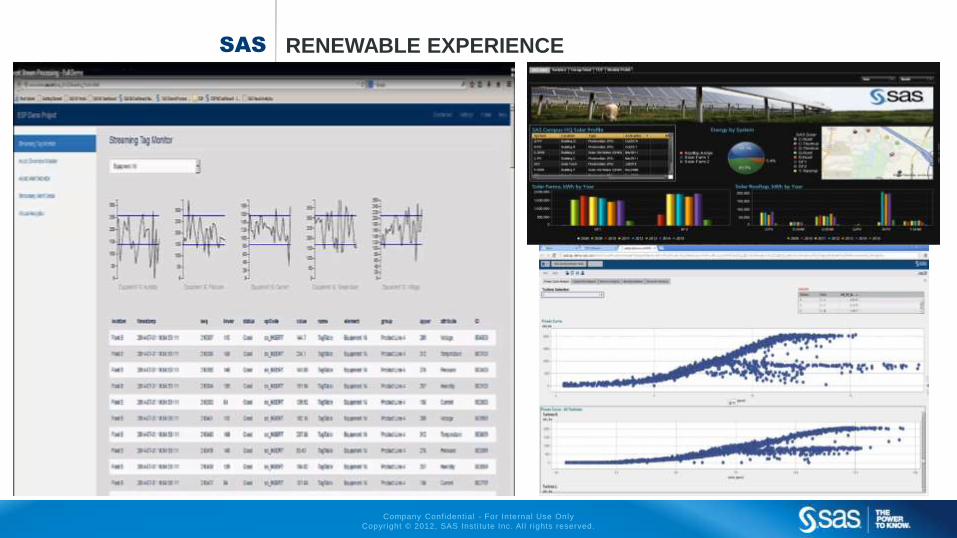
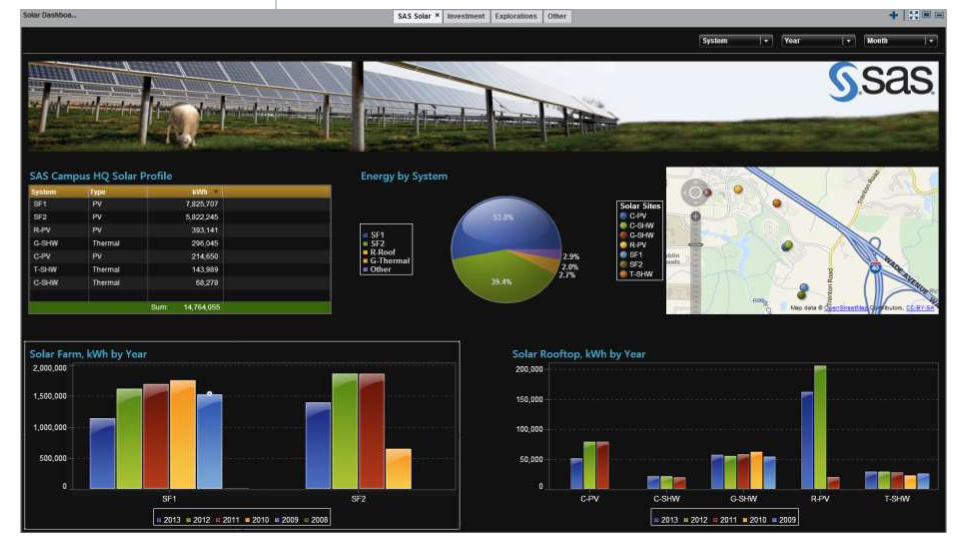
SAS RENEWABLE EXPERIENCE
Company Confidential - For Internal Use Only
Copyright © 2013, SAS Insti tute Inc. Al l r ights reserved.
Company Confidential - For Internal Use Only
Copyright © 2012, SAS Insti tute Inc. Al l r ights reserved.
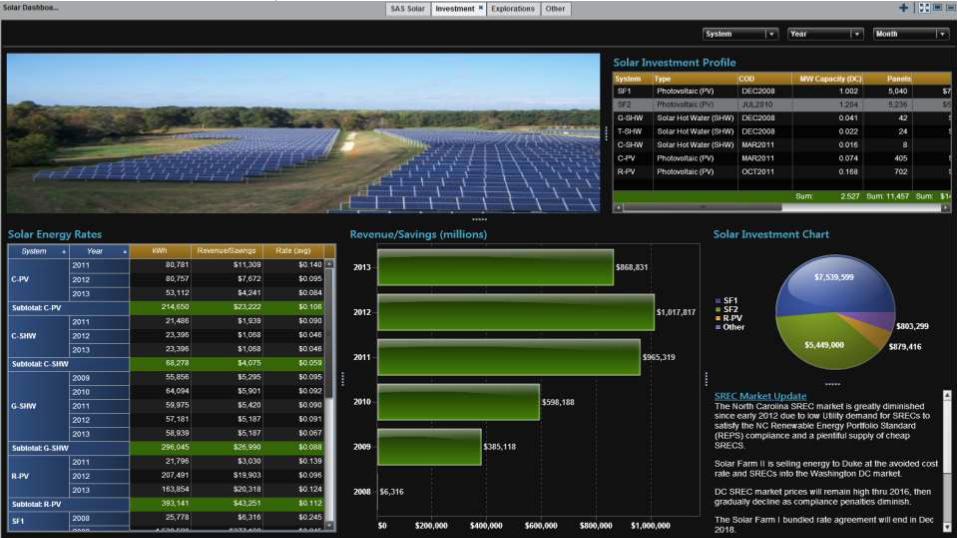
NCBSN SOLAR DASHBOARDS
Company Confidential - For Internal Use Only
Copyright © 2012, SAS Insti tute Inc. Al l r ights reserved. www.SAS.com
HOW DO WE SERVICE UTILITY
Company Confidential - For Internal Use Only
Copyright © 2012, SAS Insti tute Inc. Al l r ights reserved.
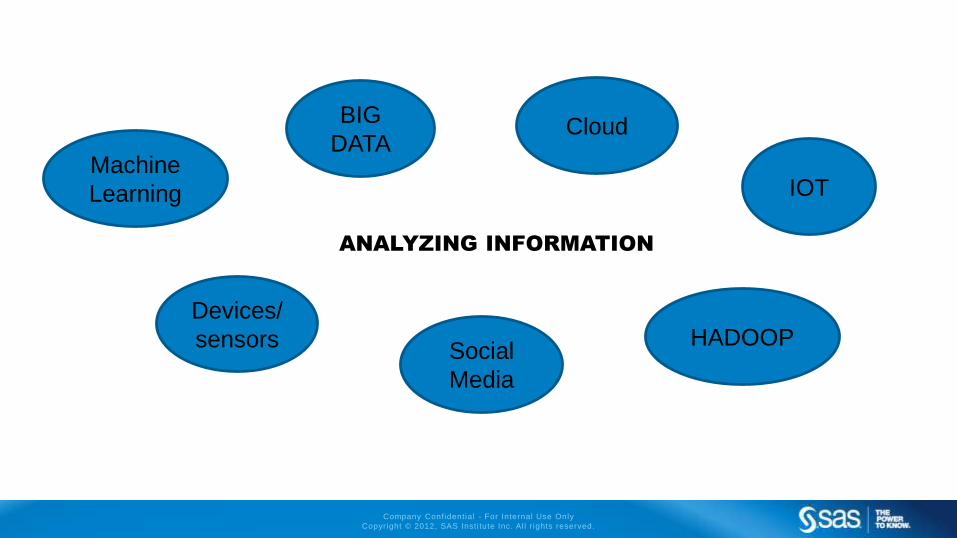
ANALYZING INFORMATION
IOT
BIG
DATA Machine
Learning
HADOOP Social
Media
Devices/
sensors
Cloud
Company Confidential - For Internal Use Only
Copyright © 2012, SAS Insti tute Inc. Al l r ights reserved.
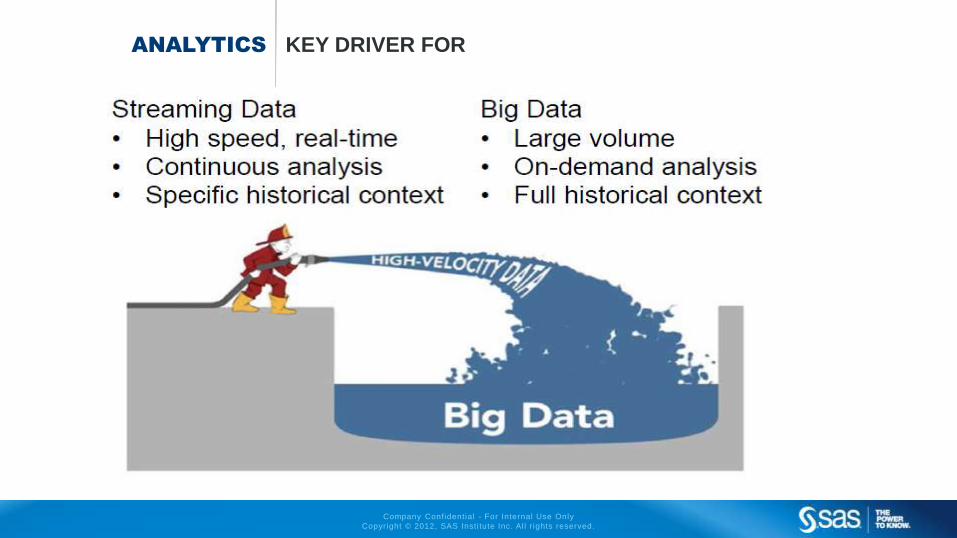
ANALYTICS KEY DRIVER FOR
Company Confidential - For Internal Use Only
Copyright © 2012, SAS Insti tute Inc. Al l r ights reserved.
POWER SECTOR ANALYTICS SOLUTION ACROSS THE VALUE CHAIN
Company Confidential - For Internal Use Only
Copyright © 2012, SAS Insti tute Inc. Al l r ights reserved.
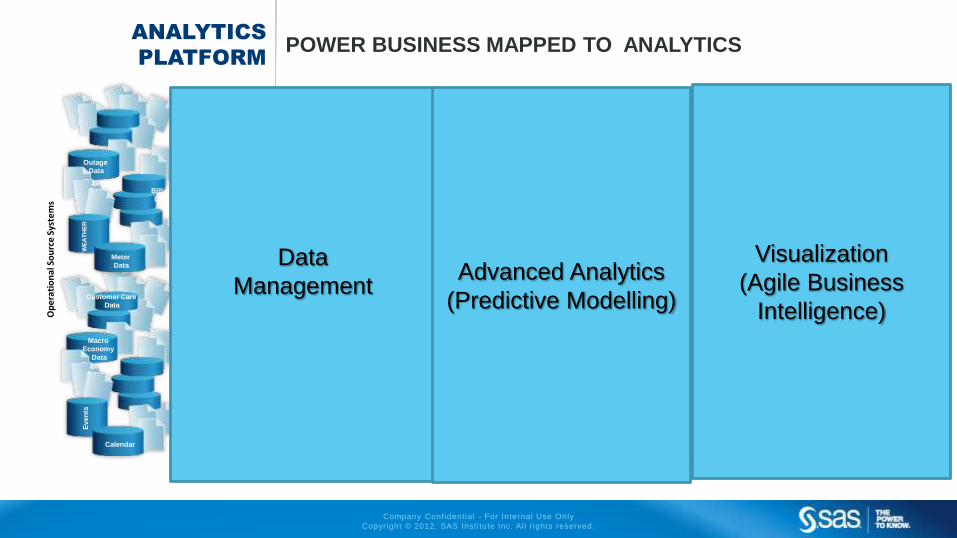
POWER BUSINESS MAPPED TO ANALYTICS ANALYTICS
PLATFORM
ORGANIZE STORE
Data Management
Data Management
Capabilities in SAS
Interactive data
integration development
environment
Connectivity and data
access
Data Quality, de-
duplication, cleansing
and enrichment
Extraction ,
Transformation and
Loading
Data profiling
An
aly
tical
Data
Mart
Bu
ilt
for
pu
rpo
se p
roje
ct
data
mart
s
1
Op
era
tio
nal
So
urc
e S
yste
ms
Calendar
Ev
en
ts
WE
AT
HE
R
Macro
Economy
Data
Meter
Data
Outage
Data
Sta
gin
g A
rea
SAS/ ACCESS
Software
SAS/ ACCESS
Software
ACCESS
Visualization Layer 3
VISUALIZE AND REPORT
Data Visualization capabilities include
Reliability & Outage Performance
Metrics
Peak Load Metrics / Forecasting /
Energy Savings Dashboard
Peak Season
Performance Forecast Accuracy
Dashboard
Investment Scenario
Ad Hoc dashboard
development
Ad Hoc data
exploration Data quality checks
Power Purchase Cost Dashboard
Savings optimization
Loss Reports
Advanced Analytics
SA
S M
eta
da
ta T
ier
- G
ive
s S
ecu
rity
/ A
uth
en
tica
tio
n/ A
uth
ori
za
tio
n/ A
ud
ita
bility
Advanced modeling, and forecasting
capabilities
Power
Purchase
Optimization
Peak Load
Management
/ Demand
Response
Exp
lora
tio
n a
nd
Sta
tisti
cal
An
aly
sis
Fo
recasti
ng
& D
ata
Min
ing
Seg
men
tati
on
/ C
lassif
icati
on
Ris
k A
naly
sis
Reliability
Analysis
ANALYZE, MODEL AND FORECAST
2
SAS Distribution Planning and Optimization Platform
Non
Technical
Loss
Billing
Data
Investigation / Corrective and
Preventive Action Process
Case
Initiation Investigation
Reports
Field Details Action
Analysis
Customer Care
Data
Data
Management
Advanced Analytics
(Predictive Modelling)
Visualization
(Agile Business
Intelligence)
Company Confidential - For Internal Use Only
Copyright © 2012, SAS Insti tute Inc. Al l r ights reserved.
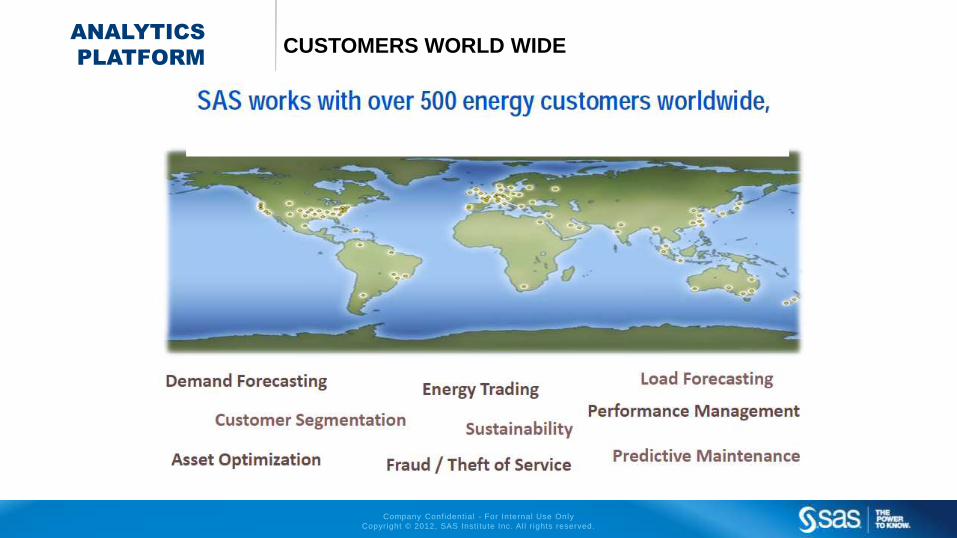
ANALYTICS
PLATFORM CUSTOMERS WORLD WIDE
Company Confidential - For Internal Use Only
Copyright © 2012, SAS Insti tute Inc. Al l r ights reserved.
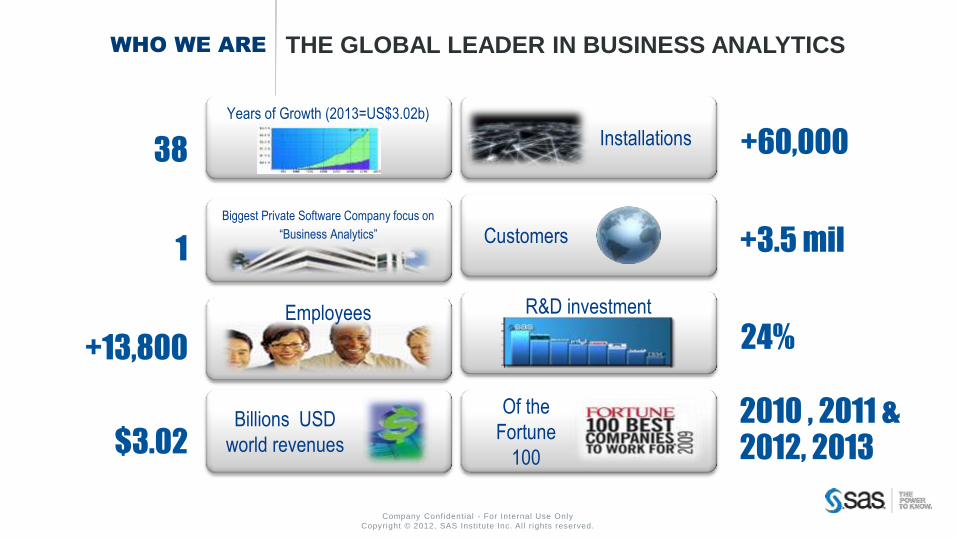
WHO WE ARE THE GLOBAL LEADER IN BUSINESS ANALYTICS
38
1
+13,800
$3.02
Years of Growth (2013=US$3.02b)
Billions USD
world revenues
+60,000
24%
+3.5 mil
Installations
R&D investment
Of the
Fortune
100
Customers
Employees
Biggest Private Software Company focus on
“Business Analytics”
2010 , 2011 &
2012, 2013