sasi savings round table rhodes university 26 may 2005 “a micro view” darrell beghin finmark...
TRANSCRIPT

SASISavings Round Table
Rhodes University26 May 2005
“A micro view”
Darrell BeghinFinMark Trust
FinScope & Financial Diaries
Making Financial Markets Work

Who and What ?
• Insights– consumer paradigms & realities– product consumption
• Questions & opportunities
Making Financial Markets Work

Consumer Realities - Income sources
12
2
2
4
5
8
9
9
9
17
30
0 10 20 30 40 50
Don't get money
Any other type of grant
Informal work
Other pension
Piece work
Government pension
Self-employed
Salary from an individual
Child grant
Salary from a company
Money from family
%
All 1%: Maintenance Private sale of goods Financial investments Gambling Lottery
On average, consumers claim to have only one source of income Almost one-third of the population obtains money from friends/family as their main source of income
Never banked 44%Black 32%
Currently banked 34%White 33%
Never banked 21%Coloured 14%
Average number of mentions: 1.1
(n=2988)

42
40
36
31
28
24
23
17
14
11
10
8
8
7
6
6
17
21
14
15
15
13
10
9
8
7
5
6
4
2
2
2
3
37
Theft, fire or destruction of property
Job loss of main wage-earner
Death of main wage-earner
Serious illness of member of household
Death of family member outside household
Illness so main wage-earner can't work
Flood destroying property
Death of partner
Drought
Stock/livestock theft
Increase in oil price
Loss of vehicle
Cut-off or decrease in payment to household
Abandonment/divorce
Loss of banking facilities
Loss of computer/laptop/cell phone/phone
None
Factors likely to impact finances Factors likely to happen
Consumer Realities - Household risks
After shelter, the next greatest threat is the loss of income from the main wage-earner of the household
Overall, there are many other concerns before loss of banking facilities becomes an issue
%(n=2 988)
Total sample
Factors likely to impact finances
32 43
34 40
35 35
24 31
N/A 27
21 23
18 24
N/A 17
10 14
8 11
N/A 11
6 8
9 7
6 7
4 6
3 6
29 17
2004 (n=2895)
%
2003 (n=2984)
%
26 2313 12 10 6 5 4 3 2 2
23
020406080
100
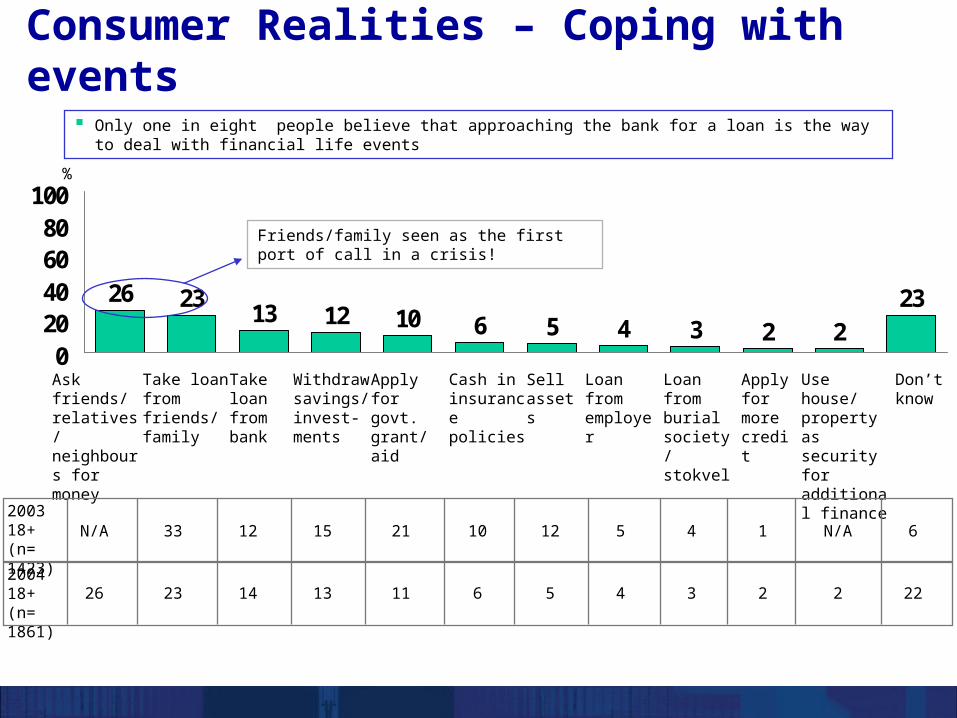
Consumer Realities – Coping with events
Only one in eight people believe that approaching the bank for a loan is the way to deal with financial life events
%
Friends/family seen as the first port of call in a crisis!
Ask friends/ relatives/ neighbours for money
Take loan from friends/ family
Take loan from bank
Withdraw savings/ invest-ments
Apply for govt. grant/ aid
Cash in insurance policies
Sell assets
Loan from employer
Loan from burial society/ stokvel
Apply for more credit
Use house/ property as security for additional finance
Don’t know
33 12 15 21 10 12 5 4 1 N/A 6N/A
23 14 13 11 6 5 4 3 2 226 22
2003 18+ (n= 1423)
2004 18+ (n= 1861)

Consumer Realities - Decision making16+ years
Don’t make these
decisions20%
Consultation with partner/
spouse33%
Decide alone25%
Consultation with other household members
22%
Source: Q34
Read: 25% of the total sample makes financial decisions on their own and 33% decide in consultation with a partner/spouse
58% of the population makes financial decisions on their own or in consultation with a partner/spouse - Financial decision-making increases with FSM tier - Also more prominent in white market and amongst banked segment
Non-decision making skews to younger consumers (75% of 16-17 year olds claim to make no household financial decisions) and to the never banked (36%)
Who are most likely to make decisions on their own or in consultation with partner/spouse?
Currently banked 73%Previously banked 61%Never banked 41%
Black 55%White 80%Coloured 56%Asian 63%
FSM 1 41%FSM 2 46%FSM 3 58%FSM 4 70%FSM 5 71%FSM 6 74%FSM 7 87%FSM 8 87%
(n=2988)

Consumer Realities- Perceptions re savings
10
19%
23%
31%
43%
47%
51%
55%
69%Save & invest regularly, small amounts mount
up and you'll be secure
You prefer to save where money is safe, evenif the interest rate/return is a little lower
You are worried that you won't have enoughmoney for old age
You don't trust informal associations likesavings clubs
You try to save regularly
You have a good idea of whatinvestment/returns you get on the money you
save
You go without basic things so that you cansave
You are saving for something specific
You move your money around, to get the mostgrowth

Consumer Realities - Savings psychographics
42%
47%
10%
86%
10% 4%
58%
31%
10%
54%
21%25%
19%
62%
19% 16%
43% 41%
46%
32%
22%
0%
10%
20%
30%
40%
50%
60%
70%
80%
90%
Agree Disagree Don't Know

Consumer Realities – Buying Triggers16+ years
55%
28%
5%
11%
1%
Ultimately, the monthly repayments are the deciding factor However, a quarter of FSM 8 claim that the interest rate must be the lowest possible Credit is not something that lower FSM groups really consider as an option
When deciding to purchase an item on credit, which one of the following is most important to you?
FSM 1 77%FSM 2 69%FSM 3 51%FSM 4 44%FSM 5 37%FSM 6 32%FSM 7 32%FSM 8 25%
Monthly payments must be affordable
Interest must be lowest available
Repayment period must be flexibleDon’t know
None of these – don’t purchase on credit
(n=2988)

Product Consumption - Ways of investing 16+ years
Overall low usage of mainstream investment instruments – bank savings accounts and burial societies dominate
2003 (18+)
(n=2984)
2004 (18+)
(n=2895)
39 39
24 21
N/A 10
9 7
N/A 6
5 6
4 4
N/A 5
3 3
4 33
3
4
4
5
6
7
9
20
37Savings a/c at bank
Burial society
Savings policy, endowment, insurance withinsurance company
Stokvel/savings club
Retirement annuities
Improving your home
PO savings account
Voluntary pension/Provident contributions
Starting a business
Buying or making goods to sell
%
50
Have now and use Never had
79
88
91
92
88
92
93
95
94
(n=2988)
Have now and use

60
16
15
6
5
5
4
2
2
4
Can't afford it
Don't want it
Never thought about it
Don't know about insurance
Don't believe in it
Someone else will pay
They make excuses not to pay out
Don't know how to find out where to buy it from
Don't know how to go about buying cover
Other
Product Consumption – No life insurance because…16+ years
Cost is the main obstacle to entry
Skew to lower FSMs 1-3
65% Black
69% Coloured
Skew to higher FSMs 43% FSM 8

One11%
Don't know5%
4-51%
2-39%
None74%
Stopped or cancelled
Product Consumption - Policy Cancellations16+ years
40
22
22
15
9
6
Could not afford it
Needed the cash
Policy matured
Found better interestoption
Retired
Other
Reasons
Black 22%
White 36%
Coloured 15%
Asian 31%
Three-quarters of consumers have not cancelled any policies – White and Asian skew Cancellations highest amongst FSM 8 – 38%
%
Highest for FSM 1-3 11% for FSM 8
36% for FSM 5 30% for FSM 6
34% for FSM 7 32% for FSM 8
29% for FSM 8

Product Consumption – Funeral/burial policies16+ years
One85%
Two-three13%
Four-five2%
One77%
Two-three20%
Four-five2%
Six or more1%
One86%
Two-three13%
Four-five1%
Funeral policy (individual) Funeral scheme (group) Burial society
Few differences between FSM tiers – differences occur in actual products rather than number of policies Slight tendency for FSM tier 8 to have multiple individual funeral policies

Product Consumption – Financial Services 16+ years
Almost half of the population does not utilise any product offering from any of the four categories - banking, retail, housing or loans
Tendency is to have just one product, which is typically a banking product
Banking only 25%
Retail only 3%
Housing only 0%
Loans only 2%
Banking, retail 13%
Banking, loans 4%
Banking, housing 1%
Banking, retail, loans 3%
Banking, housing, loans 2%
Banking, housing, retail cards
2%
Banking, housing, loans, retail
4%
42% do not have any service58% have a service
(n=2988)

Consumption & Reality meet in Lending 16+ years
13
6
5
4
4
70
0 20 40 60 80 100
Buy food
Pay school fees
Buy clothes
For funeral
Pay off debts
None
Black (n=1570)
36
34
12
9
8
37
0 20 40 60 80 100
Buy a house
Buy a car
Buy clothes
Pay off debts
Money to study
None
White (n=655)
17
8
5
5
5
60
0 20 40 60 80 100
Buy food
Pay off debts
Buy a house
Buy clothes
Pay for water or electricity
None
Coloured (n=559)
11
8
5
5
5
66
0 20 40 60 80 100
Buy a house
Buy clothes
Pay off debts
Repair/paint house
Buy a car
None
Asian (n=204)
%
%
%
%

Summary• Consumers are:
– Strapped for extra/enough cash, struggle and do without
– Concerned about death and loss of income & old age
– Not financially astute – consult friends and family– Varied in decision-making methods and using
improper triggers– Using savings for “credit vehicles” - save to pay for
living expenses – NOT asset acquisitions– Not all that smart about using credit – Using short term solutions and creating longer term
problems – e.g. forfeiting education to earn extra income
– Unable to save for unforeseen events – heavy impacts from extended family deaths
– Afraid to ask formally how instruments work– Not making the best use of available services

Summary
• Consumers:– Must be seen holistically – wallet split and
life stage– Cultural beliefs and aspects need to be
considered and managed– Also personal motivations– Need more income to move to “life asset”
savings activities– Should to switch from borrowing as
emergency first call to using savings – resource dependant
– Require education in money management – absence is reflected in “mis-spend” on informal & formal instruments
Summary
• Products:• Not well dispersed across the consumer market -formal
financial instruments are not as well used as stokvels at the low income end
• Stokvels tend to be used for a specific time or event
• Savings accounts are used as transaction accounts
• Formal products tend to be linked to formal employment e.g. provident funds
• Only 12% of the households seek a formal savings product without it being connected to their jobs
• Informal instruments provide a major social structure for consumers to interact with each other
• Money guarding is used as saving instrument but there is no accumulation of benefits
• Most informal devices offer poor returns on investments

Summary
• Products:– Inflexible- pricing, terms, applications, overlapping– Require urgent innovation and simplification, also for
small business savings– Offerings are confusing with little perceived benefits– Hidden within formidable Service Provider structures,
which are not easy to access physically– Need to move consumers from “consumption” saving to
“life improvement” savings and investments – huge opportunity
– Affordable savings & investment instruments required– Informal instruments are not offering adequate returns
and carry high risks– Informal & formal instruments could be closer – bank
accounts for savings clubs are purely entry level and more transaction based?
– Need to create a bridge from informal to formal instruments

And so….?
• What will/should Government do?• Will Business rise to the true market
challenges?• Where will Consumers gain extra income to
balance credit and savings utilisation? • Are Consumers up to the challenge? Who will
equip them, and with what? • Are you?

Thank you!
FinScope & Financial Diaries
Websites for more information