satellite estimation of tropical secondary forest above
TRANSCRIPT

int j remote sensing 2000 vol 21 no 6 amp 7 1139ndash1157
Satellite estimation of tropical secondary forest above-ground biomassdata from Brazil and Bolivia
M K STEININGER
Department of Geography University of Maryland College ParkMaryland 20742 USA
Abstract This paper reports on a test of the ability to estimate above-groundbiomass of tropical secondary forest from canopy spectral re ectance using satel-lite optical data Landsat Thematic Mapper data were acquired concurrent with eld surveys conducted in secondary forest fallows near Manaus Brazil and SantaCruz de la Sierra Bolivia Measurements of age and above-ground live biomasswere made in 34 regrowth stands Satellite data were converted to surfacere ectances and compared with regrowth stand age biomass and structuralvariables
Among the Brazilian stands signi cant relationships were observed betweenmiddle-infrared re ectance and stand age height volume and biomass Thecanopy re ectancendashbiomass relationship saturated at around 150kg m Otilde 2 or over15 years of age (rgt 080 plt 001) In the Bolivian study area no signi cantrelationship between canopy spectral re ectance and biomass was observed Thesecontrasting results are probably caused by a low Sun angle during the satellitemeasurements from Bolivia However regrowth structural and general composi-tional di erences between the two study areas could explain the lack of a signi c-ant relationship in Bolivia The results demonstratea current potential for biomassestimation of secondary forests with satellite optical data in some but not alltropical regions A discussion of the potential for regional extrapolationof spectralrelationships and future satellite imagery is included
1 IntroductionThe proliferation of human settlements in the Amazon basin results in the
conversion of large areas of mature tropical forest to landscapes primarily consistingof pasture agriculture and secondary forest Most land use in the Amazon is charac-terized by high rates of land abandonment and re-clearance yielding mosaics of landunder cultivation and secondary vegetation of di erent stages of regrowth (Uhl et al1988 Turner et al 1993 Moran et al 1994) Current estimates of the annual carbonrelease to the atmosphere by tropical land use are around 16 gigatons (Schimel
et al 1996 Schimel 1998) Fearnside (1996) estimated that in 1990 027 gigatons ofcarbon were released to the atmosphere from the burning of forest and cerrado inthe legal Brazilian Amazon alone
An unknown amount of carbon is re-sequestered in secondary forests growingin fallowed or abandoned agricultural lands Debate continues over whether themany abandoned lands in the Amazon are actually supporting rapid secondaryforest regrowth (Lugo 1988) or whether most do not have a chance to revert toforest (Myers 1991) There are also uncertainties about fallow periods and rates ofbiomass accumulation during regrowth Because of these uncertainties we are unable
International Journal of Remote SensingISSN 0143-1161 printISSN 1366-5901 online copy 2000 Taylor amp Francis Ltd
httpwwwtandfcoukjournalstf01431161html
M K Steininger1140
to determine the net impact of land use on carbon sequestration in the AmazonWhile current remote sensing e orts such as the NASA Landsat Path nder TropicalDeforestation Project (Lawrence and Chomentowski 1992 Lambin 1994) seek toprovide precise estimates of tropical deforestation they will not provide informationon the subsequent patterns of land cover and utilization
Analysis of optical satellite data such as those from the Thematic Mapper (TM)sensor on the Landsat platform permits accurate estimation of deforestation areasand rates Most local studies of deforestation report accuracy levels of over 95(Roy et al 1991 Sader et al 1991 Steininger 1996) and several global deforestationmonitoring programs have been implemented during the past decade (Lawrence andChomentowski 1992 Lambin 1994) Progress has also been made in estimating thearea of secondary forests with high resolution optical data The estimation ofregrowth biomass over large areas with satellite imagery would however enablemany additional questions about the ecological functioning of natural and human-modi ed landscapes to be addressed including the net carbon exchange associatedwith tropical agriculture
Three independent studies using TM observations have reported similar changesin canopy spectra with age over the rst 15 years of forest regrowth in the BrazilianAmazon (Foody and Curran 1994 Moran et al 1994 Steininger 1996) Typicallyvisible (TM channel 3 063ndash069 mm) re ectance is low for all ages of regrowth whilenear-infrared (TM channel 4 076ndash090mm) re ectance increases for four to eightyears and then decreases for the following ve to ten years of forest regenerationRe ectances in both middle-infrared TM channels (channel 5 155ndash175mm channel7 208ndash235mm) gradually decrease throughout the rst 15 years of regrowthHowever the most reliable estimates of regrowth age are made when images frommany years are available (Kimes et al 1998)
These common trends in regrowth canopy re ectance with age have been attrib-uted to the changes in canopy leaf area and geometry as secondary forests regrowField studies of secondary forests in the Amazon and elsewhere show that forrecovery from light to moderate use leaf area rapidly increases with light captureoften over 80 within ve years of regrowth (Jordan 1989 Saldarriaga andLuxmoore 1991) Thus visible re ectance is low for most secondary forests over afew years old Increases in leaf area during early (lt 5 years old) regrowth cause anincrease in near-infrared re ectance via multiplicative scattering
Middle-infrared radiation is not absorbed by plant pigments and due to lowerleaf transmissivity is less subject to multiplicative scattering than is near-infraredradiation The gradual decrease in middle-infrared re ectance throughout the rst14 years of regrowth and the decrease in near-infrared re ectance in older (gt 8 yearsold ) regrowth has been attributed to increased canopy shading caused by an increas-ingly complex canopy geometry Applications of spectral mixture modelling wheremultispectral images are decomposed into estimates of proportions of leaf coverbackground cover and shade have been applied to demonstrate changes in canopyshade among tropical forest types (Shimabukuro and Smith 1991 Adams et al1995) This has also been applied to Advanced Very High Resolution Radiometer(AVHRR) imagery where similar patterns of re ectances among Amazonian foresttypes have been observed in its middle-infrared channel 3 (Shimabukuro et al 1994Lucas et al 1999)
Leaf ageing has also been shown to reduce near-infrared re ectance for bothcrops and several Amazonian tree species (Gausman et al 1973 Lin and Ehleringer
Global and regional land cover characterization 1141
1982 Rock et al 1994 Roberts et al 1998) Roberts et al (1998) have reportedlowered near-infrared re ectance for leaves from Amazonian caatinga trees whichhave epiphyll growth or have been damaged Leaf re ectances in the near-infraredof both Protium heptaphyllum and Pradosia schomburgkiana with heavy epiphyllgrowth were nearly half those with little to moderate epiphyll growth Roberts et alargue that such di erences in leaf spectral properties account for spectral di erencesamong di erent types of mature forest Such e ects on leaf spectra could also playa role in the di erences in canopy re ectances among early regrowth dominated byshort-lived shrubs and trees and older regrowth with forest species with signi cantleaf necrosis and epiphyll growth This poses a challenge to the assumption ofnon-variant spectral end members in the mixture modelling approach to imagedecomposition
A brightness-based distinction of regrowth appears to be possible only for stagesof regrowth when the canopy changes drastically namely the rst 14 years ofregrowth during which the canopy progresses from low shrubs to a tall multi-layeredforest Yet within these stages it is logical that if infrared canopy re ectance is relatedto regrowth stand parameters such as leaf area canopy height and complexity aswell as leaf parameters such as leaf age necrosis epiphyll growth then canopyre ectance should be related to stand age Since older and taller regrowth is usuallyof higher biomass then infrared canopy re ectance should also be related to standbiomass While one study has reported a poor relationship between near-infraredre ectance and stand biomass for a series of Puerto Rican regrowth (Sader et al1989) there are no comparisons of regrowth biomass with respect to middle-infraredre ectance The research reported in this paper is a test of the potential for estimationof tropical secondary forest above-ground biomass with Landsat TM images usingdata from a series of stands near Manaus Brazil and Santa Cruz de la Sierra Bolivia
Three study areas included samples of secondary forests regrowing in abandonedpasture and agricultural elds mostly manioc in Brazil and rice and corn in BoliviaThe two study areas in Manaus have an average annual temperature of 256szlig Cprecipitation of 2400mm yr Otilde 1 and a dry season from July to September (Sioli 1984Leemans and Cramer 1991) The soils at AM10 the northern study area along theAM10 and BR174 highways (60 szlig W 2 szlig 50frac34 N) are mostly clayey Oxisols (EMBRAPA-CPAC 1981 Dias and Nortcli 1985) The second Brazilian study area is LagoJanauaca (60 szlig 15frac34 W 3 szlig 30frac34 S) 40 km south of Manaus where a large caboclo commun-ity practices rotational agriculture on soils classi ed as Plinthic Dystric Podsols(EMBRAPA-CPAC 1981) The Bolivian study area lies in the Yapacani and Surutubasins in western Santa Cruz along the new Santa CruzndashCochabamba highwayThe area centred at 63 szlig 30frac34 W 17 szlig 30frac34 S receives around 1600mm of rain and has anaverage annual temperature of 23 szlig C (Roche and Rocha 1985) The winter is drywith seven months with less than 100mm of rain and experiences strong cool windsoriginating in the South Atlantic and the Paci c and lasting three to ve days(Ronchail 1986) The soils at Surutu can be grouped into dissected terraces andalluvial plains The soils of the terraces are mostly Quartzipsammentic Haplothorpson dissected terraces to the north and Typic Paleudults on the piedmont to thesouthwest (Montenegro Hurtado 1987)
2 Methods21 Field surveys
20 secondary forest stands in Brazil were visited from September to November1995 and 14 stands in Bolivia were visited from May to June 1996 The secondary
M K Steininger1142
forest stands were all cases of regrowth in abandoned small (lt 10 ha) agricultural elds and pastures (table 1 ) Most of the stands had bordering mature or secondaryforest and all stands were dominated by woody vegetation Plots ranging from 007to 010ha in size were surveyed in each stand and structural measurements of alltrees with a diameter at breast height (dbh 13 m above ground) greater than 5 cmwere made Volumes were estimated using a tree form factor of 062 (Brown andLugo 1990 Brown et al 1995) Canopy height was estimated as the mean plus twostandard deviations of the heights of all trees in the stand This estimate approximatesthe height of the taller canopy trees but not unusually tall trees in the stand
All structural and biomass data were calculated and compared for pioneer andclimax genera Following Uhl (1987) Swaine and Whitmore (1988) and Faber-Langendoen and Gentry (1991) the terms lsquopioneerrsquo and lsquoclimaxrsquo are used here torefer to trees of di erent life history strategies The term pioneer refers to trees whichrapidly colonize disturbed areas and rapidly senesce when shaded by over-storeytrees Based in part on Uhl (1987) Saldarriaga et al (1988) and Faber-Langendoenand Gentry (1991) genera recorded as pioneer in the Brazilian stands for this studyare Bellucia and Miconia (Melastomataceae) V ismia (Guttiferae) Cecropia(Moraceae) and Isertia (Rubiaceae) Genera recorded as pioneer in the Bolivianstands are Miconia (Melastomataceae) Vernonia and Senecio (Compositae) Piper(Piperaceae) Psidium (Myrtaceae) Guadua (Gramineae) Psychotria (Rubiaceae)Cecropia and Pourouma (Moraceae) Pseudobombax and Ochroma (Bombacaceae)and Heliocarpus (Tiliaceae) All other trees recorded are considered climax andthus this is a broad group which includes many late successional taxa
A series of allometric equations derived from destructive samples of other neotrop-ical secondary forests were applied to estimate the biomass of each measured tree(table 2) The equations were chosen because they are based on similar genera tothose in the surveyed stands and because they enabled a speci cation of wooddensity The allometric equations used were from the works of Uhl (1987) for treesshorter than 16 m Scatena and Silver (1993) for softwooded pioneer trees taller than16 m and Saldarriaga et al (1988) for hardwoods taller than 16 m The latter groupwas further divided into ve wood density classes ranging in speci c density from042 to 085g mm Otilde 3 (dry weightgreen volume) The majority of sampled trees wasidenti ed to genus thus allowing for a general grouping based on wood density andtree form Taxonomic identi cation was to either genus or family referring to Gentry(1993) and Killeen et al (1993) Tree wood density values for common genera wereobtained from Hidayat and Simpson (1994) Brown et al (1995) and Finegan (1996)
Above-ground standing live biomass density (hereafter referred to as stand bio-mass) was calculated as the sum of tree biomass estimates divided by plot areaSampling errors for stand biomass were estimated from two stands in Bolivia one ve-year old and one 15 year-old following the approach used by Brown et al(1995) In these stands 028 and 030ha plots were surveyed marking each 001hasub-plot Based on the running means and the coe cient of variation of the standarderrors of the sub-plot biomass estimates sampling errors for both stands wereestimated to be 9 for plot sizes of 070ha and larger This estimate was taken asthe error for all sampled stands Further discussion of stand structure and composi-tion and eld estimation of stand biomass is provided in Steininger (1998)
22 Image geo-registrationPrior to conducting the eld surveys TM images from 1991 for Manaus and
1995 for Santa Cruz were obtained from the NASA Landsat Path nder Humid
Global and regional land cover characterization 1143
Table 1 Stands surveyed in all study areas ST= short-term agriculture LP= long-termpasture MF= medium-fallow agriculture SF= short-fallow agriculture (one case inBrazil) and LT= long-term agriculture (one case in Brazil) SB indicates clearingby the slash-and-burn method
Stand Stand Stand Sampled LandId age (y) Area (ha) area (ha) use Land use history notes
Bolivia PiedmontS3 10 4 009 MF Forest 4+ cycles of SB 1 year rice
7 year fallowS4 15 4 008 ST Forest SB 1 year riceS12 20 2 010 ST Forest SB 1 year riceS13 4 2 010 ST Forest SB 1 year riceS14 10 4 010 ST Forest SB 1 year riceS15 12 5 010 ST Forest SB 1 year rice
Bolivia AlluvialS5 25 3 010 MF Forest 4+ cycles of SB 1 year rice
5 year fallowS6 15 3 080 MF Forest 4+ cycles of SB 1 year rice
5 year fallowS7 5 4 010 LP Forest 3 cycles of SB 1 year rice
5 year fallow 7 year pastureS8 6 4 010 MF Forest 4+ cycles of SB 1 year rice
5 year fallowS10 8 3 010 MF Forest 3 cycles of SB 1 year rice
8 year fallowS16 8 5 010 ST Forest SB 1 year maniocS17 15 4 028 ST Forest SB 1 year maniocS18 5 4 030 ST Forest SB 1 year rice
Brazil AM10A2 10 8 007 ST Forest SB 1 year riceA3 4 4 007 LT Forest SB 6 year riceA5 12 2 008 ST Forest SB seeded wrice
only+abandoned sandy hilltopA6 20 6 007 ST Forest SB 1 year riceA7 23 5 009 ST Forest SB 1 year riceA8 20 4 010 ST Forest SB 1 year pastureA9 15 4 007 LP Forest SB 7 year pastureA10 12 25 010 ST Forest Sno-burn no cultivationA11 12 3 008 ST Forest SB 1 year pastureA12 7 15 008 LP Forest SB 6 year pasture
Brazil JanauacaJ1 30 6 010 LP Forest SB 10 years pastureJ2 26 4 010 ST Forest SB 1 year maniocJ3 15 3 010 ST Forest SB 1 year maniocJ4 8 2 007 SF Forest 4 cycles of SB 1 year manioc
3 year fallowJ5 12 4 008 ST Forest SB 1 year maniocJ6 15 3 009 LP Forest SB 1 year manioc 5 year fallow
SB 5 year pastureJ7 20 8 007 LP Forest SB 1 year manioc 3 year fallow
SB 10 year pastureJ9 10 2 010 LP Forest SB 1 year manioc 3 year fallow
SB 5 year pastureJ10 5 15 008 LP Forest SB 1 year manioc 3 year fallow
SB 6 year pastureJ11 5 2 008 ST Forest SB 1 year manioc
M K Steininger1144
Tab
le2
All
om
etri
ceq
uati
ons
and
den
siti
esuse
dto
esti
mate
above-
grou
nd
live
bio
mass
W
t=
above-
grou
nd
stan
din
gdry
bio
mass
inkg
mOtilde
2db
h=
dia
met
erat
bre
ast
hei
ght
incm
H
=tr
eehei
ght
inm
S
=den
sity
(=dry
wei
ght
per
un
itfr
esh
volu
me
gm
mOtilde
3)
Den
siti
es
ing
mm
Otilde3
are
aver
ages
amon
gth
em
ost
com
mon
taxa
inea
chgr
ou
pan
dar
euse
don
lyin
the
calc
ula
tion
of
bio
mass
for
den
seta
lltr
ees
All
om
etri
ceq
uati
ons
are
fro
m
1U
hl
(1987
)2
Sca
tena
and
Silver
(1993
)3
Sald
arr
iaga
etal
(19
88
)4
Fols
ter
etal
(1
976
)w
oo
dden
siti
esar
efr
om
Hid
aya
tan
dSim
pso
n(1
994
)F
ost
erB
row
net
al
(1995
)an
dF
ineg
an
(1992
)r2
valu
esar
eas
rep
ort
edin
the
ori
gin
alst
udie
s
All
om
etri
ccl
ass
Hei
ght
range
Form
ula
Ave
rage
r2D
ensi
tyT
axon
om
icgr
ou
pap
pli
edto
Ref
Lig
ht
short
lt11
mW
t=
[0
134
(100
db
h2H
)+15
54
097
Did
ymop
omax
Cec
ropi
a1
+0
464
(100H
Otilde32
078
)] 1
000
Hel
ioca
rpus
Jac
aran
daN
aucl
eops
is
Och
rom
aP
ouro
uma
Scle
rono
ma
Lig
ht
tall
gt11
mW
t=
exp
[2
475
ln(d
bh)Otilde
240
]0
97
sup22
Den
sesh
ort
lt16
mW
t=
[10
9(0
860
log
(100
db
h2H
)+0
20
)0
97
All
oth
ers
lt16
m1
+10
9(0
612
log
(Hd
bh
2)+
040
)] 1
000
Den
seta
llgt
16m
Wt
=ex
p(Otilde
109
+0
876
ln(d
bh
2)0
93
042
An
aca
rd
iac
eae
3+
0604
ln(H
)+0
871
ln(S
))A
nn
on
ac
eae
Pit
hec
elo
biu
m
Sim
aru
ba
sup2sup2
055
Apoc
yn
ac
eae
Bu
rse
rac
eae
Cor
dia
cea
eL
au
rel
acea
eM
imoso
ida
eM
orac
eae
Sapin
dac
eae
sapota
cea
e0
85
Ana
dena
nthe
raA
stro
nium
Tab
ebui
asup2
sup20
65
All
oth
ergt
16m
(Bra
zil)
070
All
oth
ergt
16m
(Bolivia
)
Pal
mal
lW
t=
00101
(db
h2)
1136
+0
0379
(db
h2)
0712
072
Palm
ae
4st
emm
eddb
h=
117
+ht
1311
Global and regional land cover characterization 1145
Tropical Deforestation Project (Lawrence and Chomentowski 1992) These imageswere geographically registered using GPS measurements collected during previoussite visits The corrected positional errors of the imagery were estimated to be within30 m based on the GPS points used in registration During the eld surveys addi-tional GPS measurements were collected along roads clearance edges and canopygaps within stands
23 Image atmospheric correctionFor this study the 6S atmospheric correction program (Vermote et al 1997) was
used This is a multiple-stream simulation of atmospheric absorption and scatteringbased on user-de ned inputs of optical depth and aerosol composition Estimates ofoptical depth over dark closed canopy forested sites were derived from a programdeveloped at the University of Maryland Institute of Advanced Computer Studies(UMIACS) (table 3) This program employs the approach of Kaufman and Remer(1994) by taking di erences in top-of-atmosphere (TOA) re ectances in the blue andmiddle-infrared channels for forest sites to estimate optical depth in a given satelliteimage (Fallah-Adl 1996) Aerosol composition was de ned as 80 water-soluble15 soot 5 dust-like and 0 oceanic (Holben 1996 personal communication)
A comparison of estimated surface re ectances for dark water and closed-canopyprimary forest surface features that can be assumed to have constant re ectance inimages from di erent years is shown in gure 1 The 6S corrected spectra producedbetween-year di erences of one to two per cent re ectance in all channels exceptchannel 7
24 Analysis of canopy spectraSurveyed stands were identi ed in the geo-referenced imagery Means of the
corrected stand re ectances in each of the TM channels were calculated and plottedagainst stand above-ground biomass and structural variables Linear regressions ofeach channel re ectance against biomass were performed using a general linearmodel (Neter et al 1990) An F test was used to test for an e ect of study area onthe regression Finally step-wise regression was used to compare biomass estimationusing single versus multiple band re ectances Based on the correlation matrix standcanopy re ectances were plotted against the other stand structural characteristics toassist interpretation of the biomassndashcanopy re ectance relationship
Table 3 Summary of Landsat 5 TM images and aerosol optical depth estimates Opticaldepth was estimated with the University of Maryland Institute of Advanced ComputerStudies correction program (UMIACS OD)
Solar UMIACS ODPath zenith
Study area Scene date row (szlig ) 049mm 066 mm
AM10 Janauaca 15 August 1988 23162 43 016ndash028 lt 001ndash0198 August 1991 sup2 44 024ndash033 015ndash03220 September 1995 sup2 38 033ndash052 032ndash051
Surutu 25 July 1986 23172 68 012ndash021 001ndash0199 July 1992 sup2 69 016ndash024 016ndash0235 August 1996 sup2 66 038ndash046 036ndash045
M K Steininger1146
Figure 1 Means of Thematic Mapper digital numbers (DN) and atmospherically-correctedsurface re ectances for dark targets
3 Results31 Patterns of biomass and canopy re ectance in Brazil
Most of the early regrowth stands surveyed in Brazil were dominated by a mixof V ismia Miconia and Bellucia (Steininger 1998) None of the stands surveyed inthis study were dominated by Cecropia in contrast to the early regrowth standssurveyed by Foody and Curran (1994) The most common taxa in the Brazilianstands older than 10 years of age were Inga (Mimosoideae) Goupia (Celastraceae)Didymoponax (Araliaceae) and genera of the Annonaceae Lauraceae andBurseraceae The range of total above-ground live biomass among the stands inBrazil was from 02 to 20 kg m Otilde 2
The highest correlations among stand variables were those among stand agebasal area volume and canopy height (table 4) These variables were all inverselycorrelated to canopy re ectance in all three infrared bands The highest correlationsbetween canopy re ectances and structural variables were between middle-infraredre ectance and stand basal area (r2=0715) and biomass (r2=0701)
Re ectances in the visible channels rapidly decreased from over 006 in pastures
Global and regional land cover characterization 1147T
able
4C
orr
elati
on
matr
ixof
stru
cture
and
cano
py
spec
tral
re
ecta
nce
for
stan
ds
surv
eyed
in(a
)B
razi
lan
d(b
)B
olivia
Tota
lP
ion
eer
Cli
max
TM
Ch
ann
els
(a)
Bra
zil
Age
Den
sity
BA
V
ol
Dry
Wt
Ht
mn
Ht
sdH
tca
nH
tm
nH
tsd
Ht
can
TM
3T
M4
TM
5T
M7
Age
100
Otilde0
01
064
063
066
048
056
057
049
054
054
Otilde0
28
Otilde0
37
Otilde0
66
Otilde0
65
Den
sity
100
023
Otilde0
06
001
Otilde0
31
Otilde0
20
Otilde0
26
Otilde0
24
Otilde0
33
Otilde0
43
015
022
Otilde0
31
Otilde0
45
BA
1
00
094
093
063
078
074
063
076
074
Otilde0
09
039
Otilde0
72
Otilde0
68
Vol
100
096
072
090
086
070
090
088
Otilde0
14
Otilde0
48
Otilde0
63
Otilde0
55
Dry
Wt
100
080
086
087
080
082
087
Otilde0
23
Otilde0
46
Otilde0
70
Otilde0
61
Pio
nH
tm
n1
00
082
095
095
069
087
Otilde0
43
Otilde0
36
Otilde0
61
Otilde0
46
Pio
nH
tsd
100
096
073
094
092
Otilde0
28
Otilde0
36
Otilde0
60
Otilde0
52
Pio
nH
tca
n1
00
087
087
095
Otilde0
36
Otilde0
39
Otilde0
64
Otilde0
52
Cli
m
Ht
mn
100
064
087
Otilde0
50
Otilde0
37
Otilde0
65
Otilde0
53
Cli
m
Ht
sd1
00
094
Otilde0
17
Otilde0
46
Otilde0
51
Otilde0
42
Cli
m
Ht
can
100
Otilde0
33
Otilde0
48
Otilde0
59
Otilde0
46
TM
31
00
003
051
054
TM
41
00
047
020
TM
51
00
094
(b)
Bol
ivia
Age
100
Otilde0
40
081
087
087
063
077
077
033
033
036
Otilde0
13
Otilde0
29
Otilde0
29
Otilde0
10
Den
sity
100
Otilde0
10
Otilde0
45
Otilde0
47
Otilde0
47
Otilde0
32
Otilde0
38
Otilde0
36
Otilde0
58
Otilde0
53
Otilde0
16
Otilde0
03
Otilde0
10
Otilde0
07
BA
1
00
078
084
031
028
034
Otilde0
06
006
001
Otilde0
10
Otilde0
21
Otilde0
22
Otilde0
10
Vol
100
095
070
079
085
050
062
062
014
Otilde0
36
Otilde0
05
Otilde0
16
Dry
Wt
100
065
067
073
034
053
050
017
Otilde0
40
Otilde0
03
017
Pio
nH
tm
n1
00
085
096
086
056
074
005
Otilde0
29
Otilde0
05
007
Pio
nH
tsd
100
097
086
074
084
021
Otilde0
34
015
035
Pio
nH
tca
n1
00
093
073
087
017
Otilde0
28
013
029
Cli
m
Ht
mn
100
068
088
018
Otilde0
20
Otilde0
15
Otilde0
23
Cli
m
Ht
sd1
00
095
059
Otilde0
42
036
060
Cli
m
Ht
can
100
046
Otilde0
37
030
050
TM
31
00
Otilde0
38
076
092
TM
41
00
024
Otilde0
24
TM
51
00
086
M K Steininger1148
Figure 2 Means of estimated canopy re ectances in Thematic Mapper channels 3 4 5 and7 versus above-ground biomass for all regrowth stands surveyed in Brazil
and agricultural elds to below 003 in low to high biomass regrowth stands( gure 2(a)) Re ectances in the near-infrared were around 030 for young lowbiomass stands and decreased thereafter to around 027 for the older high biomassstands ( gure 2(b)) Re ectances in both middle-infrared channels decreased linearlywith both stand age and biomass ( gure 2(c)(d) table 4 )
The best spectral estimator of biomass among the Brazilian stands was anexponential relationship with channel 5 re ectance for all stands and mature forest(r=0714 plt005 n=18) For all stands less than 15 kg m Otilde 2 a linear relationshipbest predicted stand biomass from channel 5 re ectance (r=0854 plt001 n=12 gure 3 table 5) Step-wise regression only slightly increased this relationship byincorporating channels 4 and 3 in the regression model Because of this the linearmodel based on channel 5 alone was used to estimated regrowth biomass in the twoBrazilian study areas ( gures 4 and 5) The estimated average biomass of secondaryforests at Janauaca is 72 kg m Otilde 2 and at AM10 is 76 kg m Otilde 2
Observation of re ectance changes over a 4- and 7-year time period showed adecrease in middle-infrared re ectance for almost all of the stands surveyed althoughthe magnitude of this decrease was only from near zero to Otilde 0045 re ectance over7 years ( gure 6)
Global and regional land cover characterization 1149
Figure 3 Above-ground standing biomass of secondary forest regrowth versus ThematicMapper channel 5 re ectance based on stands surveyed in Brazil The linear regressionmodel is based on stands up to 15 kgm Otilde 2
Table 5 Linear and exponential regressions of regrowth above-ground standing biomassversus Landsat TM channel 5 re ectance based on all the stands surveyed in BrazilThe linear model is based on stands up to 150 kgm Otilde 2
Equation Slope n p error r
Y = 4166e+5e( Otilde 73936X ) 18 lt 001 010 0714Y = 5077Otilde 28762X 13 lt 001 008 0854
Y = above-ground standing dry weight (kg m Otilde 2)X = Landsat TM channel 5 atmospherically corrected re ectancee= natural logarithm
32 Patterns of canopy re ectance in BoliviaIn Bolivia stands were generally of lower stature and biomass Stand canopy
heights ranged from 8 m in an 8-year old to almost 30 m in a 15-year old standStand total above-ground biomass in Bolivia ranged from 24 to 134kg m Otilde 2 Theyoungest stands in Bolivia were dominated by a shrub layer of Vernonia SenecioPsychotria and Miconia (Steininger 1998a b) Stands up to 10 years old weredominated by Ochroma Cecropia Heliocarpus and Inga Cecropia was the mostcommon genus among all the stands in Bolivia
Many of the older stands in Bolivia had an upper canopy composed of the samesoftwooded pioneer tree taxa which dominated the younger stands These weremostly Cecropia spp Pourouma spp Heliocarpus spp and Ochroma pyrimidale Instands that were not dominated by these genera Anadenanthera spp and Swartziaspp were most common in more open canopies over a dense shrub layer Thesestands had relatively lower infrared re ectances among the sample of Bolivianregrowth than similarly aged stands dominated by the softwood trees
The correlation coe cients among stand structural variables reported in table 4reveal further di erences between the regrowth in Brazil and Bolivia In the Brazilianstudy sites all height variables for both pioneer and climax trees were highlycorrelated with stand total biomass (r2gt079) particularly tree height variables(r2gt089) This strong relationship between stand height variables and biomass wasnot found in Bolivia Among the stands surveyed at Surutu the correlation between
M K Steininger1150
Figure 4 Distribution of secondary regrowth above-ground standing biomass in 1995 atAM10 (Amazonas Brazil) Cleared land is shown in white mature forest is shownin grey colours are estimates of regrowth above-ground biomass This image wasproduced using the linear regression model reported in table 5
stand height variables and biomass ranged from 034 to 073 Furthermore standbiomass was most highly correlated with the pioneer canopy height revealing thegreater importance of pioneer trees in the biomass of the Bolivian regrowth stands
The canopy spectral re ectances of the secondary forests in Bolivia were
Global and regional land cover characterization 1151
Figure 5 Distribution of secondary regrowth above-ground standing biomass in 1995 atLago Janauaca (Amazonas Brazil) Cleared land is shown in white mature forest isshown in grey colours are estimates of regrowth above-ground biomass This imagewas produced using the linear regression model reported in table 5
Figure 6 Changes in regrowth canopy re ectance versus age in 1995 for all stands surveyedin Brazil Open triangles are re ectance di erences between 1995 and 1988 full trianglesare re ectance di erences between 1995 and 1991
M K Steininger1152
Figure 7 Means of canopy re ectances in Thematic Mapper channels 3 4 5 and 7 for allregrowth stands surveyed in Bolivia
consistently higher than those in Brazil Among stands of up to 7 years old inBolivia visible re ectance was from 004 to 006 Near-infrared re ectance was from045 to 070 and middle-infrared re ectance was from 022 to 030 ( gure 7) Moreoverthe patterns of change in canopy spectra with age reported in the 1995 Braziliandata in this study and in other studies were not observed in the Bolivian data Onlynear-infrared re ectance showed a slight decline with stand age and biomass density
4 DiscussionThe patterns of canopy re ectance among the regrowth stands surveyed in Brazil
agree with those previously reported for regrowth near Manaus and in eastern Para(Foody and Curran 1994 Moran et al 1994 Steininger 1996) In this and earlierstudies most secondary forest stands of 15 years and older appeared spectrallysimilar to nearby mature forest The optical band most sensitive to canopy changesduring succession was the middle-infrared Visible re ectance was low throughoutthe chronosequence Near-infrared re ectance was high for all stands presumablybecause of high canopy leaf cover In Landsat TM data the 155ndash175mm band(channel 5) is more sensitive than the 21ndash23 mm band (channel 7)
Global and regional land cover characterization 1153
Stands surveyed in Brazil demonstrated a rapid progression from a canopydominated by shrubs to an even tree canopy dominated by softwooded pioneers toan uneven canopy dominated by later successional trees The most common pioneertrees in the Brazilian stands are Cecropia spp which have a planophile distributionof large leaves These trees rapidly senesce once later successional species such asMiconia spp Inga spp Bellucia spp and Goupia glabra reach the canopy Spectralcanopy models suggest that it is primarily the changes in the upper canopy structureie canopy height upper-canopy leaf area density and angle distribution duringthese stages of regeneration that cause the observed increases in canopy shading anddecreases in middle-infrared re ectance
Since the scenes were all acquired from nearly the same time of year (table 3)Sun angle variation is an unlikely explanation of between year di erences in theretrieved surface re ectances Soil moisture is also an unlikely explanation since allimages were from the late dry season and since canopy cover was high for moststands Between-year di erences in rainfall may have caused between-year di erencesin leaf area which could vary near- and middle-infrared canopy re ectances amongregrowth stands of similar age and biomass stocks Figure 6 shows that the estimatedchanges in middle-infrared re ectance over 4 and 7 years are around Otilde 001 toOtilde 002 and the pattern of re ectance versus stand biomass in gure 2 agrees withthis Thus between-year errors of 001 to 002 re ectance in atmospheric correctionremain a limit to accurate estimation of biomass changes using multi-date opticalimagery
There are at least three possible explanations for the signi cant relationshipbetween stand age biomass and middle-infrared re ectance in the two study areasin Brazil and the lack of one in the Bolivian study area The rst is the low Sunangle during the 1996 satellite pass over Santa Cruz (table 3) A second hypothesisis that a relationship between canopy infrared re ectance and stand variables suchas age height and biomass is not valid for regrowth in areas of tropical deciduousforest as in Santa Cruz Bolivia Measurements of leaf area were not collected inthis study although it is possible that canopy leaf senescence during the dry seasonreduces the e ects of upper-canopy structure on surfaces re ectances In Marabamature forest showed increases in near-infrared re ectance during the dry seasonbecoming nearly as bright as forest regrowth and suggesting a leaf ush of under-storey vegetation in the dry season (Bohlman 1998)
Another possible cause for the di erent spectral relationships to regrowth biomassin Brazil and Bolivia is a di erence in the development of regrowth canopy structurebetween the two areas Among the stands surveyed in Bolivia the stage of successiondominated by pioneer trees persists through the rst 20 years of regrowth consider-ably longer than in Brazil Other than Cecropia spp these trees included Pouroumaspp Ochroma pyrimidale and Heliocarpus spp all which typically have large leavesand Cecropia-like planophile leaf angle distributions (Uhl 1987 Finegan 1996)Canopy heights of the Bolivian regrowth were lower than those in BrazilFurthermore canopy height was strongly correlated to stand biomass in Brazil andpoorly correlated to biomass in Bolivia (table 4) Thus in Bolivia while the standsincreased in height and biomass with age the structural changes of the upper canopyprobably had a lesser e ect on canopy shading and thus were poorly related tostand age and biomass The compositional di erences between the Brazilian andBolivian regrowth suggest that di erences in canopy structure could account forthe contrasting patterns of infrared re ectance and its relationship to vegetationproperties in the two study areas
M K Steininger1154
The potential for monitoring changes with multi-date imagery will most certainly
improve with data from the sensors onboard the soon to be launched Earth
Observing System (EOS-1) and Landsat-7 satellites Speci cally improved radio-metric sensitivity and atmospheric correction based on simulation models and data
internal to the images will allow more precise comparisons of multi-date imagery
The Moderate Resolution Imaging Spectroradiometer (MODIS) to be onboardEOS-1 has 36 channels in visible to thermal bands Atmospheric properties and
their e ects on imagery can be precisely modelled using the thermal channels to
estimate columnar water vapour and the visible and middle-infrared channels toestimate aerosol concentration (Justice et al 1998) The Multi-Angle Imaging
Spectroradiometer (MISR) also to be onboard EOS-1 is expected to improveon inputs to aerosol optical models by estimating particle size distribution and
discriminating spherical from non-spherical particles (Diner et al 1988)
These corrections apply not only to MODIS and MISR imagery but the estim-ated atmospheric water vapour and aerosols can also be used to correct higher
resolution images from alternative sensors Advanced Spaceborne Thermal Emission
and Re ection Radiometer (ASTER) also on EOS-1 will provide 15 to 30 m reso-lution imagery in the visible and near-infrared bands (Yamaguchi et al 1998)
Landsat-7 will have the same spectral channel con guration as Landsat-5 although
is planned to follow the same orbit as EOS-1 within a half-hour (Goward and
Williams 1997) Thus in most instances the correction of a Landsat-7 image basedon atmospheric properties estimated from virtually synchronous image data from
EOS-1 will be possible
Many research questions continue to drive us to produce better regional estimates
of tropical secondary forest distribution and biomass Observations of high resolution
optical imagery to date have demonstrated consistent patterns of change in canopy
spectra with tropical regrowth age with the exception of the Bolivian results in this
study The results of this study suggest that the potential for use of optical satellite
data for above-ground biomass estimation of tropical secondary forests is similar tothat for age estimation With data from EOS-1 isolation of atmospheric e ects from
estimates of canopy re ectance will greatly increase the potential for extrapolations
of spectral relationships over large areas or over multiple dates This will require a
better understanding of the possible variability of canopy structure for similarly aged
patches of tropical regrowth
References
Adams J B Sabol D E Kapos V Almeida Filho R Roberts D A Smith M Oand Gillespie A R 1995 Classi cation of multispectral images based on fractionsof end-members application of land cover change in the Brazilian Amazon RemoteSensing of Environment 52 137ndash154
Bohlman S 1988 Seasonal foliage changes in eastern Amazon detected from LandsatThematic Mapper images Biotropica 30 376ndash391
Brown S and Lugo A E 1990 Tropical secondary forests Journal of T ropical Ecology6 1ndash32
Brown I F Martinelli L A Thomas W W Moreira M Z Ferreira C A C andVictoria R A 1995 Uncertainty in the biomass of Amazonian forests an examplefrom Rondonia Brazil Forest Ecology and Management 75 175ndash189
Dias C C P and Nortcliff S 1985 E ects of two land clearing methods on the physicalproperties of an Oxisol in the Brazilian Amazon T ropical Agriculture 62 207ndash212
Global and regional land cover characterization 1155
Diner D J et al 1998 Multi-angle Imaging Spectroradiometer (MISR) instrumentdescription and experiment overview IEEE T ransactions on Geoscience and RemoteSensing 36 1072ndash1087
EMBRAPA-CPAC 1985 Land systems map physiognomy climate vegetation topographyand soil of the central lowlands of tropical South America Map at a scale of 15 000 000(Bogota Colombia Centro Internacional de Agricultura TropicalEMBRAPA-CPAC)
Faber-Langendoen D and Gentry A H 1991 The structure and diversity of rain forestsat Bajo Calima Choco region western Colombia Biotropica 23 2ndash11
Fallah-Adl H JaJa J Liang S and Townshend J 1996 Fast algorithms for removingatmospheric e ects from satellite images IEEE Computer Science and Engineering3 66ndash77
Fearnside P M 1996 Amazonian deforestation and global warming carbon stocks invegetation replacing Brazilrsquos Amazon forest Forest Ecology and Management 8021ndash34
Finegan B 1996 Patterns and process in neotropical secondary rain forests the rst 100years of succession T ree 11 119ndash124
Folster H de las Salas G et al 1976 A tropical evergreen forest site with perched watertable Magdalena valley Colombia biomass and bioelement inventory of primary andsecondary succession Oecologia Plantarum 11 297ndash320
Foody G and Curran P 1994 Estimation of tropical forest extent and regeneration stageusing remotely sensed data Journal of Biogeography 21 223ndash237
Gausman H W Allen W A Cardenas R and Richardson A J 1973 Re ectancediscrimination of cotton and corn at four growth stages Agronomy Journal 65194ndash198
Gentry A H 1993 A Field Guide to the Families and Genera of Woody Plants of NorthwestSouth America (Colombia Ecuador Peru) with Supplementary Notes on HerbaceousTaxa (Washington DC Conservation International)
Goward S N and Williams D L 1997 Landsat and earth systems science developmentof terrestrial monitoring Photogrammetric Engineering and Remote Sensing 63887ndash900
Hidayat S and Simpson W T 1994 Use of green moisture content and basic speci cgravity to group tropical woods for kiln drying (Madison Wisconsin US Departmentof Agriculture)
Jordan C F 1989 An Amazonian Rainforest T he Structure and Functioning of a NutrientStressed Ecosystem and the Impact of Slash and Burn Agriculture (Paris UNESCO)
Justice C O et al 1998 The Moderate Resolution Imaging Spectroradiometer (MODIS)land remote sensing for global change research IEEE T ransactions on Geoscience andRemote Sensing 36 1228ndash1249
Kaufman Y J and Remer L A 1994 Detection of forests using mid-IR re ectance anapplication for aerosol studies IEEE T ransactions on Geoscience and Remote Sensing32 672ndash683
Killeen T J Emilia Garcia E and Beck S G 1993 GuIgrave a de Arboles de Bolivia (StLouis Missouri Botanical Garden)
Kimes D S Nelson R F Skole D L and Salas W A 1998 Accuracies in mappingsecondary tropical forest age from sequential satellite imagery Remote Sensing ofEnvironment 65 112ndash120
Lambin E F 1994 Modelling Deforestation Processes (Luxembourg ECSC-EC-EAEC)Lawrence W T and Chomentowski W 1992 Data base project to use nearly 3000 satellite
scenes Earth Observation Magazine December 28ndash30Leemans R and Cramer W P 1991 T he IIASA Database for Mean Monthly Values of
T emperature Precipitation and Cloudiness on a Global T errestrial Grid (LaxenburgAustria International Institute for Applied Systems Analysis)
Lin Z F and Ehleringer J 1982 Changes in spectral properties of leaves as related tochlorophyll content and age of papaya Phytosynthetica 16 520ndash525
Lucas R M Honzak M Curran P J Foody G Milne R Brown T and AmaralS 2000 Mapping the regional extent of tropical forest regeneration stages in theBrazilian legal Amazon using NOAA AVHRR data International Journal of RemoteSensing in press
M K Steininger1156
Lugo A E 1988 Ecosystem rehabilitation in the tropics Environment 30 17ndash20Montenegro Hurtado R 1987 Estimacion de las susceptibilidades a erosion de los suelos y
los riesgos de degradacion erosiva bajo diferentes sistemas de cultivo en el area deHuaytundashYapacani (Santa Cruz de la Sierra Bolivia Universidad Autonoma GabrielRene Moreno)
Moran E Brondizio E and Mausel P 1994 Integrating Amazonian vegetation land-use and satellite data Bioscience 44 1ndash18
Myers N 1991 Tropical forests present status and future outlook Climate Change 19 3ndash32Neter J Wasserman W and Kutner M 1990 Applied L inear Statistical Models (Illinois
Irwin Harwood)Roberts D A Nelson B W Adams J B and Palmer F 1998 Spectral changes with
leaf aging in Amazon caatinga T rees Structure and Function 12 315ndash325Roche M and Rocha N 1985 Precipitaciones Annuales (La Paz Bolivia
PHICABndashORSTOM)Rock B N Williams D L Moss D M Lauten G N and Kim M 1994 High
spectral resolution eld and laboratory optical measurementsof red spruce and easternhemlock needles and branches Remote Sensing of Environment 47 176ndash189
Ronchail J 1986 Variations climatiques hivernales a Santa Cruz de la Sierra AmazonieBolivienne (La Paz Bolivia Programa Climatologico e Hidrologico de la CuencaAmazonica Boliviana (PHICAB))
Roy P S Ranganath B K Diwakar P G Vohra T P S Bhan S K Singh I Jand Pandian V C 1991 Tropical forest type mapping and monitoring using remotesensing International Journal of Remote Sensing 12 2205ndash2225
Sader S A Powell G V N and Rappole J H 1991 Migratory bird habitat monitoringthrough remote sensing International Journal of Remote Sensing 12 363ndash372
Sader S A Waide R B Lawrence W T and Joyce A T 1989 Tropical forest biomassand successional age class relationships to a vegetation index derived from LandsatTM data Remote Sensing of Environment 28 143ndash156
Saldarriaga J G and Luxmoore R J 1991 Solar energy conversion e ciencies duringsuccession of a tropical rain forest in Amazonia Journal of T ropical Ecology 7233ndash242
Saldarriaga J G West D C Uhl C and Tharp M L 1988 Long-term chrono-sequence of forest succession in the upper Rio Negro of Colombia and VenezuelaJournal of Ecology 76 938ndash958
Scatena F N and Silver W 1993 Biomass and nutrient content of the Bisley ExperimentalWatersheds Luquillo Experimental Forest Puerto Rico before and after hurricaneHugo Biotropica 25 15ndash27
Shimabukuro Y E Holben B N and Tucker C J 1994 Fraction images derived fromNOAA AVHRR data for studying the deforestation in the Brazilian AmazonInternational Journal of Remote Sensing 15 517ndash520
Schimel D 1998 The carbon equation Nature 393 208ndash209Schimel D Alves D Enting I Heimann M Joos F Raynaud D and Wigley T
1995 Radiative Forcing of Climate Change In Climate Change 1994 T he Science ofClimate Change (IPCC 1995 Vol 1) edited by J T Houghton et al (CambridgeCambridge University Press) pp 76ndash86
Shimabukuro Y E and Smith J A 1991 The least-squares mixing models to generatefraction images derived from remote sensing multispectral data Remote Sensing ofEnvironment 29 16ndash21
Sioli H 1984 T he Amazon L imnology and L andscape Ecology of a Might T ropical River andits Basin (Boston Kluwer)
Steininger M K 1996 Tropical secondary forest regrowth in the Amazon age area andchange estimation with Thematic Mapper data International Journal of RemoteSensing 17 9ndash27
Steininger M K 1998a Tropical Secondary Forest in the Amazon An Analysis of LandUse and Net Carbon Exchange PhD Dissertation University of Maryland at CollegePark USA
Steininger M K 1998b Secondary forest structure and biomass following short andextended land use in central and southern Amazonia Journal of T ropical Ecologyin press
Global and regional land cover characterization 1157
Swaine M D and Whitmore T C 1988 On the de nition of ecological species groups intropical rain forests Vegetatio 75 81ndash86
Turner II B L Moss R H and Skole D L 1993 Relating L and Use and Global L and-Cover Change A Proposal for an InternationalGeospherendashBiosphere ProgrammdashHumanDimensions of Global Environmental Change Core Project 24 (Washington DCInternational GeospherendashBiosphere Program)
Uhl C 1987 Factors controlling tropical forest succession Journal of Ecology 75 377ndash407Uhl C Busbacher R and Serrao E A S 1988 Abandoned pastures in eastern Amazonia
I patterns of plant succession Journal of Ecology 76 663ndash681Vermote E TanreAacute D DeuzeAacute J L Herman M and Morcrette J J 1997 Second
simulation of the satellite signal in the solar spectrum an overview IEEE T ransactionson Geoscience and Remote Sensing 35 675ndash686
Yamaguchi Y Kahle A B Tsu H Kawakami T and Pniel M 1998 Overview ofAdvanced Spaceborne Thermal Emission and Re ection Radiometer (ASTER) IEEET ransactions on Geoscience and Remote Sensing 36 1062ndash1071
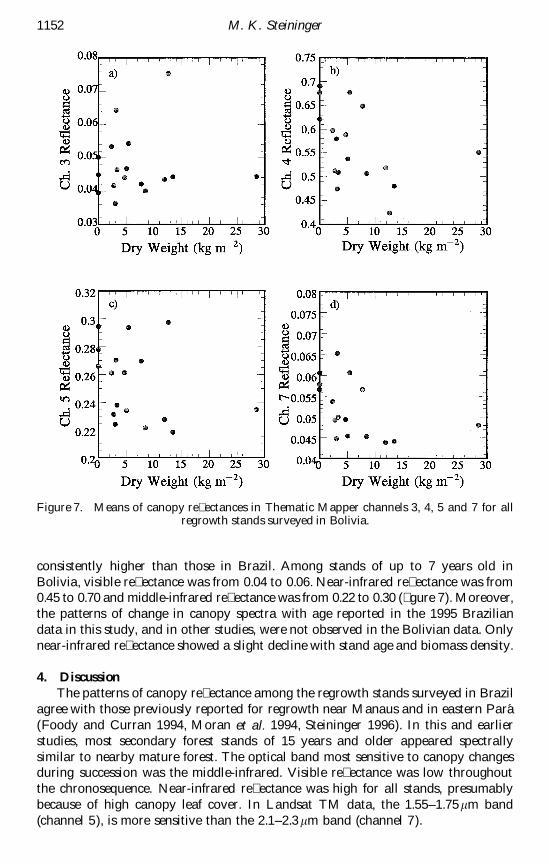