saxena paper 2006 - new york universityweb-docs.stern.nyu.edu/glucksman/docs/saxena.pdf · 2...
TRANSCRIPT
PREMIA IN THE INDIAN ADR MARKET An Analysis of Trends and Causes
Shivanker Saxena
The Leonard N. Stern School of Business Glucksman Institute for Research in Securities Markets
Faculty Advisor: Rangarajan K. Sundaram April 3, 2006
INDEX I INTRODUCTION………………………………………………………………………1 II ANALYSIS OF ADR PREMIUMS OVER TIME…………………………………….9
A. Trend Analysis of the ADR premiums……………………………………….9 B. Risk-Return Characteristics of ADRs……………………………………….16
III ANALYSIS OF INSTITUTIONAL FRAMEWORK……………………………….23 IV INVESTIGATING ADR PREMIUMS……………………………………………...26 V EPILOGUE………………………………………………………………………….. 38 APPENDIX……………………………………………………………………………......

1
I INTRODUCTION
Indian Companies' ADRs/GDRs Premiums, Discounts for July 5
2005-07-04 18:30 (New York)
July 5 (Bloomberg) -- The following table of American and global depositary receipts of Indian companies compares their closing prices with the most recent closes in local trading. Price adjustments are based on a currency value of 43.55 rupee per dollar, along with the number of shares per ADR or GDR. ADR/GDR Local Local ADR/GDR Shares/ Company Ticker Close % Chg Equiv. Close % Prem ADR/GDR Dr Reddy's RDY 17.10 +1.06 744.62 775.90 -4.03 1.0 HDFC Bank HDB 47.89 +2.97 695.12 631.70 +10.04 3.0 ICICI Bank IBN 22.00 +0.69 479.00 429.15 +11.61 2.0 Infosys Technologies INFY 76.47 -1.46 3,329.89 2,394.85 +39.04 1.0 MTNL MTE 6.58 +3.95 143.26 121.85 +17.57 2.0 Ranbaxy Labs RBXD 24.70 -0.04 1,075.56 1,078.40 -0.26 1.0 Reliance Industries RIGD 29.53 +1.48 642.94 643.85 -0.14 2.0 Satyam Computers SAY 26.40 +1.54 574.79 511.00 +12.48 2.0 State Bank of India SBID 41.75 +0.60 909.00 710.60 +27.92 2.0 Tata Motors TTM 9.70 +0.21 422.39 426.75 -1.02 1.0 Wipro WIT 20.58 -1.34 896.16 744.00 +20.45 1.0 Companies are listed based on a market capitalization of more than $1 billion, average daily trading of at least 1,000 ADRs or GDRs during the last three months, and a history of trading at least four days a week.
--New Delhi newsroom, 91-11-5179-2020
11 Indian companies have their ADRs listed on the stock exchanges in the US.
The above article provides a list of the companies with ADRs listed in US, along with
data regarding ADR prices in US, the underlying equity share prices in the Indian stock
markets and the premium at which these ADRs are trading in the US stock markets vis-à-
vis price of the underlying equity in Indian stock market.
2
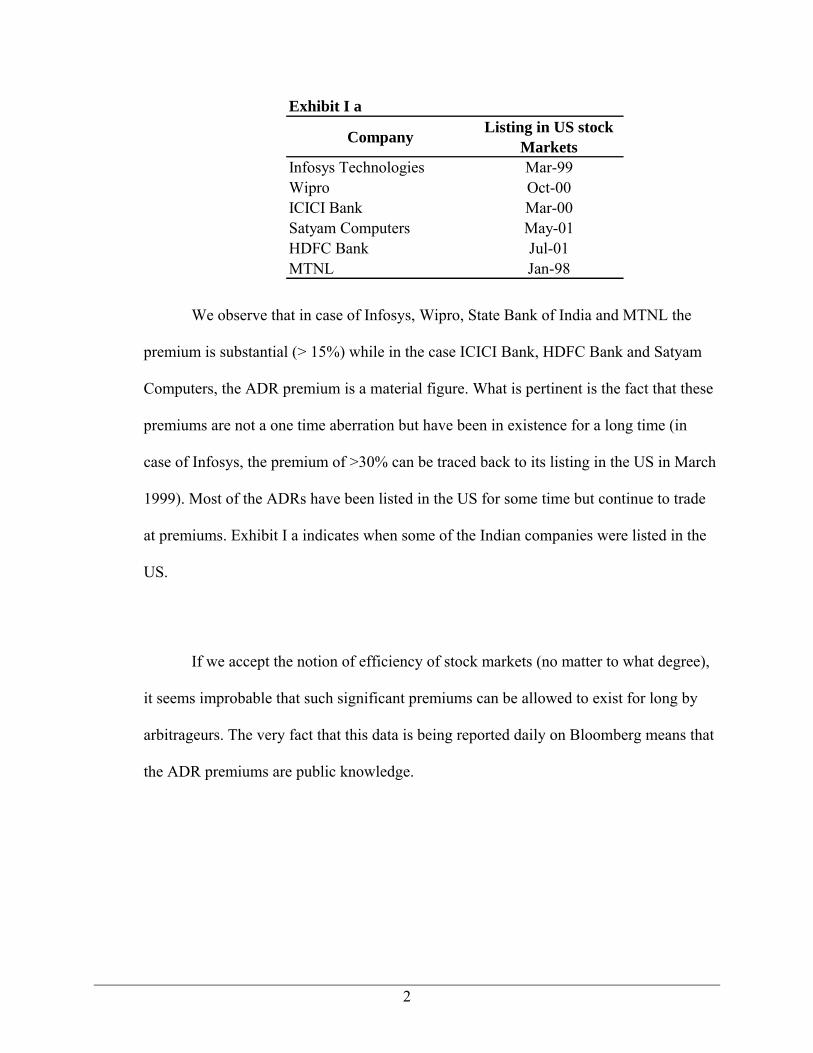
Exhibit I a
Company Listing in US stock Markets
Infosys Technologies Mar-99Wipro Oct-00ICICI Bank Mar-00Satyam Computers May-01HDFC Bank Jul-01MTNL Jan-98
We observe that in case of Infosys, Wipro, State Bank of India and MTNL the
premium is substantial (> 15%) while in the case ICICI Bank, HDFC Bank and Satyam
Computers, the ADR premium is a material figure. What is pertinent is the fact that these
premiums are not a one time aberration but have been in existence for a long time (in
case of Infosys, the premium of >30% can be traced back to its listing in the US in March
1999). Most of the ADRs have been listed in the US for some time but continue to trade
at premiums. Exhibit I a indicates when some of the Indian companies were listed in the
US.
If we accept the notion of efficiency of stock markets (no matter to what degree),
it seems improbable that such significant premiums can be allowed to exist for long by
arbitrageurs. The very fact that this data is being reported daily on Bloomberg means that
the ADR premiums are public knowledge.

3
Exhibit I b
Economy # of stocks Date Average ADR
premium Maximum Minimum
India 11 5-Jul-05 12.15% 39.04% -4.03%Germany 18 5-Jul-05 0.26% 0.96% -1.58%China (listed Hong Kong)* 15 5-Jul-05 0.15% 2.44% -1.76%South Korea 11 6-Jul-05 1.32% 6.22% -1.41%Hong Kong 17 4-Jul-05 -0.14% 2.22% -2.59%Taiwan 13 4-Jul-05 1.95% 12.51% -2.70%Singapore 4 5-Jul-05 -0.14% 1.35% -1.77%Australia 19 4-Jul-05 0.41% 3.12% -1.35%UK 48 5-Jul-05 1.23% 4.48% -5.35%*excludes Yanzhou Coal, a significant outlier
To check whether this phenomenon is peculiar to Indian ADRs only, we analyzed
the premiums at which ADRs of other countries trade in the US. We included ADRs from
Germany, South Korea, China (shares listed in Hong Kong), Taiwan, Hong Kong,
Singapore, Australia and UK in our sample. The results are presented in Exhibit I b.
We observe that Indian ADRs not only trade at a relatively higher premium
compared to other ADRs, but also at a significant premium in absolute terms. The highest
ADR premium for India is 39% (Infosys). In fact, apart from Taiwan, ADRs of countries
other than India trade at negligible premiums. This makes the phenomenon of Indian
ADR premiums remarkable.
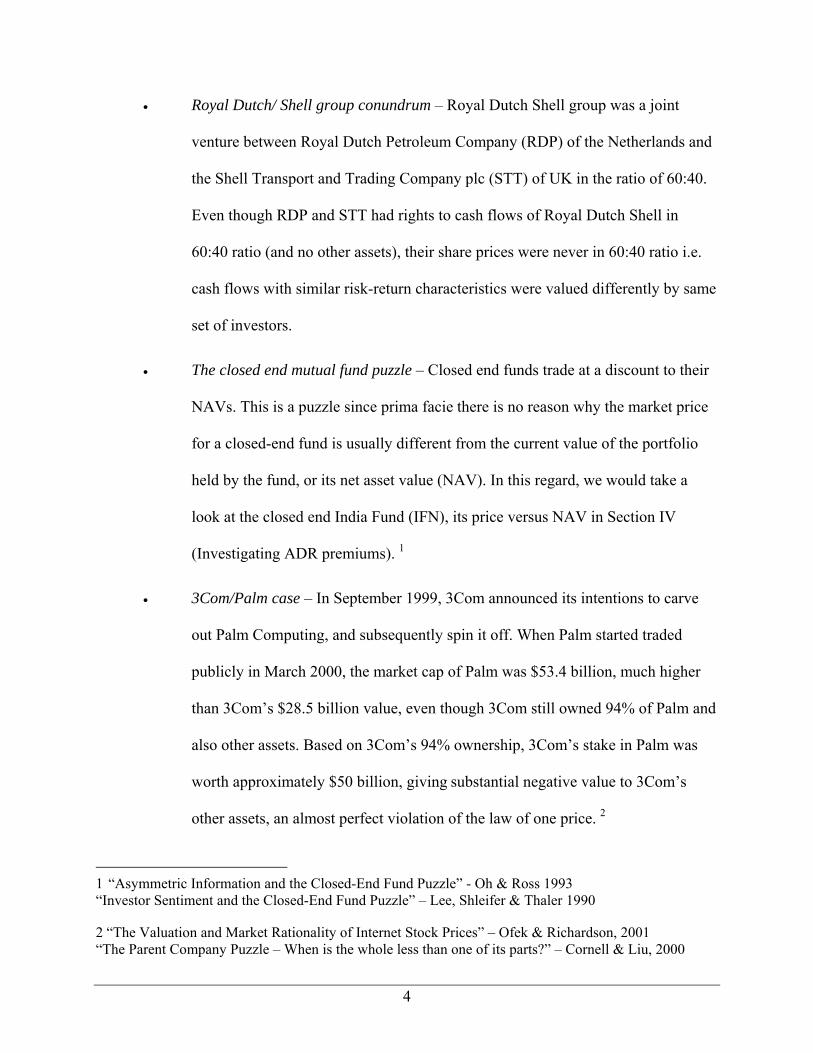
The phenomenon of existence of ADR premiums can be compared to at least 3
other cases in contemporary finance, viz.
4
• Royal Dutch/ Shell group conundrum – Royal Dutch Shell group was a joint
venture between Royal Dutch Petroleum Company (RDP) of the Netherlands and
the Shell Transport and Trading Company plc (STT) of UK in the ratio of 60:40.
Even though RDP and STT had rights to cash flows of Royal Dutch Shell in
60:40 ratio (and no other assets), their share prices were never in 60:40 ratio i.e.
cash flows with similar risk-return characteristics were valued differently by same
set of investors.
• The closed end mutual fund puzzle – Closed end funds trade at a discount to their
NAVs. This is a puzzle since prima facie there is no reason why the market price
for a closed-end fund is usually different from the current value of the portfolio
held by the fund, or its net asset value (NAV). In this regard, we would take a
look at the closed end India Fund (IFN), its price versus NAV in Section IV
(Investigating ADR premiums). 1
• 3Com/Palm case – In September 1999, 3Com announced its intentions to carve
out Palm Computing, and subsequently spin it off. When Palm started traded
publicly in March 2000, the market cap of Palm was $53.4 billion, much higher
than 3Com’s $28.5 billion value, even though 3Com still owned 94% of Palm and
also other assets. Based on 3Com’s 94% ownership, 3Com’s stake in Palm was
worth approximately $50 billion, giving substantial negative value to 3Com’s
other assets, an almost perfect violation of the law of one price. 2
1 “Asymmetric Information and the Closed-End Fund Puzzle” - Oh & Ross 1993 “Investor Sentiment and the Closed-End Fund Puzzle” – Lee, Shleifer & Thaler 1990 2 “The Valuation and Market Rationality of Internet Stock Prices” – Ofek & Richardson, 2001 “The Parent Company Puzzle – When is the whole less than one of its parts?” – Cornell & Liu, 2000
5
Research Objectives
This research aims to analyze the continued existence of premiums on Indian
ADRs over the last 3-4 years and investigate the reasons for the same. If any security,
carrying the same risk-reward characteristics, trades at two different prices in different
markets, the arbitrageurs will soon step in to take advantage of the situation, till the time
the security trades at one price, across all markets. That has not happened in the case of
these Indian ADRs.
The paper looks at the following possible sources of the premium:
1. Legal / Institutional: Laws regarding capital account transactions in India,
including the rules and exact procedures for investment by foreign nationals in Indian
securities market and repatriation of those funds. If the foreign nationals have limited or
no access to Indian stock markets, it is probable that ADRs in the US markets are valued
under different assumptions compared to the valuation of underlying equity in the Indian
stock markets (which is, to an extent, same as saying that the two securities have two
different bodies of investors, with different expectations and assumptions).
2. Liquidity: Measuring the relative liquidity of ADRs in the US to the underlying
stock in India, which may be a partial cause of the premiums. In case the liquidity of

6
ADRs is higher, the ADRS would carry certain liquidity premium vis-à-vis equity listed
on the Indian stock markets.
3. Risk preferences: The investors may assign different risk-reward characteristics to
Indian equities and Indian ADRs on account of currency risk, repatriation risk or risk of
procedural delays in security transactions in India. This may also result in a premium on
ADRs.
The remainder of this paper is divided into three sections. Section II focuses on
analyzing the ADR premiums, their trends and correlations with concerned stock markets
and securities. Section III attempts to delineate the differences between institutional
frameworks that govern capital account transactions in India and three vibrant economies
in world markets – Germany, Hong Kong and South Korea. We attempt to analyze
whether these differences may be causing ADR premiums. Section IV covers an
investigation of the likely causes of ADR premiums.
Section V summarizes our findings and analyses.
7
II ANALYSIS OF ADR PREMIUMS OVER TIME
This section divided into two parts. Part A is aimed at analyzing the trends in
ADR premiums and the movement in ADR premium levels in recent years. Part B
explores the relationship between returns on ADRs with the returns on the underlying
equity, and with the returns on broad market indices (viz S&P 500 and the Bombay
Sensex in India). The analyses in this section would help us put the issue of ADR
premiums in perspective, against a backdrop of long terms trends in ADR premiums, and
the relationship of ADRs with underlying equity and the US and Indian stock markets.
A. Trend Analysis of the ADR Premiums
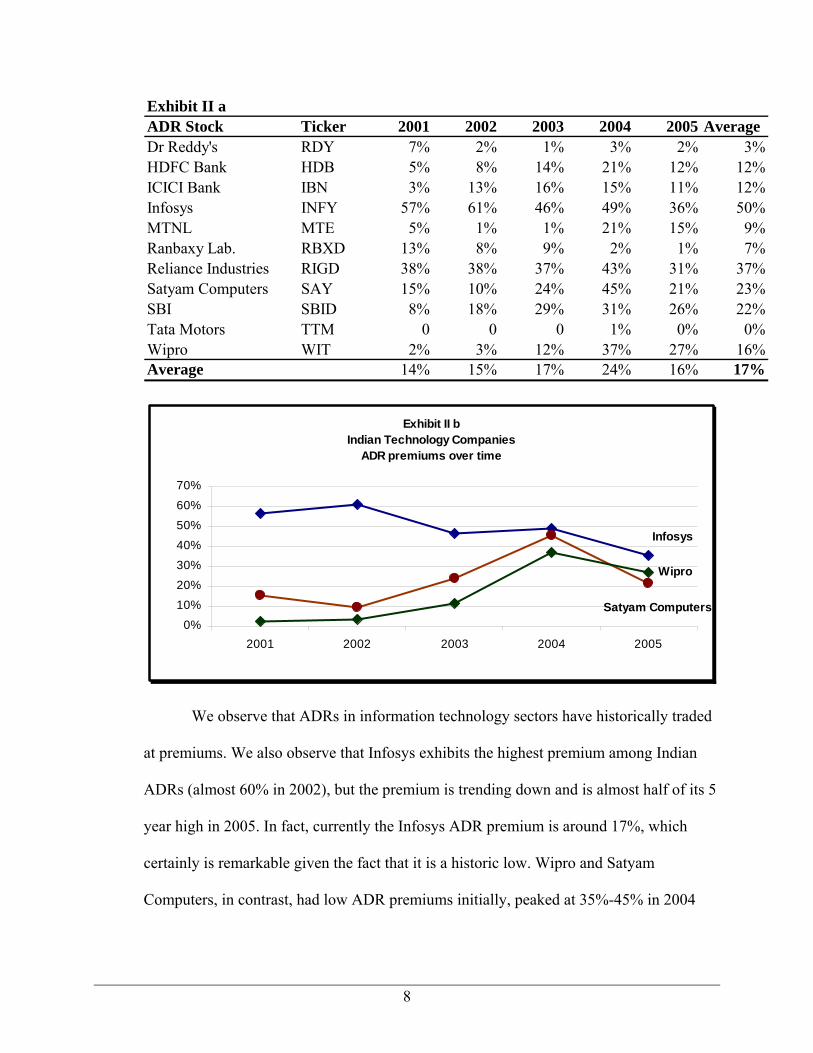
We have analyzed the ADR premiums trend over a period of last 5 years. The
results are detailed in Exhibit II a.
Graphically, we present Exhibit II b - d, the ADRs with relatively the highest
premiums over time among Indian ADRs.
8
Exhibit II aADR Stock Ticker 2001 2002 2003 2004 2005 AverageDr Reddy's RDY 7% 2% 1% 3% 2% 3%HDFC Bank HDB 5% 8% 14% 21% 12% 12%ICICI Bank IBN 3% 13% 16% 15% 11% 12%Infosys INFY 57% 61% 46% 49% 36% 50%MTNL MTE 5% 1% 1% 21% 15% 9%Ranbaxy Lab. RBXD 13% 8% 9% 2% 1% 7%Reliance Industries RIGD 38% 38% 37% 43% 31% 37%Satyam Computers SAY 15% 10% 24% 45% 21% 23%SBI SBID 8% 18% 29% 31% 26% 22%Tata Motors TTM 0 0 0 1% 0% 0%Wipro WIT 2% 3% 12% 37% 27% 16%Average 14% 15% 17% 24% 16% 17%
Exhibit II bIndian Technology Companies
ADR premiums over time
Wipro
Infosys
Satyam Computers0%
10%20%
30%
40%
50%
60%
70%
2001 2002 2003 2004 2005
We observe that ADRs in information technology sectors have historically traded
at premiums. We also observe that Infosys exhibits the highest premium among Indian
ADRs (almost 60% in 2002), but the premium is trending down and is almost half of its 5
year high in 2005. In fact, currently the Infosys ADR premium is around 17%, which
certainly is remarkable given the fact that it is a historic low. Wipro and Satyam
Computers, in contrast, had low ADR premiums initially, peaked at 35%-45% in 2004
9
and trended down to over 20% in 2005. Currently, Wipro trades at 24% ADR premium
while Satyam trades at 16% premium.
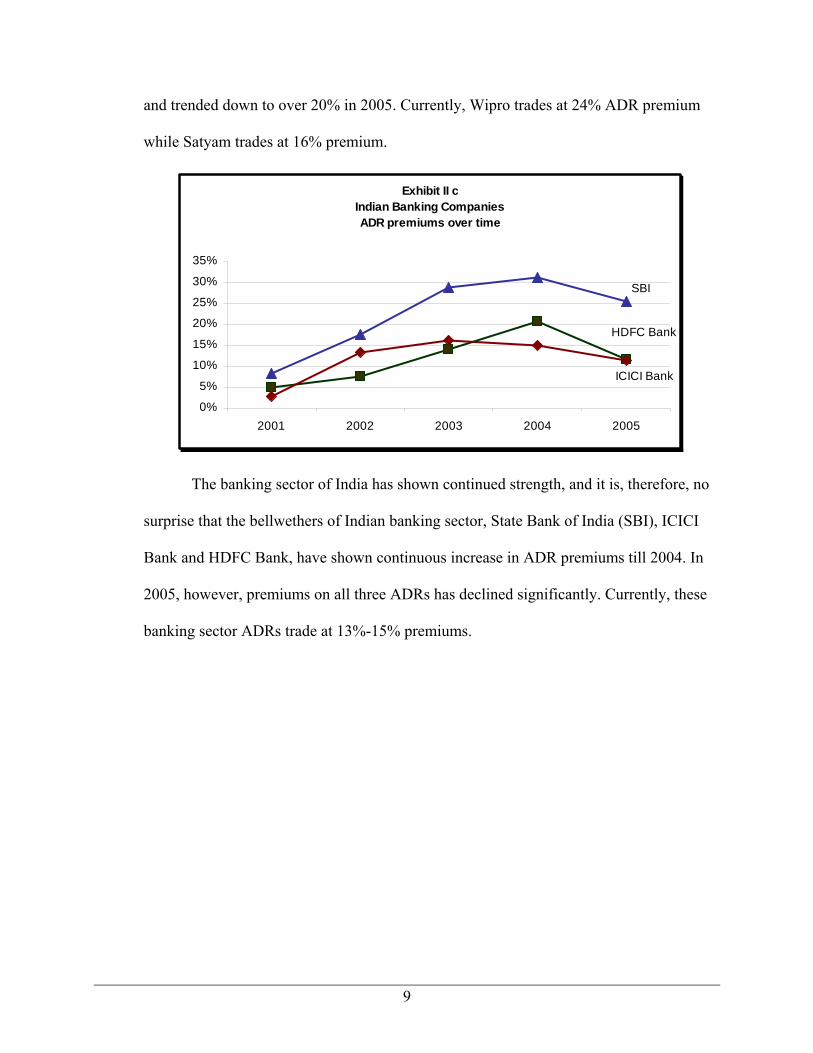
Exhibit II cIndian Banking CompaniesADR premiums over time
HDFC Bank
ICICI Bank
SBI
0%
5%
10%
15%
20%
25%
30%
35%
2001 2002 2003 2004 2005
The banking sector of India has shown continued strength, and it is, therefore, no
surprise that the bellwethers of Indian banking sector, State Bank of India (SBI), ICICI
Bank and HDFC Bank, have shown continuous increase in ADR premiums till 2004. In
2005, however, premiums on all three ADRs has declined significantly. Currently, these
banking sector ADRs trade at 13%-15% premiums.

10
Exhibit II dOther Indian CompaniesADR premiums over time
MTNL
Ranbaxy Lab.
Reliance Industries
0%5%
10%15%20%25%30%35%40%45%50%
2001 2002 2003 2004 2005
Of the remaining ADRs, in our sample, Reliance Industries has maintained the
most stable premium of 30-40% in last 5 years, but in 2006, the premium is down to
<5%. While MTNL ADR premium declined to almost 0% by 2003, Ranbaxy’s hovered
around low teens and high single digits in 2001-03. In the last two years (i.e. 2004 &
2005) MTNL ADR premiums have shot up to over 15%, while Ranbaxy’s declined
precipitously to almost zero.1 Two other ADRs in our sample, Dr Reddy’s
(Pharmaceuticals) and Tata Motors (Automobiles) have shown negligible premiums
(<5%) for the period under study.
Across the board, however Indian ADRs have shown a decline in ADR premiums
over the period 2001-2005. The simple average for 11 ADRs has declined from 2004
high of 24% to 16% in 2005 and was only 11% in February 2006.
1 MTNL and Ranbaxy recently had their GDRs converted to ADRs, so the data relates partly to GDRs and partly to ADRs. Reliance (RIGD) is a GDR.
11
A trend analysis of all 11 ADRs has been conducted. The results shown a clear
downtrend in ADR premiums over time, which indicates that the cause of ADR
premiums is somehow being removed, or corrected, if you will, over time.
12
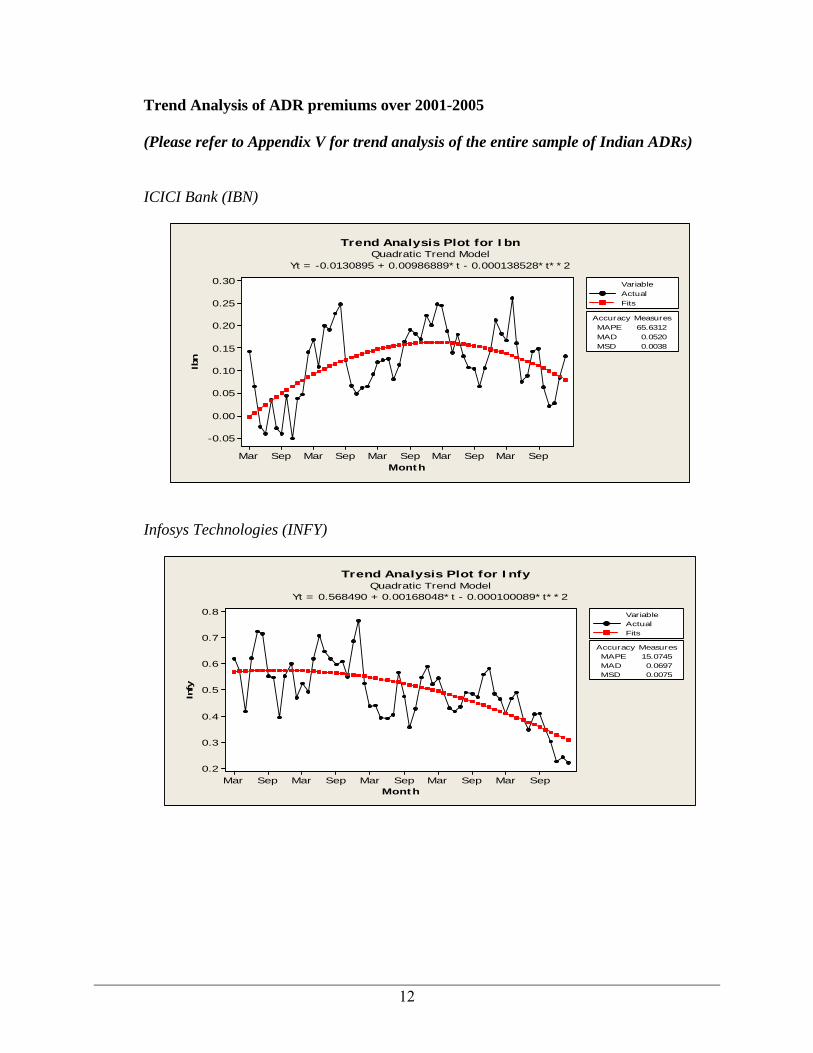
Trend Analysis of ADR premiums over 2001-2005
(Please refer to Appendix V for trend analysis of the entire sample of Indian ADRs)
ICICI Bank (IBN)
Month
Ibn
SepMarSepMarSepMarSepMarSepMar
0.30
0.25
0.20
0.15
0.10
0.05
0.00
-0.05
Accuracy MeasuresMAPE 65.6312MAD 0.0520MSD 0.0038
VariableActualFits
Trend Analysis Plot for IbnQuadratic Trend Model
Yt = -0.0130895 + 0.00986889*t - 0.000138528*t**2
Infosys Technologies (INFY)
Month
Infy
SepMarSepMarSepMarSepMarSepMar
0.8
0.7
0.6
0.5
0.4
0.3
0.2
Accuracy MeasuresMAPE 15.0745MAD 0.0697MSD 0.0075
VariableActualFits
Trend Analysis Plot for InfyQuadratic Trend Model
Yt = 0.568490 + 0.00168048*t - 0.000100089*t**2

13
Satyam Computers (SAY)
Month
Say
SepMarSepMarSepMarSepMarSepMar
0.8
0.7
0.6
0.5
0.4
0.3
0.2
0.1
0.0
Accuracy MeasuresMAPE 62.8986MAD 0.1039MSD 0.0173
VariableActualFits
Trend Analysis Plot for SayQuadratic Trend Model
Yt = -0.00101870 + 0.0167579*t - 0.000222420*t**2

14
B. Risk – Return characteristics of ADRs
Although the ADRs are a derivative of underlying equity, yet there exists a
significant difference in the ADR prices compared to the price of underlying equity (i.e.
the ADR premium). We look to understand the movements of ADR prices, vis-à-vis the
underlying equity, the S&P 500 (where the ADRs trade), and the Indian stock market i.e.
the Bombay Sensex (where the underlying equity trade). Towards this end, we conduct a
correlation and regression analysis of ADR returns versus underlying equity returns, S&P
500 returns and Sensex returns. This would, to some extent, explain the movements in
ADR premiums over time, by exhibiting the impact of US stock market movements,
Indian stock market movements, and underlying equity price changes, on the ADR
premiums. In this way, it would help us understand the relative sensitivity of ADRs to US
stock markets versus the Indian stock markets, which may cause some divergence in
prices of ADR and the underlying equity (i.e. the ADR premiums)
To gain further insight into price movements of ADRs and Indian equity (which
would to an extent, explain the movement in ADR premium), we conducted simple
regression analyses of ADR returns, separately with Indian equity returns (adjusted for
currency movements and ADR:Equity ratios), with S&P 500 Index returns and with
Bombay Sensex index returns. This analysis has been conducted specifically for the
period June 2004 to December 2005, when we have seen considerably decline in the
ADR premiums.
15
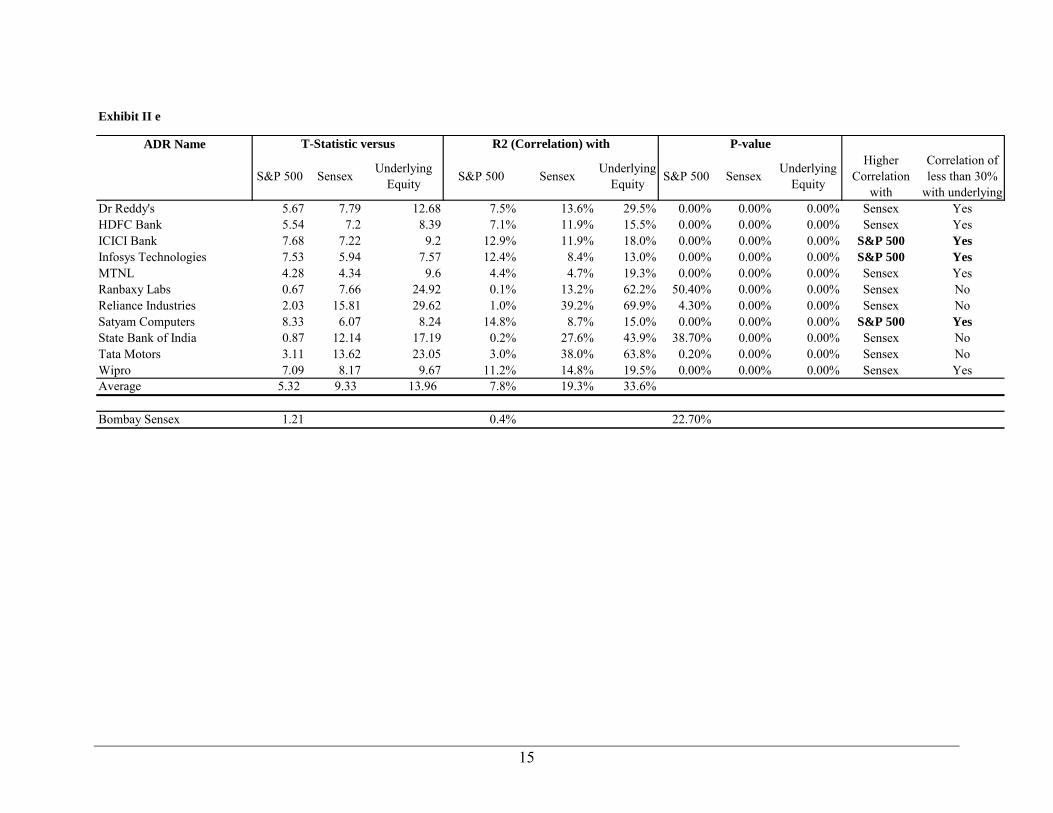
Exhibit II e
ADR Name
S&P 500 Sensex Underlying Equity S&P 500 Sensex Underlying
Equity S&P 500 Sensex Underlying Equity
Higher Correlation
with
Correlation of less than 30%
with underlyingDr Reddy's 5.67 7.79 12.68 7.5% 13.6% 29.5% 0.00% 0.00% 0.00% Sensex YesHDFC Bank 5.54 7.2 8.39 7.1% 11.9% 15.5% 0.00% 0.00% 0.00% Sensex YesICICI Bank 7.68 7.22 9.2 12.9% 11.9% 18.0% 0.00% 0.00% 0.00% S&P 500 YesInfosys Technologies 7.53 5.94 7.57 12.4% 8.4% 13.0% 0.00% 0.00% 0.00% S&P 500 YesMTNL 4.28 4.34 9.6 4.4% 4.7% 19.3% 0.00% 0.00% 0.00% Sensex YesRanbaxy Labs 0.67 7.66 24.92 0.1% 13.2% 62.2% 50.40% 0.00% 0.00% Sensex NoReliance Industries 2.03 15.81 29.62 1.0% 39.2% 69.9% 4.30% 0.00% 0.00% Sensex NoSatyam Computers 8.33 6.07 8.24 14.8% 8.7% 15.0% 0.00% 0.00% 0.00% S&P 500 YesState Bank of India 0.87 12.14 17.19 0.2% 27.6% 43.9% 38.70% 0.00% 0.00% Sensex NoTata Motors 3.11 13.62 23.05 3.0% 38.0% 63.8% 0.20% 0.00% 0.00% Sensex NoWipro 7.09 8.17 9.67 11.2% 14.8% 19.5% 0.00% 0.00% 0.00% Sensex YesAverage 5.32 9.33 13.96 7.8% 19.3% 33.6%
Bombay Sensex 1.21 0.4% 22.70%
T-Statistic versus R2 (Correlation) with P-value
16
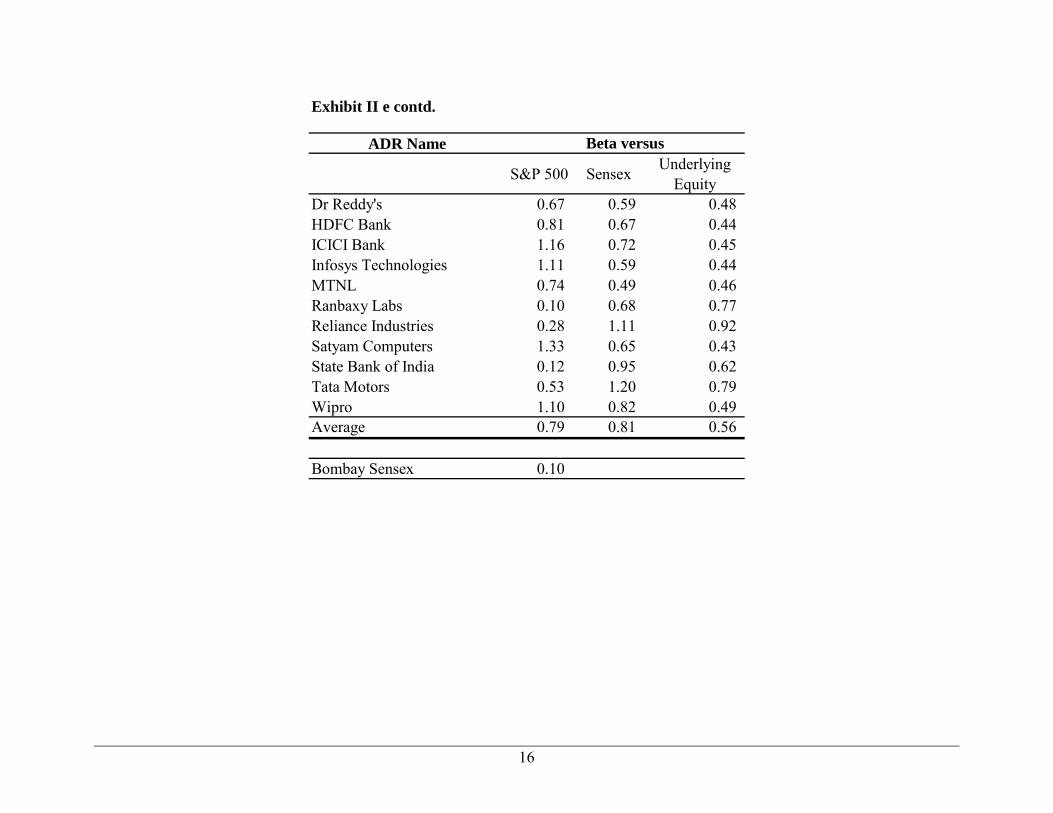
Exhibit II e contd.
ADR Name
S&P 500 Sensex Underlying Equity
Dr Reddy's 0.67 0.59 0.48 HDFC Bank 0.81 0.67 0.44 ICICI Bank 1.16 0.72 0.45 Infosys Technologies 1.11 0.59 0.44 MTNL 0.74 0.49 0.46 Ranbaxy Labs 0.10 0.68 0.77 Reliance Industries 0.28 1.11 0.92 Satyam Computers 1.33 0.65 0.43 State Bank of India 0.12 0.95 0.62 Tata Motors 0.53 1.20 0.79 Wipro 1.10 0.82 0.49 Average 0.79 0.81 0.56
Bombay Sensex 0.10
Beta versus
17
Exhibit II f
28-May-04 31-Dec-05Change in S&P and
ADR prices28-May-04 31-Dec-05 28-May-04 31-Dec-05
Change in Sensex
and Indian Equity
Difference in Price change
28-May-04 31-Dec-05 ∆ ADR Premium
$ $ Rs Rs 45.465 45.195S&P 500 1,120.68 1,248.29 11%Sensex 4759.62 9397.93 104.69 207.94 99% 87%RDY 18.52 21.60 17% 887.55 978.50 19.52 21.65 11% -6% -5.1% -0.2% 4.9%HDB 28.32 50.90 80% 369.75 707.45 8.13 15.65 92% 12% 16.1% 8.4% -7.7%IBN 12.87 28.80 124% 246.35 584.70 5.42 12.94 139% 14% 18.8% 11.3% -7.5%INFY 41.38 80.86 95% 1,264.21 2,996.75 27.81 66.31 138% 42% 48.8% 21.9% -26.8%MTE 5.83 6.90 18% 111.70 144.20 2.46 3.19 30% 11% 18.6% 8.1% -10.5%RBXD 10.88 7.99 -27% 494.90 362.35 10.89 8.02 -26% 0% -0.1% -0.3% -0.2%RIGD 21.35 37.55 76% 331.57 684.34 7.29 15.14 108% 31% 46.4% 24.0% -22.4%SAY 19.54 36.59 87% 305.05 737.80 6.71 16.32 143% 55% 45.6% 12.1% -33.5%SBID 24.45 50.50 107% 484.85 907.45 10.66 20.08 88% -19% 14.6% 25.8% 11.1%TTM* 8.97 14.37 60% 403.35 653.00 8.87 14.45 63% 2% 1.1% -0.5% -1.7%WIT 7.40 11.95 61% 250.75 463.45 5.52 10.25 86% 23% 34.2% 16.5% -17.6%Average 64% 79% 15% -10%* prices as on Sep 30, 2004 and Dec 31, 2005 due to lack of prior trading data
ADR PremiumAdjusted for exchange ratePrice as on Price as on
18
The data in Exhibit II e indicates that the ADR prices do not move in lock-step
with the prices of Indian equity. This is substantiated by the regression analysis that we
have conducted on the ADR returns versus Bombay Sensex, S&P 500 and the underlying
equity returns. We find that ADRs, on average, exhibit a lower beta with the underlying
equity (0.56) vis-à-vis the Sensex or S&P 500 (0.80).
This is a surprising result. As mentioned earlier, the ADR is a derivative of the
underlying equity, with exactly similar risk- return characteristics as the underlying
equity. Given this fact, we would expect a beta near to 1 for ADR returns versus returns
on the underlying equity. However, the average beta of ADRs with the underlying equity
is only 0.56, (much lower than the average ADR beta of 0.81 for Sensex and average
ADR beta of 0.79 for S&P 500). Thus, not only we have a difference in valuations of
ADRs and underlying equity (the ADR premiums), but we also have changes in ADR
premiums over time (as evidenced by lower sensitivity of ADRs to underlying equity
price movements). Therefore a low beta should indicate an increase in ADR premiums
during a bear run in the Indian stock market and a decline in ADR premiums when the
Indian stock market is on a bull run (for e.g. from June 2004 onwards).
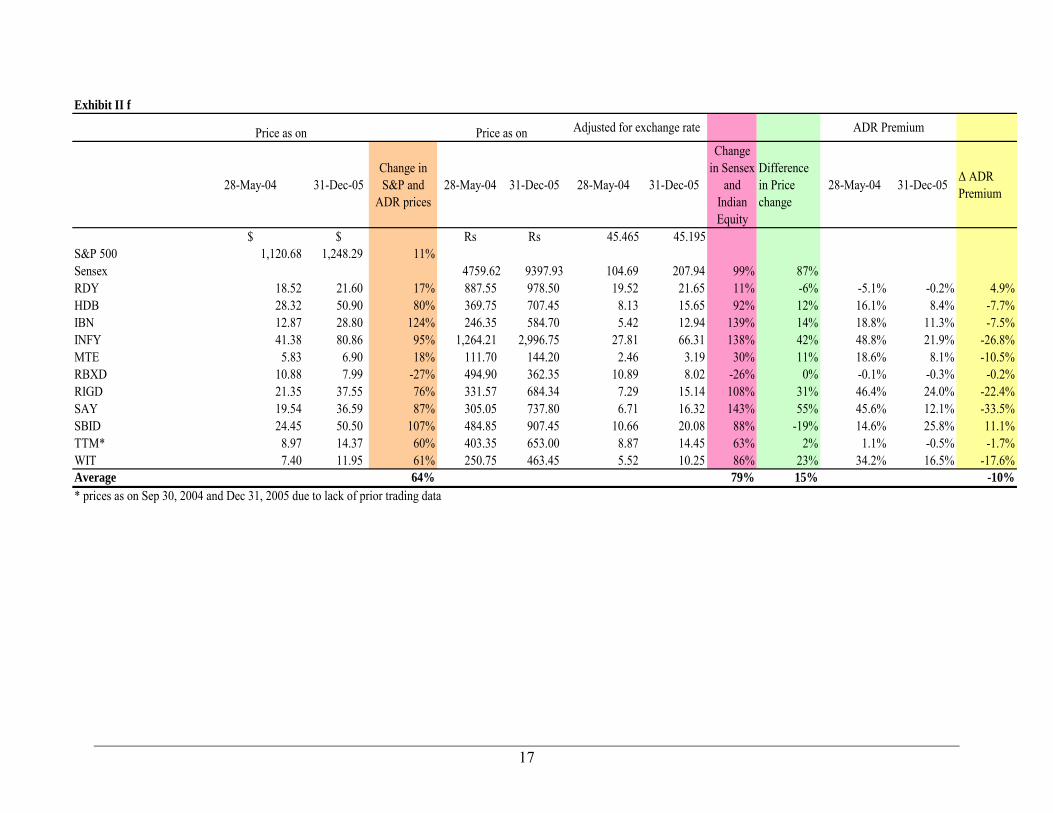
This observation is substantiated in Exhibit II f, which gives us details of price
movement in ADRs and Indian Equity over the period, June 2004 – December 2005.
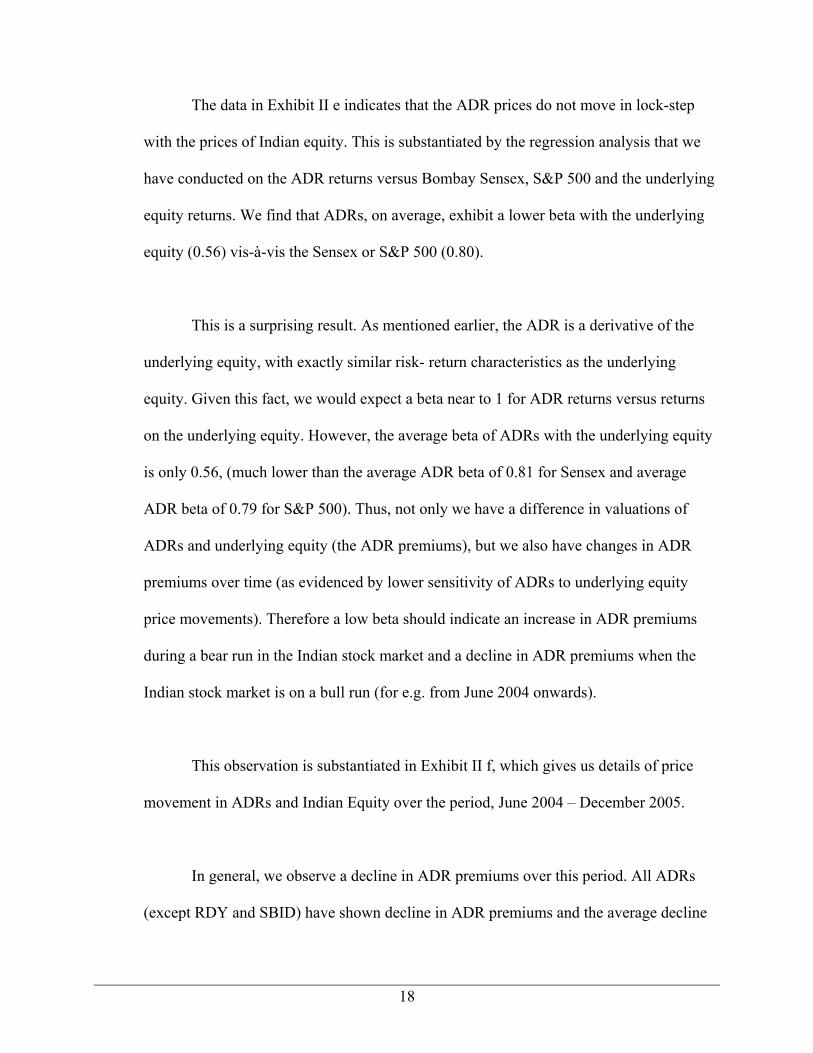
In general, we observe a decline in ADR premiums over this period. All ADRs
(except RDY and SBID) have shown decline in ADR premiums and the average decline

19
is around 10%. At the same time the S&P 500 appreciated 11% vis-à-vis 99%
appreciation in the Bombay Sensex (Indian Stock Market), a difference of 87%.
However, ADR prices on an average increased only 64%, versus an average 79%
increase in the prices of underlying equity shares – reflecting a beta of < 1 with the
underlying equity
It should be mentioned here that the correlation between the Bombay Sensex and
S&P 500 is very low (0.4%) and the beta is quite insignificant (0.10). Given this data, it
can be safely said that US stock markets and Indian stock markets are quite uncorrelated.
It is interesting to note that Satyam Computers, Infosys and ICICI Bank have
higher correlations and betas with S&P 500 than with the Sensex, and a correlation of
less than 30% (average 33.6%) with the underlying equity. Wipro also has a higher beta
with S&P 500 than with the Sensex, and a correlation of less than 30% (average 33.6%)
with the underlying equity. These stocks, thus, move more in tandem with US stock
markets, than with Indian stock markets. Interestingly, average ADR premium for these
stocks is 25%, much higher than the average ADR premium of 17%
Regression of ADR returns versus S&P 500 is significant in all cases, except
MTNL, State Bank of India and Ranbaxy. The correlation of ADR returns with S&P500
is on an average 7.8% (quite low), but is relatively high for Infosys, Wipro, Satyam
Computers and ICICI Bank. The regression of ADR returns with Bombay Sensex and the
underlying equity is significant in all cases and the correlations of ADR returns with the
20
Bombay Sensex and the underlying equity are also higher than the S&P 500 (average
19.3% and 33.6%, respectively), which appears consistent with market facts (i.e. the
ADR is a derivative of underlying Indian equity that trades in Indian stock market). At
the same time, average ADR returns’ correlation with underlying equity is higher than
with Sensex – again a consistent result.
21
III ANALYSIS OF INSTITUTIONAL FRAMEWORK1
In this section, we focus on laws regarding capital account transaction in India,
including the rules and exact procedures for investment by foreign nationals in Indian
securities market and repatriation of those funds. In order to understand whether these
laws maybe the reason for ADR premiums, we have also investigated laws regarding
capital account transactions in Hong Kong, Germany, and South Korea (whose ADRs do
not carry any significant premiums at all – refer Section I)
Portfolio investment is relatively straightforward in India. Even retail investors
can trade freely via a sub-account with any registered Foreign Institutional Investor (FII).
We find that there are virtually no restrictions on portfolio investment in Germany, Hong
Kong and South Korea, too. Repatriation of capital, profits and dividends is also free of
any restrictions in India, Germany, Hong Kong and South Korea. As far as these factors
are concerned, Indian capital markets have the same structure as developed capital
markets (like Germany) and some vibrant emerging markets (like Hong Kong and South
Korea).
Please refer Appendix I for details.
There is, however a crucial difference in ADR provisions of India and these
countries. It is possible to convert ADRs into equity shares and conversely, equity shares
into ADRs, without restrictions, in Germany, Hong Kong and South Korea. In India, the
rules are different. The ADRs have only “limited two way fungibility”. What this implies
1 Source: Economist Intelligence Unit, The Economist

22
is that ADRs can be freely converted to equity shares, but equity shares in India can be
converted to ADRs only to the extent of past conversion of ADRs in that company into
shares. This is technically called “headroom”. If no ADR has been converted back into
equity shares, it implies that no investor can buy shares in India and convert those shares
into ADRs. The implication of ‘headroom’ provision is that if ADRs trade at a premium,
it is not possible to conduct an arbitrage (i.e. short ADR and go long the Indian equity),
because Indian equity cannot be converted into ADR (to close out the short sale), unless
head room is available.
As mentioned above, ‘headroom” is required in an ADR issue to allow arbitrage
to happen. From my discussions with professionals in investment management, it appears
that all the headroom has expired long time back and so conversion of local shares to
ADR through this route is not possible right now. However, it is difficult to obtain the
accurate and comprehensive information about “headroom” available for different ADRs,
in terms of either current or historical data.
In the absence of “headroom”, it is difficult to convert Indian equity shares into
ADRs (due to limited fungibility). Any arbitrage by way of short selling ADRs in US and
buying the underlying security in India seems not possible. In that, the ADR provisions
are certainly different from a developed market like Germany and emerging markets like
Hong Kong and South Korea. It is realistically not possible to readily convert Indian
equity shares into ADRs listed on the US equity markets, which makes it difficult for any
investor to take advantage of ADR premiums.

23
Given the fact that “headroom” is not available, and ADR are trading at a
premium, it implies that the higher ADR price is caused by the following factors:
1. Segmentation in the US and the Indian stock markets. This means that ADR and
Indian equity are being valued differently by investors in these two separate markets.
2. Whether or not “headroom” is available, the existence of ADR premiums can be
explained partially by (1) liquidity premium, (2) currency risk premium, and (3) cost
for transactions / procedural hassles.
Section IV of the paper will investigate these questions.
24
IV INVESTIGATING ADR PREMIUMS
As discussed in Section I, we now return to an investigation into the reasons that
may be the cause of ADR premiums. The following issues will be investigated in detail to
gain insights into the reasons causing the residual ADR premiums
Liquidity Premium
Given the obvious ease of investing in ADRs, there is no doubt about their
demand in the US, especially for an increasingly attractive success story like the Indian
economy. If ADRs offer better liquidity than the underlying equity, it can be argued that
the ADRs would be more attractive to investors who prefer liquidity.
It would be instructive to analyze the shareholding pattern of the ADRs and the
underlying equity to investigate whether a relatively higher proportion of ADRs are
owned by Institutional Investors (who prefer liquidity). Presuming ADRs are primarily
held by Institutional Investors or broadly by investors who value liquidity (i.e. investors
who trade a lot), the liquidity factor become important and may justify premiums on
ADR prices.
There are several methods that have been used in the finance literature for
gauging illiquidity which can be roughly divided into price-based measures (like the daily
bid-ask spread divided by daily price) and volume-based measures (like daily trading

25
volume divided by shares outstanding). We have used a measure formulated by Amihud
(2002) for gauging liquidity of ADRs and underlying equity. Amihud’s measure
calculates the average of daily ratio of absolute return to dollar trading volume.
Dt
Specifically, Amihud’s measure = 1 Σ │Radr i,d │ Dt d=1 Voladr i, d
where Dt is the number of trading days in month t, Radr i,d is the daily return of
ADR i on day d (within month t), and the Voladr i, d is dollar trading volume of ADR i on
day d, defined as number of shares traded times the ADR price on day d.
We use Amihud's (2002) liquidity measure for estimating the impact of liquidity
on ADR premia. We calculated the daily Amihud measure for both the ADR and the
underlying equity in Indian markets for the period from January 2001 to December 2005.
The daily Amihud measure differential is then calculated in % terms in the following
way; [Daily Amihud Measure (ADR)/Daily Amihud Measure (Indian equity) – 1]. This
Daily Amihud Measure differential has then been used to derive monthly averages for
each ADR from January 2001 to December 2005. Similarly we have calculated the daily
premium at which ADRs trade in US markets (using the daily INR – USD exchange
rate). This daily premium (in %) is then used to derive monthly average for each ADR
over the period January 2001 to December 2005.
Exhibit IV a illustrates the higher relative liquidity in 2004 for a sample of 4
ADRs, all of which have displayed high ADR premiums over a long period of time.
26
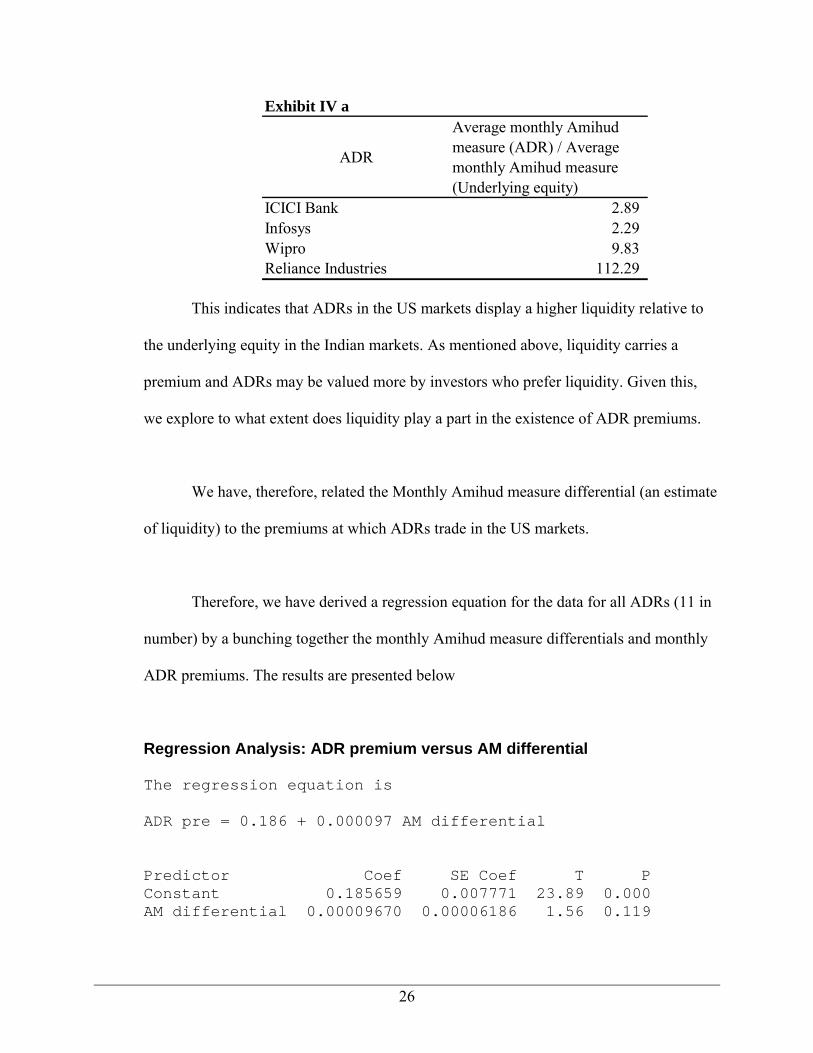
Exhibit IV a
ADR
Average monthly Amihud measure (ADR) / Average monthly Amihud measure (Underlying equity)
ICICI Bank 2.89 Infosys 2.29 Wipro 9.83 Reliance Industries 112.29
This indicates that ADRs in the US markets display a higher liquidity relative to
the underlying equity in the Indian markets. As mentioned above, liquidity carries a
premium and ADRs may be valued more by investors who prefer liquidity. Given this,
we explore to what extent does liquidity play a part in the existence of ADR premiums.
We have, therefore, related the Monthly Amihud measure differential (an estimate
of liquidity) to the premiums at which ADRs trade in the US markets.
Therefore, we have derived a regression equation for the data for all ADRs (11 in
number) by a bunching together the monthly Amihud measure differentials and monthly
ADR premiums. The results are presented below
Regression Analysis: ADR premium versus AM differential The regression equation is ADR pre = 0.186 + 0.000097 AM differential Predictor Coef SE Coef T P Constant 0.185659 0.007771 23.89 0.000 AM differential 0.00009670 0.00006186 1.56 0.119
27
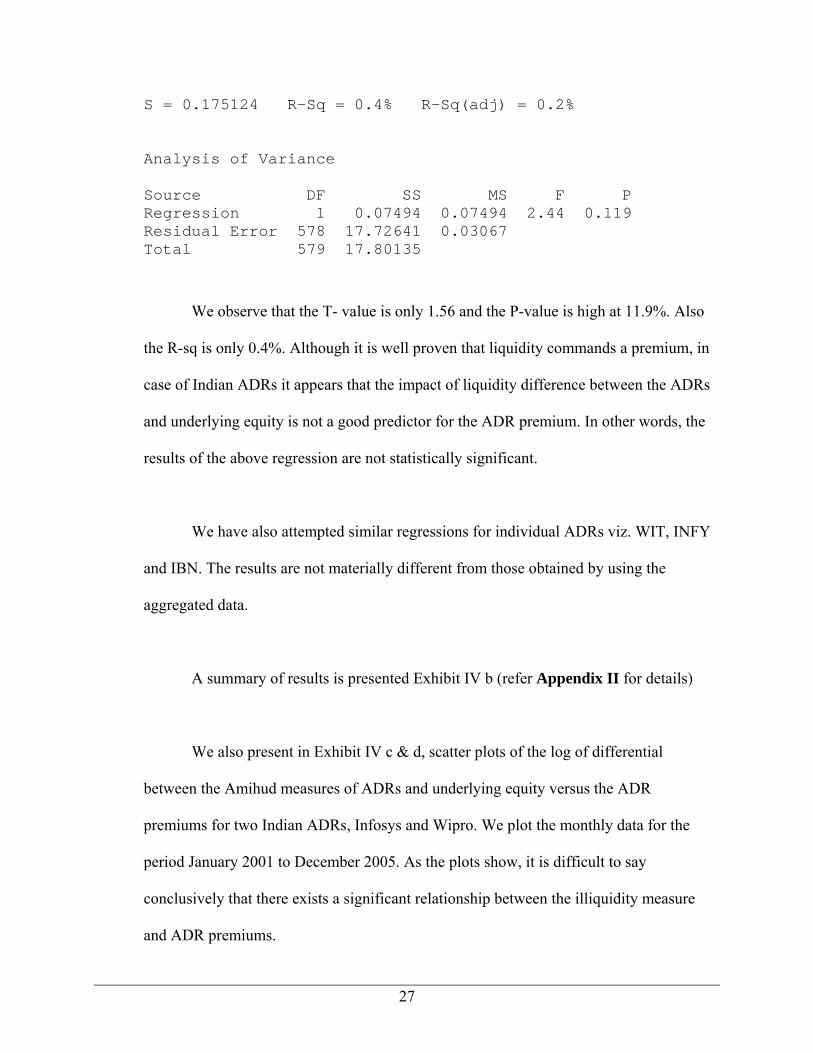
S = 0.175124 R-Sq = 0.4% R-Sq(adj) = 0.2% Analysis of Variance Source DF SS MS F P Regression 1 0.07494 0.07494 2.44 0.119 Residual Error 578 17.72641 0.03067 Total 579 17.80135
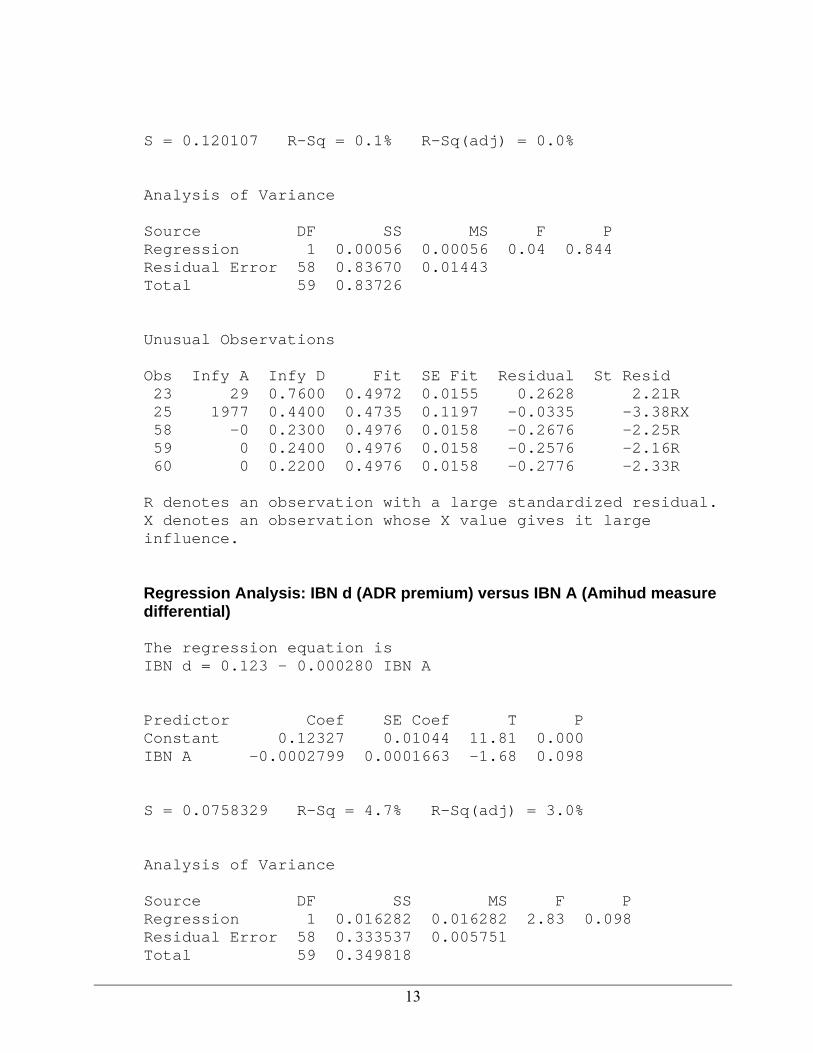
We observe that the T- value is only 1.56 and the P-value is high at 11.9%. Also
the R-sq is only 0.4%. Although it is well proven that liquidity commands a premium, in
case of Indian ADRs it appears that the impact of liquidity difference between the ADRs
and underlying equity is not a good predictor for the ADR premium. In other words, the
results of the above regression are not statistically significant.
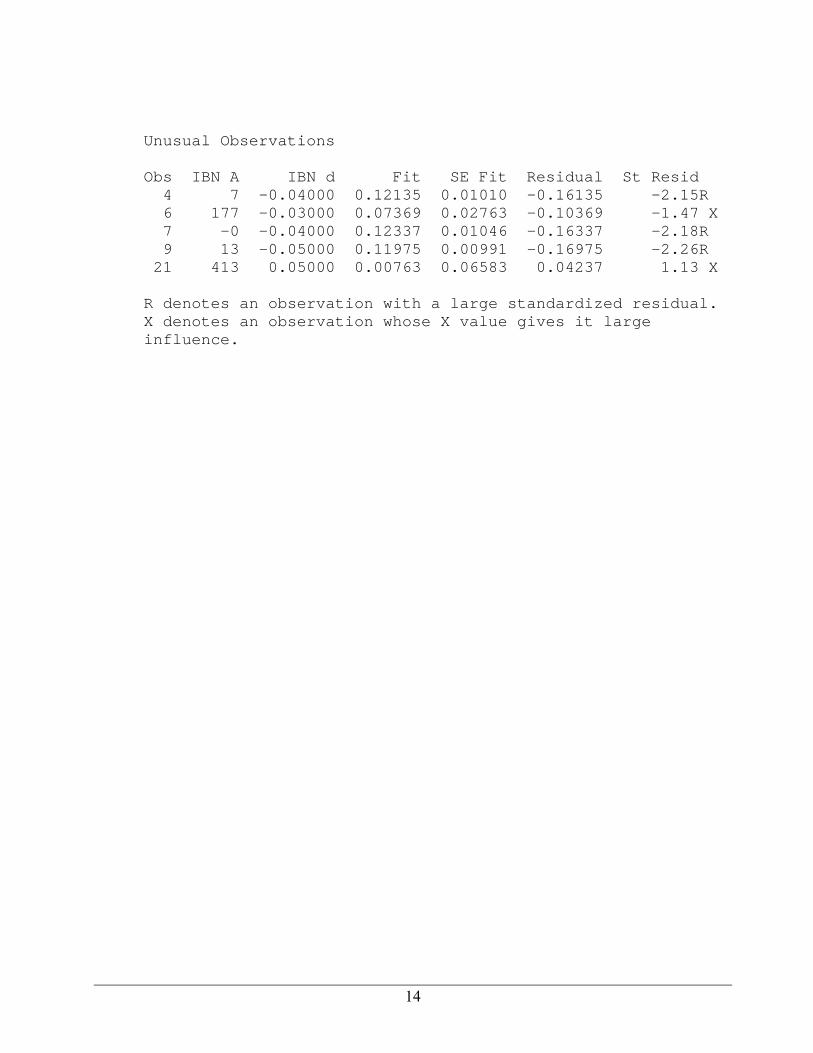
We have also attempted similar regressions for individual ADRs viz. WIT, INFY
and IBN. The results are not materially different from those obtained by using the
aggregated data.
A summary of results is presented Exhibit IV b (refer Appendix II for details)
We also present in Exhibit IV c & d, scatter plots of the log of differential
between the Amihud measures of ADRs and underlying equity versus the ADR
premiums for two Indian ADRs, Infosys and Wipro. We plot the monthly data for the
period January 2001 to December 2005. As the plots show, it is difficult to say
conclusively that there exists a significant relationship between the illiquidity measure
and ADR premiums.

28
Exhibit IV bCompany T-stat P-value R-sq.
Wipro 2.87 0.60% 12.40%
Infosys 0.20
84.40% 0.10%
ICICI Bank 1.68 9.80% 4.70%
Exhibit IV cLog of Amihud Differential vs ADR premiums (INFOSYS)
00.5
11.5
22.5
33.5
44.5
5
0 2 4 6 8 10 12 14
Amihud Differential
ADR
pre
miu
ms
Exhibit IV dLog of Amihud Differential vs ADR premium (Wipro)
-2
-1
0
1
2
3
4
5
0 2 4 6 8 10 12
Amihud Differential
AD
R p
rem
ium
s
The above analyses lead us to conclude that liquidity is not an important factor for
predicting the premiums of ADRs prices over the prices of underlying equity.

29
Currency Risk
Exhibit IV eIndian Rupee Depreciation
Year versus USD versus GBP USD vs GBP1996 2.1% 12.1% -8.9%1997 9.3% 6.1% 3.0%1998 8.2% 8.8% -0.5%1999 2.4% -0.2% 2.6%2000 7.3% -0.9% 8.3%2001 3.5% 0.6% 2.9%2002 -0.6% 9.9% -9.5%2003 -5.1% 5.2% -9.8%2004 -4.1% 3.9% -7.7%2005 3.4% -7.7% 11.9%
Average 2.6% 3.8% -0.8%Median 2.9% 4.5% 1.0%High 9.3% 12.1% 11.9%Low -5.1% -7.7% -9.8%
Data Source: Yahoo.co.in, www.oanda.com
In case arbitrage is possible, any individual / corporate / institutional investor can
invest in India freely through a sub-account with an FII, and convert it into ADR, rather
than invest directly in a higher-priced, same-risk ADR. Any premium that exists may be
partially due to Currency risk premium. In other words, the ADRs eliminate expected
losses to investors due to depreciation of Indian Rupee (INR) versus USD (US Dollar).
ADRs may trade at a premium because of this fact.
Since Indian Rupee has been traditionally weak versus USD, the currency
depreciation will partially explain higher ADR prices. Currency risk is primarily the
expected depreciation in the Indian Rupee over and above the depreciation expected due
to interest rate differentials. This currency risk premium should partially account for
ADR premiums. Again, over the last 4 years, the dollar has depreciated versus rupee, not
30
entirely due to the relative strengths of US and Indian economies but primarily because of
general weakening of USD. We, therefore, examine the currency movements of Indian
rupee (INR) versus USD, INR versus GBP, and Euro versus INR, over last 10 years, to
gauge “general” rupee depreciation (and hence the currency risk).
Since the USD itself has depreciated on an average 0.8% versus GBP, INR
depreciation versus GBP is a better indicator of average depreciation. Therefore, the
actual currency risk (i.e. average depreciation expected, based on past currency
movements) for INR is 3.8% per annum (refer Exhibit IV e). We, of course, assume here
that (1) the average investment horizon (or holding period) for investors is 1 year, and (2)
the currency movements of past 10 years form an appropriate basis for investor
expectations about future currency depreciation and average depreciation of INR in the
past is a good proxy for expected depreciation in future.
Given the above, if average depreciation expected for INR is approximately 4%,
the currency risk explains only a small portion of ADR premium. It may be mentioned
here that ADR premium on Indian ADRs average 17% over last 5 years, which implies
that only a small proportion of ADR premium is explained by currency risk premium.

31
Cost for transactions / procedural hassles
Cost of procedural hassles is more of a subjective issue and is difficult to assign a
value to such a variable. In any case, the cost of any procedural hassle cannot be as high
as premiums of 17% for any rational investor. In other words, it seems unlikely that high
ADR premiums for Indian securities can be ascribed to procedural hassles. It is important
to note that procedural hassle is same for all securities, whereas ADR premiums vary
greatly for different ADRs and are negative for some of them (e.g. Dr Reddy’s (RDY)
and Tata Motors (TTM)).

32
Segmented Markets / Market Inefficiency
As we have mentioned earlier, ADRs are a pure derivative of the underlying
equity with exactly similar cash flow and dividend rights. In other words, the risk-return
characteristics of ADRs and underlying equity are same. Given this fact, if the prices of
the ADR and the underlying equity still differ, it may be attributed to difference in
investor preferences i.e. a market irrationality. In this context regard, we would like to
mention the three comparable cases in contemporary finance that we touched upon in
Section I (Introduction) –
• Royal Dutch/ Shell group conundrum – From 1907 till June 2005, Royal Dutch
Shell group was a joint venture between Royal Dutch Petroleum Company (RDP) of the
Netherlands and the Shell Transport and Trading Company plc (STT) of UK in the ratio
60:40. These two companies jointly owned all the operating companies in the group (and
nothing else i.e. no other assets) and all earnings was always divided 60/40 in favor of
Royal Dutch. However, the market prices of RDP and STT were never in the ratio of
60:40, even though both companies had claim to exactly the same cash flows (in 60:40
ratio), with similar risk-return characteristics. The difference in dividend policies of RDP
and STT has been put forward as a possible reason for difference in share prices of RDP
and STT (after adjusting for shareholding ratio in JV). However, a crucial difference here
is that, in the case of ADRs, the dividend cash flows for ADRs and the underlying equity
are exactly equal.
33
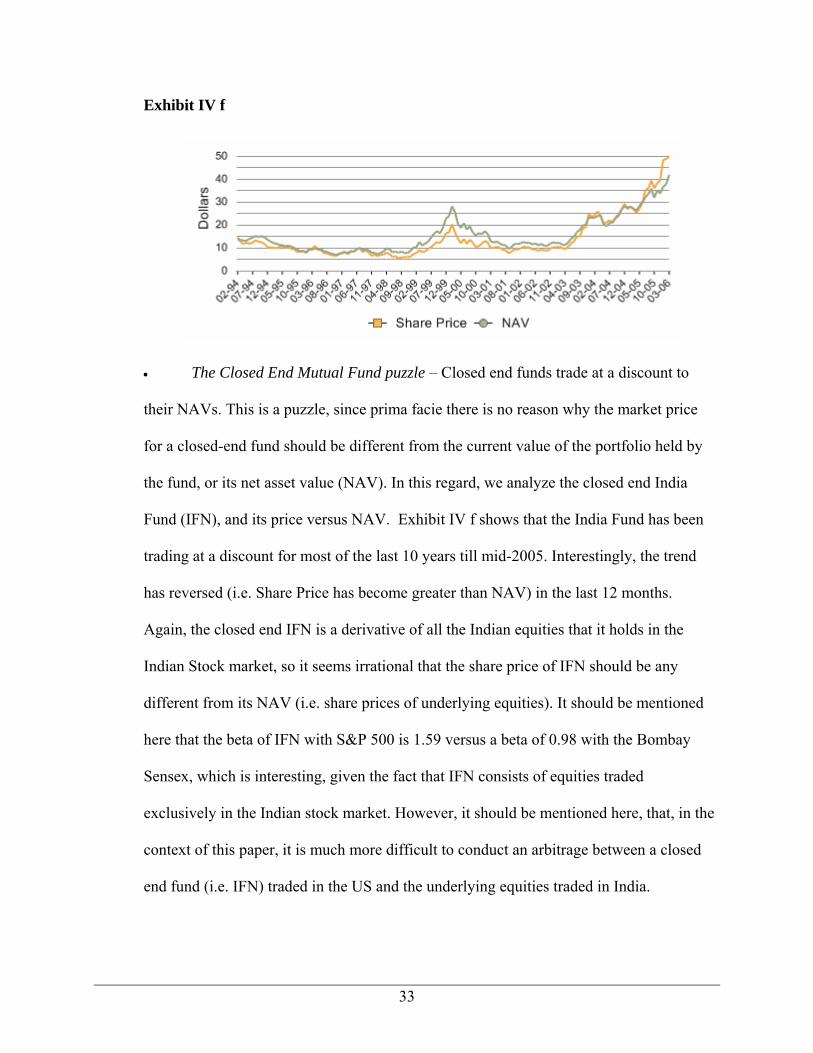
Exhibit IV f
• The Closed End Mutual Fund puzzle – Closed end funds trade at a discount to
their NAVs. This is a puzzle, since prima facie there is no reason why the market price
for a closed-end fund should be different from the current value of the portfolio held by
the fund, or its net asset value (NAV). In this regard, we analyze the closed end India
Fund (IFN), and its price versus NAV. Exhibit IV f shows that the India Fund has been
trading at a discount for most of the last 10 years till mid-2005. Interestingly, the trend
has reversed (i.e. Share Price has become greater than NAV) in the last 12 months.
Again, the closed end IFN is a derivative of all the Indian equities that it holds in the
Indian Stock market, so it seems irrational that the share price of IFN should be any
different from its NAV (i.e. share prices of underlying equities). It should be mentioned
here that the beta of IFN with S&P 500 is 1.59 versus a beta of 0.98 with the Bombay
Sensex, which is interesting, given the fact that IFN consists of equities traded
exclusively in the Indian stock market. However, it should be mentioned here, that, in the
context of this paper, it is much more difficult to conduct an arbitrage between a closed
end fund (i.e. IFN) traded in the US and the underlying equities traded in India.

34
• 3Com/Palm case – On September 13, 1999 3Com announced its intentions to take
one of its subsidiaries, Palm Computing (a leading manufacturer of handheld devices),
public the following year. On March 2, 2000 Palm became publicly traded on the Nasdaq
National Market. 3Com sold a 6% stake at $38 a share which was well above the initial
$14 to $16 range. At the time of the IPO, 3Com announced its intention to divest its
remaining 94% ownership to 3Com shareholders within six months. On the first day of
trading, Palm opened at $145, reaching a high of $165 before ending the day at $95.06.
This stock price translated to a $53.4 billion value for Palm in contrast to 3Com’s $28.5
billion value. Based on 3Com’s 94% ownership, 3Com’s stake in Palm was worth
approximately $50 billion, giving substantial negative value to 3Com’s other assets, an
almost perfect violation of the law of one price. 1
A possible explanation for this anomaly has been the restrictions on arbitrage i.e.
short selling Palm (and going long 3Com), due to a very small number of Palm shares
available in the market. This effectively made arbitrage very difficult. In context of this
paper, it is worth stating that although Palm was a part of 3Com but did not share the
risk-return characteristics of 3Com in entirety (unlike ADR-underlying equity
combination)
Further, since 3Com had announced its intention to divest Palm completely within
six months, the arbitrage had to necessarily go away at the time of divestment i.e. 3Com
1 “The Valuation and Market Rationality of Internet Stock Prices” – Ofek & Richardson, 2001 “The Parent Company Puzzle – When is the whole less than one of its parts?” – Cornell & Liu, 2000

35
and Palm share prices (adjusted for share exchange ratio) had to converge. In contrast, in
case of ADRs, there is no event (like divestment / merger) that would necessarily cause
the prices of the underlying and the ADR to converge.
In any case, the three cases above do provide though provoking examples of
market inefficiencies, where securities with similar risk-return characteristics were valued
very differently by same / different investors. Continuing this line of thought, we propose
that a possible reason for the continued existence of ADR premiums is the difference in
perceptions of the investors in US markets versus the investors in Indian markets.
Although difficult to substantiate, this implies that there is a distinct dichotomy in the
way these two markets are behaving as regards ADR premiums. Given the fact that there
are no information asymmetries (as regards ADRs) and capital flow restrictions, it seems
difficult that segmentation of markets may be a possible cause of ADR premiums.
However, as we discussed in Section III, the absence of sufficient “headroom” is causing
significant barriers to arbitrage and a veritable impediment to free flow of capital i.e. a
segmentation of US and Indian stock markets. In the absence of sufficient “headroom”,
arbitrage between the higher ADR prices and lower underlying equity prices seems quite
difficult, which has allowed the ADR premiums (i.e. a market inefficiency) to persist for
a long time. The magnitude of ADR premiums and the high correlations of certain ADRs
(with relatively higher premiums) to S&P 500 seem to indicate the difference in investor
expectations in US and India as a possible cause of ADR premiums.

36
V EPILOGUE
Current Data
February 1 (Bloomberg) -- The following table of American and global depositary receipts of
Indian companies compares their closing prices with the most recent closes in local
trading. Price adjustments are based on a currency value of 44.12 rupee per dollar, along
with the number of shares per ADR or GDR.
*T
ADR/GDR Local Local ADR/GDR Shares/
Company Ticker Close % Chg Equiv. Close % Prem ADR/GDR
Dr Reddy's RDY 25.60 +0.24 1,129.42 1,119.60 +0.88 1.0
HDFC Bank HDB 59.44 +4.56 874.12 762.55 +14.63 3.0
ICICI Bank IBN 31.42 +0.03 693.09 609.15 +13.78 2.0
Infosys Technologies INFY 76.22 +1.09 3,362.67 2,879.70 +16.77 1.0
MTNL MTE 7.36 -0.68 162.35 141.70 +14.58 2.0
Ranbaxy Labs RBXD 9.23 +0.87 407.21 399.10 +2.03 1.0
Reliance Industries RIGD 33.50 +0.66 738.98 713.70 +3.54 2.0
Satyam Computers SAY 39.20 -0.73 864.71 746.65 +15.81 2.0
State Bank of India SBID 46.17 -3.41 1,018.46 886.80 +14.85 2.0
Tata Motors TTM 16.06 +2.23 708.54 709.30 -0.11 1.0
Wipro WIT 14.85 +1.23 655.15 529.90 +23.64 1.0
The ADR premiums have declined further since July 2005 (when we initiated the
research). For Infosys itself the premium is down from 39% to 16.7% currently. Given
the fact that INFY ADR premium has been, on an average 50% in last 5 years, and was as
high as 39% in July 2005, a decline of 23% is phenomenal indeed. Other ADRs that have
experienced similar trend (though not as spectacular) are RIGD (average - 37%, current –
4%), SAY (average - 23%, current – 16%) and SBID (average - 22%, current – 15%).

37
The average ADR premium is down to 11% now, which is a significant decline.
Even though real arbitrage seems difficult in case of Indian ADRs, it is possible for
investors to short the ADRs in US, go long the Indian equity and invest the difference in
risk-free securities. Since the correlation between ADRs and underlying equity is over
90%, the equity risk is somewhat hedged in such a transaction (even though the beta of
ADR for underlying equity is 0.56). Also, ADR premium should more than compensate
investors for the hedging cost of currency risk. The balance amount is, of course, “quasi”
- arbitrage profit. Of course, such a transaction is predicated on the investors receiving
the proceeds of short sale and borrowing costs (of ADRs short sold) being minimal.
Summary
We summarize the results of our analyses with the following observations.
Premiums on ADRs of Indian companies have been in existence for some time
(around 5 years, starting 1999 till date), and the phenomenon is unique to Indian ADRs,
vis-à-vis ADRs from other countries. Although, the ADR premiums have been trending
down for some time lately, the average premium was still around 16% in 2005. The
ADRs returns appear to be more sensitive to US stock markets, than the Indian stock
markets and the underlying equity. More interestingly, the ADR prices do not move in
lock-step with the prices of underlying equity, despite sharing exactly the same risk-
return characteristics.
38
Certain institutional framework issues (viz. insufficient “headroom”) have had a
substantial impact on the existence ADR premiums, in that these issues make it difficult
for investors to take advantage of ADR premiums via arbitrage. Our research indicates
that the impact of liquidity and currency risk premium on ADR premiums is relatively
insignificant. A possible reason (though not conclusive) for such premiums does appear
to be segmented markets, which does indicate market inefficiency, to a degree. In this
context, we compare the phenomenon of ADR premiums to the Royal Dutch / Shell share
prices, the Closed End fund puzzle, and the 3Com-Palm case. In all the three cases,
securities with similar risk-return characteristics were valued differently by investors.
Further, the fact that ADR premiums are declining can have the following
possible analyses:
(1) Arbitrageurs have been able to effect quasi-arbitrage, which enables them to
circumvent the barriers to arbitrage in institutional framework (described in Section
III), and /or
(2) The market inefficiency is being corrected gradually, or the segmented market
hypothesis is being eliminated as investor expectation finally converge in US and
Indian markets.

1
APPENDIX I
Description1 India Hong Kong2 Germany South Korea
Portfolio
Investment
Foreign institutional
investors (FIIs) may invest
directly in all securities
traded on the primary and
secondary markets in India,
subject to certain caps
No specific restrictions
apply to portfolio
investment, and foreign
investors may place funds
directly in the stock and
bond markets.
No obstacles exist to
raising and moving capital
in Germany.
Markets totally
liberalized since 1997
crises. Even unlisted
stocks and derivatives
available for unlimited
foreign investment. No
individual or aggregate
ceilings exist.
1 Source: Economist Intelligence Unit, The Economist 2 The underlying stock for ADRs of Chinese shares on the US stock exchanges are the shares of Chinese companies listed on Hong Kong Stock Exchange (called ‘H’ shares). These shares have been issued primarily for foreign investors, trade at a lower PE compared to shares listed on the Chinese Stock Exchanges (called ‘A’ & ‘B’ shares) and are subject to securities markets rules of Hong Kong.
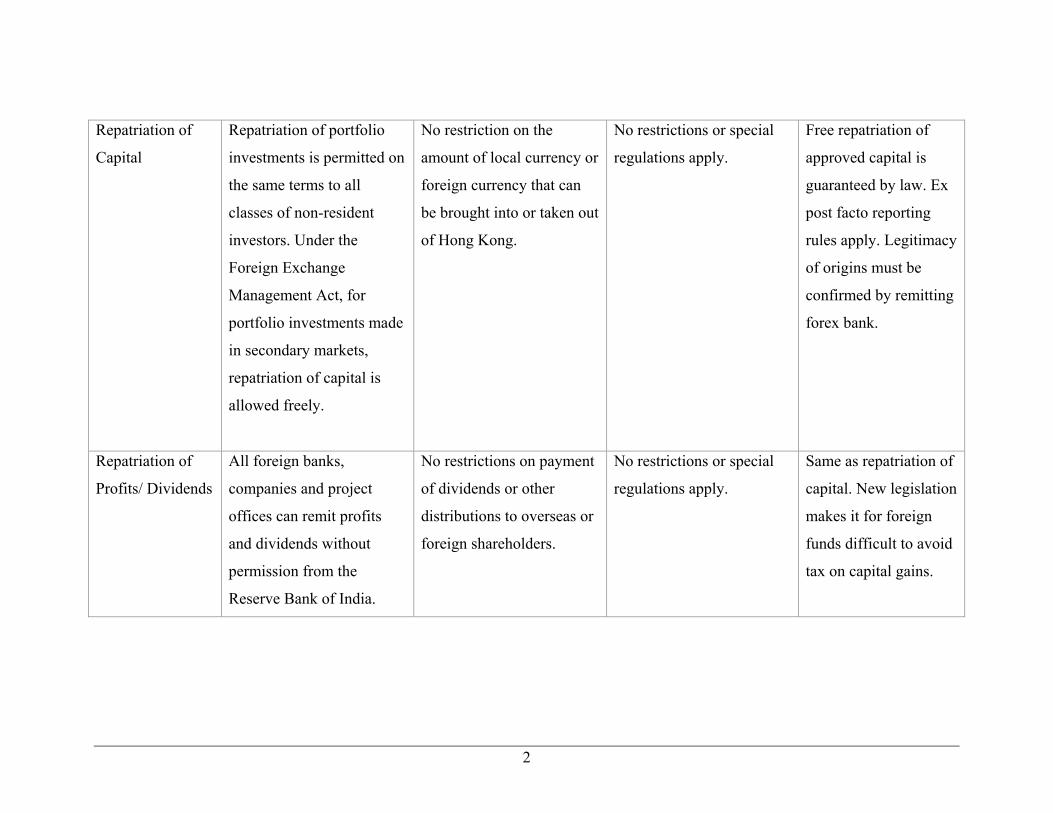
2
Repatriation of
Capital
Repatriation of portfolio
investments is permitted on
the same terms to all
classes of non-resident
investors. Under the
Foreign Exchange
Management Act, for
portfolio investments made
in secondary markets,
repatriation of capital is
allowed freely.
No restriction on the
amount of local currency or
foreign currency that can
be brought into or taken out
of Hong Kong.
No restrictions or special
regulations apply.
Free repatriation of
approved capital is
guaranteed by law. Ex
post facto reporting
rules apply. Legitimacy
of origins must be
confirmed by remitting
forex bank.
Repatriation of
Profits/ Dividends
All foreign banks,
companies and project
offices can remit profits
and dividends without
permission from the
Reserve Bank of India.
No restrictions on payment
of dividends or other
distributions to overseas or
foreign shareholders.
No restrictions or special
regulations apply.
Same as repatriation of
capital. New legislation
makes it for foreign
funds difficult to avoid
tax on capital gains.
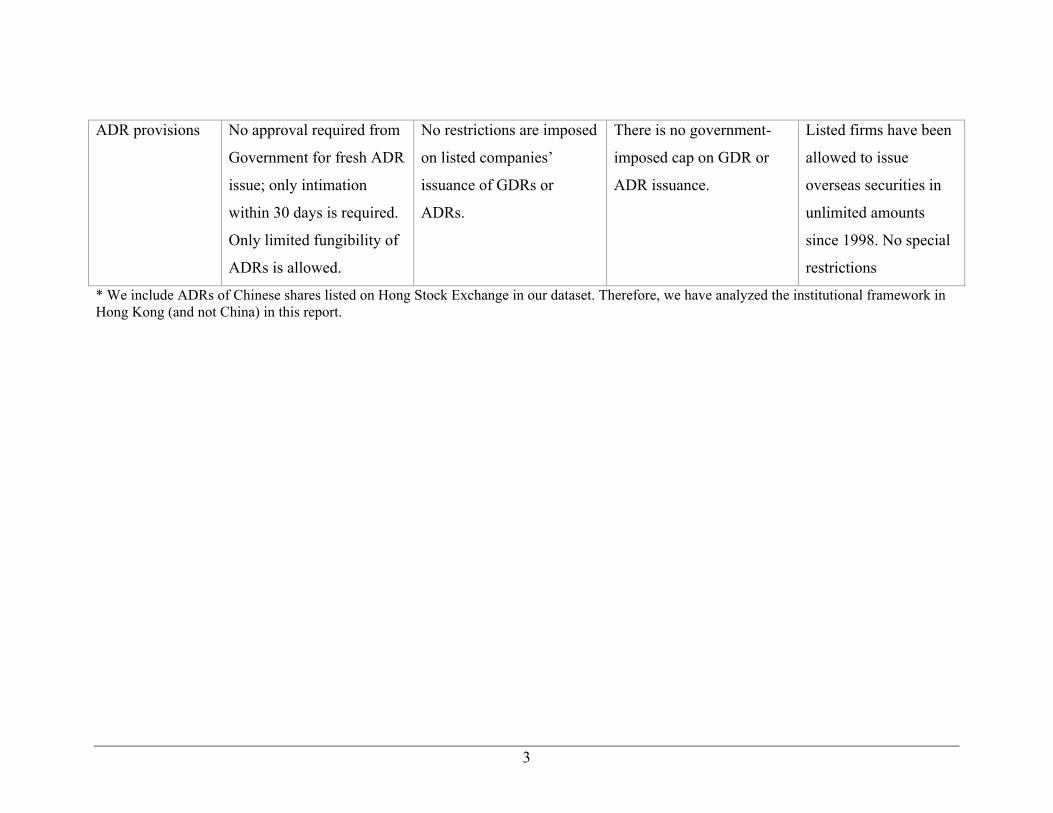
3
ADR provisions No approval required from
Government for fresh ADR
issue; only intimation
within 30 days is required.
Only limited fungibility of
ADRs is allowed.
No restrictions are imposed
on listed companies’
issuance of GDRs or
ADRs.
There is no government-
imposed cap on GDR or
ADR issuance.
Listed firms have been
allowed to issue
overseas securities in
unlimited amounts
since 1998. No special
restrictions
* We include ADRs of Chinese shares listed on Hong Stock Exchange in our dataset. Therefore, we have analyzed the institutional framework in Hong Kong (and not China) in this report.
4
India1
Portfolio Investment
FIIs include pension funds, mutual funds, investment trusts, insurance or re-
insurance companies, asset-management companies, incorporated institutional portfolio
managers, university funds, endowments, foundations and charitable trusts/societies with a
track record. Secondary stock market operations are permitted only through registered
intermediaries on the Indian stock exchanges. FIIs are permitted to lend their securities
through an approved intermediary.
Portfolio investments are subject to an aggregate ceiling of 24% of paid-up equity
capital in one company for registered FIIs and sub-accounts, with a sub-ceiling of 10% for
any one FII. Indian companies can increase this 24% limit up to the FDI cap in the relevant
sector, provided the company’s board of directors approves the move and the general body
of the corporation passes a resolution allowing it. Investments by FIIs through offshore
single/regional funds, Global Depositary Receipts, American Depositary Receipts and
euro-convertibles are not counted towards FII limits.
1 Economist Intelligence Unit, The Economist
5
FIIs that are asset-management companies, investment advisers, nominee
companies, institutional portfolio managers, trustees, power-of-attorney holders or banks
may invest on behalf of sub-accounts. A sub-account can be a foreign company or
individual, an institution, fund or portfolio established outside India. In the case of a fund
or portfolio, it must be “broad-based”, meaning that it should have at least 20 investors,
with no single individual investor holding more than 10% of its shares or units. The
registration process for sub-accounts is simpler: FIIs need only submit details of sub-
accounts, an undertaking and a registration fee of US$1,000. The SEBI registers them
within three working days.
Repatriation of capital
Repatriation of capital is permitted for any class of foreign investor, including non-
resident Indians (NRIs) and foreign institutional investors (FIIs), if the original capital was
remitted from abroad in foreign currency and if the equity has been sold on a stock
exchange.
This therefore excludes investments in partnerships, which are not listed. However,
NRIs can invest in partnership firms on a repatriation basis with government approval.
Repatriation of portfolio investments is permitted on the same terms to all classes of non-
resident investors. Under the Foreign Exchange Management Act, for portfolio investments
made in secondary markets, repatriation of capital is allowed freely.
6
ADR provisions
From 2000 onwards, companies no longer require approval from the Ministry of
Finance for overseas issues, but should inform both the ministry and the exchange-control
department of the Reserve Bank of India (RBI) within 30 days of the issue. This rule
applies to companies issuing ADRs/GDRs for the first time and those issuing a fresh set of
ADRs/GDRs, provided that they issue new equity shares to support the offering and
expand their capital bases. This automatic route also applies to the issue of employee stock
options in the form of ADRs/GDRs by Indian software and other IT companies.
In February 2002 the RBI permitted limited two-way fungibility of ADRs/GDRs,
meaning that ADRs or GDRs that have been converted into local shares can be converted
back into ADRs or GDRs. This applies only to re-conversions. In November 2002 the RBI
allowed Indian companies to sponsor ADR/GDR issues with overseas depositories against
the shares held by their shareholders. In February 2003 it further said that resident
shareholders that offer their shares for such conversions could receive the proceeds in
foreign currency.
As per limited fungibility, any broker can convert shares to ADR but only to the
extent of past conversion of ADRs in that company into shares. This is called ‘Headroom’.
7
So up to the point that headroom is not fully utilized, anybody can buy in local market and
convert to ADR and pocket the profit.
The other way to convert local shares to ADRs is very cumbersome and time
consuming. This also requires regulatory permission. Also, the company has to pass a
special resolution and appoint a merchant banker and make sure that an opportunity is
given to all the shareholders to participate in this process.
Hong Kong1
Hong Kong, subject to Chinese sovereignty but not its legal jurisdiction, has been
good source of funds for companies in mainland China. More than 150 mainland
companies were listed there in July 2005. The China Securities Regulatory Commission
(CSRC) must examine and approve companies that intend to issue Hong Kong–listed H-
shares. Furthermore, they need to bring their articles of association and their activities into
conformance with the provisions of the Company Law, in addition to the necessary clauses
for the articles of association of companies to be listed in Hong Kong.
ADR provisions
1 Economist Intelligence Unit, The Economist
8
As per regulations, the depositary banks can create ADRs if investor(s) deliver H
shares along with payment of applicable issuance fees/ taxes/ other charges. Additionally,
investors are entitled to present ADRs to depositary bank for cancellation and then receive
corresponding number of underlying shares, on payment of applicable cancellation fees/
taxes/ other charges.
Germany1
Portfolio Investments
Foreign corporations and non-residents are free to acquire securities of any
maturity. These include German stocks, bonds, money-market instruments or any other
portfolio instruments. There is substantial liquidity in government bonds, Pfandbriefe
(asset-backed, particularly mortgage bonds), and blue-chip stocks, and a growing interest in
corporate bonds, too.
South Korea2
Portfolio investment
1 Source: Economist Intelligence Unit, The Economist 2 Source: Economist Intelligence Unit, The Economist
9
Foreign portfolio investment is governed by the Foreign Exchange Transaction Act
and the Securities and Exchange Act. Foreign portfolio investment began with the opening
of the country’s equity market in 1992. Bonds and money-market instruments were off
limits to foreign investors until late 1997. The closed markets were due to apprehensions
regarding the large gap between prevailing international and domestic interest rates (once
more than 5 percentage points above US Treasuries) which could have caused a flood of
“hot” money.
The financial crisis of 1997 completely changed the scenario and during 1998–99,
foreign portfolio investment in local stocks, bonds and money-market instruments was
almost completely liberalized, as follows:
• Since December 1997 foreign investors have been allowed to invest in listed public and
corporate bonds without restrictions.
• Since May 1998 the money market has been completely opened up to foreign investment,
with certificates of deposit, repurchase agreements and other instruments freely traded for
foreign investors’ accounts. (Commercial paper and trade bills became available in
February 1998.)
• Since May 1998 foreign investment in stocks listed on the Korea Stock Exchange and the
Kosdaq market (both of which are now part of the Korea Exchange) has been fully
liberalized, with no individual or aggregate ceilings. Futures and options are also freely
available, and foreigners can also subscribe to rights issues.
• In July 1999 unlisted stocks and bonds became available for unlimited foreign investment.

10
Foreign portfolio investors can also invest in stock or bond investment trusts and
mutual funds. A purchase of a stake of less than 10% in a South Korean company by a non-
resident investor must be reported to a relevant forex bank. If it involves a stock swap
(listed stocks only), then the Bank of Korea must be notified.
Repatriation of capital
Free repatriation of approved capital is guaranteed by law. No restrictions or
requirements exist for reinvestment of profits. However, the forex bank that transfers
repatriated capital must confirm the legitimacy of its origins. All remittances must be made
from the same account at a designated forex bank, a rule that also applies to personal
remittances. Ex post facto reporting rules set by the Foreign Exchange Transaction Act
apply.
Remittance of dividends and profits
Free remittance of dividends and profits is guaranteed by law. However, forex banks
conducting business with the foreign investors must verify the legitimacy of such
remittances. Ex post facto reporting rules set by the Foreign Exchange Transaction Act
apply.
New legislation is making it more difficult for foreign funds—most notably US
investment funds—operating from tax-haven outposts around the world to take profits out
of South Korea in tax-free dollars under the conventional protection of bilateral tax treaties.
A new special provision written into the existing Law for the Co-ordination of International
Tax Affairs allows the National Tax Service (NTS) to levy local withholding taxes on

11
dividends, interest, and capital gains collected by foreign funds registered in some tax-
haven jurisdictions, irrespective of any bilateral tax treaties that permit tax-free repatriation
of profits. The measure, included in South Korea's annual tax-reform package effective in
January 2006, should affect the operations of private-equity funds and other investment
funds doing business in South Korea.
GDRs/ADRs provisions
Global Depositary Receipts (GDRs) and American Depositary Receipts (ADRs) are
available and are a popular source of overseas funds for South Korean firms. GDRs/ADRs
issued by blue-chip companies such as POSCO, Korea Electric Power, Samsung
Electronics, Hyundai Motor and KB (Kookmin Bank) are traded on exchanges in New
York, London and Luxembourg.
Listed firms have been allowed to issue overseas securities in unlimited amounts
since 1998, and practically all remaining restrictions on GDR/ADR issues (such as
minimum dividend pay-outs) disappeared in that year. Companies seeking to issue
GDRs/ADRs based on their own shares bought back from shareholders can do so
immediately after they complete the buyback program. GDRs/ADRs can be issued in
private placements. Since 2001, companies have been able to offer GDRs/ADRs at a
discount larger than the official limit of 30%, with approval from the Financial Supervisory
Commission.

12
APPENDIX II Regression Analysis: Wip D (ADR premium) versus Wip A (Amihud measure differential) The regression equation is Wip D = 0.184 - 0.000555 Wip A Predictor Coef SE Coef T P Constant 0.18441 0.01984 9.29 0.000 Wip A -0.0005547 0.0001934 -2.87 0.006 S = 0.142236 R-Sq = 12.4% R-Sq(adj) = 10.9% Analysis of Variance Source DF SS MS F P Regression 1 0.16641 0.16641 8.23 0.006 Residual Error 58 1.17341 0.02023 Total 59 1.33982 Unusual Observations Obs Wip A Wip D Fit SE Fit Residual St Resid 7 506 -0.0200 -0.0965 0.0923 0.0765 0.71 X 8 317 0.0200 0.0083 0.0569 0.0117 0.09 X 10 450 0.0200 -0.0650 0.0815 0.0850 0.73 X 46 0 0.5100 0.1843 0.0198 0.3257 2.31R R denotes an observation with a large standardized residual. X denotes an observation whose X value gives it large influence. Regression Analysis: Infy D (ADR premium) versus Infy A (Amihud measure differential) The regression equation is Infy D = 0.498 - 0.000012 Infy A Predictor Coef SE Coef T P Constant 0.49758 0.01578 31.53 0.000 Infy A -0.00001216 0.00006152 -0.20 0.844
13
S = 0.120107 R-Sq = 0.1% R-Sq(adj) = 0.0% Analysis of Variance Source DF SS MS F P Regression 1 0.00056 0.00056 0.04 0.844 Residual Error 58 0.83670 0.01443 Total 59 0.83726 Unusual Observations Obs Infy A Infy D Fit SE Fit Residual St Resid 23 29 0.7600 0.4972 0.0155 0.2628 2.21R 25 1977 0.4400 0.4735 0.1197 -0.0335 -3.38RX 58 -0 0.2300 0.4976 0.0158 -0.2676 -2.25R 59 0 0.2400 0.4976 0.0158 -0.2576 -2.16R 60 0 0.2200 0.4976 0.0158 -0.2776 -2.33R R denotes an observation with a large standardized residual. X denotes an observation whose X value gives it large influence. Regression Analysis: IBN d (ADR premium) versus IBN A (Amihud measure differential) The regression equation is IBN d = 0.123 - 0.000280 IBN A Predictor Coef SE Coef T P Constant 0.12327 0.01044 11.81 0.000 IBN A -0.0002799 0.0001663 -1.68 0.098 S = 0.0758329 R-Sq = 4.7% R-Sq(adj) = 3.0% Analysis of Variance Source DF SS MS F P Regression 1 0.016282 0.016282 2.83 0.098 Residual Error 58 0.333537 0.005751 Total 59 0.349818
14
Unusual Observations Obs IBN A IBN d Fit SE Fit Residual St Resid 4 7 -0.04000 0.12135 0.01010 -0.16135 -2.15R 6 177 -0.03000 0.07369 0.02763 -0.10369 -1.47 X 7 -0 -0.04000 0.12337 0.01046 -0.16337 -2.18R 9 13 -0.05000 0.11975 0.00991 -0.16975 -2.26R 21 413 0.05000 0.00763 0.06583 0.04237 1.13 X R denotes an observation with a large standardized residual. X denotes an observation whose X value gives it large influence.
15
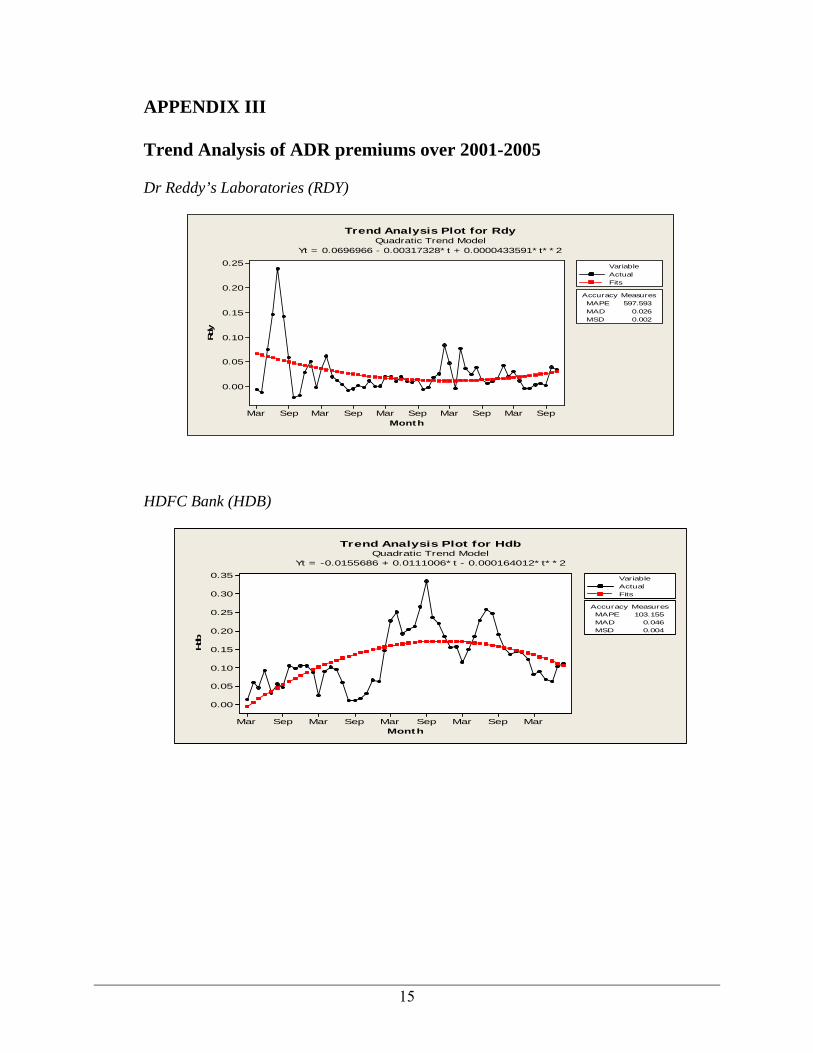
APPENDIX III
Trend Analysis of ADR premiums over 2001-2005 Dr Reddy’s Laboratories (RDY)
Month
Rdy
SepMarSepMarSepMarSepMarSepMar
0.25
0.20
0.15
0.10
0.05
0.00
Accuracy MeasuresMAPE 597.593MAD 0.026MSD 0.002
VariableActualFits
Trend Analysis Plot for RdyQuadratic Trend Model
Yt = 0.0696966 - 0.00317328*t + 0.0000433591*t**2
HDFC Bank (HDB)
Month
Hdb
MarSepMarSepMarSepMarSepMar
0.35
0.30
0.25
0.20
0.15
0.10
0.05
0.00
Accuracy MeasuresMAPE 103.155MAD 0.046MSD 0.004
VariableActualFits
Trend Analysis Plot for HdbQuadratic Trend Model
Yt = -0.0155686 + 0.0111006*t - 0.000164012*t**2
16
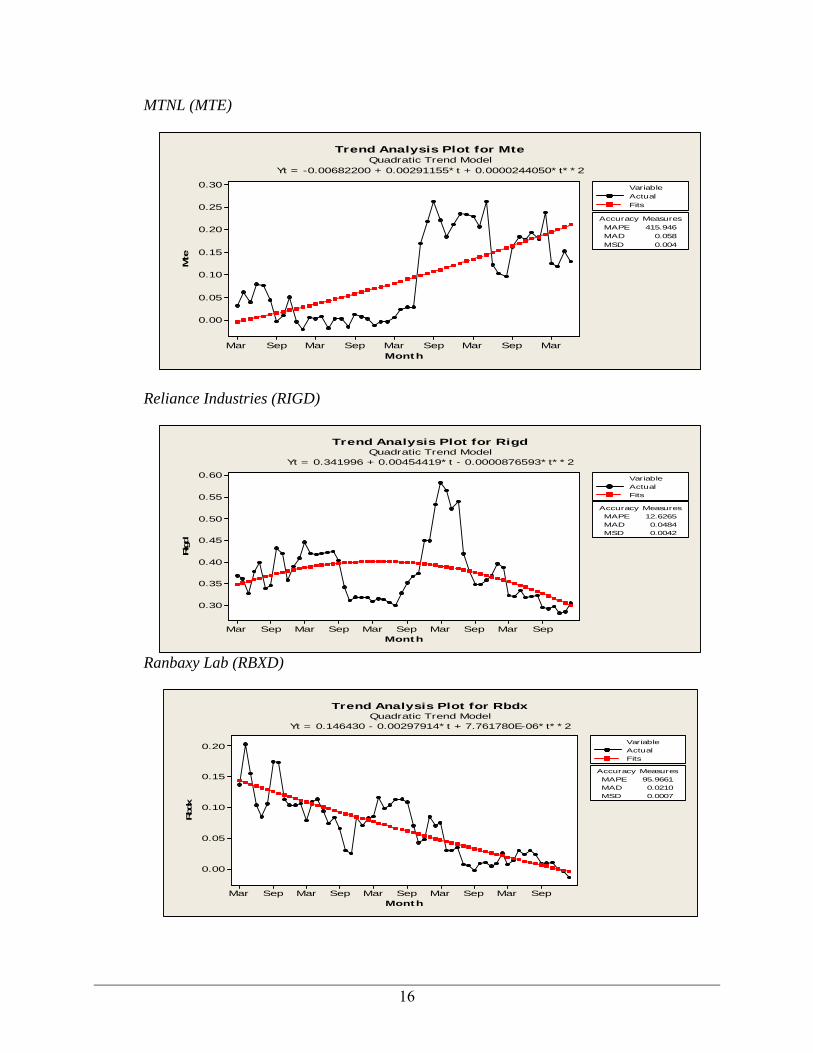
MTNL (MTE)
Month
Mte
MarSepMarSepMarSepMarSepMar
0.30
0.25
0.20
0.15
0.10
0.05
0.00
Accuracy MeasuresMAPE 415.946MAD 0.058MSD 0.004
VariableActualFits
Trend Analysis Plot for MteQuadratic Trend Model
Yt = -0.00682200 + 0.00291155*t + 0.0000244050*t**2
Reliance Industries (RIGD)
Month
Rigd
SepMarSepMarSepMarSepMarSepMar
0.60
0.55
0.50
0.45
0.40
0.35
0.30
Accuracy MeasuresMAPE 12.6265MAD 0.0484MSD 0.0042
VariableActualFits
Trend Analysis Plot for RigdQuadratic Trend Model
Yt = 0.341996 + 0.00454419*t - 0.0000876593*t**2
Ranbaxy Lab (RBXD)
Month
Rbd
x
SepMarSepMarSepMarSepMarSepMar
0.20
0.15
0.10
0.05
0.00
Accuracy MeasuresMAPE 95.9661MAD 0.0210MSD 0.0007
VariableActualFits
Trend Analysis Plot for RbdxQuadratic Trend Model
Yt = 0.146430 - 0.00297914*t + 7.761780E-06*t**2
17
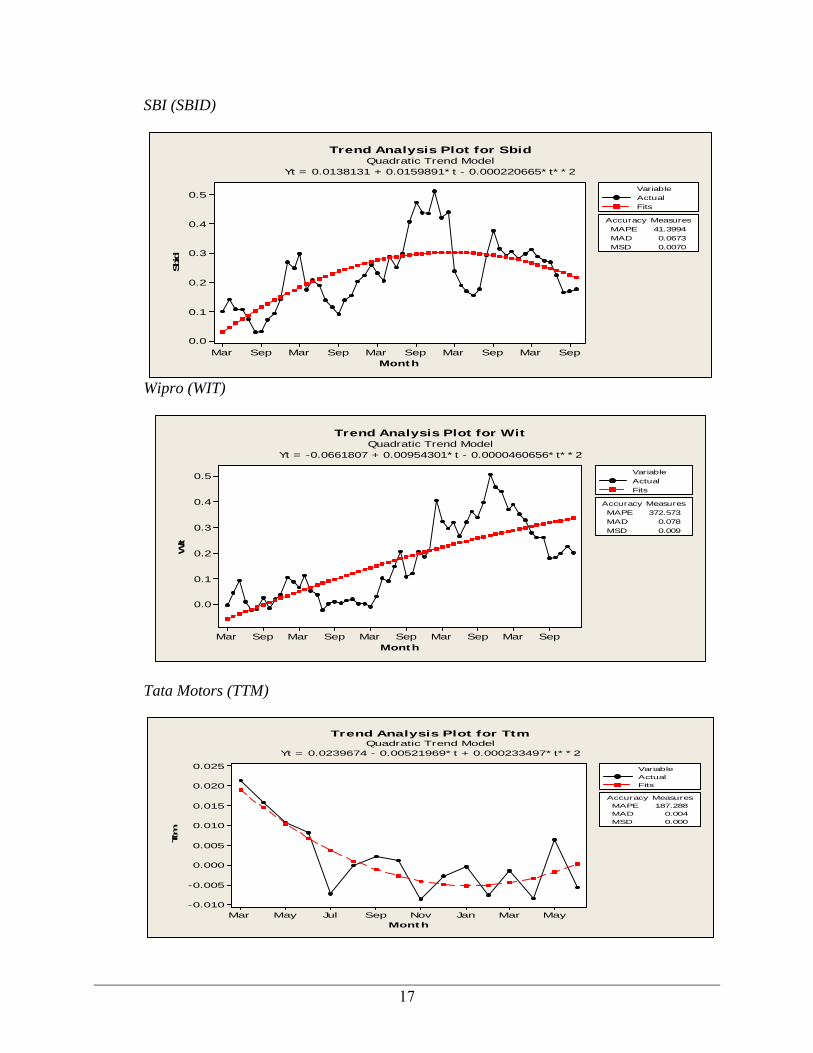
SBI (SBID)
Month
Sbid
SepMarSepMarSepMarSepMarSepMar
0.5
0.4
0.3
0.2
0.1
0.0
Accuracy MeasuresMAPE 41.3994MAD 0.0673MSD 0.0070
VariableActualFits
Trend Analysis Plot for SbidQuadratic Trend Model
Yt = 0.0138131 + 0.0159891*t - 0.000220665*t**2
Wipro (WIT)
Month
Wit
SepMarSepMarSepMarSepMarSepMar
0.5
0.4
0.3
0.2
0.1
0.0
Accuracy MeasuresMAPE 372.573MAD 0.078MSD 0.009
VariableActualFits
Trend Analysis Plot for WitQuadratic Trend Model
Yt = -0.0661807 + 0.00954301*t - 0.0000460656*t**2
Tata Motors (TTM)
Month
Ttm
MayMarJanNovSepJulMayMar
0.025
0.020
0.015
0.010
0.005
0.000
-0.005
-0.010
Accuracy MeasuresMAPE 187.288MAD 0.004MSD 0.000
VariableActualFits
Trend Analysis Plot for TtmQuadratic Trend Model
Yt = 0.0239674 - 0.00521969*t + 0.000233497*t**2