scalable exploration of relevance prospects to support decision making
TRANSCRIPT

Scalable Exploration of Relevance Prospects to
Support Decision Making
Katrien Verbert, KU Leuven Karsten Seipp, KU Leuven
Chen He, KU Leuven Denis Parra, PUC Chile
Chirayu Wongchokprasitti, University of Pittsburgh Peter Brusilovsky, University of Pittsburgh
IntRS Workshop at RecSys 2016, Boston, MA, USA

INTRODUCTION Recommender Systems: Introduction & Motivation
2
* Danboard (Danbo): Amazon’s cardboard robot, in these slides represents a recommender system
*
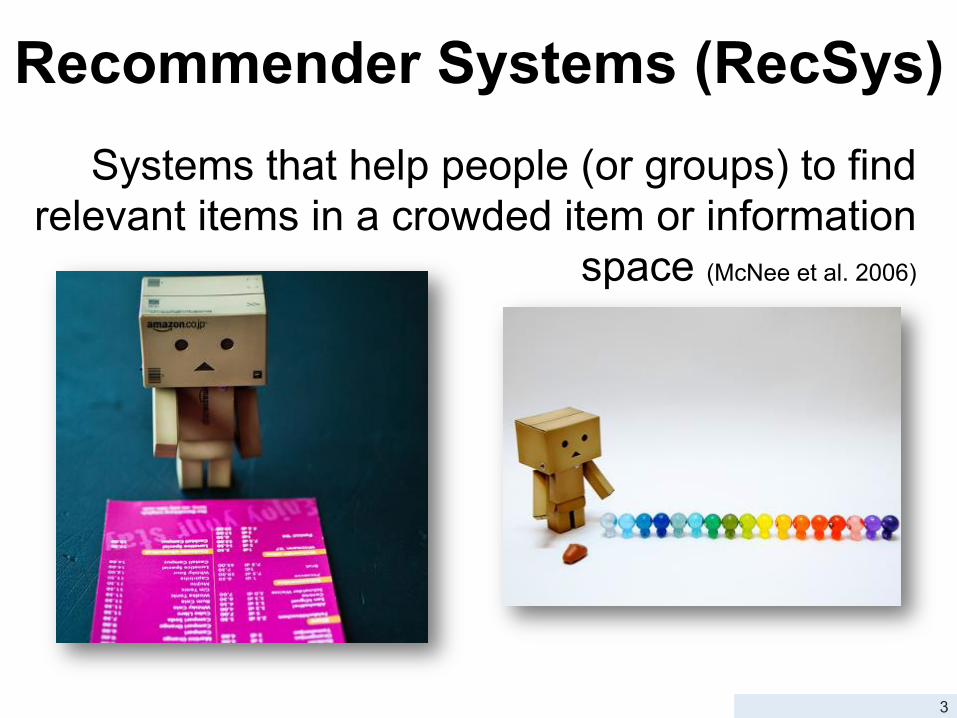
Recommender Systems (RecSys) Systems that help people (or groups) to find
relevant items in a crowded item or information space (McNee et al. 2006)
3

Challenges of RecSys Addressed Here Traditionally, RecSys has focused on producing accurate recommendation algorithms. In this research, we address these challenges: 1. HCI: Implementation of visualizations that enhance
user acceptance, trust and satisfaction of the items suggested.
2. Recommendation Tasks: Tackling exploration of recommendations, not only rating prediction or Top –N.
4
RELATED WORK OF INTERACTIVE RECSYS
Previous research related to this work / Motivating results from TalkExplorer study
5
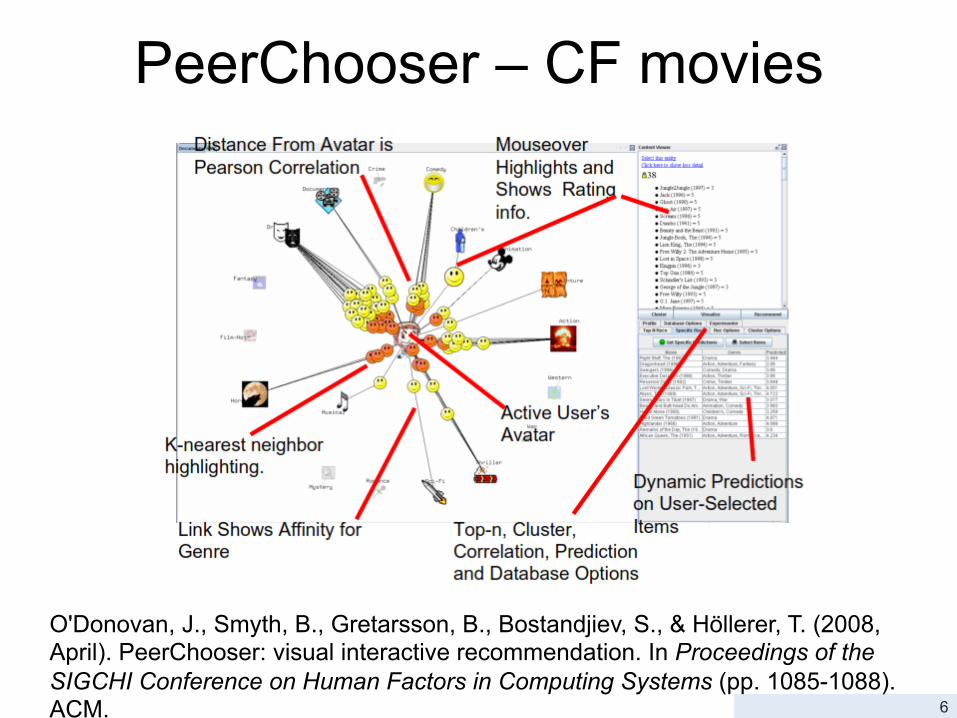
PeerChooser – CF movies
6
O'Donovan, J., Smyth, B., Gretarsson, B., Bostandjiev, S., & Höllerer, T. (2008, April). PeerChooser: visual interactive recommendation. In Proceedings of the SIGCHI Conference on Human Factors in Computing Systems (pp. 1085-1088). ACM.

SmallWorlds – CF Social
7
Gretarsson, B., O'Donovan, J., Bostandjiev, S., Hall, C., & Höllerer, T. (2010, June). Smallworlds: visualizing social recommendations. In Computer Graphics Forum (Vol. 29, No. 3, pp. 833-842). Blackwell Publishing Ltd.

TasteWeights – Hybrid Recommender
8
Bostandjiev, S., O'Donovan, J., & Höllerer, T. (2012, September). TasteWeights: a visual interactive hybrid recommender system. In Proceedings of the sixth ACM conference on Recommender systems (pp. 35-42). ACM.

9
He, C., Parra, D., & Verbert, K. (2016). Interactive recommender systems: A survey of the state of the art and future research challenges and opportunities. Expert Systems with Applications, 56, 9-27.

Our previous work: TalkExplorer
10
Verbert, K., Parra, D., Brusilovsky, P. (2016). Agents vs. users: visual recommendation of research talks with multiple dimensions of relevance. ACM Transactions on Interactive Intelligent Systems, 6(2), 1-42.

TalkExplorer - I
11
Entities Tags, Recommender Agents, Users

TalkExplorer - II
12
Recommender Recommender
Cluster with intersection of entities
Cluster (of talks) associated to only one entity
• Canvas Area: Intersections of Different Entities
User

TalkExplorer - III
13
Items Talks explored by the user

Our Assumptions • Items which are relevant in more that one aspect could be
more valuable to the users • Displaying multiple aspects of relevance visually is important
for the users in the process of item’s exploration
14
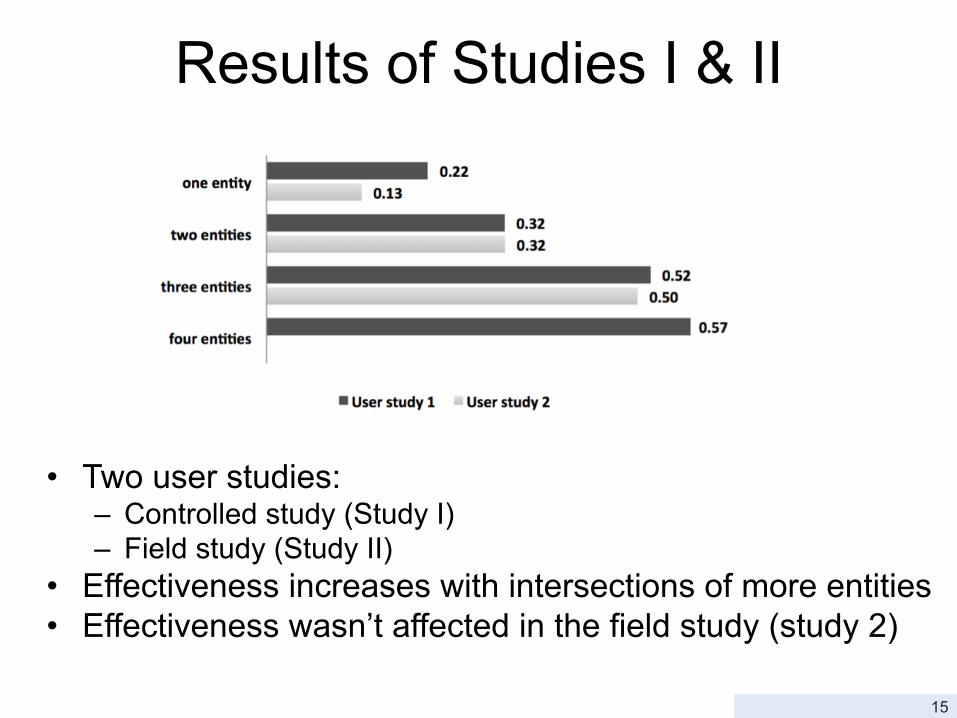
Results of Studies I & II
• Two user studies: – Controlled study (Study I) – Field study (Study II)
• Effectiveness increases with intersections of more entities • Effectiveness wasn’t affected in the field study (study 2)
15
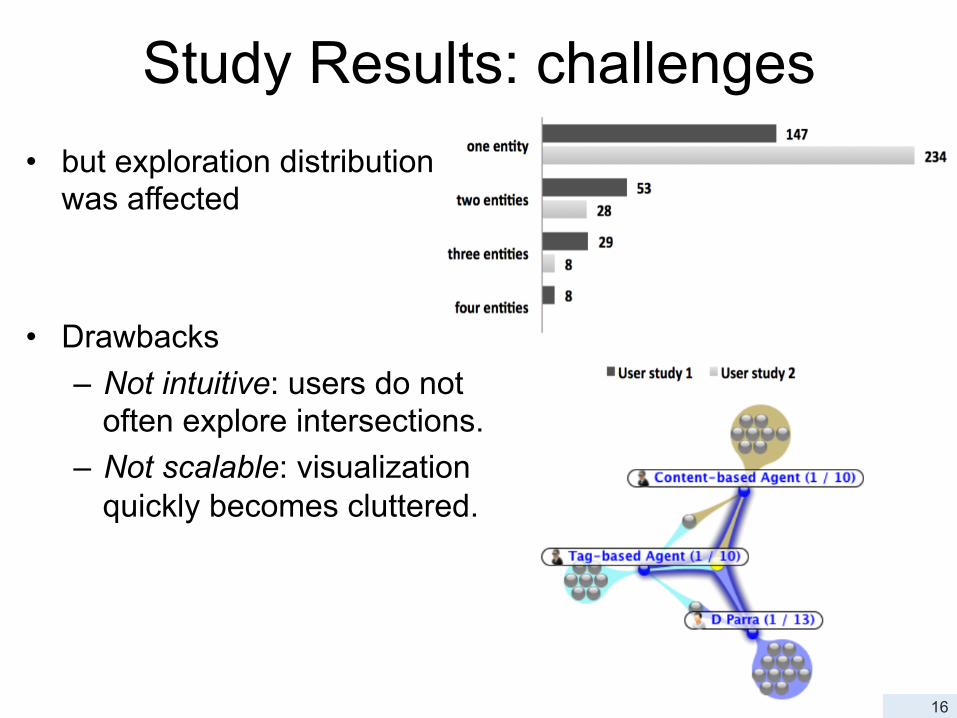
Study Results: challenges • but exploration distribution
was affected
• Drawbacks – Not intuitive: users do not
often explore intersections. – Not scalable: visualization
quickly becomes cluttered.
16

INTERSECTIONEXPLORER (IE): A SCALABLE MATRIX-BASED INTERACTIVE RECOMMENDER
17

18
IntersectionExplorer (IE)
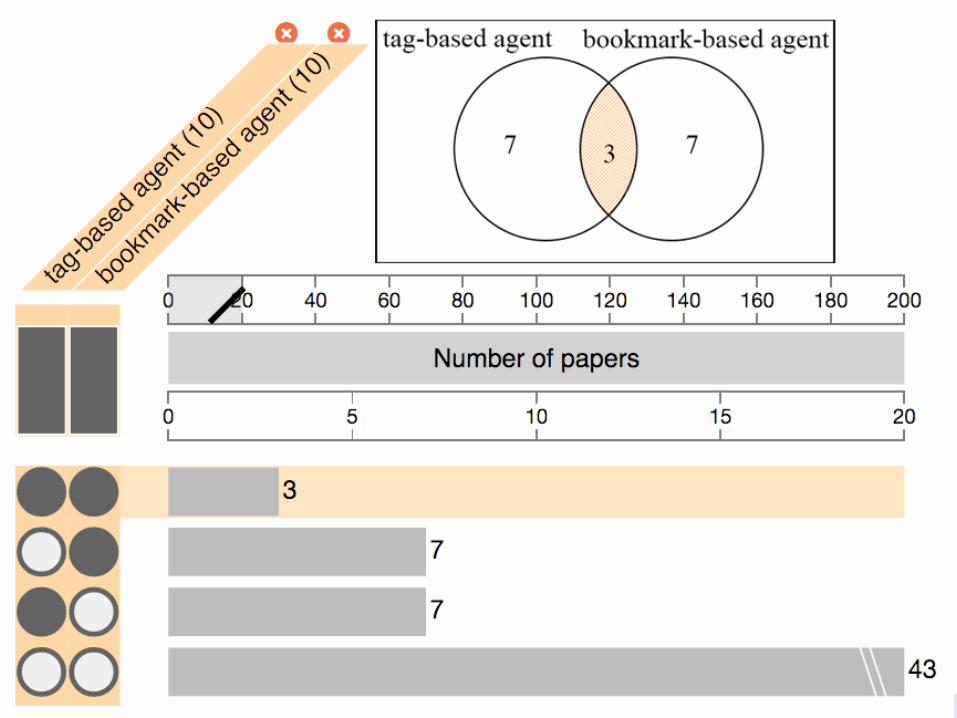
IntersectionExplorer
19

Research questions • RQ1: Under which condition may a scalable
visualisation increase user acceptance of recommended items?
• RQ2: Does a scalable set visualisation increase perceived effectiveness of recommendations.
• RQ3: Does a scalable set visualisation increase user trust in recommendations?
• RQ4: Does a scalable set visualisation improve user satisfaction with a recommender system?
20

Evaluation: Intersections & Effectiveness
What do we call an “Intersection”?
We used # explorations on intersections and their effectiveness, defined as: Effectiveness = # bookmarked items / # explorations
21
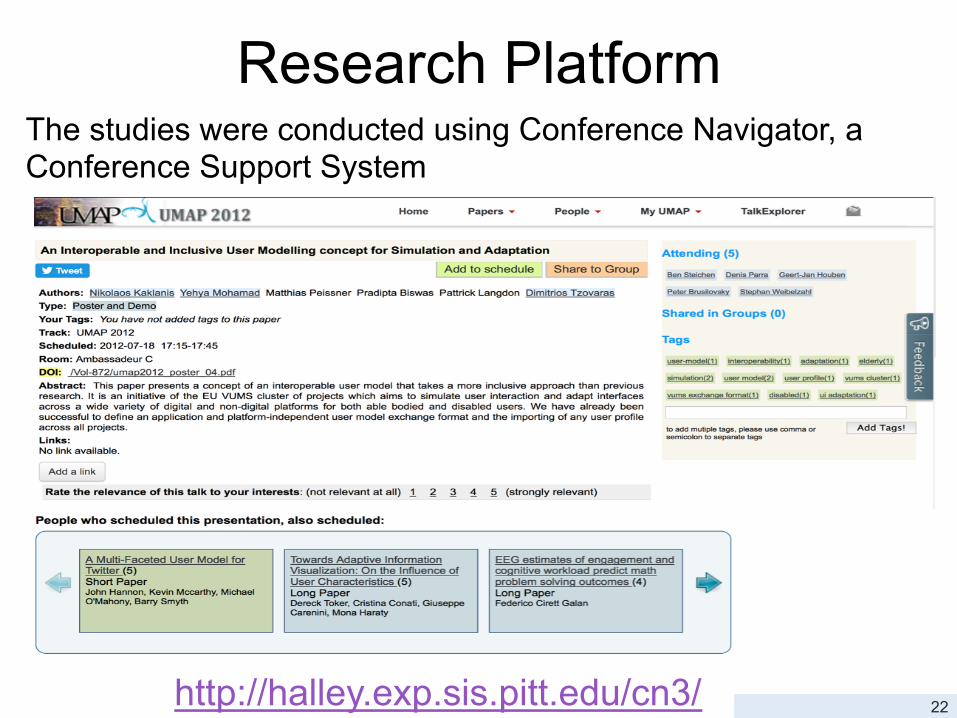
Research Platform The studies were conducted using Conference Navigator, a Conference Support System
22 http://halley.exp.sis.pitt.edu/cn3/
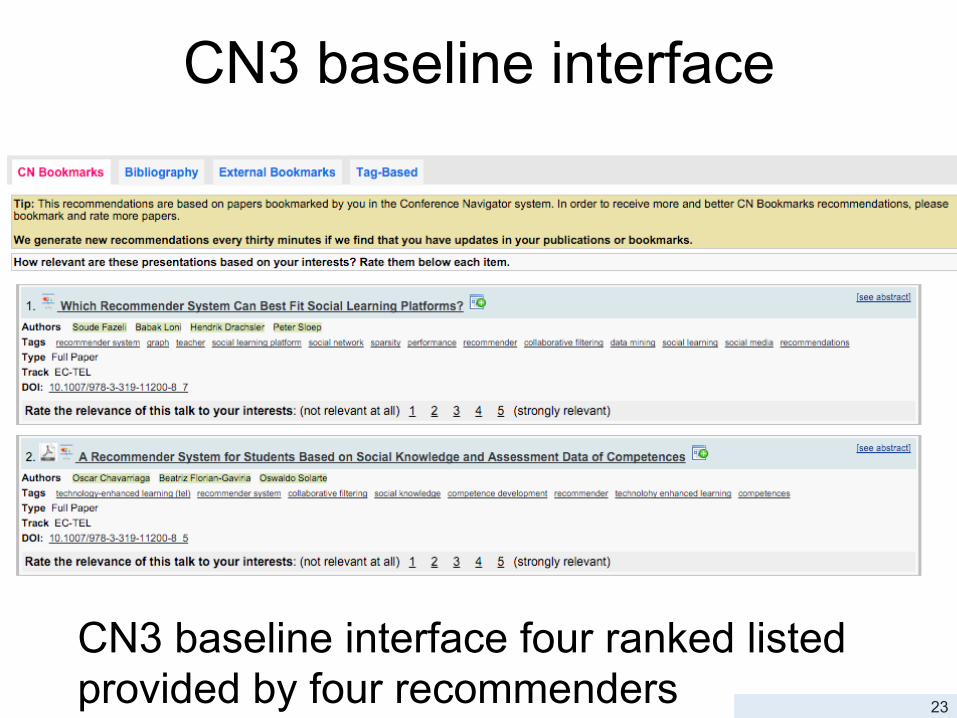
CN3 baseline interface
23
CN3 baseline interface four ranked listed provided by four recommenders

Evaluation setup • Within-subjects study with 20 users • Mean age: 32.9 years; SD: 6.32; female: 3 • Baseline: exploration of recommendations in CN3 • Second condition: exploration of recommendations in IE • Data from two conferences:
– EC-TEL 2014 (172 items) – EC-TEL 2015 (112 items)
24

STUDY RESULTS Description and Analysis of the results of the user study
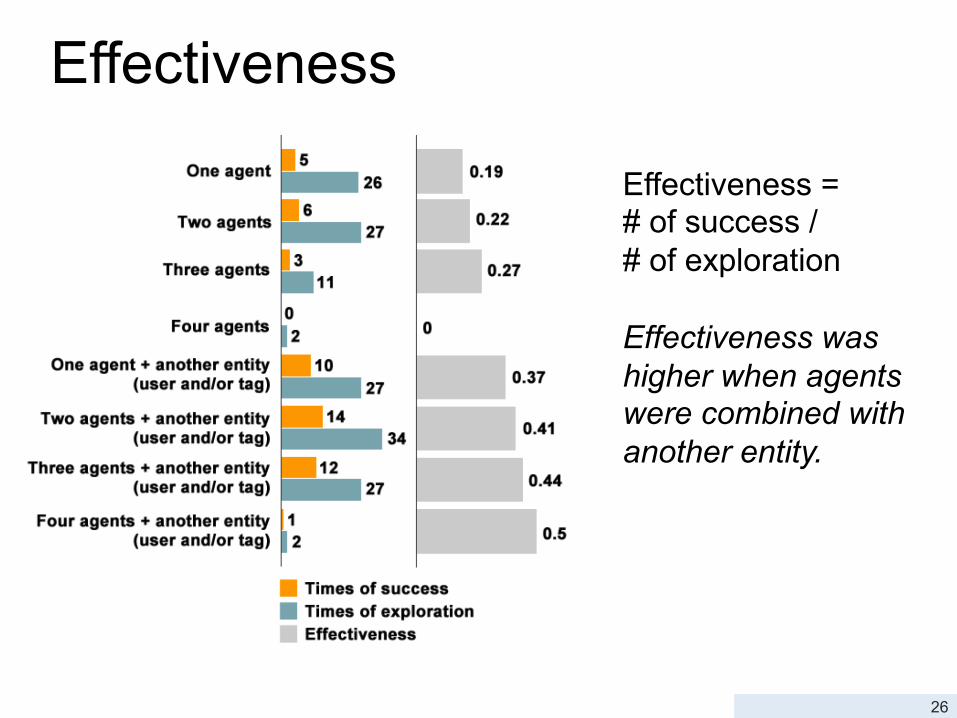
Effectiveness
26
Effectiveness = # of success / # of exploration Effectiveness was higher when agents were combined with another entity.
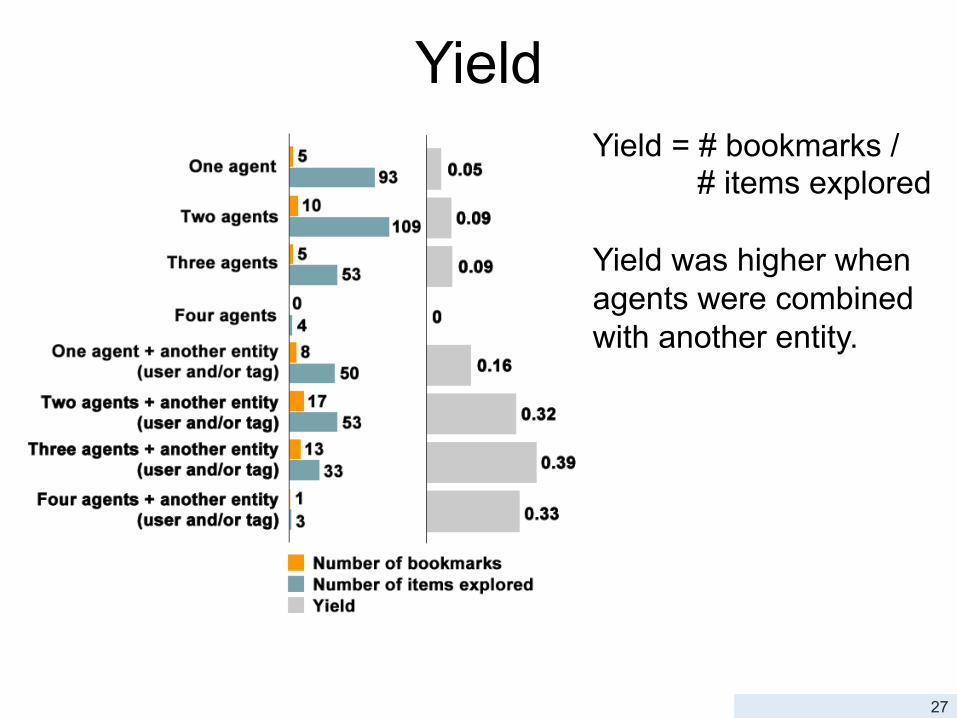
Yield
27
Yield = # bookmarks / # items explored
Yield was higher when agents were combined with another entity.

Combining different perspectives Comparing different number of perspectives (users, agents, tags)
Pearson’s correlation showed a positive correlation between number of perspectives in an exploration and yield (r = 1.0, n = 3, p = .015). 28
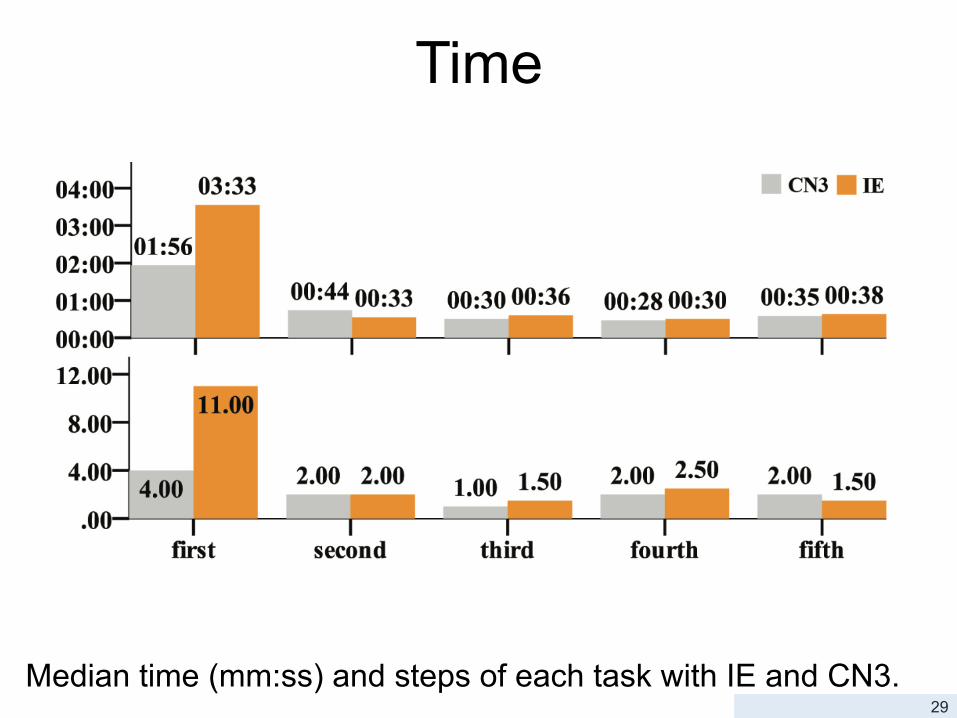
Time
Median time (mm:ss) and steps of each task with IE and CN3. 29

Subjective feedback
Questionnaire results with statistical significance. Differences between the aspects “Fun” and “Choice satisfaction” were not significant after the Bonferroni-Holm correction.
30

CONCLUSIONS & FUTURE WORK

Answering the research questions RQ1: Under which condition may a scalable visualisation increase user acceptance of recommended items? • User acceptance of recommended items increased with
the amount of sources used. • Human-generated data, such as bookmarks of other users
or tags, in addition to the agent-generated recommendations resulted in a significant increase of effectiveness and yield.
• Our data suggests that providing users with insight into relations of recommendations with bookmarks and tags of community members increases user acceptance.
• We thus recommend to combine automated sources and personal sources whenever possible.
32

Answering the research questions
RQ2: Does a scalable set visualisation increase perceived effectiveness of recommendations? Increase in - perceived effectiveness (expressed in the
questionnaire) - actual effectiveness (how frequently users
bookmarked a recommended paper)
33

Answering the research questions
RQ3 Does a scalable set visualisation increase user trust in recommendations?
Subjective data shows user trust was increased with set-based visualisation of recommendations.
34
Answering the research questions
RQ4 Does a scalable set visualisation improve user satisfaction with a recommender system?
Overall, user satisfaction was higher when using the visualisation, suggesting this to be a key feature of the approach.
35
Simplicity vs. Effectiveness • Users require more time to set first bookmark in
IE than in CN3. • Ater this ‘training phase’, the operational
efficiency does not differ. • Analysis of subjective data indicates that users
perceived IE to be more effective and its recommendations more trustworthy than those given by CN3.
• In addition, users perceived items resulting from their use of IE to be of higher quality and found the overall experience more satisfying.
36

Limitations & Future Work • Limitations:
– Low number of participants (n=20) – Participants had a high degree of visualisation
expertise (mean: 4.05, SD: 0.86).
• Future work – Analyze results from larger scale study at Digital
Humanities conference 2016 – Apply our approach to other domains (fusion of data
sources or recommendation algorithms) – Consider other factors that interact with the user
satisfaction
37

THANKS! QUESTIONS?