scale and stress effects on hydro-mechanical properties of fractured
TRANSCRIPT

TRITA-LWR PHD 1040 ISSN 1650-8602 ISRN KTH/LWR/PHD 1040-SE ISBN 978-91-7415-003-2
SCALE AND STRESS EFFECTS ON HYDRO-MECHANICAL PROPERTIES
OF FRACTURED ROCK MASSES
Alireza Baghbanan
June 2008

Alireza Baghbanan TRITA LWR PHD 1040
ii

Scale and Stress Effects on Hydro-Mechanical Properties of Fractured Rock Mass
iii
ABSTRACT In this thesis, the effects of size and stress on permeability, deformability and strength of fractured rock masses are investigated. A comparison study was carried out to examine the effects of considering, or not considering, the correlation between distributions of fracture apertures and fracture trace lengths on the hydro-mechanical behavior of fractured rocks. The basic concepts used are the fundamental principles of the general theory of elasticity, Representative Elementary Volume (REV), the tensor of equivalent permeability, and the strength criteria of the fractured rocks. Due to the size and stress dependence of the hydro-mechanical properties of rock fractures, the overall effective (or equivalent) hydro-mechanical properties of the fractured rocks are also size and stress-dependent. However, such dependence cannot be readily investigated in laboratory using small samples, and so numerical modeling becomes a necessary tool for estimating their impacts. In this study, a closed-form relation is established for representing the correlation between a truncated lognormal distribution of fracture apertures and a truncated power law distribution of trace lengths, as obtained from field mapping. Furthermore, a new nonlinear algorithm is developed for predicting the relationship between normal stress and normal displacement of fractures, based on the Bandis model and the correlation between aperture and length. A large number of stochastic Discrete Fracture Network (DFN) models of varying sizes were extracted from some generated large-sized parent realizations based on a realistic fracture system description from a site investigation programme at Sellafield, UK, for calculating the REV of hydro-mechanical properties of fractured rocks. Rotated DFN models were also generated and used for evaluation of the distributions of directional permeabilities, such that tensors of equivalent permeability could be established based on stochastically established REVs. The stress-dependence of the permeability and the stress-displacement behaviour were then investigated using models of REV sizes. The Discrete Element Method (DEM) was used for numerical simulation of the fluid flow, deformability properties and mechanical strength behavior of fractured rocks. The results show significant scale-dependency of rock permeability, deformability and strength, and its variation when the correlation between aperture and trace length of fractures are concerned, with the overall permeability and deformability more controlled by dominating fractures with larger apertures and higher transmissivity and deformability, compared with fracture network models having uniform aperture. As the second moment of aperture distribution increases, a fractured rock mass shows more discrete behavior and an REV is established in smaller value of second moment with much larger model size, compared with the models with uniform fracture aperture. When the fracture aperture pattern is more scattered, the overall permeability, Young’s modulus and mechanical strength change significantly. The effect of stress on permeability and fluid flow patterns in fractured rock is significant and can lead to the existence or non-existence of a permeability tensor. Stress changes the fluid flow patterns and can cause significant channeling and the permeability tensor, and REV may be destroyed or re-established at different applied stress conditions. With an increase in the confining stress on the DEM models, the strength is increased. Compared with the Hoek-Brown criterion, the Mohr-Coulomb strength envelope provides a better fit to the results of numerical biaxial compression tests, with significant changes of the strength characteristic parameters occurring when the second moment of the aperture distribution is increased.

Alireza Baghbanan TRITA LWR PHD 1040
iv
Keywords: Aperture-trace length correlation; Discrete Fracture Network (DFN); Representative Elementary Volume (REV); Strength; Stress-Strain curve; Discrete Element Method (DEM); Stress effect; Deformability of fractures

Scale and Stress Effects on Hydro-Mechanical Properties of Fractured Rock Mass
v
ABSTRAKT I denna uppsats är effekten av storlek och spänning på permeabiliteten, deformationen och styrkan av sprucket bergmass undersökt. En jämförande studie genomfördes för att undersöka effekterna av om man tar hänsyn till eller inte tar hänsyn till korrelationen mellan distributionen av sprickors vidd och sprickors längd i de hydro-mekaniska uppförande av sprucket berg. De grundläggande koncepten är de fundamentala principerna i den generella elastisitetsteorin, Representativ Elementär Volym (REV) tensorn av ekvivalent permeabilitet, och styrkekriteriet för det spruckna berget. På grund av storlek och spänningsberoendet hos sprickor är effekten av de hydromekaniska egenskaperna av sprickor också storlek och spänningsberoende. Men dessa beroenden kan inte enkelt undersökas i ett laboratorium på ett litet prov, därför är numeriska modeller ett nödvändigt instrument för att undersöka deras effekt. I denna studie, ett ”closed form” relation är etablerad för att representera korrelationen mellan trunkerade lognormal distributionen av sprickvidd och en trunkerad exponential- distribution av spricklängd, tagna från fältmätningar. Dessutom är en ny ickelinjär algoritm utvecklad för att förutse relationen mellan normal spänning och normal förflyttning av sprickor, baserad på Bandis model och korrelationen mellan vidd och längd. Ett stort antal stokastiska Diskreta Spricknätverksmodeller (DFN) av varierande storlek var extraherade från en genererad stormodell, baserad på ett realistiskt spricksystembeskrivning från ett undersökningsplatsprogram i Sellafield, UK, för att beräkna REV på de hydromekaniska egenskaperna av sprucket berg. Roterad DFN modeller genererades också och användes för utvärdering av distributionen av den riktade permeabiliteten, såsom att tensorn av den ekvivalenta permeabiliteten kunde etableras baserad på stokastiskt etablerad REVs. Permeabilitetens spänningsberoende och dess spänningsförskjutnings beteende undersöktes med hjälp av modeller i REV storlek. Den Diskreta Elementär Metoden (DEM) användes för numeriska simulationer av vätskeflöde, deformationsegenskaper och mekaniskt styrkebeteende av sprucket berg. Resultaten visar ett stort beroende av skalan av bergmaterialets permeabilitet, deformabilitet och styrka, och dess variation när korrelationen mellan längd och vidd av sprickorna. Med den totala permeabiliteten och deformationen mer kontrollerad av de dominerande sprickorna och med större vidd och högre transmissivitet och deformation, jämfört med spricknätverks modeller med samma sprickvidd. När de andra momentet av sprickvidds distributionen ökar, visar den spruckna bergmassan ett mer diskret beteende och en REV är etablerad i mindre värden av det andra momentet med mycket större modellstorlek, jämfört med modeller med konstant sprickvidd. När sprickornas viddmönster är mer utspritt ökas den totala permeabiliteten, Youngs modulus och den mekaniska styrkan. Effekten av tryck på permeabiliteten och vätskeflödesrörelser i sprucket berg är signifikant och kan leda till existensen av en permeabilitetstensor. Tryckförändringar ändrar på vätskeflödesrörelser och kan orsaka signifikanta kannelisering, permeabilietstensorn och REV kan bli förstörda och återskapade vid olika applicerade tryckförhållanden. Med en ökning i inneslutande trycket på DEM modeller ökas styrkan. Vid jämförelse med Hoek-Brown kriteriet tillhandahåller Mohr-Coulomb styrkeenvelop en bättre passning till resultaten av det numerisk biaxiala

Alireza Baghbanan TRITA LWR PHD 1040
vi
kompressionstestet. Med signifikanta ändringar av de karakteristiska parametrarna för styrkan när det andra momentet av vidd distributionen ökas.
Nyckelord: Sprickvidd – Spricklängd korrelationen; Diskreta spricknätverksmodeller (DFN); Representativ Elementär Volym (REV); Styrka; Spänning - töjningskurva; Diskreta Elementär Metoden (DEM); Spänning effekten; Deformationen av sprickor
Scale and Stress Effects on Hydro-Mechanical Properties of Fractured Rock Mass
vii
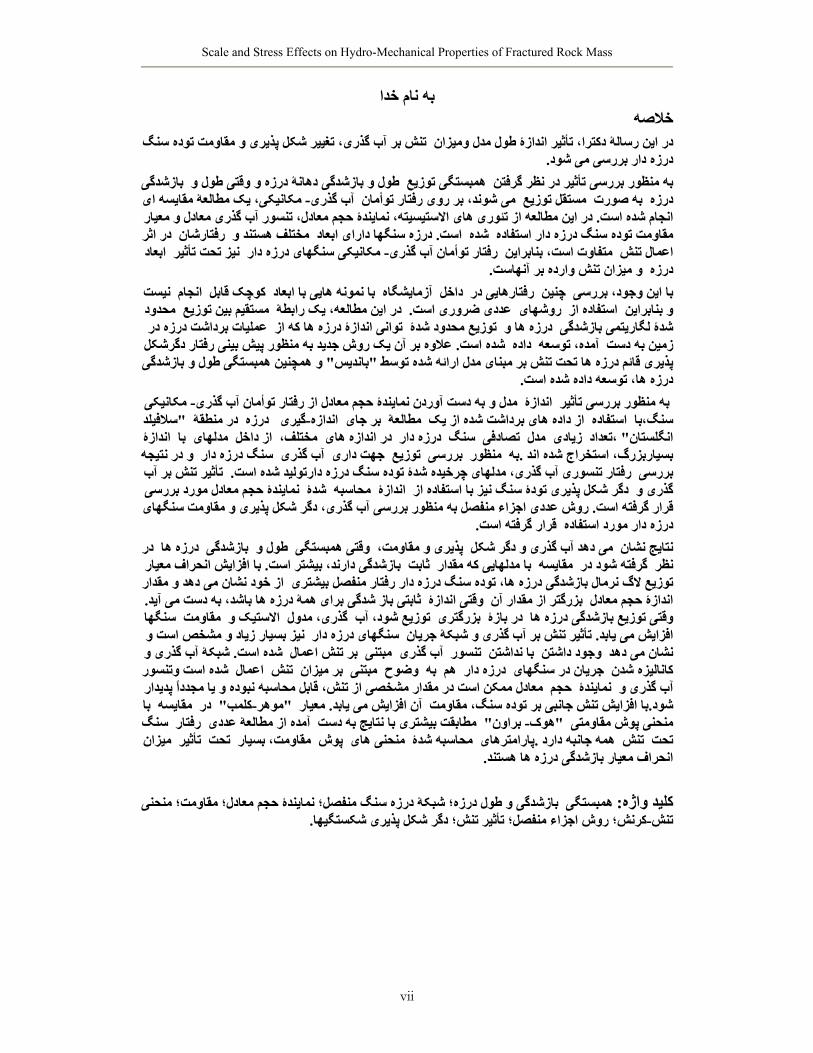
نام خدابه خلاصه
سنگ ه تغيير شکل پذيری و مقاومت تود، تنش بر آب گذریمدل وميزان طول ، تأثير اندازۀ دکتراۀدر اين رسال.بررسی می شود درزه دار
بازشدگی طول و بازشدگی دهانۀ درزه و وقتی طول و ی توزيعهمبستگ در نظر گرفتن تأثير به منظور بررسیيک مطالعۀ مقايسه ای ، مکانيکی- آب گذری بر روی رفتار توأمان می شوند، توزيع مستقل به صورت درزه
تنسور آب گذری معادل و معيار ، نمايندۀ حجم معادل، الاستيسيته در اين مطالعه از تئوری های. انجام شده است در اثر رفتارشان و مختلف هستند درزه سنگها دارای ابعاد. است شده مقاومت توده سنگ درزه دار استفاده
ابعاد نيز تحت تأثير درزه دارهای مکانيکی سنگ-رفتار توأمان آب گذری بنابراين ، متفاوت است اعمال تنش. و ميزان تنش وارده بر آنهاست درزه
نيست انجام کوچک قابل با نمونه هايی با ابعاد آزمايشگاه داخل رفتارهايی در چنين با اين وجود، بررسی محدود مستقيم بين توزيع در اين مطالعه، يک رابطۀ . عددی ضروری است روشهای استفاده از و بنابراين
عمليات برداشت درزه در توانی اندازۀ درزه ها که از توزيع محدود شدۀ درزه ها و شدۀ لگاريتمی بازشدگیيک روش جديد به منظور پيش بينی رفتار دگرشکل علاوه بر آن . شده است داده آمده، توسعه زمين به دست
و همچنين همبستگی طول و بازشدگی " بانديس"پذيری قائم درزه ها تحت تنش بر مبنای مدل ارائه شده توسط .درزه ها، توسعه داده شده است
مکانيکی -ری مدل و به دست آوردن نمايندۀ حجم معادل از رفتار توأمان آب گذ اندازۀ به منظور بررسی تأثيرسلافيلد " در منطقۀ درزه گيری - اندازه بر جای مطالعۀ از داده های برداشت شده از يک استفاده سنگ،با اندازۀ با مدلهای از داخل مختلف، در اندازه های درزه دار سنگ تصادفی مدل زيادی ،تعداد "انگلستان
و در نتيجه آب گذری سنگ درزه دار جهت داری توزيع بررسی منظور به. استخراج شده اند بسياربزرگ،تأثير تنش بر آب .بررسی رفتار تنسوری آب گذری، مدلهای چرخيده شدۀ توده سنگ درزه دارتوليد شده است
نمايندۀ حجم معادل مورد بررسی شدۀ محاسبه اندازۀ دگر شکل پذيری تودۀ سنگ نيز با استفاده از گذری وروش عددی اجزاء منفصل به منظور بررسی آب گذری، دگر شکل پذيری و مقاومت سنگهای .رار گرفته استق
.درزه دار مورد استفاده قرار گرفته است در درزه ها بازشدگی طول و وقتی همبستگی پذيری و مقاومت، می دهد آب گذری و دگر شکل نتايج نشان
با افزايش انحراف معيار . بيشتر است بازشدگی دارند، ثابت مدلهايی که مقدار با مقايسه گرفته شود در نظر از خود نشان می دهد و مقدار توزيع لاگ نرمال بازشدگی درزه ها، توده سنگ درزه دار رفتار منفصل بيشتری
. شد، به دست می آيدثابتی باز شدگی برای همۀ درزه ها با وقتی اندازۀ بزرگتر از مقدار آن اندازۀ حجم معادل سنگها مقاومت الاستيک و گذری، مدول توزيع شود، آب بزرگتری در بازۀ وقتی توزيع بازشدگی درزه ها
نيز بسيار زياد و مشخص است و سنگهای درزه دار تأثير تنش بر آب گذری و شبکۀ جريان . افزايش می يابدشبکۀ آب گذری و . شده است بر تنش اعمال مبتنی آب گذری تنسور با نداشتن وجود داشتن نشان می دهد شده است وتنسور اعمال تنش ميزان بر مبتنی وضوح به هم درزه دار جريان در سنگهای کاناليزه شدن معادل ممکن است در مقدار مشخصی از تنش، قابل محاسبه نبوده و يا مجدداً پديدار حجم نمايندۀ آب گذری و
با مقايسه در "کلمب-موهر" معيار . آن افزايش می يابد با افزايش تنش جانبی بر توده سنگ، مقاومت.شود سنگ رفتار آمده از مطالعۀ عددی مطابقت بيشتری با نتايج به دست " براون-هوک" منحنی پوش مقاومتی
ميزان تأثير تحت مقاومت، بسيار پوش منحنی های محاسبه شدۀ پارامترهای. همه جانبه دارد تنش تحت.انحراف معيار بازشدگی درزه ها هستند
بازشدگی و طول درزه؛ شبکۀ درزه سنگ منفصل؛ نمايندۀ حجم معادل؛ مقاومت؛ منحنی همبستگی:کليد واژه
. کرنش؛ روش اجزاء منفصل؛ تأثير تنش؛ دگر شکل پذيری شکستگيها-تنش

Alireza Baghbanan TRITA LWR PHD 1040
viii

Scale and Stress Effects on Hydro-Mechanical Properties of Fractured Rock Mass
ix
ACKNOWLEDGMENT This PhD thesis was produced at Royal Institute of Technology (KTH) in Stockholm, within the Research Group of Engineering Geology and Geophysics (EGG), in the Department of Land and Water Resources (LWR). I would like to express my gratitude to all those who gave me possibility to complete this thesis. I am deeply indebted of my main supervisor, Dr. Lanru Jing, for his guidance, valuable suggestions and comments during my study at KTH. I would like also to express my sincere gratitude to my second advisor Prof. Robert Zimmerman previously at KTH and currently in Imperial College of London, for his help, guidance and especially for editing my papers and thesis. I want to thank my third advisor Dr. Herbert Henkel for his help and support, especially at the beginning stage of my education in Sweden. I would like to thank Prof. Ove Stephansson at GeoForschungsZentrum (GFZ), Germany, for his help, especially at the initial stage of admission process in KTH. My special thanks go to Dr. Joanne Fernlund in EGG research group for her help and also allowing me to participate in teaching engineering geology in graduate and undergraduate programs in LWR. I wish to thank my former college, Dr. Ki Bok Min, now at University of Adelaide in Australia, for his help and fruitful discussions at the initial stage of my study in EGG and his contribution to my first paper at Euro-Conference 2005 on Rock Physics and Geomechanics in France. I would like to thank my friend and PhD student, Mehdi Bagheri from Division of Rock and Soil Mechanics at KTH for fruitful discussions in different fields of rock mechanics and especially cooperation in producing some papers. I would like to thank my college, Mimmi Magnusson (Arvidsson) for translating the abstract of thesis to Swedish and also my former and current colleges at EGG; Thushan Ekneligoda, Tomofumi Koyama, Diego Mas Ivars, Ann Bäckström, Katrin Grünfeld, Solomon Tafesse and Fougu Tong for their help and fruitful discussions. I would also like to express my gratitude to the other members of the Department of Land and Water Resource Engineering, Britt Chow, Aira Saarelainen, Jerzy Buczak and Lars-Erik Svahn for their effective and kind help with all administrative works. Special thanks should go to the Iranian Student Scholars Association and their families for help and many fun moments during my study period in Sweden. Financial support provided by Ministry of Science, Research and Technology of Iran (MSRTI) is greatly acknowledged. I wish to express my deep appreciation to my father and mother and also my father-in-law and mother-in-law, all of my sisters and brother as well as my sister-in-law and brother-in-laws and their families who missed us as much as we missed them during the past four years. Last but not least, I owe my loving thanks my wife, Delaram for her endless supports and help and also my daughter Negar. They have lost a lot due to my research abroad. Without their encouragement and understanding it would have been impossible for me to finish this work.

Alireza Baghbanan TRITA LWR PHD 1040
x

Scale and Stress Effects on Hydro-Mechanical Properties of Fractured Rock Mass
xi
PREFACE The following papers are appended to this thesis and numbered form I to V: I: Baghbanan A, Jing L. Hydraulic properties of fractured rock masses with correlated fracture length and aperture. Int J Rock Mech Min Sci 2007;44(5):704-719. II: Baghbanan A, Jing L. Stress effects on permeability in fractured rock mass with correlated fracture length and aperture. Int J Rock Mech Min Sci 2008 (in press). III: Jing L. Baghbanan A. Stress and scale-dependency of the hydraulic properties of fractured rocks. In: Proc. ISRM symposium for young scholars, April 28-May2, 2008, Beijing (China). Taylor & Francis Group, London, ISBN 978-0-415-46934-0. p.41-48. IV: Baghbanan A, Jing L. Scale and stress effects on permeability tensor of fractured rocks with correlated fracture length and aperture. In: Proc. Geoproc2008 conference, Lille, France 2008 (accepted for publication). V: Baghbanan A, Jing L. Effects of size and stress on deformability and strength of fractured rocks with correlated fracture aperture and length. Submitted to Int J Rock Mech Min Sci 2008 (under revision) The following publications related to the research field of this thesis and numbered from VI to XII, but not appended: VI: Baghbanan A, Min KB, Jing L. Scale effect on hydraulic properties of fractured rock mass by correlated fracture length and aperture. In: Proc EURO-Conference on Rock Physics and Geomechanics – Integration and application to reservoirs and repositories 2005, Oléron, France, pp.72. VII: Baghbanan A. Deformability of rock fractures with correlated fracture length and aperture. In: Proc 3rd Iranian Rockmechanics conference, Tehran, Iran 2007, p 1155-1164. VIII: Baghbanan A, Stephansson O, Jing L. A numerical study of strength, deformability and permeability of rocks for repositories of spent nuclear fuel at Forsmark and Simpevarp Sub-area sites with a DFN-DEM methodology; Phase 1, Numerical investigation on effect of in situ stresses on rock permeability SKI_INSITE, TRD-06-05, Stockholm. IX: Baghbanan A, Stephansson O, Jing L. A numerical study of strength, deformability and permeability of rocks for repositories of spent nuclear fuel at Forsmark and Simpevarp Sub-area sites with a DFN-DEM methodology; Phase 2, Numerical investigation on effect of in situ stresses on deformability properties and strength of rocks of both Forsmark and Simpevarp Sub-area sites. SKI_INSITE, TRD-07-04, Stockholm. X: Baghbanan A, Jing L. Heterogeneity of grain distribution and block scale effects on mechanical properties of intact rocks using Discrete Element Method approach. Material Characterization 2008 (under revision). XI: Nord G, Bagheri M, Baghbanan A, Stille H. Design consideration of large caverns by using advanced drilling equipment. Felsbau 2007; 25(5):131-136.

Alireza Baghbanan TRITA LWR PHD 1040
xii
XII: Bagheri M, Baghbanan A, Stille H. Some aspects on model uncertainty in the calculation of block stability using Kinematic Limit Equilibrium and Discrete Fracture Network-Distinct Element Method approaches. ARMA2008- June 29-July 2, 2008, San Francisco (USA) (accepted for publication).

Scale and Stress Effects on Hydro-Mechanical Properties of Fractured Rock Mass
xiii
TABLE OF CONTENT 1 Introduction .................................................................................................................... 1
1.1 Background and motivation of this study ....................................................................... 1 1.2 Objective of this study..................................................................................................... 4 1.3 The structure of thesis..................................................................................................... 4
2 Geometric parameters and assumptions for generation of Discrete Fracture Network realizations ...................................................................................................... 6
2.1 Fracture trace lengths .................................................................................................... 6 2.2 Orientations of fractures ................................................................................................ 6 2.3 Location of the fractures................................................................................................. 7 2.4 Distribution of fracture aperture and aperture-trace length correlation....................... 7
2.4.1 Aperture of fractures ............................................................................................... 7 2.4.2 Distribution of fracture aperture in the fractured rocks ........................................... 8 2.4.3 Correlation between aperture and trace length of fractures–as reported in literature
............................................................................................................................... 10 2.4.4 The correlation equation between fracture aperture and trace length.................... 13
2.5 Generation of DFN realizations ................................................................................... 15 3 Deformability of the single fractures with correlation between aperture and trace
length ............................................................................................................................. 17 3.1 Mechanical behavior of fractures in the normal direction........................................... 17 3.2 Fracture shear behavior ............................................................................................... 21
4 Modeling methodology................................................................................................. 25 4.1 Calculation of the equivalent permeability using UDEC ............................................. 25 4.2 Numerical methodology for calculation of mechanical properties and stress
dependency of strength ................................................................................................. 27 4.3 The DEM model establishment for evaluating stress dependency of permeability ...... 30
5 Scale dependent hydraulic and mechanical properties of fractured rocks............. 32 5.1 Results of scale dependent equivalent permeability and permeability tensor (papers I
and III).......................................................................................................................... 32 5.1.1 Results with a constant fracture aperture............................................................... 32 5.1.2 Results with correlated fracture aperture and trace length distributions ............... 33 5.1.3 Results with uncorrelated fracture aperture and length distributions .................... 34
5.2 Investigation on REV size of mechanical properties (paper V).................................... 44 5.2.1 Results with constant fracture aperture ................................................................. 44 5.2.2 Results with correlated fracture aperture and trace length .................................... 45
6 Stress dependent permeability and strength of fractured rocks.............................. 49 6.1 DEM study on stress effect on permeability (papers II, III, IV) ................................... 49
6.1.1 Effect of stress ratio on permeability..................................................................... 49 6.1.2 Evaluation of permeability tensor and flow pattern changes with different stress
ratios ...................................................................................................................... 53 6.2 Investigation stress dependency on strength (paper V) ................................................ 58
6.2.1 Results with constant fracture aperture ................................................................. 58 6.2.2 Results with correlated fracture aperture and trace length .................................... 59
7 Discussion...................................................................................................................... 61 8 Conclusions ................................................................................................................... 65
8.1 General conclusions on approach ................................................................................ 65 8.2 Specific conclusions from numerical results ................................................................ 65
9 Recommendation for future studies ........................................................................... 68 10 References ..................................................................................................................... 69

Alireza Baghbanan TRITA LWR PHD 1040
xiv

Scale and Stress Effects on Hydro-Mechanical Properties of Fractured Rock Mass
1
1 INTRODUCTION
1.1 Background and motivation of this study Understanding the influence of size and stress on the overall hydro-mechanical behavior of fractured rocks is very important in various fields of rock engineering work, such as slopes, dam foundations, underground excavations, oil recovery, geothermal reservoirs and nuclear waste disposal. In crystalline rocks where the permeability of the rock matrix may be negligible and the deformability of intact rock is very small, compared with higher fluid transmissivity and deformability of fractures, flow occurs mainly through the connected fractures, and deformation and strength of rock masses are greatly affected by the fracture systems. The overall permeability, deformability and strength of the fractured rocks are influenced not only by geometric characteristics of the fracture systems, but also by states and evolutions of stress fields. Therefore, the Representative Elementary Volume (REV), which is defined as the minimum volume of a sampling domain beyond which the hydraulic and mechanical properties of the sampling domain remain essentially constant (Long et al., 1982), should first be evaluated. Then, the stress effect on permeability and mechanical properties of the rock at sizes of such REVs can be studied using numerical modeling methods, such as Discrete Element Method (DEM) approach. It was reported in the literature that the permeability of fractured rocks is highly scale-dependent (Bear, 1972; Long et al., 1982; Khaleel, 1989; Min et al., 2004a). The effect of model size on the mechanical properties of fractured rocks, such as strength and Young’s modulus, is also very significant (Beiniawski, 1968; Heuze, 1980; Hoek and Brown, 1980; Kemeny and Cook, 1986; Tsoutrelis and Exadaktylos, 1993). Larger volumes of rocks in-situ contain many fractures of varying sizes which contribute to the changes, often as reduction, in strength and Young’s modulus of the fractured rock masses. Even if there is no change in fracture density with size variations, still the size effect on mechanical properties exists (Glucklich and Cohen, 1967; 1968). Using in situ tests for the determination of field-scale hydraulic and mechanical properties of rocks is very difficult, time-consuming and expensive. Numerical methods are able to investigate the permeability, deformability and strength parameters of fractured rocks considering the interactions between the intact rock matrix and fractures, if their constitutive behaviors are well understood. The DEM is a very attractive method that simulates very complex geometrical models of fracture systems, such as Discrete Fracture Network (DFN) models, with simple or complicate constitutive behavior of rock fractures and rock matrix (Jing and Stephansson, 2007).

Alireza Baghbanan TRITA LWR PHD 1040
2
For studies about effect of stress on the permeability tensor and flow pattern, as well as deformability and strength of fractured rocks, the key requirements are: 1. The sizes of DFN model must not be less than the REV size; 2. The constitutive model of fractures must include the non-linear
normal stress-normal closure behavior of the rough rock fractures, such as the hyperbolic model of Bandis (Bandis, 1980);
3. The dilation of the fracture during shear must be non-zero in the fracture models due to surface roughness effects.
In some earlier studies on stress effects on permeability of fractured rocks using DEM approach (Oda, 1986; Oda et al., 1987; Ouyang and Elsworth, 1993; Zhang et al, 1996, 1999; Zhang and Sanderson, 1996; 1998; 2001; Indraratna et al., 1999; Lee and Moon, 2004; Chen and Bai, 2005), these requirements were not fully considered, where either the REV issue was not addressed, constant normal stiffness of fractures was assumed, or zero dilation angles were used, which made the numerical model less suitable for studying stress-dependency of the hydraulic behavior of fractured rocks. A hydro-mechanical study for a performance assessment of deep waste disposal in Sellafield area as reported by Blum et al. (2005) show a significant impact of using the spatial distribution of mechanical properties on deformability and hydraulic properties of fractured rocks, which means that the assumption of the constant hydraulic aperture of fractures as well as scale-independent mechanical behavior of fractures in the DEM models, as reported in (Min et al., 2004b), may lead to a degree of uncertainty, and needs to be further investigated to consider both stress and scale-dependence of hydraulic apertures of fractures and equivalent permeability. In earlier studies of the deformability parameters and strength of fractured rock masses as reported in Amadei and Goodman (1981), Kulatilake et al. (1993), Min and Jing (2003), and Prudencio and Van Sint Jan (2007), the authors either considered regular fracture systems which are often not good representations of reality in the field (Amadei and Goodman, 1981; Prudencio and Van Sint Jan, 2007), or else they did not consider the combined size and stress effects on mechanical properties of fractures and interactions between the fracture parameters (Kulatilake et al., 1993; Min and Jing, 2003). Fracture systems in rock masses are geometrically complex. The quality and quantities of measured data of geometric parameters, which are obtained from field mapping on exposed outcrops of limited areas and borehole logging of limited borehole diameters and depths, contains a large degree of uncertainty. To reduce such uncertainty in representing the subsurface fracture system more realistically, the usual practice is to use stochastic DFN modeling by assuming that geometrical parameters of the fractures are statistically distributed (Priest, 1993). The uncertainty in the geometric data sets can be reduced to a certain extent when a large number of DFN realizations, based on the probabilistic distribution functions of these parameters,

Scale and Stress Effects on Hydro-Mechanical Properties of Fractured Rock Mass
3
are used as the geometric models for simulations of hydro-mechanical behavior of the concerned fractured rocks. The effect of fracture geometry parameters on connectivity, permeability and flow patterns in fracture network have been extensively reported in the literature (Oda, 1988; Adler and Thovert, 1999; Tsang and Neretnieks, 1998; Sahimi, 1995; Bour et al., 1997; Margolin et al., 1998; Bour et al., 2002; Park et al., 2001; de Dreuzy et al., 2001a; de Dreuzy et al., 2001b; de Dreuzy et al., 2002; Darcel et al., 2003; de Dreuzy and Erhel, 2003; de Dreuzy et al., 2004; Mourzenko et al., 2004). These parameters also have significant effects on the mechanical properties of fractured rocks, as reported by Kulatilake et al. (1993), Welideniya (2005), and Wang (2007). However, the effect of inter-parameter correlation, especially that between the aperture and fracture size (often represented as the trace length), on the equivalent permeability and mechanical properties has not been studied. The fracture trace length is often found to follow a power-law distribution. However, the fracture transmissivity, which is related to the hydraulic aperture through the cubic law, is found to follow either a lognormal or a power law distribution (Gale, 1987; Dverstop and Andersson, 1989; Cacas et al., 1990; Hakami and Barton, 1990; Iwano and Einstein, 1993; Johns et al., 1993; Hakami et al., 1995; Pyrak-Nolte et al., 1997). From laboratory measurements using techniques such as Wood’s metal injection, resin impregnation, florescent epoxy, and laser scanning, it has been reported (Gale, 1987; Hakami and Barton, 1990; Iwano and Einstein, 1993; Johns et al., 1993; Hakami et al., 1995; Pyrak-Nolte et al., 1997) that apertures follow lognormal distributions in single fractures. On the other hand, it has also been reported (Dverstop and Andersson, 1989; Cacas et al., 1990; Margolin et al., 1998; de Dreuzy et al., 2001b) that the transmissivity of fractures may also follow a lognormal distribution, as obtained from numerical calibrations against results of in situ hydraulic tests. Power law distributions have also been used in some applications (de Dreuzy et al., 2002; Mourzenko et al., 2004), as confirmed by field measurements using techniques such as micro-scanner logs, borehole televiewers and direct measuring at outcrops (Wong et al., 1989; Barton and Zoback, 1992; Clark et al., 1995; Fisher et al., 1995; Belfield and Sovich, 1995; Marrett, 1996). It is natural and reasonable to assume that apertures and trace lengths of the fractures are correlated, since dominant fluid-conducting features, such as faults or fracture zones, usually have higher values of hydraulic transmissivity compared with joints of smaller sizes. However, definite proof of existence of quantitative relations between aperture and trace length is difficult to establish in practice, even if the effect of shearing histories, weathering and fillings are ignored. Attempts have been made to find relations between fracture trace length and aperture as positive linear correlations (Stone, 1984; Vermilye and Scholz, 1995) or power law correlations (Hatton et al., 1994; Renshaw and Park, 1997), respectively. Meanwhile, some

Alireza Baghbanan TRITA LWR PHD 1040
4
observations also show that the relation between trace length and aperture has only an imperfect positive correlation that exhibits a variation of one order of magnitude around the mean trend (Bonnet et al., 2001).
1.2 Objective of this study In this thesis, to study the scale and stress effects on hydro-mechanical properties of fractured rock masses, we conducted four different studies. In the first and second studies we calculate REV sizes of hydraulic and mechanical properties of fractured rocks respectively, when correlation between fracture apertures-trace lengths is considered. In the third and fourth studies the stress dependency of permeability and strength are examined. The objective of the first study is to develop a discrete numerical methodology for determination of existence of REV and equivalent permeability tensor of fractured rocks with consideration of correlated distributions of fracture aperture and trace length. We adopted a 2D DEM code UDEC (Itasca, 2004) as the basic numerical tool for the methodology development, with the assumption that intact rock matrix is impermeable and fluid flows through connected fractures only. The focus of the new development is on the impact of correlated geometric parameters of fractures (aperture and trace length in this case) on the overall hydraulic behavior of the fractured rocks, which has not been attempted in previous works. In the second study, we applied the developed discrete numerical methodology for determination of existence of REV and equivalent mechanical properties of fractured rocks with consideration of correlated distributions of fracture aperture and trace length. A non-linear behavior between normal stress-normal displacements of fractures is adopted, so that both size and stress-dependent normal stiffness of fractures can be considered, with the assumption that intact rock matrix is linear elastic and the fractures following an elasto-plastic behavior in shear and a hyperbolic behavior in compression (Bandis’ law), respectively (Itasca, 2004). The objective of the third and forth studies is to evaluate the stress and size effects on the existence of permeability tensor, change of flow pathways and strength envelopes with correlation aperture-length of fractures. The computational models were based on the calculated REV sizes from the first and second studies. It should be noted that such numerical modeling of representative hydro-mechanical properties of fractured rocks at field scales, considering both size and stress effects, are reported in this thesis for the first time.
1.3 The structure of thesis In this thesis, firstly the geometric parameters for fracture system model generations and also mathematical expressions for the correlation between the apertures and trace length distributions are described (Chapter 2). In Chapter 3 the mathematical expression for

Scale and Stress Effects on Hydro-Mechanical Properties of Fractured Rock Mass
5
the normal deformability behavior of fractures, when the initial fracture aperture is correlated with fracture trace lengths, is described. Then, numerical modeling methodology and calculation of the equivalent permeability tensor, deformability parameters, strength and the stress-dependency of permeability of the DEM models of the fractured rock concerned are described (Chapter 4). The results of the calculated REV, hydraulic properties, flow pattern, permeability tensor and mechanical properties are presented in Chapter 5. The stress-dependent permeability, flow patterns, existence of permeability tensor and also strength envelopes are presented for the cases with constant fracture aperture and correlated distributions of fracture aperture and trace length in Chapter 6. The discussions on results and outcomes of studies are presented in Chapter 7 and finally some conclusions and suggestions for further studies are reported in Chapter 8 and 9, respectively. The results of this study have been presented in six papers. Five of the papers, Baghbanan and Jing (2007) as Paper I, Baghbanan and Jing (2008a) as Paper II, Jing and Baghbanan (2008) as Paper III, Baghbanan and Jing (2008b) as Paper IV, and Baghbanan and Jing (2008c) as Paper V, have been appended to this thesis, and one published paper (Baghbanan, 2008) has been referred to but not appended.

Alireza Baghbanan TRITA LWR PHD 1040
6
2 GEOMETRIC PARAMETERS AND ASSUMPTIONS FOR GENERATION OF DISCRETE FRACTURE NETWORK REALIZATIONS The geometric parameters for generating fracture network realizations are based on the field mapping results of a site characterization at the Sellafield area, Cambria, England, as reported by Nirex (1997a,1997b). Table 2.1 shows the basic information about the fracture system parameters. Four sets of fractures are identified, and the orientations of fractures follow a Fisher distribution. These parameters serve only as data sources for generations of more realistic DFN realizations, not for a case of site application. The results presented and conclusions reached have therefore no link to the actual site condition at all.
2.1 Fracture trace lengths Based on the field mapping results at Sellafield, the fracture trace lengths follow a power law distribution, with a calculated fractal dimension of 2.2 and a density of 4.6 m-2, respectively. The trace length was truncated, and varies between 0.5 m and 250 m, according to
l = [lmin−D + F(lmax−D − lmin
−D )]−1/ D, (2.1)
where minl and maxl are the adopted minimum and maximum trace lengths after the truncation, D is the fractal dimension, and F is random number uniformly distributed in the range 10 ≤≤ F . With this fractal dimension, it was found that more than 95% of fractures have trace lengths less than 2 m, and the calculated mean trace length is 0.92 m (Nirex, 1997a; Nirex, 1997b).
2.2 Orientations of fractures The orientations of fractures are assumed to follow a Fisher distribution, as is commonly adopted in DFN modeling. If θ is the angle of deviation from the mean orientation angle of a fracture set,
Table 2.1 Fracture parameters used for discrete fracture network (DFN) generation (Nirex, 1997a; Nirex, 1997b)
Joint Set Dip/Dip direction Fisher constant (K) Fracture
density (m-2)
Mean trace
length (m)
1 8/145 5.9 4.6 0.92
2 88/148 9.0 4.6 0.92
3 76/21 10.0 4.6 0.92
4 69/87 10.0 4.6 0.92

Scale and Stress Effects on Hydro-Mechanical Properties of Fractured Rock Mass
7
then the actual orientation of the fractures of this set is determined according to
⎭⎬⎫
⎩⎨⎧ −−
=−
−
KeeFeθ
KKK )](ln[cos 1 , (2.2)
where K is the Fisher constant, which is assigned for each fracture set according to Table 2.1 (Nirex, 1997a; Nirex, 1997b). The Monte Carlo Method is then used to generate the trace lengths and the orientations of fractures based on equations (2.1) and (2.2).
2.3 Location of the fractures The most commonly used assumption in DFN simulations, which is that the locations of the fractures follow a Poisson process, is adopted. The locations of fracture centers are generated by generating random numbers based on a recursive algorithm that adopts the decimal part of calculated numbers with the following recursive equation
)0.27int(0.271 iii RRR −=+ , (2.3)
where Ri is a random number in the range 0 ≤ Ri ≤ 1, int(x) is the integer part of the number x, and an initial value of R0 is generated from the multiplicative congruencies algorithm (Priest, 1993). If the generation space is defined in terms of two coordinate ranges xg1 < xg2 and yg1 < yg2 along a local set of Cartesian axes, one can generate mid-point coordinates (xi and yi) of every fracture through the following equations (Priest, 1993):
)( 121 ggigi xxRxx −+= , (2.4)
)( 1211 ggigi yyRyy −+= + . (2.5)
This algorithm was applied to generate the coordinates of the centers of the fractures in large DFN models, which were 300 m on each side and was used as parent DFN models from which smaller DFN models were extracted for detailed model size studies for stress and flow simulations.
2.4 Distribution of fracture aperture and aperture-trace length correlation
2.4.1 Aperture of fractures By definition aperture is the void between the opposing surfaces of a rock fracture. The apparent aperture is the distance between the two surfaces. However, the true hydraulic aperture is often back-calculated using cubic law equation from laboratory test results of flow rates (Ge, 1997). In the literature, many different fracture aperture terms have been defined. Abelin et al. (1985) and Tsang (1992) defined the Mass Balance aperture (MB), Frictional Loss aperture (FL) and Cubic Law

Alireza Baghbanan TRITA LWR PHD 1040
8
aperture (CL). They showed that for a realistic fracture, in which the apertures constitute a heterogeneous random field in two dimensions, the ‘CL’ aperture is smaller than ‘MB’ aperture and greater than ‘FL’ aperture (Abelin et al., 1985; Tsang, 1992). Piggott and Elsworth (1993) defined another type of aperture, electrical aperture, and tried to link the electrical aperture to the hydraulic aperture using laboratory tracer tests on a natural fracture of granite at two stress levels (Piggott and Elsworth, 1993). For any applied stress acting normal to the mean fracture plane, one can measure the average deformation across the fracture by measuring the change in the arithmetic average aperture, often referred to as the mechanical aperture (Renshaw, 1995). Early attempts to model the flow characteristics of individual fractures assumed that fracture walls could be represented as flat and smooth parallel plates. This assumption was based on observations that most natural fractures are approximately planar on large scale of the fracture length and by the ease with which analytic solutions to the laminar flow problem could be obtained (Renshaw, 1995). In this study the term “aperture” means the hydraulic aperture unless specifically stated otherwise. The validity of cubic law for laminar fluid flow through fractures is also assumed, for the purpose of simplicity, since the focus of our study is the impacts of correlated aperture and trace length on the hydro-mechanical behavior of the fractured rocks.
2.4.2 Distribution of fracture aperture in the fractured rocks As mentioned in chapter 1, numerous studies at various problem scales and in different geological settings have shown that the distribution of fracture apertures and trace lengths often follows lognormal or power law distributions. Fracture apertures cover a wide scale range since the variation in apertures can result not only from mechanical misfit of fracture walls but also from chemical action such as dissolution, mineral filling and normal stresses. Fracture apertures are measured by a wide variety of methods, including direct measurements in cores or outcrops and deduction from flow data, and therefore show wide scatters. In the literature, the fracture transmissivity, which is related to the hydraulic aperture through the cubic law, is usually found to follow either lognormal or power law distributions (Gale, 1987; Dverstop and Andersson, 1989; Cacas et al., 1990; Hakami and Barton, 1990; Iwano and Einstein, 1993; Johns et al., 1993; Hakami et al., 1995; Pyrak-Nolte et al., 1997), despite the fact that normal distributions (Hakami and Larsson, 1996; Oron and Berkowitz, 2001; Sharifzadeh et al., 2004) and bimodal distributions (Bertels et al., 2001) have also been reported. Power law distributions of apertures have been used in some applications (de Dreuzy et al., 2001a, 2002; Mourzenko et al., 2004), as confirmed by field measurements using techniques such as micro scanner logs, borehole televiewer and direct measuring of outcrops (Wong et al., 1989; Barton and Zoback, 1992; Clark et al., 1995; Fisher et al., 1995; Belfield and Sovich, 1995; Marrett, 1996). It is

Scale and Stress Effects on Hydro-Mechanical Properties of Fractured Rock Mass
9
now generally recognized that resolution and finite size effects on a power law population can also result in distributions that appear to be exponential or lognormal (Bonnet et al., 2001). It has been reported that mapping resolution effects (known as truncation) imposed on a power law population can result in a lognormal distribution, because aperture fractures with aperture values smaller than the distribution mode are incompletely sampled (Priest and Hudson, 1976, 1981; Hudson and Priest, 1983; Einstein and Baecher, 1983; Dershowitz and Einstein, 1988). Therefore, in this study we assumed that aperture distribution in the fractured rocks follow to a lognormal distribution, as also has been reported in literature (Gale, 1987; Hakami and Barton, 1990; Hakami et al., 1995; Iwano and Einstein, 1993; Johns et al., 1993; Pyrak-Nolte et al., 1997). A lognormal density distribution fLN of aperture h can be written, in a general form, as
2
2log
2)(ln
21)( b
hh
LN ebπh
hf−
−= ∞≤≤ h0 , (2.6)
where logh and b are the first and second moments of the lognormal distribution. Given the mean logh and standard deviation b in log scale, the mean h and standard deviation σ in an arithmetic space are calculated as follows:
))(21exp( 2log bhh += , (2.7)
212 )1)(exp( −= bhσ . (2.8)
If the mean and standard deviation in an arithmetic space are known, one can also calculate the first and second moment of the lognormal distribution by
2log )(21)ln( σhh −= , (2.9)
212 ))(1(ln(hσb += . (2.10)
A lognormal distribution of fracture aperture is characterized by a long tail of large aperture values. In numerical modeling using mapped fracture system data, truncations in aperture and trace length cannot be avoided because they come directly from in situ mapping. In this study we assume a truncated distribution function of apertures that varies from 1 μm to 200 μm. The truncated lognormal distribution is then given by

Alireza Baghbanan TRITA LWR PHD 1040
10
⎪⎪⎪
⎩
⎪⎪⎪
⎨
⎧
∞≤≤
≤≤
≤≤
=∫
hh
hhhdhhf
hfhh
hf
b
bah
h LN
LN
a
LNTR b
a
............................0
.............)(
)(0............................0
)( (2.11)
where )(hf LN takes the form of equation (2.6), and ha and hb are the lower and upper aperture limits, respectively. The cumulative distribution function for the truncated lognormal distribution of aperture is then calculated by
dHHfdHHf
dHHfhFTCDFh
h LNh
h LN
h
h LNTRLNTRab
a
a∫
∫∫ === )(
)(
1)()( .
(2.12)
After some algebraic manipulation, TCDF of a lognormal distribution is found as
)()()()()(
)(
1)(ab
ah
hh
h
LNTR hghghghgdHHf
dHHfFhFTCDF
ab
a−−
==== ∫∫
,
(2.13)
where g(h) = erf [(ln h − h log) 2b] , and erf is the error function. Consequently, the fracture aperture is calculated using the following equation:
[ ]{ } ))()()(2exp( loghhghghgFerfinvbh aab ++−×= . (2.14)
The parameter F in equation (2.14) is the random number uniformly distributed in the range 0 ≤ F ≤ 1(Priest, 1993), and erfinv is the inverse error function. Figure 2.1 shows a sensitivity analysis of the effect of second moment b of a truncated lognormal aperture distribution. As can be seen, at very small standard deviation, b = 0.1 (Fig. 2.1a) the lognormal distribution acts like a normal distribution, as also reported in Margolin et al. (1998). Therefore, in this study we chose the second moment values b = 1 and 3, with a constant mean value of 65 μm taken from Min et al. (2004) for numerical studies.
2.4.3 Correlation between aperture and trace length of fractures–as reported in literature
Field fracture mapping results have led some researchers to develop relations between fracture trace length and aperture (Stone, 1984; Hatton et al., 1994; Vermilye and Scholz, 1995; Walmann et al., 1996;

Scale and Stress Effects on Hydro-Mechanical Properties of Fractured Rock Mass
11
Johnston and McCaffrey, 1996; Renshaw and Park, 1997), and it has been proposed that fracture aperture/width may be correlated with fracture trace length by a power law function. Stone (1984) reported that because of variability of fracture width (aperture) with the fracture trace length, the relation between length and width must be considered probabilistically. Hatton et al. (1994) studied the relation between the measured fracture length and maximum opening displacement of fracture populations in Kelduhverfi and Myvatn areas in Iceland. They found that basically the correlation between fracture trace length and aperture follows a power law with different values of proportionality constants and exponents. Vermilye and Scholz (1995) measured the veins formed in a variety of rock types and tectonics environments at seven field locations and determined a general scaling relation between the trace length and opening displacement (aperture). The clustering of vein trace lengths reflects a greater frequency of smaller fractures and is a consequence of the power-law size distribution typically observed for fracture populations. Walmann et al. (1996)) studied the fault-fracture patterns in slabs of clay during extensional deformations. A new scaling relation was proposed for the trace length l of a fracture as a function of its area
βAl ≈ with the same exponent β = 0.68 ± 0.03 for many deformation types. A consequence of this scaling relation is that the width (aperture) of a fracture scales with the trace length as ββlh )1( −≈ . In this case the exponent parameter is 47.0)1( =−= ββα . Empirical studies by Marrett (1996) indicated a correlation relation between aperture and trace length scale as
mglh = , (2.15)
where g and m are empirical scaling constants. Johnston and McCaffrey (1996) found that, in general,
akhl = , (2.16)
where l = trace length, h = thickness (aperture), 0.6 < a < 1, when l and h are in millimeter scale and the k value varies in a range of 20 < k < 2000 mm l-a (Johnston and McCaffrey, 1996). For small veins the exponent is ranged in 0.6 < a < 1.0 (usually from 0.7 to 0.8) and for large veins a > 1.

Alireza Baghbanan TRITA LWR PHD 1040
12
Aperture
.0000812
.0000787
.0000762
.0000737
.0000712
.0000687
.0000662
.0000637
.0000612
.0000587
.0000562
.0000537
.0000512
Truncated Lognormal Distribution
b=0.1
Freq
uenc
y
1600
1400
1200
1000
800
600
400
200
0
(a)
Aperture
.000194
.000181
.000169
.000156
.000144
.000131
.000119
.000106
.000094
.000081
.000069
.000056
.000044
.000031
.000019
.000006
Truncated Lognormal Distribution
b=1.0
Freq
uenc
y
2000
1000
0
(b)
Aperture
.000162
.000150
.000137
.000125
.000112
.000100
.000087
.000075
.000062
.000050
.000037
.000025
.000012
0.000000
Truncated Lognormal Distribution
b=3.0
Freq
uenc
y
7000
6000
5000
4000
3000
2000
1000
0
(c)
Fig. 2.1. Variation of apertures in a truncated lognormal distribution with different second moments.

Scale and Stress Effects on Hydro-Mechanical Properties of Fractured Rock Mass
13
The most comprehensive study about correlation between fracture aperture and trace length on the field mapping results was reported by Renshaw and Park (1997). The study of the scaling properties of tensile fractures in Krafla fissure swarm, which is a part of the axial rift zone in northern Iceland, showed that there is a distinct break in slope in aperture-trace length scaling relation (Fig. 2.2), as also reported by Hatton et al. (1994). This break in slope was interpreted qualitatively as indicative of a non-universal, scale-dependent growth mechanism. It is evident from the available measurement data and observations that aperture/width and trace length of fractures are indeed correlated, even though a universally valid correlation function may not exist, with power laws appearing to be the dominating type of such correlations. The uncorrelated case may be a simplification suitable for comparison studies.
2.4.4 The correlation equation between fracture aperture and trace length To examine the impact of fracture aperture-trace length correlation on the permeability, deformability and strength of fractured rocks, a power law correlation equation was developed based on truncated lognormal and power law distribution functions of aperture and trace length, respectively.
Fig. 2.2. Scaling of fracture aperture with length at two locations within the Krafla fracture swarm (Renshaw and Park, 1997).

Alireza Baghbanan TRITA LWR PHD 1040
14
The probability density function for power law distribution of trace length is defines as
PDF = fP (l ) = al−α , l > 0, (2.17)
where a is a constant and α is an exponent. The Cumulative Distribution Function for a power law distribution of fracture trace lengths is then calculated by
CDF = Fp(l ) = f (L)dL =0
l∫ aL−β0l∫ dL =
α1−α
l1−α . (2.18)
The truncated cumulative density function for fracture trace length following a power law distribution then becomes
TCDF = FPTR(l ) = F =
l1−α − lmin1−α
lmax1−α − lmin1−α
, (2.19)
where lmin and lmax are the minimum and maximum truncated fracture trace lengths. The fractal dimension D in 2D fracture system is given by D = α – 1 (Bonnet et al., 2001). Therefore, equation (2.19) may be written as
DD
DD
PTR llll
FlFTCDF −−
−−
−
−===
minmax
min)( . (2.20)
Finally, the stochastic fracture trace lengths following a power law distribution can be generated by the equation (2.1) shown in this chapter. For generating stochastic fracture system realizations, the key is the cumulative distribution functions using random numbers following a uniform distribution in the range of 10 ≤≤ F , as follows:
dhhfdllf LNTRPTR )()( = . (2.21)
If one substitutes equations (2.13) and (2.20) into equation (2.21), one finds
dhhfdllf LNTRPTR )()( = ⇒ )()()()(
minmax
min
ab
aDD
DD
hghghghg
llll
−−
=−
−−−
−−
, (2.22)
and so finally the correlation equation is
l = lmin
−D +g(h) − g(ha )g(hb ) − g(ha )
⎡
⎣ ⎢
⎤
⎦ ⎥ (lmax−D − lmin
−D )⎧ ⎨ ⎩
⎫ ⎬ ⎭
−1 D. (2.23)

Scale and Stress Effects on Hydro-Mechanical Properties of Fractured Rock Mass
15
Figure 2.3 shows the relation between aperture and trace length for different values of the second moment b, as defined by equation (2.23). The solid and dashed lines correspond to aperture variations with increasing fracture trace length, when b equal 1 or 3, respectively. It shows that the probability of having large fractures with larger aperture values increases with increasing value of b.
2.5 Generation of DFN realizations Based on the discrete fracture generation program reported in Min and Jing (2003) for generating DFN realizations, a new program is developed for generating the DFN realizations with different aperture distribution functions that is correlated to trace length according to equation (2.23). Multiple DFN realizations were generated using Monte Carlo simulations with the fracture orientations and trace lengths following respective cumulative probability density functions, as defined above. Different fracture aperture values are generated and assigned to fractures in the DFN realizations according to their trace lengths. To avoid boundary effects, ten sufficiently large ‘parent’ DFN models of 300 m × 300 m in size were first generated, based on the geometric parameters of the fracture system. From each of the ten large parent network models, smaller DFN models were extracted with varying sizes from 0.25 m × 0.25 m to 20 m × 20 m, as shown in Fig. 2.4, for size-dependency studies of the DEM models based on the REV concept.
Trace Length (m)
Ape
rture
(μm
)
50 100
50
100
150200
Standard Deviation,b=1.0Standard Deviation,b=3.0
Fig. 2.3. Fracture aperture versus trace length for different values of the second moment b.

Alireza Baghbanan TRITA LWR PHD 1040
16
In order to check whether the calculated permeability can be represented by a tensor at a certain REV scale, one series of the DFN models were rotated at an interval of 30 degrees in the clock-wise direction for the calculation of the directional permeability values of the DFN models using the same generic hydraulic boundary conditions. Figure 2.5 shows an example of the rotated DFN models in two different rotated angles within the large-scale parent model.
Fig. 2.4. The procedure of DFN generation from large to small-scale models for investigation of REV.
x
y
Fig. 2.5. Example of the rotated DFN models in reference configuration (solid rectangle), and at a 30 o rotation angle (dotted rectangle).

Scale and Stress Effects on Hydro-Mechanical Properties of Fractured Rock Mass
17
3 DEFORMABILITY OF THE SINGLE FRACTURES WITH CORRELATION BETWEEN APERTURE AND TRACE LENGTH Laboratory studies of normal stress-normal displacement (changing in aperture) of rock fractures reported in (Iwai, 1976; Goodman, 1976; Bandis et al., 1983; Raven and Gale, 1985; Yoshinaka and Yabame, 1986; Evans et al., 1999; Pyrak-Nolte and Morris, 2000; Lee and Cho, 2002) show that the specific flow rate and hydraulic conductivity of fractures decrease or increase nonlinearly with increase or decrease of the normal stress during loading and unloading processes, respectively. On the other hand, the results of coupled shear-flow tests (Gentier and Hopkins, 1997; Esaki et al., 1999; Olsson and Barton, 2001; Lee and Cho, 2002; Jiang et al., 2004) show that in most cases the specific flow rate and hydraulic conductivity of a fracture increases with increasing shear displacement due to shear-induced dilation. In this section, a non-linear relation of the normal displacement-normal stress is developed when the initial fracture aperture is correlated with fracture trace length so that both the closure and normal stiffness are both trace length- and stress-dependent.
3.1 Mechanical behavior of fractures in the normal direction The most widely adopted model for the nonlinear behavior of fractures under normal stress is the hyperbolic function for normal closure of fracture with respect to normal stress as reported in (Goodman, 1976; Bandis, 1980; Bandis et al., 1983). Goodman (1976) proposed that the fracture closure, δ, is related to the normal stress, σn, through the following empirical hyperbolic relation:
⎥⎥⎦
⎤
⎢⎢⎣
⎡⎟⎟⎠
⎞⎜⎜⎝
⎛−
+=t
mnn δδ
δσσ 10 , (3.1)
defined for 0nn σσ ≥ . The stress value σn0 is the initial normal stress, or the so-called low seating normal stress, t is a dimensionless empirical exponent, and mδ is the maximum possible fracture closure, approached asymptotically as the normal stress increases. A more compact form of the hyperbolic relation fitting the fracture closure-normal stress behavior is reported by Bandis et al. (1983):
δδδδ
δδδ
σ−
=−
=m
mn
m
nn
kk 00
)(1, (3.2)
where kn0 is an empirical parameter representing the initial normal stiffness. The fracture closure is related to normal stress by
δ =
σnσn + kn0δm
⎛
⎝ ⎜
⎞
⎠ ⎟ δm (3.3)

Alireza Baghbanan TRITA LWR PHD 1040
18
and the normal stiffness of fracture, kn, is given by
kn =
dσndδ
=kn0
(1−δ δm )2 (3.4)
where kn0 is the normal stiffness at a low confining stress. The function proposed by Goodman (1976) reduces to equation (3.2) when t = 1 and σn >> σn0. One can write equation (3.4) as a function of normal stress:
kn =
(σn + kn0δm )2
kn0δm2
. (3.5)
Efforts have been made to determine initial normal stiffness, kn0, and maximum fracture closure, mδ , as functions of other fracture characteristic parameters. The Barton-Bandis empirical fracture constitutive model such as reported by Bandis et al. (1985) is a relation between initial normal stiffness and maximum fracture closure, as a function of initial aperture, hi, laboratory scale fracture wall compression strength, JCS0, and laboratory scale fracture roughness coefficient, JRC0 in the following form:
155.7748.10178.0 00
0 −+⎥⎦
⎤⎢⎣
⎡= JRC
hJCS
ki
n , (3.6)
and
η
im h
JCSγJRCβαδ ⎥
⎦
⎤⎢⎣
⎡++= 0
0 )( , (3.7)
where α , β , γ and η are empirical constants associated with normal loading cycle numbers during a cyclic loading–unloading normal compression tests of a rock fracture. These empirical equations and the associated constants are most valid in the tested samples under the specific testing conditions and processes, but cares need to be taken when they are applied to general practical problems. Experimental studies about effect of stress on fracture permeability show that there may be an effect of sample size on fracture permeability (Iwai, 1976; Yoshinaka and Yabame, 1986). The experimental results about the compressibility of rock fractures with different type of roughness also show that the maximum fracture closure is roughly proportional to the fracture length (Yoshinaka and Yabame, 1986). This means that the deformability of fractures under normal stress is also a function of fracture size, or trace lengths in 2D models.

Scale and Stress Effects on Hydro-Mechanical Properties of Fractured Rock Mass
19
In this study, based on equation (3.3), we develop an empirical equation for prediction of mechanical behavior of rock fractures in the direction normal to the mean fracture plane, when the initial hydraulic aperture is lognormally distributed and correlated with fracture trace length, and is calculated with variation of the normal closure δ of the fracture. The equation (3.3) can be rewritten as
δδm
=σn
σn + kn0δm=
σnσn + σn0
=σn σn0
(σn σn0 ) +1, (3.8)
where σn0 = kn0δm . Figure 3.1 shows a schematic variation of normalized normal closure, δ/ δ m (represented by solid line) and relative normal compliance, Cn (represented by the dashed line) that is calculated by
Cn =
∂(δ δm )∂(σn σn0 )
=1
[1+ (σn σn0]2. (3.9)
It can be seen that when the normal stress ratio is large enough, the variations of the normalized closure and normal stresses become very small, and the normal closure approaches the maximum closure with a significant decrease of relative normal compliance. For the purpose of demonstration, we assume that minimum variation of δ δm occurs after its value is equal or larger than 0.9 (Fig. 3.1), corresponding to a normalized normal stresses equal to or larger than 9, according to equation (3.8). In this study this value is defined as a normalized critical normal stress σnc/σn0, and assumed to be equal to 10 (Fig. 3.1). At the critical normal stress, normal stiffness takes a
Fig. 3.1. Schematic variation of normalized normal closure, δ/δm and relative normal compliance, Cn, versus normalized normal stress of rock fractures, σn /σn0.

Alireza Baghbanan TRITA LWR PHD 1040
20
form as kn0 = σnc 10δm . Substitution of kn0 = σnc 10δm into equation (3.2) leads to a simplified normal stress-normal closure relation of
)(10 δδδσ
σ−
=m
ncn . (3.10)
The normal stiffness is then associated with this stress-closure relation given by
mnc
ncnnk
δσσσ
10)10( 2+
= . (3.11)
Figures 3.2a-c show the results of a sensitivity analysis about the effect of the ratio of maximum fracture closure with respect to the initial hydraulic aperture on fracture deformability when critical normal stress is a constant, ncσ = 30 MPa. In this example, the effects of three different initial aperture values hi=10, 65 and 200 μm are examined. The effect of variable critical normal stresses, when δm hi =0.9, are also illustrated in Figs. 3.2d-f. Each graph represents the variation of current aperture, and normal stiffness versus normal stress. With increasing ratio of the maximum fracture closure over the initial hydraulic aperture, normal stiffness decreases and variation of current aperture with normal stress becomes more significant (Figs. 3.2a-c). On the other hand, some experimental results of direct flow shear tests show that there is always a residual flow even at high normal stresses (Iwai, 1976). Therefore the maximum fracture closure, or in other words the maximum residual aperture, is less than initial aperture, and it can be a function of initial aperture and should be determined by experiments (Iwai, 1976). In this study for simplicity and also for detection of the effect of rather low applied normal stress on fracture aperture, we choose δm hi = 0.9 for the demonstrative analyses (Fig.3.2). According to the model proposed above, the deformability of rock fractures is significantly affected by the normal stress. Observations of deformability characteristics with constant values of δm hi (Figs. 3.2d-f) illustrate that with increasing normal stress, fractures become stiffer. For fractures with small initial apertures when a large value of
ncσ is assumed, fractures maintain conductive even at high normal stresses. Therefore, the overall permeability of fracture networks increases when the fracture aperture is correlated with fracture trace length in DFN models with some larger scale fractures. Experimental results have shown that with increasing the initial hydraulic aperture (transmissivity), higher normal stresses have to be applied to reach the maximum normal closure of fractures (Iwai, 1976; Goodman, 1976; Bandis et al., 1983).

Scale and Stress Effects on Hydro-Mechanical Properties of Fractured Rock Mass
21
As reported by Nirex (1997c) and Min et al. (2004b), the critical normal stress is 30 MPa where the initial aperture is 65 μm. So far there is no practical technique to measure the deformability of large fractures in the field. Therefore estimation of critical normal stress based on linearly proportional variations of fractures size was adopted in this study. The critical normal stress is assumed to vary between 3 to 100 MPa that is proportionally linear to a range of initial aperture from 1 to 200 μm (Baghbanan and Jing, 2007). Figure 3.3 shows the variations of normal deformability of fractures under normal stresses for different initial hydraulic apertures. It can be seen that the normal deformation of fractures under small normal stresses is significant even for fractures with small initial apertures. When the stochastically generated aperture values from equation (2.23) are substituted into the equations (3.12) and (3.13), deformability of each fracture in the fracture network becomes a function of fracture trace length. In this way, both the normal stress effect and effect of the fractures size are linked through the correlation relation (2.23). The effect of shear dilation on fracture aperture is considered separately in the constitutive models of the rock fractures in UDEC code, as described below.
3.2 Fracture shear behavior Beside the magnitudes of stresses, orientations and friction angles of the fractures are significant for the stress states along and across the fractures. The shear failure occurs when created shear stress component is greater than shear resistance of each fracture, depending on the friction angle and fracture orientation relative to the applied stress orientation. When there is only one single fracture, this problem can be analyzed with the aid of Mohr diagram (Jaeger et al., 2007). Numerical methods such as DEM are needed to determine the stress states of fractures in the fracture networks where multiple fractures have finite sizes and interact with each other. Shear dilation occurs as a result of overriding asperities of two rough fracture surfaces, represented here by a dilation angle, and may reach to the stationary value with increasing the fracture shearing according to the constitutive model adopted. In this study, the shear stress-shear displacement behavior of fractures was modeled by an elasto-perfectly plastic constitutive model with a Mohr–Coulomb failure criterion and fracture dilation occurs when it starts to slide. This dilation continues until a pre-defined critical shear displacement value beyond which the dilation stops (Itasca, 2004). Since the main objective of this work is to determine the effect of stress on the fracture network permeability when the normal deformability of fractures is scale and stress dependent, the asperity damage of fractures and the damage-induced gouge materials were not considered.

Alireza Baghbanan TRITA LWR PHD 1040
22
Variation of δm hi when ncσ = 30 MPa
Aperture (h) mm
Normal Stiffness (Kn) MPa/mm
Nor
mal
Stre
ss(S
n)M
Pa
0.00 0.05 0.10 0.15 0.20
0 20000 40000 60000 80000 100000
0
20
40
60
80
100
Sn-Kn; hi=0.01 mmSn-h; hi=0.01 mmSn-Kn; hi=0.065 mmSn-h; hi=0.065 mmSn-Kn; hi=0.2 mmSn-h; hi=0.2 mm
(a) δm hi =0.1
(b) δm hi =0.5 Aperture (h) mm
Normal Stiffness (Kn) MPa/mmN
orm
alS
tress
(Sn)
MP
a
0.00 0.05 0.10 0.15 0.20
0 20000 40000 60000 80000 100000
0
20
40
60
80
100
(c) δm hi =0.9 Aperture (h) mm
Normal Stiffness (Kn) MPa/mm
Nor
mal
Stre
ss(S
n)M
Pa
0.00 0.05 0.10 0.15 0.20
0 20000 40000 60000 80000 100000
0
20
40
60
80
100
Fig. 3.2 Deformability characteristics of a fracture under normal stress when critical normal stress is constant (a), (b) and (c).

Scale and Stress Effects on Hydro-Mechanical Properties of Fractured Rock Mass
23
(d) ncσ = 3 MPa
Variation of ncσ when δm hi = 0.9
Aperture (h) mm
Normal Stiffness (Kn) MPa/mm
Nor
mal
Stre
ss(S
n)M
Pa
0.00 0.05 0.10 0.15 0.20
0 20000 40000 60000 80000 100000
0
20
40
60
80
100
(e) ncσ =50 MPa Aperture (h) mm
Normal Stiffness (Kn) MPa/mm
Nor
mal
Stre
ss(S
n)M
Pa
0.00 0.05 0.10 0.15 0.20
0 20000 40000 60000 80000 100000
0
20
40
60
80
100
(f) ncσ = 100 MPa Aperture (h) mm
Normal Stiffness (Kn) MPa/mm
Nor
mal
Stre
ss(S
n)M
Pa
0.00 0.05 0.10 0.15 0.20
0 20000 40000 60000 80000 100000
0
20
40
60
80
100
Fig. 3.2(continued) Deformability characteristics of a fracture under normal stress when when the ratio of maximum fracture closure to initial aperture is constant (d), (e) and (f).

Alireza Baghbanan TRITA LWR PHD 1040
24
The effects of the normal stress and scale effects on dilation (therefore aperture/transmissivity) are not considered in the fracture models in UDEC. The mechanical properties of intact rock and fractures in this study are based on the laboratory test results reported in Sellafield site investigation results (Nirex, 1997c). The Young’s modulus, Poisson’s ratio and uniaxial compressive strength of intact rock are 84 GPa, 0.24 and 157 MPa, respectively. The initial normal stiffness, shear stiffness, friction angle and dilation angle of fractures were defined as 434 GPa/m, 434 GPa/m, 24.9º and 5º, respectively, and the critical shear displacement for dilation was assumed to be 3mm. The maximum aperture value by dilation is assumed to be ten times of residual aperture value for each fracture (Nirex, 1997c).
Aperture (mm)
Nor
mal
Stre
ss(M
Pa)
0 0.05 0.1 0.15 0.20
20
40
60
80
100
hi=0.01 mmhi=0.04 mmhi=0.065 mmhi=0.1 mmhi=0.15 mmhi=0.2 mm
Fig. 3.3. Variation of aperture with normal stress for assumed initial apertures.

Scale and Stress Effects on Hydro-Mechanical Properties of Fractured Rock Mass
25
4 MODELING METHODOLOGY In this chapter firstly calculation of equivalent permeability components and also evaluating the permeability tensor are described. Then the algorithms for calculating the mechanical properties of fractured rocks under uniaxial and biaxial compressive stress tests are explained. The procedure of study about stress dependency of the hydraulic properties of rocks is reported in the last section of this chapter.
4.1 Calculation of the equivalent permeability using UDEC The algorithm of fluid flow through fractures using UDEC code has been extensively described in Itasca(2004), and only a few special features are briefly presented here. For fluid flow analysis using the UDEC code, first the fractures are randomly generated, after which the network is ‘regularized’ so that the “dead-ends” of the fractures and the isolated and “singly connected” fractures (fractures having only one intersection with other fractures or model boundary), are deleted, as they would not contribute to the fluid flow. The DFN models after this regularization therefore become complete percolating graphs. Then, hydraulic aperture values are assigned for each individual fracture, based on the original trace length, according to the cases of correlated or uncorrelated aperture distributions as defined above The mass continuity equations are then established at the fracture intersections for fluid flow between intersections. These equations are solved through an iterative scheme with respect to the prescribed boundary conditions. Since the purpose of the calculations in this study is to evaluate the directional permeability of the DFN models, steady state flow with a generic hydraulic boundary condition with a constant hydraulic gradient in the x- and also the y-directions are assumed (Fig. 4.1).
Fig. 4.1. Hydraulic boundary conditions for calculation of fluid flow and evaluation of permeability of DFN models.
X
Y
P2 P1
P1
P2

Alireza Baghbanan TRITA LWR PHD 1040
26
The equivalent permeability tensor, kij, is evaluated based on Darcy’s law for anisotropic and homogeneous porous media, considering flow only in fractures (Long et al., 1982). The permeability components for each DFN model, kxx, kyy, kxy, and kyx, can be obtained from using a set of bi-directional and linearly independent generic boundary conditions when hydraulic pressure gradient is assumed to be constant (Bear, 1972). The flow calculations were repeated for the calculation of the directional permeabilities of the rotated DFN models. The permeability of a DFN model can be approximated by a tensor when an ellipse can be fitted to the calculated directional permeabilities when plotted as k/1 on a polar diagram (Bear, 1972). If the values of k/1 do not approximate an ellipse, then a symmetric conductivity tensor cannot be used to describe the medium. Moreover, if a permeability tensor cannot be established, the flow through the medium cannot be analyzed with equivalent continuum mechanics approaches (Long et al., 1982). In order to check the possible tensor representation of the directional permeabilities, first an average permeability matrix ijk of the rotated DFN models was calculated by averaging the projected permeability values on the reference axes ( 0=α ) from all of the rotated permeability components, given as,
jqip
N
pqij aakN
k ∑=1
1 α , (4.1)
where N denotes the number of rotations, ipa and jqa are directional cosines, and α
pqk the calculated permeability in each rotated model at direction angle α . Then ijk was transformed to the pertinent rotation angles ( )(αijk ). The average permeability matrix ijk thus calculated using equation (4.1) therefore represents a measure of existence of an ideal ellipse of the permeability in 2D. The fitting goodness of this average matrix to an ellipse in a polar diagram indicates the existence of a permeability tensor. When the size of a DFN model increases with increasing fracture population with varying connectivity, and if the difference between the components of the matrix )(αijk and the calculated directional permeabilities deareases and converges to an ideal ellipse, then an equivalent tensor of permeability of the DFN models can be approximated at that sepcific size of the DFN model, the REV scale. The quality of fitting an ellipse from the calculated directional permeabilities of the rotated DFN models is, therefore, subjective to the evaluation of differences between the rotated average )(αijk and the actual values calculated from the model, )(αgk (Hestir and Long, 1990). To help in evaluating this goodness of fitting more objectively or quantitatively, a measure using the major and minor principle permeabilities (K1 and K2), according to

Scale and Stress Effects on Hydro-Mechanical Properties of Fractured Rock Mass
27
∑ −+
=N
ijgNorm kkNKK
RMS1
221
)]()([1)(
2 αα , (4.2)
was used (Hestir and Long, 1990). For randomly distributed fracture networks, an equivalent continuum representation is an approximation when the value of mean square error represented by equation (4.2) is relatively small, judged by requirements of specific applications in specific range of RMSNorm. According to Öhman and Niemi (2003), RMSNorm < 0.2 can be taken as indicating a good fit for stochastic DFN models, which, however, may not be valid universally.
4.2 Numerical methodology for calculation of mechanical properties and stress dependency of strength
The generated DEM models with sizes varying from 1 m to 20 m in linear dimensions, which contain a large numbers of small rock blocks, were used to study the size effect. The rock blocks were treated as linear, isotropic, homogeneous and elastic materials and subdivided with constant-strain triangle finite-difference elements. Figure 4.2 shows the schematic boundary conditions for calculating the mechanical properties of fractured rocks and REV. A series of uniaxial and biaxial numerical compression tests were conducted on the DEM models and the Young’s modulus, Poisson’s ratio, maximum elastic strength and compressive strength envelopes for all of the models with different initial aperture patterns were calculated. In this study a typical uniaxial compression test with a numerical servo-control algorithm was applied. A Constant Loading Velocity (CLV) condition was applied on the horizontal boundaries (Fig. 4.2a). The loading velocity was controlled in such a way that models were not loaded faster than the velocity with which the stresses can be transferred numerically through the entire tested model. Failure occurs when the accumulated unbalanced force becomes higher than a
Fig. 4.2. Uniaxial (a) and Biaxial (b), stress boundary conditions for calculation of mechanical properties of fractured rocks.
(a)
C.L.V
C.L.V (b)
C.L.V
C.L.V
σx

Alireza Baghbanan TRITA LWR PHD 1040
28
specified maximum unbalanced force. Using this numerical device, possible post-peak behavior of the models under biaxial stress condition can be detected. The loading plates were modeled to enable a zero frictional effect between the plates and the boundaries of the tested DEM models (Christianson et al., 2006; Baghbanan and Jing, 2008d). Four loading cases were used for conducting the numerical compression tests. The horizontal stress was set for four values of 0 MPa (for uniaxial compressive tests), 1 MPa, 3 MPa and 5 MPa as confining pressures during standard biaxial compressive tests, then the vertical load was increased until failure occurs (Fig. 4.2b) for each case of the horizontal stress. The loading process was controlled by a numerical servo-control program such that the loading rate was kept in a range of maximum and minimum loading allowances (maximum and minimum unbalanced forces in UDEC program) to avoid sudden violent failure of the DEM models, similar to the standard servo-controlled tests of small samples in laboratories. The maximum and minimum unbalanced forces and maximum loading rate for each DEM model are determined based on the applied confining pressure (the horizontal stress) to detect a servo-controlled mechanical response of the model during the loading process. A history of axial stress σy, axial strain εy and lateral strain εx, as shown in Fig. 4.3, were recorded for each numerical compression test. The mean values of Young’s modulus, Poisson’s ratio and elastic strength of the tested DEM models were calculated. Using the complete sets of biaxial compression tests, the angle of internal friction and cohesion for Mohr-Coulomb (M-C) failure criteria and characteristics parameters of Hoek-Brown (H-B) failure criteria were calculated. The elastic strength was defined as the maximum vertical stress before non-elastic behavior occurs. In this study stress-strain behavior of DEM models mostly show work-hardening behavior. Therefore stress-strain curve is simplified as compositions of two linear behaviors with different slopes. The intersection point between the two linear parts of the stress-strain curves is defined as the elastic strength, as shown in Fig 4.3. Equivalent axial Young’s modulus Er and Poisson’s ratio νr were calculated using the numerical results of the elastic part of the axial stress-strain curves of the DEM models of complex fracture geometry, as the slopes of the straight lines representing the elastic stress-elastic strain part of the curves, and the Poisson’s ratio was determined as the ratio between the lateral strain over the axial strain in the elastic range of the curve, typically at the axial stress equal to the 50% of elastic strength as shown in Fig. 4.3. The most common phenomenological failure criteria adopted in rock engineering are the Mohr-Coulomb failure criterion (M-C) and Hoek-Brown criterion (H-B). The Mohr-Coulomb failure criterion describes

Scale and Stress Effects on Hydro-Mechanical Properties of Fractured Rock Mass
29
a relation between normal stress, σn and shear stress, τ (equation 4.3), or alternatively, as described in equation 4.4,
τ = c + σn tan φ (4.3)
3sin1sin1
sin1cos2 σ
φφ
φφcσ cr −
++
−= (4.4)
where c is the cohesive strength, φ is the friction angle and σcr and σ3 are the elastic strength of the tested rock and the confining pressure, respectively. The Hoek-Brown criterion is an empirical non-linear failure criterion defined as follows (Hoek and Brown, 1980):
σcr = σ3 + mrσ3σci + srσci2 , (4.5)
where mr and sr are two dimensionless constant parameters of rock masses which vary with types of rock masses and σci is the uniaxial compressive strength of the intact rock. The above two criteria were used to see which one of them fits better with the numerically generated mechanical behaviors of the DEM models, for the specific fracture system geometry and the assumed mechanical properties of fractures and rock matrix adopted in this study, in a similar way as testing a small intact rock sample in a triaxial chamber.
Lateral Strain (%) Axial Strain (%)
Axi
alS
tress
(MP
a)
-0.5 -0.4 -0.3 -0.2 -0.1 0 0.1 0.2 0.3 0.4 0.5 0.6 0.70
25
50
75
100
125
150
175
Axial Stress-Lateral Strain Axial Stress-Axial Strain
Elastic strength
50% of Elastic strength
Fig. 4.3. Axial stress versus axial strain and lateral strain curves of numerical compressive test.

Alireza Baghbanan TRITA LWR PHD 1040
30
4.3 The DEM model establishment for evaluating stress dependency of permeability
The field and empirical studies have indicated that the ratio of horizontal to vertical in-situ rock stresses, K, is greater than unity and varies in a range up to five and a half (Brown and Hoek, 1978). On the other hand empirical and analytical studies have shown that such a stress ratio, at certain depths, varies in special ranges depending on the geological history of the region concerned, structures, mechanical properties of rock and interaction with other agents such as water (Sen and Sadagah, 2002). In this study we chose the stress ratio in a range of 1 to 5 in which the vertical stress was fixed at 5 MPa in order to examine the effects of normal and shear deformability of fractures in the DEM models and compare the results with the results reported by Min et al. (2004b). Figure 4.4 shows the schematic generic boundary conditions for calculation of permeability changes under various applied stresses for the DEM models at a zero rotation angle. For rotated DEM models, firstly the corresponding stress tractions across and along the boundary of rotated models are calculated and applied according to the applied principal stress fields on the DEM models at reference axis
Fig. 4.4. Application of stress boundary conditions and calculation of equivalent permeability components in the x- and y-directions for the models at reference axis.
X
Y
P1P2
P1
P2
σv
σh

Scale and Stress Effects on Hydro-Mechanical Properties of Fractured Rock Mass
31
and then fluid flow simulation is performed. Each DFN model contains a large numbers of small rock blocks that were treated as linear, isotropic, homogeneous, elastic and impermeable materials and subdivided with constant-strain triangle finite-difference elements. Variations in hydraulic behavior of fractures such as opening, closure, sliding and dilation were governed by incorporating the relative motions of the blocks and the fracture constitutive model with a step-wise non-linear normal stress-normal closure relation to approximate a hyperbolic normal displacement–normal stress behavior, as described in section 3.1, and a Mohr-Coulomb type of elasto-perfectly plastic shear behavior. Equivalent permeability components under different applied stress ratio are calculated and permeability ellipses approximated using the same algorithms as described in Chapter 4.1.

Alireza Baghbanan TRITA LWR PHD 1040
32
5 SCALE DEPENDENT HYDRAULIC AND MECHANICAL PROPERTIES OF FRACTURED ROCKS The scale dependent hydraulic and mechanical properties of fractured rocks when fracture apertures either correlated or not correlated with fracture trace lengths are described in two sections. The results are also extensively explained in papers I, III and V.
5.1 Results of scale dependent equivalent permeability and permeability tensor (papers I and III)
This section first presents the numerical results about the model size effect on the permeability when the fracture aperture is constant and equal to 65 μm. The results from the models with correlated fracture aperture and trace length distributions with different values of the second moment of the lognormal distribution of aperture (b = 1, 3) are followed. Finally, we present the results of similar simulations for the case with uncorrelated aperture and trace length distributions with b = 1 and 3. The results then are compared for demonstrating the increased difficulty with correlated aperture and trace length distributions and with increasing scattering of aperture distributions with increasing b values. To make the graphic presentation of results more clearly, the results of calculated diagonal, kxx and kyy; and off-diagonal, kyx and kxy permeability components in the 2D global x-y coordinate system are plotted as functions of the DFN model size, from the 10 realizations as scattered data points and curves showing their mean and coefficient of variance (‘CV’) values. The points for the maximum and minimum values of the scattered data points are connected to show the bounding curves for maximum and minimum values, respectively.
5.1.1 Results with a constant fracture aperture Calculated values of the minimum, maximum, mean and coefficient of variance (‘CV’) of the permeability components of ten DFN realizations of different sizes with a constant hydraulic aperture of 65 μm are shown in Fig. 5.1. After a model side length of 8 m is reached, the kxx and kyy permeability components do not change significantly. The ‘CV’ value also becomes very small (5%). In addition, the values of kxy and kyx decrease steadily with increasing model size, and close to zero as the size of the region continue to increase, indicating an almost symmetric permeability matrix with dominating diagonal elements of kxx and kyy, with a DFN model side length of 8 m. The main reason for such nearly symmetric permeability behavior with dominating permeability in x and y-directions at this scale is the dominant sub-vertical (y-direction) and sub-horizontal (x-direction) orientations of the four fracture sets (see Table 2.1). Their large non-zero initial values were the results of very small DFN models (from 0.25 m to 0.5 m and 1.0 m, for example) containing small numbers of fractures whose orientation are not dominated in the sub-vertical and sub-horizontal directions. In addition, with a constant aperture of fractures, the effect of fracture size on aperture (therefore

Scale and Stress Effects on Hydro-Mechanical Properties of Fractured Rock Mass
33
transmissivity) disappears. An approximation to an almost ideal ellipse can be reached quickly at a REV size of 8 m or 5 m, according to subjective judgment of the acceptable value of coefficient of variance (see Figs. 5.3 and 5.4).
5.1.2 Results with correlated fracture aperture and trace length distributions
a) Scale effect and REV size Figure 5.2 shows the results and statistical parameters of calculated permeability components when the fracture apertures are lognormally distributed with a second moment of b = 1 (Fig. 5.2a,b and c) and b = 3 (Fig. 5.2d,e and f), and correlated with trace length. The data points for the permeability components (kxx, kyy, kxy and kyx) are more scattered (with the range of values increased more than one order of magnitude) than in the case with constant aperture and a much larger REV size is needed for a reasonable homogenization. However, both the mean values of permeability components and their ‘CV’ decrease with increase of model size, and an acceptable value of ‘CV’ of 20% at a DFN model size of 20 m can be approximated as a REV size for practical uses for the case with b=1, even an ideal ellipse is actually not reached (Figs. 5.3 and 5.4). However, the mean value of equivalent permeability between the two cases (b = 0 and b = 1) is similar (about 10-13 m2), due to the small value of b and a rather weak correlation between fracture aperture and trace length. The relative homogeneity of fracture system geometry and flow field still holds, as demonstrated by nearly symmetric values of kxy and kyx reaching zero in Fig. 5.2c, similar to the case of constant aperture, despite the increased scatter of results and REV size. When the hydraulic aperture is lognormally distributed with a higher value of the second moment, b =3, variations in the permeability components, and their mean and ‘CV’ values with respect to the DFN model size, increase continuously and significantly (Fig. 5.2d-f). Although variation of the kxx and kyy values decreases rapidly after a DFN model size of 10 m is exceeded (Fig. 5.2d,e), nevertheless the differences between minumum and maximum value is still more than two orders of magnitude at the model size of 20 m when the simulation stopped. The kxy and kyx values decrease rapidly for the same reason as given above (Fig. 5.2f). A REV size cannot be determined. However, it can only be estimated that it will be much larger than 20 m when b=3. b) Evaluation of the existence of a permeability tensor with correlated fracture aperture and length Figure 5.3 presents the calculated directional permeabilities for the three cases of constant fracture aperture (equivalent to b = 0), and distributed aperture with second moments b = 1 and b = 3, when fracture aperture is lognormally distributed and correlated with trace length. Dashed lines represent the values of )(/1 αijk , and solid lines represent the values of )(/1 αgk , as plotted in the polar coordinate system shown in Fig. 5.3. Below each figure, the size (S) of the DFN

Alireza Baghbanan TRITA LWR PHD 1040
34
model and the values of the normalized mean square error showing the goodness of fitting are presented. With increasing DFN model sizes, the simulated contours of directional permeability vary in both shapes and magnitudes for the three different cases of b = 0, 1 and 3, respectively (Baghbanan and Jing, 2007, Jing and Baghbanan, 2008). When the aperture is uniform (b = 0), a permeability ellipse can be established in a relatively small model size of 5 m or 8 m (depending on the judged RMSNorm values, Fig. 5.3a). For the case of correlated aperture and trace length, with b = 1, a model size of 20 m can be accepted as a REV size with a 15% RMSNorm value to approximate roughly an ellipse, for practical application purposes only (Fig. 5.3b). When b =3, even at a size of 20 m (Fig. 5.3c), the contour of the directional permeability is far from approximating an ellipse, and a permeability tensor cannot be established at this model scale (Baghbanan and Jing, 2007, Jing and Baghbanan, 2008). To evaluate the goodness of fit between )(/1 αijk and )(/1 αgk , of the DFN models, the mean square errors as defined in equation (4.2) are calculated. Figure 5.4 shows the variation of RMSNorm versus DFN model size, corresponding to the three different aperture distribution cases (b = 0, 1, and 3). When fracture aperture is uniform in DFN models, RMSNorm value approximates to a constant value of nearly 0.1 for a model size of 5 m. However, when fracture aperture is lognormally distributed with b = 1, this condition can only be met when the DFN model size reaches 20 m, where the RMSNorm is 0.15, close to the limit value of 0.2 as suggested in (Öhman and Niemi, 2003). For the case of b = 3, this condition cannot be met for any model sizes up to 20 m.
5.1.3 Results with uncorrelated fracture aperture and length distributions a) Scale effect and REV size When the fracture aperture is lognormally distributed following the equation (2.14) and independent of the trace length, variation of calculated equivalent permeability is decreased compared with correlated case. Figure 5.5 shows the simulation results for the case with second moments of b =1 (Fig. 5.5a, b and c) and b = 3 (Fig. 5.5d-f). The values of kxx and kyy permeability components decrease drastically up to a model size of 5 m and continue to decrease afterwards, and tend to converge to a constant magnitude of 10-14 m2 when value of 20% ‘CV’ can be reached for these components at an approximated model size of 10 m for the case with b =1 (Fig. 5.5a, b and Fig. 5.7). The magnitudes of kxy and kyx decrease rapidly reaching zero with the increasing model size, (Fig. 5.5c), due to the same reason as stated above in Section 5.1.2.

Scale and Stress Effects on Hydro-Mechanical Properties of Fractured Rock Mass
35
DFN Side Length (m)
Per
mea
bilit
yK
xx(m
2)
Coe
ffici
ento
fVar
ianc
e(%
)
0 2 4 6 8 10 12 140.0x10+00
5.0x10⁻¹⁴
1.0x10⁻¹³
1.5x10⁻¹³
2.0x10⁻¹³
2.5x10⁻¹³
3.0x10⁻¹³
0
20
40
60
80
100MinimumMaximumMeanCoefficient of Variance
Simulation Results
(a)
DFN Side Length (m)
Per
mea
bilit
yK
yy(m
2)
Coe
ffici
ento
fVar
ianc
e(%
)0 2 4 6 8 10 12 14
0.0x10+00
5.0x10⁻¹⁴
1.0x10⁻¹³
1.5x10⁻¹³
2.0x10⁻¹³
2.5x10⁻¹³
3.0x10⁻¹³
0
20
40
60
80
100
(b)
DFN Side Length (m)
Per
mea
bilit
yK
xy/K
yx(m
2)
0 2 4 6 8 10 12 14
-1.0x10⁻¹³
-5.0x10⁻¹⁴
0.0x10+00
5.0x10⁻¹⁴
1.0x10⁻¹³
(c)
Fig. 5.1. The results of the Min., Max., mean and coefficient of variance of the calculated permeability components from DFN models of different sizes when fracture aperture is constant (b=0), (a) kxx, (b) kyy, (c) kxy and kyx.

Alireza Baghbanan TRITA LWR PHD 1040
36
DFN Side Length (m)
Per
mea
bilit
yK
xx(m
2)
Coe
ffici
ento
fVar
ianc
e(%
)
0 2 4 6 8 10 12 14 16 18 2010-15
10-14
10-13
10-12
0
20
40
60
80
100MinimumMaximumMeanCoefficient of Variance
Simulation Results
(a)
DFN Side Length (m)
Per
mea
bilit
yK
xy/K
yx(m
2)
0 2 4 6 8 10 12 14 16 18 20
-1.0x10⁻¹³
0.0x10+00
1.0x10⁻¹³
2.0x10⁻¹³
(c)
DFN Side Length (m)
Per
mea
bilit
yK
yy(m
2)
Coe
ffici
ento
fVar
ianc
e(%
)
0 2 4 6 8 10 12 14 16 18 2010-15
10-14
10-13
10-12
0
20
40
60
80
100
(b)
Fig. 5.2. The results of the Min., Max., mean and coefficient of variance of calculated permeability components from DFN models of different sizes with correlated aperture and trace length with b=1 (a, b and c).

Scale and Stress Effects on Hydro-Mechanical Properties of Fractured Rock Mass
37
DFN Side Length (m)
Per
mea
bilit
yK
xx(m
2)
Coe
ffici
ento
fVar
ianc
e(%
)
0 2 4 6 8 10 12 14 16 18 2010-16
10-15
10-14
10-13
10-12
10-11
10-10
0
50
100
150
200
250
300MinimumMaximumMeanCoefficient of Variance
Simulation Results
(d)
(e) DFN Side Length (m)
Per
mea
bilit
yK
yy(m
2)
Coe
ffici
ento
fVar
ianc
e(%
)0 2 4 6 8 10 12 14 16 18 20
10-16
10-15
10-14
10-13
10-12
10-11
10-10
0
50
100
150
200
250
300
(f) DFN Side Length (m)
Per
mea
bilit
yK
xy/K
yx(m
2)
0 2 4 6 8 10 12 14 16 18 20-1.0x10⁻¹¹
-5.0x10⁻¹²
0.0x10+00
5.0x10⁻¹²
1.0x10⁻¹¹
Fig. 5.2(continued)The results of the Min., Max., mean and coefficient of variance of calculated permeability components from DFN models of different sizes with correlated aperture and trace length with b=3 (d, e and f).

Alireza Baghbanan TRITA LWR PHD 1040
38
Aperture Constant
0
30
60
90
120
150
180
210
240
270
300
00
1E+06
1E+06
2E+06
2E+06
3E+06
3E+06
4E+06
4E+06
5E+06
5E+06
(a) S=8m, RMSNorm =0.085
Aperture-Length Correlated b=1.0
0
30
60
90
120
150
180
210
240
270
300
00
2E+06
2E+06
4E+06
4E+06
6E+06
6E+06
8E+06
8E+06
1E+07
1E+07
(b) S=20 m, RMSNorm =0.15
Aperture-Length Correlated b=3.0
0
30
60
90
120
150
180
210
240
270
300
00
5E+06
5E+06
1E+07
1E+07
1.5E+07
1.5E+07
2E+07
2E+07
(c) S=20m, RMSNorm =1.08
Fig. 5.3. Directional permeability contours and mean square error for the models with constant aperture of 65 μm (b = 0) (a); correlated aperture-trace length with b=1 (b) and correlated aperture-length with b = 3 (c), respectively.

Scale and Stress Effects on Hydro-Mechanical Properties of Fractured Rock Mass
39
The magnitude of principal permeability components is less than that when constant aperture is adopted and the correlated case with b = 1. As a result of stochastically assigned fracture apertures following a lognormal distribution, only a very small number of fractures of large apertures are generated due to the distribution’s long tail, and majority of fracture population generated have small apertures (some of them smaller than the constant aperture of 65 μm). In addition, some large fractures may also be assigned smaller apertures (or vice versa since no aperture-length correlation is enhanced). Therefore some of the large fluid conducting features may not be as dominating as in the correlated case. This is the reason that the mean equivalent permeability (10-14 m2) in the case of lognormally distributed aperture with b = 1 and without correlation with trace length is one order of magnitude less than that of the cases of b = 0 and b = 1 with correlated aperture and trace length. Note that the fracture system connectivity and density are identical for all DFN models. When the fracture aperture pattern is more scattered, b = 3 (Fig. 5.5d,e and f) the diagonal permeability values kxx and kyy also become more scattered with the DFN model sizes, without a clear tendency of reaching a REV even at a model size of 20 m. However, from Fig. 5.5d and Fig. 5.5e, a tendency to reach a converged mean magnitude of permeability of 10-15 m2 for the two diagonal permeability components kxx and kyy components can still be observed, which is one order of magnitude less than the case of b=1 and two orders of magnitude less than the case of correlated aperture and trace length respectively.
0
0,2
0,4
0,6
0,8
1
1,2
1,4
1,6
1,8
2
2,2
2,4
0 1 2 3 4 5 6 7 8 9 10 11 12 13 14 15 16 17 18 19 20
DFN side length (m)
RM
S
Constant Aperture
Correlation b=1.0
Correlation b=3.0
Fig. 5.4. Variation of RMSNorm versus DFN model size for three different cases of correlated aperture distributions, b = 0, 1 and 3, respectively.

Alireza Baghbanan TRITA LWR PHD 1040
40
The reason for this reduction of mean permeability is the same as given above, with the additional effects of increased scattering of aperture values when b = 3. Although the mean values of the diagonal permeability components do not show significant variations after the model size of 10 m, however, the value of ‘CV’ even at the model size of 20 m is far too large than the suggested limit value of 20% to be approximated as a REV model size (Fig. 5.7). The off-diagonal permeability components kxy and kyx become very small for almost every model size (Fig. 5.5f), for the same reason as stated before. b) Evaluation of permeability tensor with uncorrelated fracture aperture and length In this section, the results of the effect of the second moment of the lognormal aperture distribution on the existence of permeability tensor with uncorrelated aperture and length are presented (Fig. 5.6). With increasing size of the DFN models, a good approximation of a permeability ellipse can be reached at the model size of 10 m for the case of b=1 (Fig. 5.6 a). For the case of b =3, an ellipse cannot be approximated at all for all model sizes up to 20 m (Fig. 5.6 b). Figure 5.7 illustrates the variation of mean square error with increasing DFN model side length, when the fracture aperture and length are uncorrelated. The variation trend for the case with b =1 is similar to that of constant aperture case, in both shape and magnitude. A good approximation to a permeability ellipse can be reached at a model size of 10 m. However, large variation exists (CV> 0.6) when b =3 at all DFN model sizes up to 20 m, without indicating any acceptable approximation for an equivalent continuum behavior.
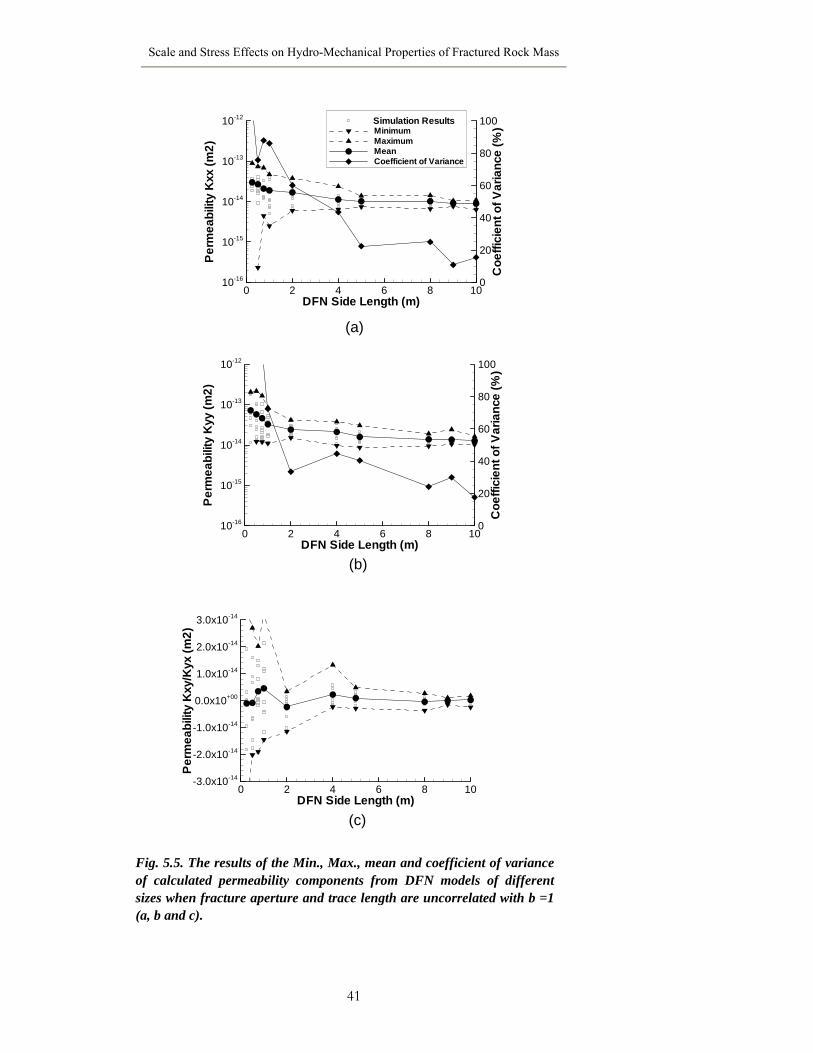
Scale and Stress Effects on Hydro-Mechanical Properties of Fractured Rock Mass
41
(a)
DFN Side Length (m)
Per
mea
bilit
yK
xx(m
2)
Coe
ffici
ento
fVar
ianc
e(%
)
0 2 4 6 8 1010-16
10-15
10-14
10-13
10-12
0
20
40
60
80
100MinimumMaximumMeanCoefficient of Variance
Simulation Results
(b) DFN Side Length (m)
Per
mea
bilit
yK
yy(m
2)
Coe
ffici
ento
fVar
ianc
e(%
)
0 2 4 6 8 1010-16
10-15
10-14
10-13
10-12
0
20
40
60
80
100
(c) DFN Side Length (m)
Per
mea
bilit
yK
xy/K
yx(m
2)
0 2 4 6 8 10-3.0x10⁻¹⁴
-2.0x10⁻¹⁴
-1.0x10⁻¹⁴
0.0x10+00
1.0x10⁻¹⁴
2.0x10⁻¹⁴
3.0x10⁻¹⁴
Fig. 5.5. The results of the Min., Max., mean and coefficient of variance of calculated permeability components from DFN models of different sizes when fracture aperture and trace length are uncorrelated with b =1 (a, b and c).

Alireza Baghbanan TRITA LWR PHD 1040
42
(d) DFN Side Length (m)
Per
mea
bilit
yK
xx(m
2)
Coe
ffici
ento
fVar
ianc
e(%
)
0 2 4 6 8 10 12 14 16 18 2010-18
10-17
10-16
10-15
10-14
10-13
10-12
0
50
100
150
200
250
300MinimumMaximumMeanCoefficient of Variance
Simulation Results
(e) DFN Side Length (m)
Per
mea
bilit
yK
yy(m
2)
Coe
ffici
ento
fVar
ianc
e(%
)
0 2 4 6 8 10 12 14 16 18 2010-18
10-17
10-16
10-15
10-14
10-13
10-12
0
50
100
150
200
250
300
(f) DFN Side Length (m)
Per
mea
bilit
yK
xy/K
yx(m
2)
0 2 4 6 8 10 12 14 16 18 20-1.0x10⁻¹¹
-5.0x10⁻¹²
0.0x10+00
5.0x10⁻¹²
1.0x10⁻¹¹
Fig. 5.5 (Continued). The results of the, Min., Max., mean and coefficient of variance of calculated permeability components from DFN models of different sizes when fracture aperture and trace length are uncorrelated with b=3 (d, e and f).

Scale and Stress Effects on Hydro-Mechanical Properties of Fractured Rock Mass
43
Aperture-Length Uncorrelated b=1.0
(a) S=10 m, RMSNorm =0.163
0
30
60
90
120
150
180
210
240
270
300
00
4E+06
4E+06
8E+06
8E+06
1.2E+07
1.2E+07
1.6E+07
1.6E+07
Aperture-Length Uncorrelated b=3.0
(b) S=20m, RMSNorm =0.58
0
30
60
90
120
150
180
210
240
270
300
00
2E+07
2E+07
4E+07
4E+07
6E+07
6E+07
8E+07
8E+07
1E+08
1E+08
Fig. 5.6. Directional permeability contours and mean square errors with uncorrelated aperture-length with b=1 (a) and uncorrelated aperture-length with b=3 (b).
Fig. 5.7. Variation of RMSNorm with increasing DFN model size for un-correlated aperture-trace length and different values of second moment of aperture distributions with b = 0, 1 and 3, respectively.
0
0,2
0,4
0,6
0,8
1
1,2
1,4
1,6
1,8
2
2,2
2,4
2,6
0 1 2 3 4 5 6 7 8 9 10 11 12 13 14 15 16 17 18 19 20
DFN side length (m)
RM
S
Constant Aperture
Uncorrelated b=1.0
Uncorrelated b=3.0

Alireza Baghbanan TRITA LWR PHD 1040
44
5.2 Investigation on REV size of mechanical properties (paper V)
The numerical results about the effects of model size and confining stresses on the mechanical properties of DEM models of the concerned fractured rock mass with different initial fracture aperture patterns are presented in this section. First the numerical results, when the fracture aperture is constant and equal to 65 μm, are presented. The results from the models with correlated fracture aperture and trace length distributions are then followed, with different values of the second moment of the lognormal distribution of aperture (b = 1 and 3). The calculated Young’s modulus, Poisson’s ratio and strength of DEM models are plotted as functions of the DEM model size in a 2D plane strain condition, with results from 10 realizations as scattered data points and curves showing their mean and coefficient of variance (‘CV’) values. The points for the maximum and minimum values of the scattered data points are connected to show the bounding curves for maximum and minimum values, respectively, in each plot.
5.2.1 Results with constant fracture aperture Figure 5.8 shows the results of Young’s modulus (Fig. 5.8a), Poisson’s ratio (Fig. 5.8b) and normalized elastic strength (Fig. 5.8c) of ten DEM models of different sizes with a constant aperture of 65 μm. With increasing the model size, the calculated mechanical properties decrease in general. The calculated ‘CV’ of Young’s modulus for model size of 10 m is 5% that is much smaller than the acceptable value of 20% for approximating the REV size. Therefore this model size could be approximated as a REV considering only the Young’s modulus with a mean value of 50 GPa. Variation of calculated equivalent Poisson’s ratio with model size is large, and generally the Poisson’s ratio of the DEM models are smaller than that of the rock matrix, due to the fact that the relative dominating fracture orientations and friction angles favor larger vertical strains than the horizontal ones, leading to smaller equivalent Poisson’s ratio as the ratio between the horizontal/vertical strains in the elastic range. The Poisson’s ratio in the plastic range of the models was not calculated. The value of ‘CV’ for model size of 10 m is 9% with mean value of equivalent Poisson’s ration as 0.12. This shows that this size could be approximated as REV considering only the Poisson’s ratio. After a model side length of 5 m is exceeded, the calculated equivalent normalized elastic strengths with a mean value of 85 MPa do not change significantly. At this model size the ‘CV’ value is smaller than 20% and this trend continues afterwards. Therefore the model size of 5 m can be approximated as REV if only the elastic strength is considered. In summary, a 10 m ×10 m model size can be established as the mechanical REV considering the size effects on Young’s modulus, Poisson’s ratio and elastic strength of the DEM models.

Scale and Stress Effects on Hydro-Mechanical Properties of Fractured Rock Mass
45
5.2.2 Results with correlated fracture aperture and trace length The numerical results about the effect of model size on normalized Young’s modulus, Poisson’s ratio and normalized elastic strength are shown in Fig. 5.9a-c, respectively, for the models with correlated aperture and trace length of fractures with second moment b = 1 in a no-confining stress condition (uniaxial compression tests). Although a REV size of 10 m can be detected with variation of ‘CV’ considering Young’s modulus and Poisson’s ratio, (Fig. 5.9a,b), however the value of ‘CV’ for the calculated elastic strength is smaller than 20% only when the model size reached 20 m. Therefore, for all of the calculated mechanical properties the model side length of 20 m is adopted as the REV size. At the REV size of 20 m, the calculated mean, ‘CV’ values of normalized Young’s modulus and normalized elastic strength are 0.5 and 0.44, respectively, which is smaller than the case with constant fracture aperture The main reason for this behavior is the existence of large fractures with large initial apertures that make the fractured rock more deformable. Fig. 5.9d, e and f shows the results of calculated equivalent mechanical properties of DEM models for the concerned fractured rock mass when fracture apertures are correlated with fracture length with second moment b = 3. The results show that with increasing the second moment of lognormal distribution of aperture, the mean, maximum and minimum values of the normalized Young’s modulus, Poisson’s ratio and the normalized elastic strength have much larger range of variations, and the ‘CV’ is increased significantly (Fig. 5.9d-f). The calculated ‘CV’ values for all of the mechanical properties are beyond the acceptable value of 20% for approximation of a REV size even at the model side length of 20 m. The reason for such significant change is that when the second moment of aperture distribution is increased (from 1 to 3), less large fractures with large aperture values were generated to decrease the overall deformability of DEM models. On the other hand, smaller fractures with smaller aperture values were generated that can reach their maximum closures relatively more quickly (cf., Chapter 3 of this thesis), therefore the rock mass becomes stiffer compared with the case of second moment b = 1.

Alireza Baghbanan TRITA LWR PHD 1040
46
(a) Side length of DEM model (m)
Nor
mal
ized
Ela
stic
Mod
olus
,Er/Ε
i
Coe
ffici
ento
fvar
ianc
e(%
)
1 2 3 4 5 6 7 8 9 100.0
0.2
0.4
0.6
0.8
1.0
0
5
10
15
20
25
30MinimumMaximumMeanCoefficient of Variance
Simulation Results
Side length of DEM model (m)
Poi
sson
'sra
tio,ν
r
Coe
ffici
ento
fvar
ianc
e(%
)
1 2 3 4 5 6 7 8 9 100.05
0.10
0.15
0.20
0
5
10
15
20
25
30
(b)
Side length of DEM model (m)
Nor
mal
ized
Pea
kS
treng
th,σ
cr/σ
ci
Coe
ffici
ento
fvar
ianc
e(%
)
1 2 3 4 5 6 7 8 9 100.0
0.2
0.4
0.6
0.8
1.0
0
5
10
15
20
25
30
(c)
Fig. 5.8. The results of the Min., Max., mean and coefficient of variance of calculated equivalent normalized Young’s modulus in y-direction (a), Poisson’s ratio (b) and normalized elastic strength (c), with different DEM model sizes when initial aperture is constant in non-confinement stress condition.

Scale and Stress Effects on Hydro-Mechanical Properties of Fractured Rock Mass
47
Side length of DEM model (m)
Nor
mal
ized
Ela
stic
Mod
olus
,Er/Ε
i
Coe
ffici
ento
fvar
ianc
e(%
)
2 4 6 8 10 12 14 16 18 200.0
0.2
0.4
0.6
0.8
1.0
0
10
20
30
40
50
MinimumMaximumMeanCoefficient of Variance
Simulation Results
(a)
Side length of DEM model (m)
Nor
mal
ized
Pea
kS
treng
th,σ
cr/σ
ci
Coe
ffici
ento
fvar
ianc
e(%
)
2 4 6 8 10 12 14 16 18 200.0
0.2
0.4
0.6
0.8
1.0
0
10
20
30
40
50
(c)
Side length of DEM model (m)
Poi
sson
'sra
tio,ν
r
Coe
ffici
ento
fvar
ianc
e(%
)
2 4 6 8 10 12 14 16 18 200.05
0.10
0.15
0.20
0.25
0
10
20
30
40
50
(b)
Fig. 5.9. The results of the Min., Max., mean and coefficient of variance of calculated equivalent normalized Young’s modulus in y-direction, Poisson’s ratio and normalized elastic strength with different DEM model sizes when aperture and length are correlated with b=1 (a, b and c in non-confinement stress condition).

Alireza Baghbanan TRITA LWR PHD 1040
48
(d) Side length of DEM model (m)
Nor
mal
ized
Ela
stic
Mod
olus
,Er/Ε
i
Coe
ffici
ento
fvar
ianc
e(%
)
2 4 6 8 10 12 14 16 18 200.0
0.2
0.4
0.6
0.8
1.0
0
10
20
30
40
50MinimumMaximumMeanCoefficient of Variance
Simulation Results
(e) Side length of DEM model (m)
Poi
sson
'sra
tio
Coe
ffici
ento
fvar
ianc
e(%
)
2 4 6 8 10 12 14 16 18 200.00
0.05
0.10
0.15
0.20
0.25
0
10
20
30
40
50
(f) Side length of DEM model (m)
Nor
mal
ized
Pea
kS
treng
th,σ
cr/σ
ci
Coe
ffici
ento
fvar
ianc
e(%
)
2 4 6 8 10 12 14 16 18 200.0
0.2
0.4
0.6
0.8
1.0
0
10
20
30
40
50
Fig. 5.9(continued). The results of the Min., Max., mean and coefficient of variance of calculated equivalent normalized Young’s modulus in y-direction, Poisson’s ratio and normalized elastic strength with different DEM model sizes when aperture and length are correlated with b = 3 (d, e and f) in non-confinement stress condition.

Scale and Stress Effects on Hydro-Mechanical Properties of Fractured Rock Mass
49
6 STRESS DEPENDENT PERMEABILITY AND STRENGTH OF FRACTURED ROCKS In this chapter the results of stress dependent permeability and also strength of fractured rocks are described when fracture aperture is correlated with fracture trace length. The results of applying different ratios of horizontal/vertical stresses on the DEM models for their effects on permeability and fluid flow patterns are examined, with the DEM models of the hydraulic REV size of 20 m. The effect of applied confining pressures, σh, from no confining stress state to σh = 1, 3 and 5 MPa, respectively, on strength envelopes are followed in another Chapter. The results are also presented in papers II, III, IV and V.
6.1 DEM study on stress effect on permeability (papers II, III, IV)
6.1.1 Effect of stress ratio on permeability Figure 6.1 shows the variation of the diagonal permeability components kxx and kyy of different rotated DFN models of 20 m × 20 m in size from a no-stress condition to stressed conditions of different stress ratios (K=1, 3, 4, 5) when aperture is lognormally distributed with second moment of 1 and correlated with fracture trace length, indicated by legend Ap.Correlated_Rot. For comparison, the results of the models with uniform aperture distribution with DFN size of 5 m × 5 m (directly taken from Min et al. (2004a,b)) are also shown, as indicated by legend Ap.Constant_Rot. With increasing stress ratio from no-stress condition (K = 0) to K=1, the permeability components for all the rotated models decrease by one order of magnitude, mainly due to the pure normal closures of fractures under normal stresses without shear. The calculated off-diagonal permeability components show differences of some order of magnitudes compared with the diagonal terms. Therefore the main flow pass is in the direction parallel with hydraulic gradient as can be seen in Figs. 6.5 and 6.6. However, at the same applied stress level, when fracture aperture is assumed to be constant in the DEM model (Min et al., 2004b), the overall permeability decreases by two orders of magnitude. The reason for such significant difference between the constant and correlated aperture distributions is that, when the fracture aperture is lognormally distributed and correlated with fracture trace length, the large number of small fractures with small aperture values may reach their residual aperture values but some large fractures with much higher initial aperture values remain far from being at residual state and are still highly conductive, so that the overall reduction of permeability of fracture system becomes less compared with the uniform aperture case. When normal stiffness of fracture is scale and stress dependent (equation (3.13)), with increasing of initial aperture (hi), larger fracture deform less at lower applied stresses. Therefore under the same stress condition, larger fractures keep larger remaining apertures or transmissivity to conduct fluid flow, even when the smaller fractures may be virtually closed. When stress ratio is increased up to K=3 or higher, most of the fractures will experience

Alireza Baghbanan TRITA LWR PHD 1040
50
shear dilation, which cause continued increase of overall flow rates of the DEM models, and formation of channeled flow paths and changes in the overall permeability. The key factor for channeling and shear failure is the relative orientation of fractures with respect to the stress directions, besides the adopted shear strength criterion and associated properties such as stiffness, friction angle and cohesion. In the DEM models with zero rotation angle (at reference axis), due to the dominant sub-vertical and sub-horizontal orientations of fractures (Table 2.1), which are parallel with boundary stress directions, most of the fractures are in compression without shear failure, and therefore the overall permeability continue to decrease, until K value is higher than 3 (Fig. 6.1). For rotated DEM models, shear-induced increase of permeability by dilation can start at rather low K values (about K = 1) (Fig. 6.1) due to the development of shear dilation in the fractures due to the rotation-induced change of fracture orientation. With stress ratio up to K = 5, most of the fractures, including the large fractures of initial higher aperture values, experience shear dilation in all rotated models, therefore the overall permeability of the rotated DFN models increase rapidly, by a factor of three compare with the no stress condition case. To support the above interpretation, Fig. 6a shows a DFN model with 20 m × 20 m size at a rotation angle of 120o, from which we extracted a model with 2 m × 2 m in size (Fig. 6.2b) for showing detailed results of aperture changes (thickness of the lines) and principal stress vectors (Figs. 6.2c-f), fractures undergoing slipping (Figs. 6.2g-i), fluid flow rates in the x-direction (Figs. 6.2j-m) and in y-direction (Figs. 6.2n-q) with no stress condition (K = 0) and stress conditions of stress ratios K = 1, 3 and 5, respectively. When a hydrostatic stress (K = 1) is applied, most fractures experience closure without shear except at a few isolated fracture intersections (Fig. 6.2g) and principal stress pattern is roughly uniformly distributed (Fig. 6.2d), with fluid flow conducted by some large scale fractures or fracture clusters (Figs. 6.2k and o). When stress ratio is increased to K = 3 and 5, fracture apertures are more increased by shear induced slipping and dilation (Figs. 6.2h and i) caused by rotated and concentrated stresses at fracture intersections (Figs. 6.2e-f). Fluid flow rate distributions at different applied stress ratios in the DEM models (Figs. 6.2j-q) show that beside the connectivity of fracture network, a small number of long fractures with large initial aperture values always remain conductive in all stress conditions and has a significant influence on the overall permeability and flow patterns, particularly when fluid flows in the y-direction (Figs. 6.2o-q). These large conducive features are dominant major flow pathways and influence the overall permeability of DEM models significantly (Figs. 6.2, m, p and q).

Scale and Stress Effects on Hydro-Mechanical Properties of Fractured Rock Mass
51
Ratio of horizontal to vertical stress, K
Per
mea
bilit
ykx
x(m
2)
0 1 2 3 4 5
10-16
10-15
10-14
10-13
Ap. Correlated_Rot. 0Ap. Correlated_Rot. 30Ap. Correlated_Rot. 60Ap. Correlated_Rot. 90Ap. Correlated_Rot. 120Ap. Correlated_Rot. 150Ap. Constant_Rot. 0
(a)
Ratio of horizontal to vertical stress, K
Per
mea
bilit
yky
y(m
2)
0 1 2 3 4 5
10-16
10-15
10-14
10-13
(b)
Fig. 6.1. Permeability components kxx (a) and kyy (b) changes with increasing stress ratios for different rotated DFN models with 20m × 20m size when aperture is lognormally distributed and correlated with fracture trace length (Ap.Correlated_Rot.) and also the results of the models with uniform aperture distribution with DFN size of 5m × 5m (Ap.Constant_Rot.) taken from Min et al. (2004a,b).

Alireza Baghbanan TRITA LWR PHD 1040
52
Fig. 6.2. The DFN model with 20 m × 20 m size at 120o rotation angle (a), extracted a model with 2 m × 2 m in size (b), aperture changes (thickness of the lines) and principal stress vectors (c-f), region of fractures undergoing slipping (g-i), fluid flow rates in the x-direction (j-m) and y-direction (n-q) when no stress applied or stress ratios are K=1, 3 and 5 for the extracted DEM model with 2 m × 2 m in size. Each line indicates the aperture of 40 μm and the maximum aperture presented is 200 μm in (c-f). Also each line represents flow rate of 2×10⁻⁸ m3/s in (j-q).
K=0
(c)
(j) (n)
(g)
K=1
(d) (o) (k)
K=3
(e) (h) (l) (p)
K=5
(f) (i) (q) (m)
(b)
(a)

Scale and Stress Effects on Hydro-Mechanical Properties of Fractured Rock Mass
53
6.1.2 Evaluation of permeability tensor and flow pattern changes with different stress ratios
Figure 6.3 shows the calculated reciprocal values of the directional permeabilities for no stress condition and K = 1, 3, 4 and 5 of the DEM models. Dashed lines represent the mean values of )(/1 αijk and solid lines represent the calculated directional permeability values, )(/1 αgk as described in Chapter 4. Both are plotted in a polar coordinate system. The contours of the directional permeabilities are plotted in the same scale and larger contour sizes represent smaller permeability values. Below each figure the applied stress ratio (K) on the DEM models and the calculated normalized mean square error, using the equation (4.2) are presented. At the initial no stress condition K=0, a permeability ellipse can be approximated with an accepted value of RMSNorm=15% for a tensor representation, with a REV size of 20 m × 20 m (Fig. 6.3a). Fig. 6.4 shows the fluid flow patterns with flow in the local x-directions under no stress condition for rotated DFN models. It can be seen that the major flow pathways are more oriented in the direction parallel with hydraulic gradient. The large conductive features mainly oriented in the sub-vertical direction still have certain influence on overall flow pattern for the rotated models, as demonstrated by the slightly larger permeability in the vertical directions (shown as slight shrinkage of the ellipse in 90o and 270o directions in Fig. 6.3a). However, the overall permeability is quite homogeneous with a good fitting to a permeability ellipse for the no stress condition case. When a hydrostatic stress field is applied (K=1), the values of the permeability components decrease, as indicated by the enlarged directional permeability contour in Fig. 6.3b, especially in the 30o rotation direction. A mean square error of RMSNorm = 0.31 still cannot justify the existence of a permeability tensor. Flow is channeled mainly along the clustered fractures sub-oriented roughly in parallel or in small angles with the local direction of the hydraulic gradient (Figs. 6.5b-f and 6.6b-f). Since K = 1, no significant shear failure is induced in fractures and the flow paths are dominated by the localized clusters of fractures. The overall permeabilities of the DEM models are reduced because that compression is the dominating mode of loading (see Figs. 6.2d, g, k and o). The fluid flow in the rotated models was dominated in their respective local x and y-directions as shown in Figs. 6.5h-l and 6.6h-l, with significant flow rate increase in their local x- and y-directions. In these DEM models, a combination of shear dilation of fractures (even of small sizes) and larger fractures of higher initial aperture values that remain open, increase the overall fracture network permeability in the particular direction defined by the shear stress component. The dominance of the larger fractures or main clusters of smaller fractures is not as strong as in the hydrostatic stress state case. At these stress states, K = 3 and K = 4, calculated mean square errors are 0.52 and

Alireza Baghbanan TRITA LWR PHD 1040
54
0.43 respectively and acceptable permeability ellipses cannot be approximated. When K = 5, most of fractures in DFN models experience shear dilation with much increased overall permeability and the overall flow behavior of the DEM models becomes more homogeneous, as indicated by the general reduction of the reciprocal values of directional permeabilities in Fig. 6.3e. Although a perfect ellipse is still not possible, the calculated mean square error is RMSNorm = 0.22, the contour is very close to be a permeability tensor for practical applications. At this stress state condition (K = 5), patterns of the dominating flow pathways are similar to that with K = 3, but extent of channeling become more significant due to the continued increase of the shear dilation of fractures (although with smaller gradient). The overall permeability increases accordingly (Figs. 6.5m-r and 6.6m-r). The contribution of smaller fractures becomes more significant due to the continued development of shear dilation as induced by the stress ratios. Therefore the main directions of fluid flow pathways correspond to the overall shear stress directions.
0
30
60
90
120
150
180
210
240
270
300
00
5E+06
5E+06
1E+07
1E+07
1.5E+07
1.5E+07
2E+07
2E+07
(a) No stress, RMSNorm=0.15 (b) K=1, RMSNorm=0.31
0
30
60
90
120
150
180
210
240
270
300
00
5E+06
5E+06
1E+07
1E+07
1.5E+07
1.5E+07
2E+07
2E+07
(c) K=3, RMSNorm=0.52
0
30
60
90
120
150
180
210
240
270
300
00
5E+06
5E+06
1E+07
1E+07
1.5E+07
1.5E+07
2E+07
2E+07
(d) K=4, RMSNorm=0.43
0
30
60
90
120
150
180
210
240
270
300
00
5E+06
5E+06
1E+07
1E+07
1.5E+07
1.5E+07
2E+07
2E+07
(e) K=5, RMSNorm=0.22
0
30
60
90
120
150
180
210
240
270
300
00
5E+06
5E+06
1E+07
1E+07
1.5E+07
1.5E+07
2E+07
2E+07
Fig. 6.3. Directional permeability contours and mean square errors for DFN models at stress ratio: (a) initial no stress condition, (b) K=1, (c) K=3, (d) K=4 and (e) K=5 (expressed in 1/k1/2(1/m)).

Scale and Stress Effects on Hydro-Mechanical Properties of Fractured Rock Mass
55
Fig. 6.4. Fluid flow patterns in the rotated x-direction for rotated DFN models at the initial condition (without stress). Each line indicates the flow rate of 2×10⁻⁸ m3/s and an example of extracted rotated DFN models through the large scale parent model (in center part of the figure).

Alireza Baghbanan TRITA LWR PHD 1040
56
K=1
Rot
atio
n A
ngle
= 0
˚ K=3 K=5
(a) (g) (m)
(b)
Rot
atio
n A
ngle
= 3
0˚
(h) (n)
(c) R
otat
ion
Angl
e =
60˚
(i) (o)
(d) R
otat
ion
Angl
e =
90˚
(j) (p)
(e) R
otat
ion
Angl
e =
120˚
(k) (q)
(f) R
otat
ion
Angl
e =
150˚
(l) (r)
Fig. 6.5. Fluid flow patterns for rotated DFN models when fluid flows parallel to the horizontal stress with K=1 (a-f), K=3 (g-l) and K=5 (m-r). Each line indicates the flow rate of 2×10⁻⁸ m3/s.

Scale and Stress Effects on Hydro-Mechanical Properties of Fractured Rock Mass
57
K=3 K=5
(a) R
otat
ion
Ang
le =
0˚ K=1
(g) (m)
(b) R
otat
ion
Angl
e =
30˚
(h) (n)
(c) R
otat
ion
Angl
e =
60˚
(i) (o)
(d) R
otat
ion
Ang
le =
90˚
(j) (p)
(e) R
otat
ion
Ang
le =
120
˚
(k) (q)
(f) R
otat
ion
Ang
le =
150
˚
(l) (r)
Fig. 6.6. Fluid flow patterns for rotated DFN models when fluid flows perpendicular to the horizontal stress with K=1 (a-f), K=3 (g-l) and K=5 (m-r). Each line indicates the flow rate of 2×10⁻⁸ m3/s.

Alireza Baghbanan TRITA LWR PHD 1040
58
6.2 Investigation stress dependency on strength (paper V) The numerical uniaxial compressive test results about the effects of model size on the mechanical properties of DEM models of the concerned fractured rock mass with different initial fracture aperture patterns were presented in chapter 5.2 of the thesis. The REV size of 10 m and 20 m for the models with constant aperture and correlated aperture-trace length with second moment b = 1 were approximated. In this chapter the stress-strain curves for the DEM models undergoing compression tests with different confining stress conditions, fitted using M-C and H-B strength envelops, are plotted to show the stress dependency of strength in fractured rock masses when distributions of fracture apertures (openings) are constant (b=0) and correlated (b = 1 and 3) with fracture trace length.
6.2.1 Results with constant fracture aperture Figure 6.7 shows the results of effect of different confining pressures (the horizontal stress) of 0, 1, 3 and 5 MPa, on the elastic strength of fractured rock mass in the REV size of 10 m when initial aperture was
Fig. 6.7. Axial stress versus axial strain and lateral strain for DEM models under different confining pressure conditions (a) and also strength envelopes for DEM models (b) with side length of 10m when initial aperture is constant.
Normalized Confining Pressure, σ3/σci
Nor
mal
ized
Pea
kS
treng
th,σ
cr/σ
ci
0 0.005 0.01 0.015 0.02 0.025 0.03 0.0350.5
0.55
0.6
0.65
0.7
0.75
0.8
Numerical Results
Mohr-Coulomb: σcr/σci=4.96σ3/σci+0.54
Hoek & Brown: σcr/σci=σ3/σci+(4.78σ3/σci+0.29)0.5
(b)
Lateral Strain (%) Axial Strain (%)
Axi
alS
tress
(MP
a)
-0.4 -0.3 -0.2 -0.1 0 0.1 0.2 0.3 0.4 0.5 0.60
25
50
75
100
125
150
Non-Confinement1 MPa Confinement3 MPa Confinement5 MPa Confinement
(a)

Scale and Stress Effects on Hydro-Mechanical Properties of Fractured Rock Mass
59
assumed constant (b = 0). The axial stress-axial strain and the axial stress-lateral strain curves under different confining stress conditions are presented in Fig. 6.7a. The thicker lines correspond to the larger applied confining pressures. With increasing the confining pressure, the elastic strength is increased and the stress-strain curves follow an elasto-plastic model with strain hardening. The curve-fitting with Mohr-Coulomb and Hoek-Brown criteria is illustrated in Fig. 6.7b. Dots show simulation results while solid and dashed lines represent the fitted M-C and H-B strength envelopes, respectively. The M-C strength envelope fits well with the numerical results, with calculated cohesion, friction angle and uniaxial compressive strength as 10.7 MPa, 41.6˚ and 85.5 MPa, respectively. The H-B strength envelope fits less well with the numerical results, with calculated values of 2.54, 0.34 and 92.1 MPa for mr, sr and the uniaxial compressive strength, respectively.
6.2.2 Results with correlated fracture aperture and trace length Figure 6.8a shows the curves relating the axial stress, axial strain and lateral strain for DEM models under different confining pressure conditions at the model side length of 20 m (the REV size), when initial aperture is lognormally distributed with second moment b = 1 and correlated with fracture length. With increasing the confining pressure the elastic strength is increased. However, the fractured rock mass is weaker compared with the model with uniform fracture aperture, mainly due to the existence of some large fractures with large initial apertures. Large fractures with large initial apertures maintain larger deformability even under higher confining pressure. The calculated parameters of M-C and H-B strength envelopes show that friction angle, mr and sr parameters and the uniaxial compressive strength for both failure envelopes are smaller than that for the case with constant aperture (Table 6.1). Similar to the case of constant aperture, H-B strength envelope fits less well with the numerical results (Fig. 6.8b) than the M-C criterion. Here for demonstration and comparison purpose the approximated M-C and H-B strength envelopes parameters are presented in Table 6.1 for the case with second moment of b = 3, despite the fact that the model size of 20 m is not the REV size for determining the equivalent mechanical properties of fractured rock concerned. The results show much increased strength envelopes parameters of the DEM models when b value is increased from 1 to 3 (Table 6.1).

Alireza Baghbanan TRITA LWR PHD 1040
60
Table 6.1 Calculated parameters of Mohr-Coulomb and Hoek-Brown failure envelopes
Constant Aperture
Correlated Aperture,
b=1
Correlated Aperture,
b=3 Cohesion (MPa) 10.71 12.19 12.4
Friction Angle (º) 41.6 34.8 36
Parameters of Mohr-Coulomb
Failure Envelope Unconfined strength (MPa) 85.5 69.2 74.4
mr 2.54 2.55 2.96 sr 0.34 0.19 0.22
Parameters of Hoek-Brown
Failure Envelope Unconfined strength (MPa) 92.1 69.15 74.3
Lateral Strain (%) Axial Strain (%)
Axi
alS
tress
(MP
a)
-0.3 -0.2 -0.1 0 0.1 0.2 0.3 0.40
25
50
75
100
125
Non-Confinement1 MPa Confinement3 MPa Confinement5 MPa Confinement
(a)
Normalized Confining Pressure, σ3/σci
Nor
mal
ized
Pea
kS
treng
th,σ
cr/σ
ci
0 0.005 0.01 0.015 0.02 0.025 0.03 0.0350.4
0.45
0.5
0.55
0.6
0.65
0.7
Numerical Results
Mohr-Coulomb: σcr/σci=3.66σ3/σci+0.44
Hoek & Brown: σcr/σci=σ3/σci+(2.56σ3/σci+0.19)0.5
(b) Fig. 6.8. Axial stress versus axial strain and lateral strain for DEM models under different confining pressure conditions and also strength envelopes for the models with correlated fracture aperture and trace length with second moment b=1, (a) and (b) and with second moment b=3, (c) and (d) respectively.

Scale and Stress Effects on Hydro-Mechanical Properties of Fractured Rock Mass
61
7 DISCUSSION In the previous sections of this thesis, it has been shown that the dominant factors affecting the size and stress effects of the overall hydro-mechanical behaviors are the number of large fractures with higher or much higher values of initial apertures than the mean initial aperture (= 65μm in this study), and the number of smaller fractures with initial apertures less or much less than the mean fracture aperture, as a consequence of the aperture distribution and correlation with trace length. Figure 7.1 shows the initial fracture aperture (opening) distribution pattern of DEM models of 10 m in size with constant aperture of 65 μm (Fig. 7.1a), correlated fracture aperture-trace length with second moment b=1 (Fig. 7.1b) and b=3 (Fig. 7.1c) and also uncorrelated cases with second moment b=1 (Fig. 7.1d) and b=3 (Fig. 7.1e). The legend shows the fracture aperture ranged between 20 μm and 180 μm. Aperture values less than 20 μm and grater than 180 μm are shown in pink and dark blue colors respectively. When fracture aperture is constant the pattern of aperture distribution is uniform and the hydraulic and mechanical behavior of DEM model is more controlled by orientation of fractures, as shown in Fig. 7.1a. For the correlated case with b=1, some large fractures with aperture values much higher (as indicated by dark blue lines in Fig. 7.1b) than the mean fracture aperture were generated and the overall permeability and deformability of the whole DEM model become larger, leading to less strength. The stress-strain curve locates lower than the curve for the constant aperture case (Fig. 7.2), due to much higher deformability of the large fractures. When b=3 a few large conductive features have less significant influence on the overall aperture distribution pattern of the fracture network and permeability of the fracture network is increased (Fig. 7.1c) as also found by de Dreuzy et al. (2001b). However, due to the larger portion of small fractures with small initial apertures fractured rock becomes stiffer. The larger number of small fractures reach their residual closure value quickly and the stiffness of the smaller fracture become higher, leading to higher strength and making the stress-strain curve above the curve representing the constant aperture case (Fig. 7.2). In contrast, with uncorrelated aperture and trace length, we have a more random aperture distribution pattern, particularly when b = 3, with a much smaller number of large fractures of dominating aperture values (Fig. 7.1e) leading to a smaller overall permeability of fracture network.

Alireza Baghbanan TRITA LWR PHD 1040
62
Fig. 7.1. Initial fracture aperture (opening) distribution pattern of DEM models of 10 m in size. (a) Constant aperture of 65 μm, (b) correlated fracture aperture-trace length with second moment b = 1, (c) correlated fracture aperture-trace length with second moment b = 3, (d) un-correlated fracture aperture-trace length with second moment b = 1, and (e) un-correlated fracture aperture-trace length with second moment b = 3. The legend shows the fracture aperture ranged between 20 μm to 180 μm. Aperture values less than 20 μm and grater than 180 μm are shown in pink and dark blue colors respectively.
(d) (e)
(b) (c)
(a)
Legend

Scale and Stress Effects on Hydro-Mechanical Properties of Fractured Rock Mass
63
The scale effect study on permeability and mechanical properties of fractured rocks highlights the potential difficulties and limitations when the concept of REV are adopted for both hydrailic and mechanical properties of fractured rock masses when correlated fracture aperture and trace length is considered. The results demonstrate that the assumption of constant aperture could lead to significant uncertainties in the estimations of REV of hydraulic and mechanical properties for fractured crystaline rocks. The realistic REV size may be much larger than the numerically determined values, and the magnitude REV size could be either higher (if aperture and length are correlated) or lower (if they are uncorrelated), depending on site-specific stress conditions and fracture system geometry. The results show that this correlation has significant impact on the stress-induced flow pattern and permeability changes of fractured rocks. With increasing the ratio of applied horizontal to vertical stresses (K) on the DEM models, from initial no stress condition to a hydrostatic stress state K = 1, permeability components for all the rotated DEM models decrease, mainly due to the hyperbolic behavior of fracture deformability in the normal direction without shear failure. The large fractures of higher permeability values in the model play a major role for localized flow patterns and higher permeability values compared with the constant aperture cases as studied in Min et al. (2004b), showing differences of two orders of magnitude in equivalent permeabilities. When the stress ratio increases to K = 3 or higher, the contribution of shear dilation of the smaller fractures becomes the main reason for continued flow channeling and an increase of overall DEM model permeability. In addition, the relative orientation of fractures with respect to the shear stress direction, initial aperture, friction angle and dilation angle of the fractures are important factors
Axial Strain (%)
Axi
alS
tress
(MP
a)
0 0.1 0.2 0.3 0.4 0.5 0.6 0.70
25
50
75
100
125
150
175
200
Aperture Constant
Aperture Correlated, b=1
Aperture Correlated, b=3
Fig. 7.2. Schematic variation of axial stress-axial strain for the case with constant fracture aperture and correlated fracture aperture and length with different second moment of aperture distribution.

Alireza Baghbanan TRITA LWR PHD 1040
64
for the occurrence of shear failure of fractures and, therefore, the existence of an equivalent permeability tensor. The results of fitting between the numerical confining pressure test results and M-C or H-B criteria show that the M-C criterion fits better with the numerical testing results. Similar findings were also reported in (Ramamurthy and Arora, 1994) and (Madhavi Latha and Sitharam, 2004) about the effect of fitting different failure criteria with experimental and numerical results of confinement compressive tests. They showed that the behavior of a rock mass could be well estimated using a simple failure criterion compared with H-B strength envelope, which requires values of some empirical constants. They concluded that the H-B strength envelope always shows lower strengths and higher displacements compared with experimental and numerical results (Ramamurthy and Arora, 1994; Madhavi Latha and Sitharam, 2004). However, our findings in this thesis are specific to the fracture system and mechanical properties of the fractures and rock matrix as adopted for this study, and should not be generalized. The numerical results in this study demonstrate that the correlations between geometric paramaters of fractures is an important issue in not only the numerical models but also practical rock engineering. Ignorance of such correlations, especially impact of fracture size, may cause significant uncertainties in the estimations of scale and stress effects of equivalent hydro-mechanical properties and interpretation of the results in modeling fractured rocks. The results demonstrate that when fracture aperture is correlated with fracture trace length, the overall behavior of the model can be controlled by a fewer numbers of large fractures.

Scale and Stress Effects on Hydro-Mechanical Properties of Fractured Rock Mass
65
8 CONCLUSIONS
8.1 General conclusions on approach In this thesis, four numerical studies were performed, in order to evaluate the effects of size and stress on hydraulic and mechanical properties of fractured rock masses with and without correlation between fracture apertures and trace lengths when the fracture aperture is assumed to be lognormally distributed, with different values of the second moments (standard deviation). A closed-form relation was established for correlation between aperture and trace length of fractures, based on a power law distribution of trace length as established from a field mapping. However, the probabilistic approach is also applicable to other types of distributions. This finding established a sound mathematical basis that makes it possible for DFN modeling of fluid flow in fractured rocks with distributed properties of fracture system geometry and fracture transmissivity, which are the major sources of uncertainty in both conceptualization and parameterization of the DFN models. A model for predicting normal deformability behavior of fractures with effect of fracture trace length is developed when correlation between aperture and trace length is considered. This correlation enables us to study both the size and the stress effects of fractures on the overall hydro-mechanical behaviors of fractured rocks, considering the coupling between spatial variation of geometric characteristics and mechanical behaviors of rock fractures.
8.2 Specific conclusions from numerical results 1) Size effects of hydraulic and mechanical properties of fractured rocks: The results show significant scale-dependency of the permeability of fractured rocks. With increasing values of the second moment of lognormal distribution of aperture, the DFN models show more discrete behavior. Equivalent permeability tensors can be approximated only with smaller values of the second moment and with much larger REV size, compared with the case of constant aperture. For the fracture network models with correlated fracture aperture and trace length, the overall permeability of the model is more controlled by large fractures of higher aperture values. The mean magnitude of the network models’ permeability becomes higher than that of the uncorrelated case, by one or two orders of magnitude. This trend becomes more significant when the hydraulic aperture of the fracture is lognormally distributed with higher value of the standard deviation. • Clear trend of convergence of permeability values with
sufficiently small range of variation and acceptable approximation of permeability ellipse cannot be reached for the case of b=3 for the lognormal distribution of aperture, either correlated or uncorrelated with the trace length distribution. This finding,

Alireza Baghbanan TRITA LWR PHD 1040
66
however, does not mean that an equivalent tensor of permeability do not exist at a larger REV size. An REV with acceptable coefficient of variation and an equivalent tensor of permeability for the case b = 3 will be established if continuously enlarged DFN model sizes with much more number of fractures be simulated, if adequate computing resources are available.
• The results show also a significant scale-dependency of the Young’s modulus, Poisson’s ratio and elastic strength of the concerned fractured rock. With increasing values of the second moment of lognormal distribution of aperture, the DEM models show more discrete mechanical behavior. The REV of mechanical properties can only be approximated with smaller values of the second moment or with much larger REV size. The results show again that the smaller number of large fractures of higher initial aperture values dominates the mechanical behavior and REV size in fractured rocks, in a similar way as they dominate the permeability and fluid flow patterns.
2) Stress effect on hydraulic and mechanical properties of fractured rocks: • The correlation between fracture aperture and trace length has
significant impact on the stress-induced flow pattern and permeability changes of fractured rocks. With an increasing ratio of applied horizontal to vertical stresses (K) on the DEM models, from initial no stress condition to a hydrostatic stress state K = 1, permeability decreases, mainly due to the hyperbolic behavior of fracture deformability in the normal direction without shear failure. The large fractures of higher permeability values in the model play a major role for localized flow patterns and higher permeability values compared with the constant aperture cases, showing differences of two orders of magnitude in equivalent permeabilities. When stress ratio increases to K = 3 or higher, contribution of shear dilation of the smaller fractures becomes the main reason for continued flow channeling and increase of overall DEM model permeability. In addition, the relative orientation of fractures with respect to the shear stress direction, initial aperture, friction angle and dilation angle of the fractures are important factors for the occurrence of shear failure of fractures, therefore the existence of equivalent permeability tensor.
• The smaller number of large fractures of higher aperture values dominates the flow pattern and change of overall permeability of the fracture systems to a significant extent, especially at smaller magnitude of stress ratios. Only under higher stress ratios (K = 3 or higher in the cases studied here) the dilation caused by shear failure of large portion of smaller fractures starts to play a more important role in flow channeling and change of permeability, leading to significant channeling effect for fluid flow.

Scale and Stress Effects on Hydro-Mechanical Properties of Fractured Rock Mass
67
• The calculated directional permeabilities with different applied stress ratios show that a permeability tensor may exist at no stress condition, but may be destroyed or re-established with different in-situ stress conditions with different permeability values. Therefore, adequate characterization of the fracture system geometry, mechanical behaviors and properties of individual fractures and in-situ stress condition (and its change due to engineering or tectonic causes) are key issues for more realistic understanding and quantification of permeability field and its evolution.
• With an increase in the confining pressure, the strength of fractured rocks is increased. The Mohr-Coulomb criterion fits better with the numerical testing results of confining pressure envelopes for both the correlated and uncorrelated cases, compared with the Hoek-Brown strength envelope.

Alireza Baghbanan TRITA LWR PHD 1040
68
9 RECOMMENDATION FOR FUTURE STUDIES This study adopted a number of asumptions and simplifications which provide grounds for further research. The following are suggestions: • It is necessary to study how the impact of other possible
distributions of aperture, such as power law distributions, influence the hydro-mechanical properties of the fractured rocks.
• It would be very interesting to conduct similar studies in 3D and compare the results with the 2D results presented in this thesis. The present study did not have access to the data or computer capacity required for 3D studies.
• We also suggest that a comparison results of permeability of fractured rocks from numerical simulation with analytical models such as the technique developed by Zimmerman and Bodvarsson (1996) when the fracture systems are statistically homogeneous.
• A systematic uncertainty analysis of the effects that geometric parameters and mechanical properties of fractures have on hydro-mechanical properties of fractured rocks for site specific applications.
• More conprehensive constitutive models of fractures need to be developed that take into consideration the effects that gouge materials have on both the transmissivity of fractures and permeability of fracture networks.
• It is necessary to studies on how the correlated relation between fracture apertures and trace length affect rock properties such as:
o Anisotropic mechanical properties of the fractured rock mass;
o Particle transport in fractured rock mass; o Hydro-mechanical properties of dual porosity media.

Scale and Stress Effects on Hydro-Mechanical Properties of Fractured Rock Mass
69
10 REFERENCES Abelin H, Neretnieks I, Tunbrandt S, Moreno L. Final report of the
migration in a single fracture-experimental results and evaluation. In: Stripa Project, TR 85-03, SKB, Stockholm, 1985.
Adler PM, Thovert JF. Fractures and Fracture Networks. Kluwer, Dordrecht, Netherlands, 1999.
Amadei B, Goodman RE. A 3D constitutive relation for fractured rock masses. In Proc. Int Symp Mech Behavior Structured Media 1981:249-268.
Baghbanan A, Jing L. Hydraulic properties of fractured rock masses with correlated fracture length and aperture. Int J Rock Mech Min Sci 2007;44(5):704-719.
Baghbanan A. Deformability of rock fractures with correlated fracture length and aperture. In: Proc 3rd Iranian Rock Mech Conf, Tehran, Iran 2007, pp 1155-1164.
Baghbanan A, Jing L. Stress effects on permeability in fractured rock mass with correlated fracture length and aperture. Int J Rock Mech Min Sci 2008a, in press.
Baghbanan A, Jing L. Scale and stress effects on permeability tensor of fractured rocks with correlated fracture length and aperture. Geoproc2008 conference, Lille, France 2008b (accepted for publication).
Baghbanan A, Jing L. Effects of size and stress on deformability and strength of fractured rocks with correlated fracture aperture and length. Int J Rock Mech Min Sci 2008c (under revision).
Baghbanan A, Jing L. Heterogeneity of grain distribution and block scale effects on mechanical properties of intact rocks using Discrete Element Method approach. Material Characterization 2008d (submitted).
Bandis SC, Barton NR, Christianson M. Application of a new numerical model of joint behavior to rock mechanics problems. In: Proc Int Symp Fund Rock Joints, Bjorkliden, Sweden, 1985, pp 345-456.
Bandis SC, Lumsden AC, Barton NR. Fundamental of rock joint deformation. Int J Rock Mech Min Sci Geomech Abstr 1983;20:249-268
Bandis SC. Experimental studies of scale effects on shear strength and deformation of rock joints. PhD thesis, Leeds Univ, UK, 1980.
Barton CA, Zoback MD. Self-affine distribution and properties of macroscopic fractures at depth in crystalline rock in the Cajon Pass scientific drill hole. J Geophys Res 1992;97(B4):5181-5200.
Bear J. Dynamics of Fluids in Porous Media. Elsevier, New York, 1972.
Beiniawski ZT. The effect of specimen size on compressive strength of coal. Int J Rock Mech Min Sci 1968;5:325-335.

Alireza Baghbanan TRITA LWR PHD 1040
70
Belfield WC, Sovich J. Fractures statistics from horizontal welbores, J Can Pet Technology 1995;34:47-50.
Bertels SP, DiCarlo DA, Blunt MJ. Measurement of aperture distribution, capillary pressure, relative permeability, and in-situ saturation in a rock fracture using computed tomography scanning. Water Resour Res 2001;37(3):649-662.
Blum P, Mackay R, Riley MS, Knight JL. Performance assessment of a nuclear repository: Upscaling coupled hydro-mechanical properties for far field transport analysis. Int J Rock Mech Min Sci 2005;42:781-792.
Bonnet E, Bour O, Odling NE, Davy P, Main I, Cowie P, Berkowitz B. Scaling of fracture systems in geological media. Rev Geophys 2001;39(3):347–383.
Bour O, Davy P, Darcel C. A statistical scaling model for fracture network geometry, with validation on a multiscale mapping of a joint network (Hornelen Basin, Norway). J Geophys Res 2002;107(B6),10.1029/2001JB000176.
Bour O, Davy P. Connectivity of random fault networks following a power law fault length distribution. Water Resour Res 1997;33(7):1567-1583.
Brown ET, Hoek E. Trends in relationships between measured in-situ stresses and depth. Int J Rock Mech Min Sci Geomech Abstr 1978;15:211–215.
Cacas MC, Ledoux E, de Marsily G, Tillie B, Barbreau A, Durand E, Feuga B, Peaudecerf P. Modeling fracture flow with a stochastic discrete fracture network: Calibration and validation 1. The flow model. Water Resour Res 1990;26(3):479-489.
Chen M, Bai M. Modeling stress-dependent permeability for anisotropic fractured porous rocks. Int J Rock Mech Min Sci 2005;35(8):1113-1119.
Christianson MC, Board MP, Rigby DB. UDEC simulation of triaxial testing of lithophysal tuff. In: Proc 41st US Rock Mech Symp, 2006. p. 06-968, eds. DP Yale et al.
Clark MB, Brantley SL, Fisher DM. Power-law vein-thickness distributions and positive feedback in vein growth. Geology 1995;23(11):975–978.
Darcel C, Bour O, Davy P, de Dreuzy JR. Connectivity properties of two-dimensional fractures networks with stochastic fractal correlation. Water Resour Res 2003;39(10),1272, doi:10.1029/2002WR001628.
de Dreuzy JR, Darcel C, Davy P, Bour O. Influence of spatial correlation fracture centers on the permeability of two dimensional fractured networks following a power law length distribution. Water Resour Res 2004;40,W01502, doi:10.1029/2003WR002260.
de Dreuzy JR, Davy P, Bour O. Hydraulic properties of two-dimensional random fracture networks following the power law length distribution 1.Effective connectivity. Water Resour Res 2001a;37(8):2065-2078.

Scale and Stress Effects on Hydro-Mechanical Properties of Fractured Rock Mass
71
de Dreuzy JR, Davy P, Bour O. Hydraulic properties of two-dimensional random fracture network following a power law length distribution 2. Permeability of networks based on lognormal distribution of aperture. Water Resour Res 2001b;37(8):2079-2095.
de Dreuzy JR, Davy P, Bour O. Hydraulic properties of two-dimensional random fracture networks following power law distributions of length and aperture. Water Resour Res 2002;38(12),1276, doi:10.1029/2001WR001009.
de Dreuzy JR, Erhel J. Efficient algorithms for the determination of the connected fracture network and the solution of the steady state flow equation in fracture networks-short notes. Comp Geosci 2003;29:107-111.
Dershowitz WS, Einstein HH. Characterizing rock joint geometry with joint system methods. Rock Mech Rock Eng 1988;21:21-51.
Dverstop B, Andersson J. Application of the discrete fracture network concept with field data: Possibilities of model calibration and validation, Water Resour Res 1989;25:540-550.
Einstein HH, Baecher GB. Probabilistic and statistical methods in engineering geology. Rock Mech Rock Eng 1983;16:39-72.
Esaki T, Du S, Mitani Y, Ikusada K, Jing L. Development of a shear-flow test apparatus and determination of coupled properties for a single rock joint. Int J Rock Mech Min Sci 1999; 36:641-50.
Evans KF, Cornet FH, Hashida T, Hayashi K, Ito T, Matsuki K, Wallroth T. Stress and rock mechanics issues of relevance to HDR/WDR engineered geothermal systems: review of developments during the past 15 years. Geothermics 1999;28:455–474.
Fisher DM, Brantley SL, Everett M, Dzvonik J. Cubic fluid flow through a regionally extensive fracture network within the Kodiak accretionary prism. J Geophys Res 1995;100(B7):12881-12894.
Gale JE. Comparison of coupled fracture deformation and fluid flow models with direct measurements of fracture pore structure and stress-flow properties. In: Proc 28th US Rock Mech Symp, Farmer/Daemen/Desai/Glass/Neuman, eds. Tucson, 1987, pp 1213-1222.
Ge S. A governing equation for fluid flow in rough fractures. Water Resour Res 1997;33(1):53-61.
Gentier S, Hopkins D. Mapping fracture aperture as a function of normal stress using a combination of casting, image analysis and modeling. Int J Rock Mech Min 1997;34:3-4.
Glucklich J, Cohen LJ. Size as a factor in the brittle-ductile transition and the strength of some materials. Int J Fracture Mech 1967;3(4):278-289.
Glucklich J, Cohen LJ. Strain energy and size effects in a brittle material. Maters Res Stand 1968;8:17-22.

Alireza Baghbanan TRITA LWR PHD 1040
72
Goodman RE. Methods of geological engineering in discontinues rocks. New York: West Publishing, 1976.
Hakami E, Barton N. Aperture measurements and flow experiments using transparent replicas of rock joints. In: Proc Int Symp Rock Joints, Barton N, Stephansson O, eds. Rotterdam: Balkema, 1990, pp 383-390.
Hakami E, Einstein HH, Gentier S, Iwano M. Characterization of fracture apertures - Methods and parameters. In: Proc 8th Int Cong Rock Mech, Tokyo, 1995; pp. 751-754.
Hakami E, Larsson E. Aperture Measurements and Flow Experiments on a Single Natural Fracture. Int J Rock Mech. Min Sci & Geomech Abstr 1996;33(4):395-404.
Hatton CG, Main IG, Meredith PG. Non-universal of fracture length and opening displacement. Nature 1994;367:160-162.
Hestir K, Long JCS. Analytical expressions for the permeability of random two-dimensional Poisson fracture networks based on regular lattice percolation and equivalent media theories. J Geophys Res 1990;95(B13):21565-21581.
Heuze FE. Scale effects in the determination of rock mass strength and deformability. Rock Mech 1980;12:167-192.
Hoek E, Brown ET. Underground excavation in rock. London: Inst Min. Mettal.; 1980.
Hudson JA, Priest SD. Discontinuity frequency in rock masses. Int J Rock Mech Min Sci Geomech Abstr 1983;20:73-89.
Indraranta B, Ranjith PG, Gale W. Single phase water flow through rock fractures. Geotech Geolog Eng 1999;17:211–240.
Itasca Consulting Group Inc. UDEC User’s guide, ver 4.0, Minneapolis, Minnesota, 2004.
Iwai K. Fundamental of fluid flow through a single fracture. PhD thesis, Univ California, Berkeley, 1976.
Iwano M, Einstein HH. Stochastic analysis of surface roughness, aperture and flow in a single fracture. In: Proc Int Symp EUROCK ’93, Lisbon, 1993, pp 135-141.
Jaeger JC, Cook NGW, Zimmerman RW. Fundamentals of Rock Mechanics, 4th ed. Oxford: Blackwell, 2007.
Jiang Y, Xiao J, Tanabashi Y, Mizokami T. Development of an automated servo-controlled direct shear apparatus applying a constant normal stiffness condition. Int J Rock Mech Min Sci 2004;41(2):275-286.
Jing L, Stephansson O. Fundamentals of discrete element methods for rock engineering: Theory and applications (developments in geotechnical engineering). Amsterdam: Elsevier, 2007.
Jing L, Baghbanan A. Stress and scale-dependency of the hydraulic properties of fractured rocks. In: Proc. ISRM symposium for young scholars, Beijing China, 2008, Taylor & Francis Group, London, ISBN 978-0-415-46934-0. p.41-48.
Johns RA, Steude JS, Castanier LM, Roberts PV. Nondestructive measurements of fracture aperture in crystalline rock cores using X-ray computed tomography. J Geophys Res 1993;98(B2):1889-1900.

Scale and Stress Effects on Hydro-Mechanical Properties of Fractured Rock Mass
73
Johnston JD, McCaffrey KJW. Fractal geometries of vein systems and the variation of scaling relationships with mechanism. J Struct Geol 1996;18(2-3):349-358.
Kemeny J, Cook NGW. Effective moduli, nonlinear deformation and strength of cracked elastic solids. Int J Rock Mech Min Sci & Geomech Abstr 1986;23:107-118.
Khaleel R. Scale dependence of continuum models for fractured basalts. Water Resour Res 1989;25(8):1847-1855.
Kulatilake PHSW, Wang S, Stephansson O. Scale effects of the deformability of jointed rock at the three-dimensional level. In Proc Scale Effects in Rock Masses 93, ed., Pinto da Cunha, Lisbon, 1993.
Lee HS, Cho TF. Hydraulic characteristics of rough fractures in linear flow under normal and shear load. Rock Mech Rock Engng 2002;35:299-318.
Lee SD, Moon HK. A study on the groundwater flow and grouting around underground openings based on stress-.dependent discrete joint network analysis. In: Proc 3rd Int Asian Rock Mech Symp, eds. Ohnishi, Aoki. Japan, 2004, pp. 1107-1110.
Long JCS, Remer JS, Wilson CR, Witherspoon PA. Porous media equivalents for networks of discontinuous fractures. Water Resour Res 1982;18(3):645-658.
Madhavi Latha G, Sitharam TG. Comparison of failure criteria for jointed rock masses. Int J Rock Mech Min Sci 2004;41:509-514.
Margolin G, Berkowitz B, Scher H. Structure, flow, and generalized conductivity scaling in fracture networks. Water Resour Res 1998;34(9):2103-2121.
Marrett R. Aggregate properties of fracture populations. J Struct Geol 1996;18(2-3):169-178.
Min KB, Jing L, Numerical determination of the equivalent elastic compliance tensor for fractured rock masses using the distinct element method, Int J Rock Mech Min Sci 2003;40(6):795-816
Min KB, Jing L, Stephansson O. Determining the equivalent permeability tensor for fractured rock masses using a stochastic REV approach: Method and application to the field data from Sellafield, UK. Hydrogeol J 2004a;12(5):497-510.
Min KB, Rutqvist J, Tsang CF, Jing L. Stress-dependent permeability of fractured rock masses: a numerical study. Int J Rock Mech Min Sci 2004b;41(7):1191-1210.
Mourzenko VV, Thovert JF, Adler PM. Macroscopic permeability of three-dimensional networks with power-law size distribution. Phys Rev 2004;E(69):066307,1-13.
Nirex. Data summary sheets in support of gross geotechnical predictions. Nirex report SA/97/052, Harwell, UK; 1997a.
Nirex. Evaluation of heterogeneity and scaling of fractures in the Borrowdale Volcanic Group in the Sellafield area. Nirex Report SA/97/028, Harwell, UK; 1997b.
Nirex. The lithological and discontinuity characteristics of the Borrowdale Volcanic Group at the outcrop in the Craghouse

Alireza Baghbanan TRITA LWR PHD 1040
74
Park and Latterbarrow areas. Nirex report SA/97/029, Harwell, UK; 1997c.
Oda M, Hatsuyama Y, Ohnishi Y. Numerical experiments on permeability tensor and its application to jointed granite at Stripa Mine, Sweden. J Geophys Res 1987;92(B8):8037-8048
Oda M. A method for evaluating the representative elementary volume based on joint survey of rock mass. Can Geotech J 1988;25:440-447.
Oda M. An equivalent continuum model for coupled stress and fluid flow analysis in jointed rock masses. Water Resour Res 1986;22(13):1845-1856
Öhman J, Niemi A. Upscaling of fracture hydraulics by means of an oriented correlated stochastic continuum model. Water Resour Res 2003;39(10),doi:10.1029/2002WR001776.
Olsson R, Barton N. An improved model for hydromechanical coupling during shearing of rock joints. Int J Rock Mech Min Sci 2001;38:317-329.
Oron AP, Berkowitz B. Flow in rock fractures: The local cubic law assumption re-examined. Water Resour Res 2001;37(8);2079-2095.
Ouyang Z, Elsworth D. Evaluation of groundwater flow into mined panels. Int J Rock Mech Min Sci Geomech Abstr 1993;30(2):71-79.
Park YJ, de Dreuzy JR, Lee KK, Berkowitz B. Transport and intersection mixing in random fracture networks with power law length distributions. Water Resour Res 2001;37(10): 2493-2502.
Piggott AR, Elsworth D. Laboratory assessment of the equivalent apertures of a rock fracture. Geophy Res Lett 1993;20(13):1387-1390.
Priest SD, Hudson JA. Discontinuity spacing in rock. Int J Rock Mech Min Sci Geomech Abstr 1976;13:135-148.
Priest SD, Hudson JA. Estimation of discontinuity spacing and trace length using the scanline surveys. Int J Rock Mech Min Sci Geomech Abstr 1981;18:183-197.
Priest SD. Discontinuity Analysis for Rock Engineering. London: Chapman & Hall, 1993.
Prudencio M, Van Sint Jan M. Strength and failure modes of rock mass models with non-persistent joints. Int J Rock Mech Min Sci 2007;44:890-902.
Pyrak-Nolte LJ, Morris JP. Single fractures under normal stress: The relation between fracture specific stiffness and fluid flow. Int J Rock Mech Min Sci, 2000;37:245-262.
Pyrak-Nolte LJ, Montemagno CD, Nolte DD. Volumetric imaging of aperture distributions in connected fracture networks. Geophy Res Lett 1997;24(18):2343-2346.
Ramamurthy T, Arora VK. Strength predictions for jointed rocks in confined and unconfined states. Int J Rock Mech Min Sci & Geomech Abstr 1994;31:9-22.

Scale and Stress Effects on Hydro-Mechanical Properties of Fractured Rock Mass
75
Raven KG, Gale JE. Water flow in a natural rock fracture as a function of stress and sample size. Int J Rock Mech Min Sci Geomech Abstr 1985; 22: 251-261.
Renshaw CE, Park JC. Effect of mechanical interactions on the scaling of fracture length and aperture. Nature 1997;386:482-484.
Renshaw CE. On the relationship between mechanical and hydraulic apertures in rough-walled fractures. J Geophys Res 1995;100(B12):24,629-24,636.
Sahimi M. Flow and Transport in Porous Media and Fractured Rock. New York: VCH, 1995.
Sen Z, Sadagah BH. Probabilistic horizontal stress ratios in rock. Math Geol 2002;34(7):845-855
Sharifzadeh M, Mitani Y, Esaki T, Urakawa F. An investigation of joint aperture distribution using precise surface asperities measurement and GIS data processing. In: Proc 3rd Int Asian Rock Mech Symp, eds. Ohnishi and Aoki, Kyoto, 2004, pp 165-171.
Stone D. Sub-surface fracture maps predicted from borehole data: an example from the Eye-Dashwa Pluton, Atikolan, Canada. Int J Rock Mech Min Sci Geomech Abstr 1984; 21(4):183-194.
Tsang CF, Neretnieks I. Flow channeling in heterogeneous fractured rocks. Rev Geophys 1998;36:275-298.
Tsang YW. Usage of equivalent aperture for rock fractures as derived from hydraulic and tracer tests (Review Paper). Water Resour Res 1992;28(5):1451-1455.
Tsoutrelis CE, Exadaktylos GE. Effect of rock discontinuities on certain rock strength and fracture energy parameters under uniaxial compression. Geotech Geol Eng 1993;11:81-105.
Vermilye JM, Scholz CH. Relation between vein length and aperture. J Struct Geol 1995;17(3):423-434.
Walmann T, Malthe-Sorensen A, Feder J, Jossang T, Meakin P, Hardy HH. Scaling relations for the lengths and widths of fractures. Phys Rev Lett 1996;77:5393-5396.
Wang XB. Effect of joint width on strength, stress-strain curve and strain localization of rock mass in uniaxial plane strain compression. Key Eng Maters 2007;353-358:1129-1132.
Welideniya HS. Laboratory evaluation and modeling of shear strength of infilled joints under constant normal stiffness (CNS) conditions. PhD thesis, Univ. Wollongong, Australia, 2005.
Wong TF, Fredrich JT, Gwanmesia GD. Crack aperture statistics and pore space fractal geometry of Westerly Granite and Rutland Quartzite: Implication for elastic contact model of rock compressibility. J Geophys Res 1989;94(B4):10,267-10,278.
Yoshinaka R, Yabame T. Joint stiffness and deformation behavior of discontinues rock. Int J Rock Mech Min Sci Geomech Abstr 1986;23(1):19-28.
Zhang X, Powrie W, Harkness R, Wang S. Estimation of permeability for the rock mass around the Shiplocks of the

Alireza Baghbanan TRITA LWR PHD 1040
76
Three Gorges Project, China. Int J Rock Mech Min Sci 1999;36:381-397.
Zhang X, Sanderson DJ, Harkness R, Last NC. Evaluation of the 2D permeability tensor for fractured rock masses. Int J Rock Mech Min Sci & Geomech Abstr 1996;33(1):17-37.
Zhang X, Sanderson DJ. Effect of stress on the two-dimensional permeability tensor of natural fracture networks. Geophys J Int 1996;125:912-924
Zhang X, Sanderson DJ. Evaluation of instability in fractured rock masses using numerical analysis methods: Effect of fracture geometry and loading direction. J Geophys Res 2001; 106(B11):26671-26687.
Zhang X, Sanderson DJ. Numerical study of critical behavior of deformation and permeability of fractured rock masses. Mar Pet Geol 1998;15:535-548.
Zimmerman RW, Bodvarsson GS. Effective transmissivity of a two-dimensional fracture network. Int J Rock Mech Min Sci Geomech Abstr 1996;33(4):433-438.