scaled pearson’s correlation coefficient for evaluating
TRANSCRIPT

Modern Applied Science; Vol. 13, No. 10; 2019 ISSN 1913-1844 E-ISSN 1913-1852
Published by Canadian Center of Science and Education
26
Scaled Pearson’s Correlation Coefficient
for Evaluating Text Similarity Measures
Issa Atoum1 1 Faculty of Information Technology, The World Islamic Sciences and Education, Amman, Jordan
Correspondence: Issa Atoum, Faculty of Information Technology, The World Islamic Sciences and Education, Amman, Jordan. E-mail: [email protected]
Received: August 26, 2019 Accepted: September 12, 2019 Online Published: September 16, 2019
doi:10.5539/mas.v13n10p26 URL: https://doi.org/10.5539/mas.v13n10p26
Abstract
Despite the ever-increasing interest in the field of text similarity methods, the development of adequate text similarity methods is lagging. Some methods are decent in entailment while others are reasonable to the degree to which two texts are similar. Very often, these methods are compared using Pearson’s correlation; however, Pearson’s correlation is bound to outliers that could affect the final correlation coefficient figure. As a result, the Pearson correlation is inadequate to find which text similarity method is better in situations where data items are very similar or are unrelated. This paper borrows the scaled Pearson correlation from the finance domain and builds a metric that can evaluate the performance of similarity methods over cross-sectional datasets. Results showed that the new metric is fine-grained with the benchmark dataset scores range as a promising alternative to Pearson’s correlation. Moreover, extrinsic results from the application of the System Usability Scale (SUS) questionnaire on the scaled Pearson correlation revealed that the proposed metric is attaining attention from scholars which implicate its usage in the academia.
Keywords: Pearson, semantic similarity, performance metric, correlation metrics
1. Introduction
Semantic Textual Similarity (STS) determines the degree of which two texts are similar. It is active research, part of which in the SemEval workshop series (Agirre et al., 2012; D. M. Cer, Diab, Agirre, Lopez-Gazpio, & Specia, 2017). The STS has many applications in the field of automatic essay grading (Ratna, Luhurkinanti, Ibrahim, Husna, & Purnamasari, 2018), anti-plagiarism detection (Abdi, Idris, Alguliyev, & Aliguliyev, 2015; Meuschke, Siebeck, Schubotz, & Gipp, 2017), automated text summarization (Fang, Mu, Deng, & Wu, 2017) , web page duplication detection (Manku, Jain, & Das Sarma, 2007), and other domain-specific tasks (Atoum, 2018, 2019; Ayyagari & Atoum, 2019).
Typically, an STS system computes the similarity between two texts as a score between 0 to 5, where 0 indicates dissimilarity and 5 indicates equivalence. Consequently, the relationship between human rating scores and STS system scores is used as the foundation for STS system assortment, often using Pearson Correlation (e.g., Šarić, Glavaš, Karan, Šnajder, & Bašić, 2012). The Pearson correlation finds the degree of association between the STS system and human scores, which is a value in the range of -1 to a +1. When the magnitude of the value is close to 1, it implies a high correlation with the human rating; consequently, the similarity method becomes promising.
Text similarity measures performance depends on many factors, including the underlying semantic features that might be affected by the domain of the text, the length of text, and the text-similarity algorithm itself. Such factors and many others could inject noise to the regression line of the Pearson Correlation. Therefore, under such noise conditions, extracting the correlation coefficient between two sets of stochastic variables is not trivial (Moriya, 2008). One major problem of the Pearson correlation is the outliers that influence the slope of the regression line, and accordingly, the value of the correlation coefficient. The Pearson correlation uses the mean and standard deviation of scores regardless of the STS task under consideration. Therefore, it is possible to get a high Pearson correlation for scores even though there is no actual relationship between the outputs and human judgments. This problem reconciles with Anscombe’s quartet (Anscombe, 1973). According to Anscombe’s quartet, the same Pearson correlation score might be obtained even the dataset is showing a visually nonlinear relationship due to outliers, as shown in Figure 1.

mas.ccsenet
This researdataset hasalmost simgrading, an(such as perfect_forperfectly fall cases. Tmatch the to the figuTherefore,approbatesmisleadingMihalcea,
The probleMcLean, Bthe first arsimilar. ThsignificantFigure 3 reis not suitreported p
Fig
Fi
t.org
rch aims to diss adequate exa
milar pairs. Thend text summaPearson corr
r_medium, c)pfor low similarThe set of humtarget similari
ures 2b-2c. The, based on thes similar, dissg (Reimers, Be2017).
em of the similBandar, O’Sherbitrary 12 pairherefore, somtly performingeveal similaritytable for low spercentage abs
gure 3. LSA met
igure 1. Effect o
scover an STS mples of numeese groups couarization. Therrelation). Figuperfect_for_higr pairs, modera
man pairs were cty method, whe optimal goale Pearson corimilar, or mod
eyer, & Gurevy
larity groups isa, & Crockett, rs are dissimilae similarity m
g better with hy scores of morsimilarity textsolute relative
thod on STS-65
of outliers on Pe
Modern
system that werous text pairsuld resemble Srefore, it is esseure 2 showsgh, and d) perately similar paconstructed for
here the first thl is to find a mrrelation alonederate similar ych, 2016) and
s further illustr2006). The hu
ar, 13th to 20th
measures are rehigh similarityre than 0.50 fos as the figureerror of LSA
Dataset(r=0.84
earson’s correlat
n Applied Scienc
27
works for every s that include p
STS tasks of wential to map t three differrfect_for_all thairs, high similr illustration pu
hree pairs are cmethod that woe, it is not cle
text pairs. Thd is inappropria
ated with the Suman ratings shpairs are modeasonable to m
y traits. The LSr all comparede shows that tto human rati
F
4)
tion F
ce
group of the dpairs that are di
web page duplicthe STS task torent systems hat resembles lar pairs, and thurposes. Figurlose to human
orks well on alear wither a sherefore, relyinate for every se
STSS-65 datasehown in Figure
derately similarmeasure low sSA measure o
d text pairs. Thethe LSA has hing is ranging
Figure 4. Li met
Figure 2. Effect
V
dataset pairs. Aissimilar, modcation detectioo the suitable pnamed a) pa similarity m
he perfect metre 2a is when thratings. The s
ll data pairs siimilarity measng on the Peaemantic similar
et that consistse 3 and Figure r, and 21st to 3similarity textof O’Shea et aerefore, the rephigher scores t
from 53- 80%
thod on STS-65
of Similarity me
Vol. 13, No. 10;
A useful benchderately similaron, automatic eperformance merfect_for_low
measure that wthod that workhe low similar ame can be ap
imilar to Figursure (STS sysarson correlatirity task (Wils
s of 30 text pair4, demonstrate0th pairs are als, while other
al. (2008) showported LSA methan expected.%; accordingly
Dataset(r=0.81
ethod on Pearso
2019
mark r, and essay
metric w, b) works
with pairs plied
re 2d. stem) on is on &
rs (Li, e that lmost rs are wn in ethod . The y, the
)
n’s

mas.ccsenet.org Modern Applied Science Vol. 13, No. 10; 2019
28
author calls the LSA method an overestimating method that gives a moderate Pearson correlation. Figure 4 shows
the behavior of Li method (Li et al., 2006); relatively, the same symptom as the LSA method with percentage
absolute relative error of human ratings to Li method is ranging from 61-98%. Therefore, these methods suffer
from Anscombe’s quartet problem, and an alternative metric should tackle their outliers.
Although there are many alternatives to the Pearson correlation, they are domain-specific (Bogolyubova,
Panicheva, Tikhonov, Ivanov, & Ledovaya, 2018; Dikbaş, 2018; Smarandache, 2009; Wu, Pang, Lin, & Pei, 2013).
The Spearman's rank correlation is more robust than Pearson; however, Pearson remains the most popular
correlation measure (Serin, Nijveen, Hilhorst, & Ligterink, 2016). Compared to Pearson’s correlation, Kendall’s
Tau is robust to outliers (M. Kendall & Gibbons, 1990); however, it suits data that is ranked by nature. Several
evaluation methods were combined in (Reimers et al., 2016); however, they concentrate on the STS systems’
ranking instead of particular properties of the benchmark dataset.
Therefore, to solve the problem, the author borrows the scaled Pearson correlation from the finance domain
(Nikolić, Mureşan, Feng, & Singer, 2012). The scaled Pearson correlation method is used to reveal correlations
between test and human scores in various data segments. If the dataset is arbitrary grouped into three segments,
three Pearson correlations scores are obtained. The author averages the scores over segments; therefore, getting a
single scaled Pearson score. For the overall computation of many datasets with different distributions, the Fisher
z-scores (Fisher, 1921) is used to convert scaled Pearson scores to a single Pearson correlation score; therefore,
providing a quantitative one value that could be used to compare datasets of different sizes.
The scaled Pearson score reduce skewness, and therefore, this research could evaluate the STS system in different
data range scores (different STS tasks). The proposed metric can be used to identify the effectiveness of a
similarity method over a specific semantic task. Consequently, discovering significant pitfalls of semantic
similarity methods and allowing better STS method selection.
The remainder of the paper is structured as follows. Section 2 summarizes the related works. In Section 3, this
paper explains the proposed metric. In Section 4, this research evaluates the proposed metric, while Section 6
provides conclusions, followed by implications and conclusions.
2. Related Works
This section covers the Pearson’s correlation as applied to the semantic similarity domain, ranking methods,
information retrieval methods, and standard error methods.
2.1 Pearson Correlation
Pearson's correlation coefficient, 𝑟, has many formulas (Lee Rodgers & Nicewander, 1988). Equation (1) shows
one by substituting estimates of the covariances and variances in the STS dataset. The benchmark datasets have a
set of scores {g1,...,gn} that represent the human gold standard scores of a list of text pairs {(P1, Q1),..., {(Pn, Qn)}
and another list {t1,...,tn} containing n values of scores obtained from a text similarity method.
𝑟 =∑ (𝑔𝑖−𝑔 ̅𝑛
𝑖=1 )(𝑡𝑖−𝑡̅ )
√∑ (𝑔𝑖−𝑔𝑖̅̅ ̅ )𝑛𝑖=1
2 .√∑ (𝑡𝑖−𝑡̅ )𝑛
𝑖=12
, (1)
where 𝑛 is the number of text pairs, 𝑔𝑖, 𝑡𝑖 are the ith
score of the gold standard and test pairs scores, respectively.
The 𝑔�̅� and 𝑡�̅� are the mean of the gold standard and test scores.
2.2 Ranking Methods
The Spearman correlation is a non-parametric measure (Spearman, 1904) that asses the relationship between two
text pairs as a monotonic function. Although the Spearman's coefficient is appropriate for a linear and non-linear
relationship, it is less adopted in the semantic similarity domain. The Kendall tau rank correlation coefficient (M.
G. Kendall, 1938) is a measure of the portion of ranks that match between two data sets; however, it is suitable for
data is that is ranked by nature (M. Kendall & Gibbons, 1990). The normalized Cumulative Gain (nCG) can be
used to evaluate the ranking quality of STS scores (Järvelin & Kekäläinen, 2000). The normalized Discounted
Cumulative Gain (nDCG) applies a discount factor to the normalized Cumulative Gain (Kekäläinen, 2005). It
measures the advantage of a document based on its position in the result list, which is accrued from the top of the
result list to the bottom. The difference is that the nCG does not include the position of a result in consideration of
the usefulness of a result set. An enhanced version of nCG resolves the problems of rank ties and lower bound
(Katerenchuk & Rosenberg, 2018). Since semantic similarity scores are scaled, ordinal ranking methods (e.g.,
Goodman & Kruskal, 1979) are not suitable for STS tasks. Therefore, rank methods have the problem of ties
when more than one values get the same rank.

mas.ccsenet.org Modern Applied Science Vol. 13, No. 10; 2019
29
STSSICK
PreprocessingCalculateSimilarity
Intrinsic Rankings
Scaled Pearson UsabilityScaled Usability Scores (SUS)
2.3 Error Methods
One of the most cited error methods is the absolute error which calculates the magnitude of an error in an
experiment. An extension to the absolute error is the relative error that expresses how large the absolute error
compared with the total size of data. Relative errors are usually calculated in percentage value comparing observed
values to actual values such as the mean absolute percentage error (MAPE), a percentage measure of prediction
accuracy. Relative error methods are easy-to-use, easy-to-understand, and domain-independent (Wang & Bovik,
2009); however, they have the problem of undefined mean and infinite variance.
2.4 Information Retrieval Methods
Traditional information retrieval methods such as accuracy, precession, and F-measure could be used for
evaluating the effectiveness of STS systems; however, it is unclear how to compute them in the STS domain. The
evaluation requires to know the maximum and minimum values of compared STS systems and the arbitrary
boundary of grouped bins (Reimers et al., 2016).
3. Proposed Metric
The scaled Pearson correlation was initially used in the time series application (Nikolić et al., 2012). Equation (2)
defines the number of segments (𝐾) that can fit into the total number of text pairs (N) for a given set of cases (𝑛).
Accordingly, the scaled Pearson correlation ( r̅𝑛) for all text segments 𝐾 is given by equation (3), where 𝑟𝑘 is the
Pearson’s coefficient of correlation for segment 𝑘. The best number of segments 𝐾 is dependent on the dataset
distribution of scores and the required level of confidence. If the objective is to split the dataset into three
cross-sections then (𝐾) will be assigned the value three; therefore, the number of cases (𝑛) will be the number of
test pairs in each segment or bin. According to the third equation, mathematically the number of bins can grow
from 2 to 𝑁 − 1; however, it is essential to split the dataset based on the STS task under consideration and provide
a high confidence Pearson correlation 𝑟𝑘 such that K is an integer value.
Equation (3) will provide one correlation for each dataset; therefore, a distribution-independent comparison with
more than one dataset is needed. Therefore, the Fisher z-scores (Fisher, 1921) is used. The Fisher Z-score tells how
far a score is from the mean in units of the standard deviation. This research converts the scaled Pearson scores to
Fisher z-scores, then the z-scores are averaged and converted back to Pearson scores to provide a quantitative
unbiased comparison between datasets of different sizes. Consequently, Fisher transformation is a way to
transform the sampling distribution of Pearson’s r (for each dataset) so that it becomes normally-distributed.
𝐾 =N
𝑛 (2)
�̅�𝑛 =1
𝐾∑ 𝑟𝑘
𝐾𝑘=1 (3)
𝑧 =1
2𝑙𝑛
1+�̅�𝑛
1−�̅�𝑛= 𝑎𝑟𝑐ℎ𝑡𝑎𝑛(r̅𝑛) (4)
�̅�𝑛 = 𝑡𝑎𝑛ℎ(𝑧) (5)
Equation (4) shows how the Pearson correlation is converted to z-scores, where ln is the natural logarithm function,
and arctanh is the inverse hyperbolic tangent function. Equation (5) converts the same results back to Pearson
correlation by using the tanh of z-scores. As a result, we have one scaled Pearson value for comparison.
4. Evaluation and Discussion
4.1 Evaluation Methodology
Figure 5. Evaluation Methodology

mas.ccsenet.org Modern Applied Science Vol. 13, No. 10; 2019
30
Figure 5 shows the evaluation methodology in the research experiments. The methodology consists of preprocessing, calculating similarity, ranking similarity methods, and extrinsic evaluation of the proposed scaled Pearson correlation. The author uses two primary datasets in this experiment, the STS (D. M. Cer et al., 2017) and the SICK (Sentences Involving Compositional Knowledge) datasets. The STS benchmark dataset comprises a selection of the English datasets used in the STS tasks organized in the context of SemEval series between 2012 and 2017. The selection of datasets includes text from image captions, news headlines, and user forums. The SICK dataset (Marelli et al., 2014) consists of about 10,000 English sentence pairs, generated starting from two existing sets: the 8K ImageFlickr data set and the SemEval 2012 STS MSR-Video Description dataset. This research selects the DEV and TEST datasets of SICK (5427 sentences).
The calculate similarity process in the evaluation methodology scores selected methods based on its underlying techniques. Then, the methods are ranked using intrinsic rankings of Pearson, Mean Absolute error, Spearman, nDCG, and Rank DCG methods. The extrinsic ranking is accomplished based on the usability of the proposed scaled Pearson method.
4.2 Selected Text Similarity Methods
We applied the proposed metric on a set of text similarity methods that use different approaches (Arora, Liang, & Ma, 2017; Atoum & Otoom, 2016; Conneau, Kiela, Schwenk, Barrault, & Bordes, 2017; Kusner, Sun, Kolkin, & Weinberger, 2015; Li et al., 2006; Zarif et al., 1994). The Word Mover's Distance (WMD) uses the word embeddings of the words in two texts to measure the minimum amount that the words in one text need to travel in semantic space to reach the words of the other text (Kusner et al., 2015). The Smooth Inverse Frequency (SIF) gives less weight to wholly inappropriate words, and so word embeddings are weighted based on the estimated relative frequency of a word in a reference corpus and common component analysis technique (Arora et al., 2017). InferSent (INF for shorthand) is a sentence embedding trained on fastText vectors of Facebook research (Conneau et al., 2017). It is a BiLSTM with max-pooling that was trained on the SNLI dataset, 570k English sentence pairs labeled with one of three categories: entailment, contradiction, or neutral. Similar to InferSent, Google Sentence Encoder (GSE) provides sentence embeddings based on trained deep learning network semantic vectors (D. Cer et al., 2018). Traditional semantic similarity methods calculate the semantic similarity of two sentences using information from a structured lexical database and corpus statistics (e.g., Atoum & Otoom, 2016; Atoum, Otoom, & Kulathuramaiyer, 2016; Li et al., 2006).
The experiments exclude stopwords from the datasets using the nltk list of stop words. For GSE, the paper uses the Encoder 2 from Google TensorFlow Hub. The author uses the pre-trained word vectors of Glove (840B tokens x 300 dimensions) from Stanford’s, fastText word vectors W2V (2 million-word vectors x 300 dimensions).
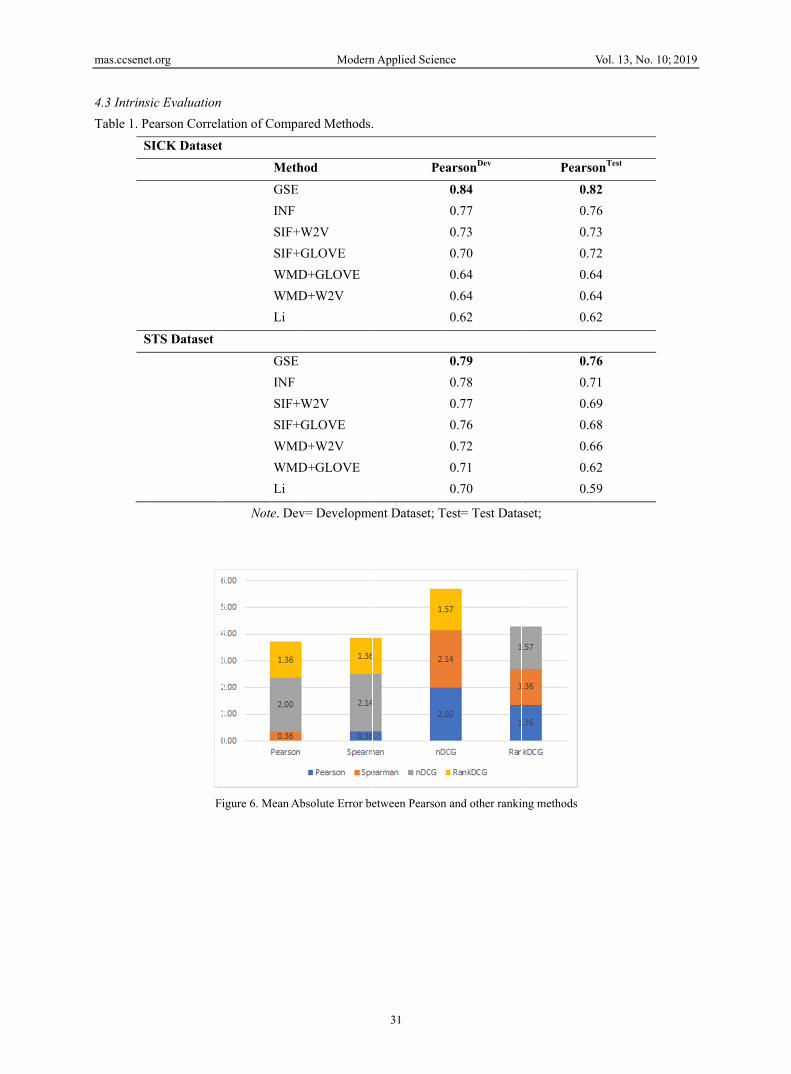
Table 1 shows the Pearson correlation of the list of compared methods, where GSE and InferSent are the leaders while Li method (Li et al., 2006) is lagging. According to the results the usage of GLOVE or W2V pre-trained word vectors affects the performance of SIF and WMD methods by 2-4%. The author argues that the Pearson correlation is not enough for method selection. Therefore, this research ran and evaluated the same methods on other ranking metrics, as shown in Figure 6.
mas.ccsenet
4.3 Intrins
Table 1. P
S
S
t.org
sic Evaluation
earson Correla
SICK Dataset
STS Dataset
Fi
ation of Comp
Meth
GSE
INF
SIF+
SIF+
WMD
WMD
Li
GSE
INF
SIF+
SIF+
WMD
WMD
Li
Note. De
igure 6. Mean A
Modern
ared Methods.
hod
E
+W2V
+GLOVE
D+GLOVE
D+W2V
E
+W2V
+GLOVE
D+W2V
D+GLOVE
v= Developme
Absolute Error be
n Applied Scienc
31
.
Pea
ent Dataset; Te
etween Pearson
ce
arsonDev
0.84
0.77
0.73
0.70
0.64
0.64
0.62
0.79
0.78
0.77
0.76
0.72
0.71
0.70
est= Test Data
and other ranki
V
Pearso
0.8
0.7
0.7
0.7
0.6
0.6
0.6
0.7
0.7
0.6
0.6
0.6
0.6
0.5
aset;
ing methods
Vol. 13, No. 10;
onTest
2
6
3
2
4
4
2
6
1
9
8
6
2
9
2019

mas.ccsenet.org Modern Applied Science Vol. 13, No. 10; 2019
32
Table 2. Scaled Pearson Correlations for STS and SICK datasets
SICK Dataset
Method PearsonDev PearsonTest
GSE 0.50 0.42
INF 0.44 0.41
SIF+W2V 0.42 0.41
SIF+GLOVE 0.51 0.35
WMD+GLOVE 0.46 0.50
WMD+W2V 0.46 0.50
Li 0.46 0.40
STS Dataset
GSE 0.46 0.46
INF 0.45 0.38
SIF+W2V 0.41 0.36
SIF+GLOVE 0.41 0.37
WMD+W2V 0.39 0.35
WMD+GLOVE 0.38 0.32
Li 0.29 0.25
Note. Dev= Development Dataset; Test= Test Dataset; Figure 6 shows the Mean Absolute Error (MAE) between the rank of the methods presented in Table 1 (using Pearson) and ranks of the same methods using other ranking methods discussed in Section 2.2. The STS methods used in Table 1 could get different rank if another evaluation metric was used. The nearest rank was with Spearman evaluation metric, and highest error was with RankDCG method. Moreover, the ranks were different with different datasets. Therefore, Spearman could be used as an auxiliary evaluation metric to Pearson correlation; however, it does not give enough information about STS tasks (dataset distributions).
Based on different types of STS tasks and current datasets, each benchmark dataset was split into three bins were the first bin represent the set of dissimilar text pairs, the middle bin represents moderately similar text, and the last bin is highly similar or equivalent text pairs. For the STS-TEST and STS-DEV datasets, bin number one with text pairs of human scores less than 1.66, bin number two with scores between 1.66 and 3.33 and bin number three with scores higher than 3.33. The bin coverage for STS-TEST and STS-DEV datasets were (0.295,0.318,0.387) and (0.355,0.344,0.301) respectively. For the SICK-TEST and SICK-DEV datasets, three bins were used according to the dataset labels (contradiction, neutral, entailment) respectively. The bin coverage for SICK-TEST and SICK-DEV datasets were (0.148,0.288,0.564) and (0.146,0.287,0.567) respectively.
Table 2 shows the scaled Pearson correlations. All reported scores were significant (p <0.05). The scores are almost 30% lower than the reported Pearson scores, which indicate the effectiveness of the proposed metric by removing outliers. Based on scaled correlations, the rank of similarity methods could be used for a general-purpose STS task; however, it is essential to use methods that complete others on a specific STS task.
Selecting the best metric is context-dependent on the similarity task. Figure 7 and Figure 8 show the scaled Pearson of each method over three bins for the combined test and training datasets. The author converted scaled Pearson scores of test and training to z-scores, then the z-scores were averaged and converted back to Pearson scores. Most of the compared similarity methods in STS dataset are getting low scaled Pearson scores in the moderately similar text due to either overestimating or underestimating scores. The similar symptom was also shown for the SICK dataset in the first low similarity bin. The figures show that although GSE got the highest Pearson score, it gets a lower scaled score due to overestimating text pairs. To justify GSE performance, the author runs the experiment on the SemEVal benchmark dataset 2012-2017, a list of 1500 sentence pairs development dataset (D. M. Cer et al., 2017). This research found that 139 sentence pairs (around 9%) that were scored zero by humans are overestimated by Google’s Encoder (0.644 on average). A sentence pair from the benchmark dataset is shown:
3 killed, 4 injured in Los Angeles shootings
Five killed in Saudi Arabia shooting.

mas.ccsenet
The sentenrelated wowords rathWMD met
The scaledof active ois considerentailmentwords withFigure 8.
Figure 9 coz-scored, adissimilar
Fig
Figure
t.org
nce-pair scoreord (injured). Hher than embedthod will do th
d Pearson perfoor passive sentered more diffict as described h no lexical an
ombines the reaveraged, thenpairs as show
gure 7. Scaled Pe
9. Scaled Pears
e is 0.89, 89%However, for
ddings. Therefohe job.
ormance of theences, the impcult than STS.in the SICK
nalysis. There
esults of STS, an converted ba
wn in the first b
earson Correlati
son Correlations
Figure
Modern
% higher than hthe SIF metho
ore, if the STS
e SICK datasetpact of negation. Moreover, thdataset. Furthfore, the SICK
and SICK dataack to Pearsonbin, while mos
ons-STS
s (STS, SICK)
e 11. Overall Sca
n Applied Scienc
33
human due to od, it gets betttasks are relate
t is relatively dn, determiners
his research’s ehermore, durinK scores are a
aset were the sn scored. The fst of the time i
aled Pearson’s R
Fi
ce
the existence ter scaled Peared to detecting
different. The Ss, and other graexperiments aing the experimffected in the
cores in Figurefigure shows tit was getting
Figure 8. Scaled
Ranked Systems
igure 10. Ranke
V
of one-word rson since it d
g dissimilar tex
SICK dataset inammatical elemim similarity, n
ment, this resea"contradiction
e 7, and Figurethat it is hard relatively goo
d Pearson Corre
s
d Scaled Pearso
Vol. 13, No. 10;
match (killed)depends on exit, then GSE or
nvolves difficuments. Therefonot relatednessarch excludedn" bin, as show
e 8 are convertfor systems tod results when
elations-SICK
on Correlation
2019
) and isting even
ulties ore, it s and stop
wn in
ted to o find n text

mas.ccsenet.org Modern Applied Science Vol. 13, No. 10; 2019
34
pairs are similar (bin number 3). This paper runs the previous experiment over the scaled Pearson ranks instead of scaled Pearson scores to assure that scores are not squandered during the conversation from Pearson to Fisher Z scores and vice versa. The paper report the rank of the scaled Pearson averaged over the four datasets, as shown in Figure 10. Scores were normalized between 0 and 1 to elevate proper comparison. The figure shows relatively similar behavior, as shown in Figure 9.
Figure 11 combines the scaled Pearson correlation in Figure 9 to one Pearson correlation figure per method. The scores in Figure 9 were first converted to z-scores, then they were averaged and converted back to Pearson correlation. Notably that all methods were getting relatively low scaled Pearson correlation, which indicates that the methods were not doing well in all cases as illustrated by Figure 7-9. Therefore, contrary to the previous scholars’ findings that such methods achieved high correlation as shown in Table 1 and Table 2, they still need improvement to provide more accurate results in medium similarity location for STS dataset and low similarity location for the SICK dataset. Moreover, although the WMD method was not getting high Pearson correlation, it gets relatively high scaled Pearson correlation, which implies that the method was doing well based on its underlining word embeddings. Consequently, the proposed metric is capable of detection of overestimating or underestimating of similarity in compared text pairs; therefore, scholars could replace performance metrics with the proposed scaled Pearson metric if they want a rank similarity method over cross-sectional datasets.
4.4 Extrinsic Evaluation
Although the scaled Pearson metric is giving interpretable results, it is essential to evaluate the Scaled Pearson metric when applied in the STS Sem-Eval context. Since the scaled Pearson has not been adopted, it is essential to borrow views of the metric from scholars. This section runs the System Usability Scale (SUS) questionnaire (Brooke, 1996) to quantify the usability of the proposed metric by input from 10 scholars from those who have experience in the STS domain. The SUS model provides a reliable tool for measuring the usability of products or services. It has a 10-item questionnaire with Likert responses scale. The SUS scores are calculated based on a simple formula: subtract one from the odd question answers, and subtract the value of the even question answers from 5. Then add up the total score and multiply it by 2.5. A result is a number on a scale of 1 – 100 (Lewis & Sauro, 2017), where 100 is excellent user experience, equivalent to an “A”; 68 is considered average (“C” grade). The author is aware that the extrinsic approach is not comprehensive and is limited due to many external factors; however, the goal of this experiment is to see if scholars are interested in adopting the proposed metric in their research. The proposed scaled Pearson and the SUS questionnaire was shared with the scholars over email with details on how to run the experiment. Table 3 shows the results of the SUS questionnaire.
Table 3. SUS Questionnaire for (Scaled Pearson correlation =system).
Qtn# Question Total
1 I think that I would like to use this system frequently. 40
2 I found the system unnecessarily complex. 24
3 I thought the system was easy to use. 38
4 I think that I would need the support of a technical person to be able to use this system. 18
5 I found the various functions in this system were well integrated. 33
6 I thought there was too much inconsistency in this system. 23
7 I would imagine that most people would learn to use this system very quickly. 40
8 I found the system very cumbersome to use. 19
9 I felt very confident using the system. 40
1
0
I needed to learn a lot of things before I could get going with this system.
40
Total (Even) 101
Total (Odd) 191
Average SUS 72.5

mas.ccsenet.org Modern Applied Science Vol. 13, No. 10; 2019
35
Table 4. Participants SUS scores.
Participant SUS Score
p1 72.5
p2 72.5
p3 65.0
p4 75.0
p5 70.0
p6 82.5
p7 72.5
p8 77.5
p9 72.5
p10 65.0
The Calculation of SUS figures was carried out using SUS guidelines (Lewis & Sauro, 2017). Therefore, Table 3 reports a score of 72.5 usability score, which is considered the “C+ Okay” acceptable model. The participants of SUS ratings, as shown in Table 4, shows that the scores of each participant are within the distribution with a standard deviation of 5.3. Therefore, the scaled Pearson was acceptable by scholars when compared to the traditional Pearson correlation. Although the SUS can work with a limited number of participants according to a study by Tullis and Thomas over usability models (Tullis & Stetson, 2004), this evaluation remains limited for a limited number of participants who did not see the proposed scaled Pearson metric in practice. Moreover, the proposed metric depends intensely on the similarity task under consideration.
5. Implications
On the overall, the semantic similarity method is dependent on the semantic task (Atoum, 2016, 2018; Ayyagari & Atoum, 2019) or the bins (categories) in our case. The interpretation of these findings is that a high Pearson correlation does not always indicate a top semantic similarity measure. Similarity methods that have low scaled Pearson correlation errors have high absolute errors and are either overestimating or underestimating the similarity between compared text pairs.
The implications from the previous findings draw attention to scholars to take into consideration the STS task under consideration and provide an enhanced system that matches the similarity task. Moreover, academic competitions may adopt a smarter way of comparing similarity methods aside from the traditional Pearson correlation. Although the number of bins was chosen arbitrarily to be three bins, there are other possibilities of the best number of bins that could be used to fine-tune the proposed metric which implies that the dataset designers should also take care of dataset distributions during data gathering. Although the proposed metric was used in the text-similarity domain, it could be used in any domain where variable correlation could be measured, such as image similarity.
While many datasets are similar, the proposed method was tested on single STS datasets. One implication of the new method is that it could affect various applications that depend on Pearson’s correlation alone. Moreover, the reliable of the proposed metric will finally depend on researchers who would like to adopt the new measure.
6. Conclusion
This paper proposes a new similarity performance evaluation metric, scaled Pearson correlation, which was borrowed from the finance domain. The proposed metric provides decision-making information about the compiled dataset that was not being implied by the Pearson correlation alone. The measure could be used to replace Pearson’s correlation when comparing text similarity measures over a cross-sectional benchmark dataset. The System Usability Score showed that the proposed metric is deemed applicable under dataset restrictions. In the future, the author will formalize the measure and apply it to other datasets and run other simulations to find the best number of bins.
References
Abdi, A., Idris, N., Alguliyev, R. M., & Aliguliyev, R. M. (2015). PDLK: Plagiarism detection using linguistic knowledge. Expert Systems with Applications, 42(22), 8936–8946. https://doi.org/10.1016/j.eswa.2015.07.048

mas.ccsenet.org Modern Applied Science Vol. 13, No. 10; 2019
36
Agirre, E., Cer, D., Diab, M., Gonzalez-Agirre, A., Cer, D., & Gonzalez-Agirre, A. (2012). Semeval-2012 task 6: A pilot on semantic textual similarity. Proceedings of the First Joint Conference on Lexical and Computational Semantics-Volume 1: Proceedings of the Main Conference and the Shared Task, and Volume 2: Proceedings of the Sixth International Workshop on Semantic Evaluation, (3), 385–393. Retrieved from http://dl.acm.org/citation.cfm?id=2387697
Anscombe, F. J. (1973). Graphs in Statistical Analysis. The American Statistician, 27(1), 17–21. https://doi.org/10.1080/00031305.1973.10478966
Arora, S., Liang, Y., & Ma, T. (2017). A Simple but Tough-to-Beat Baseline for Sentence Embeddings. International Conference on Learning Representations.
Atoum, I. (2016). Requirements Elicitation Approach for Cyber Security Systems. I-Manager’s Journal on Software Engineering, 10(3), 1–5. https://doi.org/10.26634/jse.10.3.4898
Atoum, I. (2018). A Novel Framework for Measuring Software Quality-in-use based on Semantic Similarity and Sentiment Analysis of Software Reviews. Journal of King Saud University - Computer and Information Sciences. https://doi.org/10.1016/j.jksuci.2018.04.012
Atoum, I. (2019). A Scalable Operational Framework for Requirements Validation Using Semantic and Functional Models. Proceedings of the 2nd International Conference on Software Engineering and Information Management, 1–6. https://doi.org/10.1145/3305160.3305166
Atoum, I., & Otoom, A. (2016). Efficient Hybrid Semantic Text Similarity using Wordnet and a Corpus. International Journal of Advanced Computer Science and Applications(IJACSA), Vol. 7, pp. 124–130. https://doi.org/10.14569/IJACSA.2016.070917
Atoum, I., Otoom, A., & Kulathuramaiyer, N. (2016). A Comprehensive Comparative Study of Word and Sentence Similarity Measures. International Journal of Computer Applications, Vol. 135, pp. 10–17. https://doi.org/10.5120/ijca2016908259
Ayyagari, M. R., & Atoum, I. (2019). Understanding Customer Voice of Project Portfolio Management Software. International Journal of Advanced Computer Science and Applications (IJACSA), 10(5), 51–56. https://doi.org/10.14569/IJACSA.2019.0100508
Bogolyubova, O., Panicheva, P., Tikhonov, R., Ivanov, V., & Ledovaya, Y. (2018). Dark personalities on Facebook: Harmful online behaviors and language. Computers in Human Behavior, 78, 151–159. https://doi.org/10.1016/j.chb.2017.09.032
Brooke, J. (1996). SUS-A quick and dirty usability scale. Usability Evaluation in Industry, 189(194), 4–7.
Cer, D. M., Diab, M. T., Agirre, E., Lopez-Gazpio, I., & Specia, L. (2017). SemEval-2017 Task 1: Semantic Textual Similarity - Multilingual and Cross-lingual Focused Evaluation. CoRR, abs/1708.0. https://doi.org/10.18653/v1/S17-2001
Cer, D., Yang, Y., Kong, S., Hua, N., Limtiaco, N., John, R. St., … Kurzweil, R. (2018). Universal Sentence Encoder. CoRR, abs/1803.1. https://doi.org/10.18653/v1/D18-2029
Conneau, A., Kiela, D., Schwenk, H., Barrault, L., & Bordes, A. (2017). Supervised Learning of Universal Sentence Representations from Natural Language Inference Data. Proceedings of the 2017 Conference on Empirical Methods in Natural Language Processing, 670–680. https://doi.org/10.18653/v1/D17-1070
Dikbaş, F. (2018). A New Two-Dimensional Rank Correlation Coefficient. Water Resources Management, 32(5), 1539–1553. https://doi.org/10.1007/s11269-017-1886-0
Fang, C., Mu, D., Deng, Z., & Wu, Z. (2017). Word-sentence co-ranking for automatic extractive text summarization. Expert Systems with Applications, 72, 189–195. https://doi.org/10.1016/j.eswa.2016.12.021
Fisher, R. A. (1921). On the probable error of a coefficient of correlation deduced from a small sample. Metron, 1, 3–32.
Goodman, L. A., & Kruskal, W. H. (1979). Measures of association for cross classifications. In Measures of association for cross classifications (pp. 2–34). Springer. https://doi.org/10.1007/978-1-4612-9995-0_1
Järvelin, K., & Kekäläinen, J. (2000). IR evaluation methods for retrieving highly relevant documents. Proceedings of the 23rd Annual International ACM SIGIR Conference on Research and Development in Information Retrieval, 41–48. https://doi.org/10.1145/345508.345545

mas.ccsenet.org Modern Applied Science Vol. 13, No. 10; 2019
37
Katerenchuk, D., & Rosenberg, A. (2018). RankDCG: Rank-Ordering Evaluation Measure. CoRR, abs/1803.0. Retrieved from http://arxiv.org/abs/1803.00719
Kekäläinen, J. (2005). Binary and graded relevance in IR evaluations—comparison of the effects on ranking of IR systems. Information Processing & Management, 41(5), 1019–1033. https://doi.org/10.1016/j.ipm.2005.01.004
Kendall, M. G. (1938). A new measure of rank correlation. Biometrika, 30(1/2), 81–93. https://doi.org/10.1093/biomet/30.1-2.81
Kendall, M., & Gibbons, J. D. (1990). Rank correlation methods edward arnold. A Division of Hodder & Stoughton, A Charles Griffin Title, London, 29–50.
Kusner, M., Sun, Y., Kolkin, N., & Weinberger, K. (2015). From word embeddings to document distances. International Conference on Machine Learning, 957–966.
Lee Rodgers, J., & Nicewander, W. A. (1988). Thirteen ways to look at the correlation coefficient. The American Statistician, 42(1), 59–66. https://doi.org/10.1080/00031305.1988.10475524
Lewis, J. J. R., & Sauro, J. (2017). Revisiting the factor structure of the System Usability Scale. Journal of Usability Studies, 12(4), 183–192.
Li, Y., McLean, D., Bandar, Z. A., O’Shea, J. D., & Crockett, K. (2006). Sentence similarity based on semantic nets and corpus statistics. IEEE Transactions on Knowledge and Data Engineering, 18(8), 1138–1150. https://doi.org/10.1109/TKDE.2006.130
Manku, G. S., Jain, A., & Das Sarma, A. (2007). Detecting Near-duplicates for Web Crawling. Proceedings of the 16th International Conference on World Wide Web, 141–150. https://doi.org/10.1145/1242572.1242592
Marelli, M., Menini, S., Baroni, M., Bentivogli, L., Bernardi, R., Zamparelli, R., & others. (2014). A SICK cure for the evaluation of compositional distributional semantic models. Proceedings of the Ninth International Conference on Language Resources and Evaluation ({LREC}-2014), 216–223. Retrieved from http://www.lrec-conf.org/proceedings/lrec2014/pdf/363_Paper.pdf
Meuschke, N., Siebeck, N., Schubotz, M., & Gipp, B. (2017). Analyzing Semantic Concept Patterns to Detect Academic Plagiarism. Proceedings of the 6th International Workshop on Mining Scientific Publications, 46–53. https://doi.org/10.1145/3127526.3127535
Moriya, N. (2008). Noise-Related Multivariate Optimal Joint-Analysis in Longitudinal Stochastic Processes. Progress in Applied Mathematical Modeling, 223–260.
Nikolić, D., Mureşan, R. C., Feng, W., & Singer, W. (2012). Scaled correlation analysis: A better way to compute a cross-correlogram. European Journal of Neuroscience, 35(5), 742–762. https://doi.org/10.1111/j.1460-9568.2011.07987.x
O’Shea, J., Bandar, Z., Crockett, K., & McLean, D. (2008). A Comparative Study of Two Short Text Semantic Similarity Measures. In N. Nguyen, G. Jo, R. Howlett, & L. Jain (Eds.), Agent and Multi-Agent Systems: Technologies and Applications (pp. 172–181). https://doi.org/10.1007/978-3-540-78582-8_18
Ratna, A. A. P., Luhurkinanti, D. L., Ibrahim, I., Husna, D., & Purnamasari, P. D. (2018). Automatic Essay Grading System for Japanese Language Examination Using Winnowing Algorithm. 2018 International Seminar on Application for Technology of Information and Communication, 565–569. https://doi.org/10.1109/ISEMANTIC.2018.8549789
Reimers, N., Beyer, P., & Gurevych, I. (2016). Task-Oriented Intrinsic Evaluation of Semantic Textual Similarity. Proceedings of COLING 2016, the 26th International Conference on Computational Linguistics: Technical Papers, 87–96. Retrieved from http://aclweb.org/anthology/C16-1009
Šarić, F., Glavaš, G., Karan, M., Šnajder, J., & Bašić, B. D. (2012). Takelab: Systems for Measuring Semantic Text Similarity. First Joint Conference on Lexical and Computational Semantics (*SEM), 441–448. Retrieved from http://dl.acm.org/citation.cfm?id=2387708
Serin, E. A. R., Nijveen, H., Hilhorst, H. W. M., & Ligterink, W. (2016). Learning from Co-expression Networks: Possibilities and Challenges. Frontiers in Plant Science, 7, 444. https://doi.org/10.3389/fpls.2016.00444
Smarandache, F. (2009). Alternatives to Pearson’s and Spearman’s correlation coefficients. International Journal of Statistics & EconomicsTM, 3(S09), 47–53.
mas.ccsenet.org Modern Applied Science Vol. 13, No. 10; 2019
38
Spearman, C. (1904). The proof and measurement of association between two things. The American Journal of Psychology, 15(1), 72–101. https://doi.org/10.2307/1412159
Tullis, T. S., & Stetson, J. N. (2004). A comparison of questionnaires for assessing website usability. Usability Professional Association Conference, 1.
Wang, Z., & Bovik, A. C. (2009). Mean squared error: Love it or leave it? A new look at signal fidelity measures. IEEE Signal Processing Magazine, 26(1), 98–117. https://doi.org/10.1109/MSP.2008.930649
Wilson, S., & Mihalcea, R. (2017). Measuring Semantic Relations between Human Activities. Proceedings of the Eighth International Joint Conference on Natural Language Processing (Volume 1: Long Papers), 664–673. Retrieved from http://aclweb.org/anthology/I17-1067
Wu, X., Pang, E., Lin, K., & Pei, Z.-M. (2013). Improving the Measurement of Semantic Similarity between Gene Ontology Terms and Gene Products: Insights from an Edge- and IC-Based Hybrid Method. PLoS ONE, 8(5), e66745. https://doi.org/10.1371/journal.pone.0066745
Zarif, L., Postel, M., Trevino, L., Riess, J. G., Valla, A., & Follana, R. (1994). Biodistribution and excretion of a mixed fluorocarbon-hydrocarbon “dowel” emulsion as determined by 19F nmr. Artificial Cells, Blood Substitutes, and Biotechnology, 22(4), 1193–1198. https://doi.org/10.3109/10731199409138815
Copyrights
Copyright for this article is retained by the author(s), with first publication rights granted to the journal.
This is an open-access article distributed under the terms and conditions of the Creative Commons Attribution license (http://creativecommons.org/licenses/by/4.0/).