scaling and scoring of the
TRANSCRIPT

Version 17: May 2017 Page 1 of 150
Pediatric Quality of Life Inventory™ (PedsQL™)
SCALING AND SCORING OF THE
PPeeddiiaattrriicc QQuuaalliittyy ooff LLiiffee IInnvveennttoorryy™™
PPeeddssQQLLTTMM
Mapi Research Trust 27 rue de la Villette 69003 Lyon France Phone: +33 (0) 4 72 13 66 66 Submit your request directly on our platform: https://eprovide.mapi-trust.org/
James W. Varni, Ph.D. Professor Emeritus Department of Pediatrics, College of Medicine Department of Landscape Architecture and Urban Planning College of Architecture 3137 TAMU College Station, Texas 77843-3137 USA Email: [email protected]

Version 17: May 2017 Page 2 of 150
Pediatric Quality of Life Inventory™ (PedsQL™)
PedsQL TM 4.0 Generic Core Scales ................................................................................................. 5
PARENT Report for Toddlers (ages 2-4) ........................................................................................ 5 CHILD and PARENT Reports for Young Children (ages 5-7), Children (ages 8-12), Teens (ages 13-18) ............................................................................................................................................... 7 YOUNG ADULT and PARENT Report for Young Adult (ages 18-25), ADULT and PARENT Report for Adult (ages over 26) ....................................................................................................... 9
PedsQL TM 4.0 SF15 Generic Core Scales ...................................................................................... 11 PARENT Report for Toddlers (ages 2-4), CHILD and PARENT Reports for Young Children (ages 5-7), Children (ages 8-12), Teens (ages 13-18), Young Adults (ages 18-25) and Adults (ages over 26) ................................................................................................................................. 11
PedsQL TM 3.0 Arthritis Module .................................................................................................... 14 PARENT Report for Toddlers (ages 2-4) ...................................................................................... 14 CHILD and PARENT Reports for Young Children (ages 5-7) ..................................................... 16 CHILD and PARENT Reports for Children (ages 8-12), Teens (ages 13-18) .............................. 18
PedsQL TM 3.0 Asthma Module ...................................................................................................... 20 PARENT Report for Toddlers (ages 2-4) ...................................................................................... 20 CHILD and PARENT Reports for Young Children (ages 5-7), Children (ages 8-12), Teens (ages 13-18) ............................................................................................................................................. 22
PedsQL TM 3.0 SF22 Asthma Module ............................................................................................ 24 PARENT Report for Toddlers (ages 2-4) ...................................................................................... 24 CHILD and PARENT Reports for Young Children (ages 5-7), Children (ages 8-12), Teens (ages 13-18) ............................................................................................................................................. 26
PedsQL TM Brain Tumor Module ................................................................................................... 28 PARENT Report for Toddlers (ages 2-4) ...................................................................................... 28 CHILD and PARENT Reports for Young Children (ages 5-7) ..................................................... 30 CHILD and PARENT Reports for Children (ages 8-12), Teens (ages 13-18) .............................. 32
PedsQL TM 3.0 Cancer Module ....................................................................................................... 34 PARENT Report for Toddlers (ages 2-4) ...................................................................................... 34 CHILD and PARENT Reports for Young Children (ages 5-7) ..................................................... 36 CHILD and PARENT Reports for Children (ages 8-12), Teens (ages 13-18), Young Adults (ages 18-25), and ADULT Report (ages over 26) ................................................................................... 38
PedsQL TM 3.0 Cardiac Module ...................................................................................................... 40 PARENT Report for Toddlers (ages 2-4) ...................................................................................... 40 CHILD and PARENT Reports for Young Children (ages 5-7) ..................................................... 42 CHILD and PARENT Reports for Children (ages 8-12), Teens (ages 13-18), Young Adults (ages 18-25), and Adults (ages over 26) .................................................................................................. 44
PedsQL TM 3.0 Cerebral Palsy Module .......................................................................................... 46 PARENT Report for Toddlers (ages 2-4) ...................................................................................... 46 CHILD and PARENT Reports for Young Children (ages 5-7), Children (ages 8-12), Teens (ages 13-18) ............................................................................................................................................. 48
PedsQL TM Cognitive Functioning Scale ........................................................................................ 50 PedsQL TM 3.0 Diabetes Module ..................................................................................................... 52 PedsQL TM 3.2 Diabetes Module ..................................................................................................... 54 PedsQL TM 3.0 Duchenne Muscular Dystrophy Module .............................................................. 55
PARENT Report for Young Children (ages 5-7)........................................................................... 57 CHILD and PARENT Reports for Children (ages 8-12) and Teens (ages 13-18) ........................ 59
PedsQL TM 3.0 End Stage Renal Disease Module ......................................................................... 61 PARENT Report for Toddlers (ages 2-4) ...................................................................................... 61

Version 17: May 2017 Page 3 of 150
Pediatric Quality of Life Inventory™ (PedsQL™)
CHILD and PARENT Reports for Young Children (ages 5-7), Children (ages 8-12), Teens (ages 13-18), and Young Adults (ages 18-25)......................................................................................... 63
PedsQL TM 3.0 Eosinophilic Esophagitis Module .......................................................................... 65 PARENT Report for Toddlers (ages 2-4) ...................................................................................... 65 CHILD and PARENT Reports for Young Children (ages 5-7) ..................................................... 67 CHILD and PARENT Reports for Children (ages 8-12) and Teens (ages 13-18) ........................ 70
PedsQL TM Eosinophilic Esophagitis Symptoms Scales ............................................................... 72 PARENT Report for Toddlers (ages 2-4) ...................................................................................... 72 PARENT Reports for Young Children (ages 5-7) ......................................................................... 74 CHILD and PARENT Reports for Children (ages 8-12) and Teens (ages 13-18) ........................ 76
PedsQL TM 3.0 Epilepsy Module ..................................................................................................... 78 PARENT Report for Toddlers (ages 2-4) ...................................................................................... 78 CHILD Reports for Young Children (ages 5-7) ............................................................................ 80 CHILD and PARENT Reports for Children (ages 5-7), Children (ages 8-12), Teens (ages 13-18), Young Adults (ages 18-25) ............................................................ Error! Bookmark not defined.
PedsQL TM 2.0 Family Impact Module ........................................................................................ 86 PARENT Report ............................................................................................................................ 87
PedsQL TM 3.0 Gastrointestinal Symptoms Module ..................................................................... 90 PARENT Report for Toddlers (ages 2-4) ...................................................................................... 90 CHILD and PARENT Report for Young Children (ages 5-7)....................................................... 93 CHILD and PARENT Reports for Children (ages 8-12), Teens (ages 13-18) and Young Adults (18-25) ............................................................................................................................................ 96
PedsQL TM 3.0 Gastrointestinal Symptoms Scales™ .................................................................... 99 PARENT Report for Toddlers (ages 2-4) ...................................................................................... 99
CHILD and PARENT Reports for Young Children (ages 5-7) ................................................... 101 CHILD and PARENT Reports for Children (ages 8-12), Teens (ages 13-18) and Young Adults (ages 18-25).................................................................................................................................. 103
PedsQL TM General Well-Being Scale .......................................................................................... 105 CHILD, ADOLESCENT and YOUNG ADULT Report (ages 8-25 years of age) ..................... 105
PedsQLTM Healthcare Satisfaction Generic Module .................................................................. 107 PedsQLTM Healthcare Satisfaction Hematology / Oncology Module ........................................ 109 PedsQL TM Infant Scales ............................................................................................................... 111
PARENT Report for Infants (ages 1-24 months)......................................................................... 111
PedsQL TM Multidimensional Fatigue Scale ................................................................................ 114 PedsQL TM 3.0 Neurofibromatosis Module ................................................................................. 116
CHILD and PARENT Reports for Young Children (ages 5-7), Children (ages 8-12), Teens (ages 13-18), Young Adults (ages 18-25), and Adults (ages over 26) .................................................. 116
PedsQL TM 3.0 Neuromuscular Module ....................................................................................... 119 PedsQL TM Oral Health Scale ....................................................................................................... 121 PedsQL TM Pediatric Pain Coping InventoryTM (PPCI) ............................................................. 123
PARENT Report for Children and Teens (ages 5-18), CHILD Report for Children (ages 5-12), Teens (ages 13-18) ....................................................................................................................... 123
PedsQL TM Pediatric Pain Questionnaire TM (PPQ) ................................................................... 125 PedsQL TM Present Functioning Visual Analogue Scale (PedsQL TM VAS) ............................ 127
CHILD and PARENT reports for CHILD (ages 5-18) ................................................................ 127
PedsQL TM 3.0 Rheumatology Module ......................................................................................... 129 PARENT Report for Toddlers (ages 2-4) .................................................................................... 129 CHILD and PARENT reports for Young Children (ages 5-7) .................................................... 131
CHILD and PARENT reports for Children (ages 8-12) and Teens (ages 13-18) ........................ 133

Version 17: May 2017 Page 4 of 150
Pediatric Quality of Life Inventory™ (PedsQL™)
PedsQL TM 3.0 Sickle Cell Disease Module .................................................................................. 135 PARENT Report for Toddlers (ages 2-4) .................................................................................... 135 CHILD and PARENT Reports for Young Children (ages 5-7) ................................................... 137 CHILD and PARENT Reports for Children (ages 8-12),Teens (ages 13-18), Young Adults (ages 18-25), and Adults (ages over 26) ................................................................................................ 139
PedsQL TM 1.0 Stem Cell Transplant Module ............................................................................. 141 PARENT Report for Toddlers (ages 2-4) .................................................................................... 141 PARENT Report for Young Children (ages 5-7)......................................................................... 143 CHILD and PARENT Reports for Children (ages 8-12) ............................................................. 145 TEEN and PARENT Reports for Teens (ages 13-18) ................................................................. 147
PedsQL TM 3.0 Transplant Module .............................................................................................. 149

PedsQL TM 4.0 Generic Core Scales
Version 17: May 2017 Page 5 of 150
PPeeddssQQLL TTMM 44..00 GGeenneerriicc CCoorree SSccaalleess
PARENT Report for Toddlers (ages 2-4)

PedsQL TM 4.0 Generic Core Scales
Version 17: May 2017 Page 6 of 150
The Parent Report for Toddlers (ages 2-4) of the PPeeddssQQLLTTMM 44..00 GGeenneerriicc CCoorree SSccaalleess is composed of 21 items comprising 4 dimensions. DESCRIPTION OF THE QUESTIONNAIRE:
Dimensions Number of Items
Cluster of Items
Reversed Scoring
Direction of Dimensions
Physical Functioning
8 1-8 1-8
Higher scores indicate better HRQOL.
Emotional Functioning
5 1-5 1-5
Social Functioning
5 1-5 1-5
School Functioning
3 1-3 1-3
SCORING OF DIMENSIONS:
Item Scaling 5-point Likert scale from 0 (Never) to 4 (Almost always) Weighting of Items No
Extension of the Scoring Scale
Scores are transformed on a scale from 0 to 100.
Scoring Procedure
Step 1: Transform Score Items are reversed scored and linearly transformed to a 0-100 scale as follows: 0=100, 1=75, 2=50, 3=25, 4=0.
Step 2: Calculate Scores Score by Dimensions: If more than 50% of the items in the scale are missing, the scale scores
should not be computed. Mean score = Sum of the items over the number of items answered. Psychosocial Health Summary Score = Sum of the items over the number of items answered in the Emotional, Social, and School Functioning Scales. Physical Health Summary Score = Physical Functioning Scale Score Total Score: Sum of all the items over the number of items answered on all the Scales.
Interpretation and Analysis of Missing Data
If more than 50% of the items in the scale are missing, the Scale Scores should not be computed. If 50% or more items are completed: Impute the mean of the completed items in a scale.

PedsQL TM 4.0 Generic Core Scales
Version 17: May 2017 Page 7 of 150
CHILD and PARENT Reports for Young Children (ages 5-7), Children (ages 8-12), Teens (ages 13-18)

PedsQL TM 4.0 Generic Core Scales
Version 17: May 2017 Page 8 of 150
The Child and Parent Reports of the PPeeddssQQLLTTMM 44..00 GGeenneerriicc CCoorree SSccaalleess for:
- Young Children (ages 5-7), - Children (ages 8-12), - And Teens (ages 13-18),
are composed of 23 items comprising 4 dimensions. DESCRIPTION OF THE QUESTIONNAIRE:
Dimensions Number of Items
Cluster of Items
Reversed scoring Direction of Dimensions
Physical Functioning
8 1-8 1-8
Higher scores indicate better HRQOL.
Emotional Functioning
5 1-5 1-5
Social Functioning
5 1-5 1-5
School Functioning
5 1-5 1-5
SCORING OF DIMENSIONS:
Item Scaling 5-point Likert scale from 0 (Never) to 4 (Almost always) 3-point scale: 0 (Not at all), 2 (Sometimes) and 4 (A lot) for the Young Child (ages 5-7) child report
Weighting of Items No
Extension of the Scoring Scale Scores are transformed on a scale from 0 to 100.
Scoring Procedure
Step 1: Transform Score Items are reversed scored and linearly transformed to a 0-100 scale as follows: 0=100, 1=75, 2=50, 3=25, 4=0. Step 2: Calculate Scores Score by Dimensions: If more than 50% of the items in the scale are missing, the scale scores
should not be computed, Mean score = Sum of the items over the number of items answered. Psychosocial Health Summary Score = Sum of the items over the number of items answered in the Emotional, Social, and School Functioning Scales. Physical Health Summary Score = Physical Functioning Scale Score Total Score: Sum of all the items over the number of items answered on all the Scales.
Interpretation and Analysis of Missing Data
If more than 50% of the items in the scale are missing, the Scale Scores should not be computed. If 50% or more items are completed: Impute the mean of the completed items in a scale.
PedsQL TM 4.0 Generic Core Scales
Version 17: May 2017 Page 9 of 150
YOUNG ADULT and PARENT Report for Young Adult (ages 18-25),
ADULT and PARENT Report for Adult (ages over 26)

PedsQL TM 4.0 Generic Core Scales
Version 17: May 2017 Page 10 of 150
The Parent, Young Adult and Adult Reports of the PPeeddssQQLLTTMM 44..00 GGeenneerriicc CCoorree SSccaalleess for:
- Young Adults (ages 18-25), - Adults (ages over 26),
are composed of 23 items comprising 4 dimensions. DESCRIPTION OF THE QUESTIONNAIRE:
Dimensions Number of Items
Cluster of Items
Reversed scoring Direction of Dimensions
Physical Functioning
8 1-8 1-8
Higher scores indicate better HRQOL.
Emotional Functioning
5 1-5 1-5
Social Functioning
5 1-5 1-5
School Functioning
5 1-5 1-5
SCORING OF DIMENSIONS:
Item Scaling 5-point Likert scale from 0 (Never) to 4 (Almost always) Weighting of Items No
Extension of the Scoring Scale Scores are transformed on a scale from 0 to 100.
Scoring Procedure
Step 1: Transform Score Items are reversed scored and linearly transformed to a 0-100 scale as follows: 0=100, 1=75, 2=50, 3=25, 4=0. Step 2: Calculate Scores Score by Dimensions: If more than 50% of the items in the scale are missing, the scale scores
should not be computed, Mean score = Sum of the items over the number of items answered. Psychosocial Health Summary Score = Sum of the items over the number of items answered in the Emotional, Social, and School Functioning Scales. Physical Health Summary Score = Physical Functioning Scale Score Total Score: Sum of all the items over the number of items answered on all the Scales.
Interpretation and Analysis of Missing Data
If more than 50% of the items in the scale are missing, the Scale Scores should not be computed. If 50% or more items are completed: Impute the mean of the completed items in a scale.

PedsQL TM 4.0 SF15 Generic Core Scales
Version 17: May 2017 Page 11 of 150
PPeeddssQQLL TTMM 44..00 SSFF1155 GGeenneerriicc CCoorree SSccaalleess
PARENT Report for Toddlers (ages 2-4), CHILD and PARENT Reports for Young Children (ages 5-7),
Children (ages 8-12), Teens (ages 13-18), Young Adults (ages 18-25) and Adults (ages over 26)

PedsQL TM 4.0 SF15 Generic Core Scales
Version 17: May 2017 Page 12 of 150
The Child and Parent Reports of the PPeeddssQQLLTTMM 44..00 SSFF1155 GGeenneerriicc CCoorree SSccaalleess for - Toddlers (ages 2-4), - Young Children (ages 5-7) - Children (ages 8-12), - Teens (ages 13-18), - Young Adults (ages 18-25), - And Adults (ages over 26)
are composed of 15 items comprising 4 dimensions. DESCRIPTION OF THE SF15 QUESTIONNAIRE:
Dimensions Number of Items
Cluster of Items
Reversed Scoring
Direction of Dimensions
Physical Functioning
5 1-5 1-5
Higher scores indicate better HRQOL.
Emotional Functioning
4 1-4 1-4
Social Functioning
3 1-3 1-3
School Functioning
3 1-3 1-3
SCORING OF DIMENSIONS:
Item Scaling 5-point Likert scale from 0 (Never) to 4 (Almost always) 3-point scales: 0 (Not at all), 2 (Sometimes) and 4 (A lot) for the Young Child self-report
Weighting of Items No
Extension of the Scoring Scale
Scores are transformed on a scale from 0 to 100.
Scoring Procedure
Step 1: Transform Score Items are reversed scored and linearly transformed to a 0-100 scale as follows: 0=100, 1=75, 2=50, 3=25, 4=0.
Step 2: Calculate Scores Score by Dimensions: If more than 50% of the items in the scale are missing, the scale scores
should not be computed, Mean score = Sum of the items over the number of items answered. Psychosocial Health Summary Score = Sum of the items over the number of items answered in the Emotional, Social, and School Functioning Scales. Physical Health Summary Score = Physical Functioning Scale Score

PedsQL TM 4.0 SF15 Generic Core Scales
Version 17: May 2017 Page 13 of 150
Total Score: Sum of all the items over the number of items answered on all the Scales.
Interpretation and Analysis of Missing Data
If more than 50% of the items in the scale are missing, the Scale Scores should not be computed. If 50% or more items are completed: Impute the mean of the completed items in a scale.

PedsQL TM 3.0 Arthritis Module
Version 17: May 2017 Page 14 of 150
PPeeddssQQLL TTMM 33..00 AArrtthhrriittiiss MMoodduullee
PARENT Report for Toddlers (ages 2-4)
PedsQL TM 3.0 Arthritis Module
Version 17: May 2017 Page 15 of 150
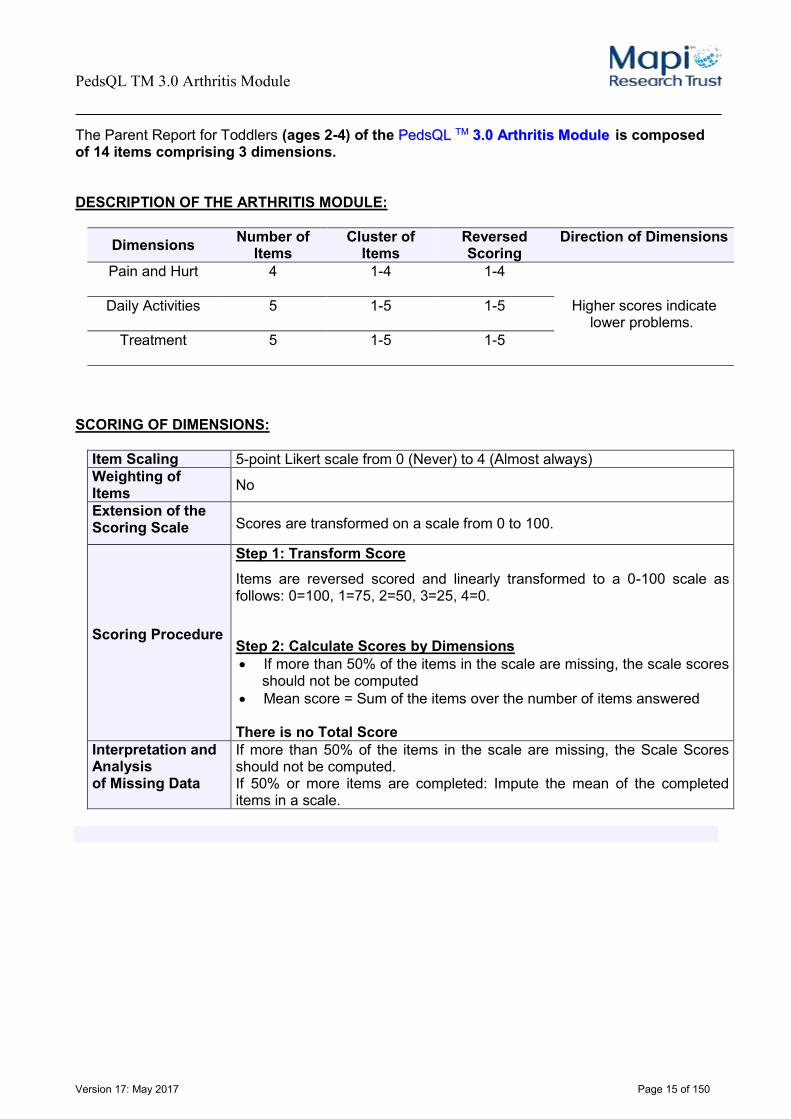
The Parent Report for Toddlers (ages 2-4) of the PPeeddssQQLL TTMM 33..00 AArrtthhrriittiiss MMoodduullee is composed of 14 items comprising 3 dimensions. DESCRIPTION OF THE ARTHRITIS MODULE:
Dimensions Number of Items
Cluster of Items
Reversed Scoring
Direction of Dimensions
Pain and Hurt 4 1-4 1-4
Higher scores indicate lower problems.
Daily Activities 5 1-5 1-5
Treatment 5 1-5 1-5
SCORING OF DIMENSIONS:
Item Scaling 5-point Likert scale from 0 (Never) to 4 (Almost always) Weighting of Items No
Extension of the Scoring Scale Scores are transformed on a scale from 0 to 100.
Scoring Procedure
Step 1: Transform Score Items are reversed scored and linearly transformed to a 0-100 scale as follows: 0=100, 1=75, 2=50, 3=25, 4=0. Step 2: Calculate Scores by Dimensions If more than 50% of the items in the scale are missing, the scale scores
should not be computed Mean score = Sum of the items over the number of items answered There is no Total Score
Interpretation and Analysis of Missing Data
If more than 50% of the items in the scale are missing, the Scale Scores should not be computed. If 50% or more items are completed: Impute the mean of the completed items in a scale.

PedsQL TM 3.0 Arthritis Module
Version 17: May 2017 Page 16 of 150
CHILD and PARENT Reports for Young Children (ages 5-7)

PedsQL TM 3.0 Arthritis Module
Version 17: May 2017 Page 17 of 150
The Child and Parent Reports of the PPeeddssQQLL TTMM 33..00 AArrtthhrriittiiss MMoodduullee for Young Children (ages 5-7) are composed of 20 items comprising 5 dimensions. DESCRIPTION OF THE ARTHRITIS MODULE:
Dimensions Number of Items
Cluster of Items
Reversed Scoring
Direction of Dimensions
Pain and Hurt 4 1-4 1-4
Higher scores indicate lower problems.
Daily Activities 5 1-5 1-5
Treatment 5 1-5 1-5
Worry 3 1-3 1-3
Communication 3 1-3 1-3
SCORING OF DIMENSIONS:
Item Scaling 5-point Likert scale from 0 (Never) to 4 (Almost always) for the parent report 3-point scale: 0 (Not at all), 2 (Sometimes) and 4 (A lot) for the child report
Weighting of Items No
Extension of the Scoring Scale Scores are transformed on a scale from 0 to 100.
Scoring Procedure
Step 1: Transform Score Items are reversed scored and linearly transformed to a 0-100 scale as follows: 0=100, 1=75, 2=50, 3=25, 4=0. Step 2: Calculate Scores by Dimensions If more than 50% of the items in the scale are missing, the scale scores
should not be computed, Mean score = Sum of the items over the number of items answered. There is no Total Score
Interpretation and Analysis of Missing Data
If more than 50% of the items in the scale are missing, the Scale Scores should not be computed. If 50% or more items are completed: Impute the mean of the completed items in a scale.

PedsQL TM 3.0 Arthritis Module
Version 17: May 2017 Page 18 of 150
CHILD and PARENT Reports for Children (ages 8-12), Teens (ages 13-18)

PedsQL TM 3.0 Arthritis Module
Version 17: May 2017 Page 19 of 150
The Child and Parent Reports of the PPeeddssQQLL TTMM 33..00 AArrtthhrriittiiss MMoodduullee for: - Children (ages 8-12), - And Teens (ages 13-18),
are composed of 22 items comprising 5 dimensions. DESCRIPTION OF THE ARTHRITIS MODULE:
Dimensions Number of Items
Cluster of Items
Reversed Scoring
Direction of Dimensions
Pain and Hurt 4 1-4 1-4
Higher scores indicate lower problems.
Daily Activities 5 1-5 1-5
Treatment 7 1-7 1-7
Worry 3 1-3 1-3
Communication 3 1-3 1-3
SCORING OF DIMENSIONS:
Item Scaling 5-point Likert scale from 0 (Never) to 4 (Almost always) Weighting of Items No
Extension of the Scoring Scale Scores are transformed on a scale from 0 to 100.
Scoring Procedure
Step 1: Transform Score Items are reversed scored and linearly transformed to a 0-100 scale as follows: 0=100, 1=75, 2=50, 3=25, 4=0. Step 2: Calculate Scores by Dimensions If more than 50% of the items in the scale are missing, the scale scores
should not be computed, Mean score = Sum of the items over the number of items answered. There is no Total Score
Interpretation and Analysis of missing data
If more than 50% of the items in the scale are missing, the Scale Scores should not be computed. If 50% or more items are completed: Impute the mean of the completed items in a scale.

PedsQL TM 3.0 Asthma Module
Version 17: May 2017 Page 20 of 150
PPeeddssQQLL TTMM 33..00 AAsstthhmmaa MMoodduullee
PARENT Report for Toddlers (ages 2-4)

PedsQL TM 3.0 Asthma Module
Version 17: May 2017 Page 21 of 150
The Parent Report for Toddlers (ages 2-4) of the PPeeddssQQLL TTMM 33..00 AAsstthhmmaa MMoodduullee is composed of 26 items comprising 4 dimensions. DESCRIPTION OF THE ASTHMA MODULE:
Dimensions Number of Items
Cluster of Items
Reversed Scoring
Direction of Dimensions
Asthma 11 1-11 1-11
Higher scores indicate lower problems.
Treatment 9 1-9 1-9
Worry 3 1-3 1-3
Communication 3 1-3 1-3
SCORING OF DIMENSIONS:
Item Scaling 5-point Likert scale from 0 (Never) to 4 (Almost always) Weighting of Items No
Extension of the Scoring Scale Scores are transformed on a scale from 0 to 100.
Scoring Procedure
Step 1: Transform Score Items are reversed scored and linearly transformed to a 0-100 scale as follows: 0=100, 1=75, 2=50, 3=25, 4=0. Step 2: Calculate Scores by Dimensions If more than 50% of the items in the scale are missing, the scale scores
should not be computed, Mean score = Sum of the items over the number of items answered. There is no Total Score
Interpretation and Analysis of Missing Data
If more than 50% of the items in the scale are missing, the Scale Scores should not be computed. If 50% or more items are completed: Impute the mean of the completed items in a scale.

PedsQL TM 3.0 Asthma Module
Version 17: May 2017 Page 22 of 150
CHILD and PARENT Reports for Young Children (ages 5-7), Children (ages 8-12), Teens (ages 13-18)

PedsQL TM 3.0 Asthma Module
Version 17: May 2017 Page 23 of 150
The Child and Parent Reports of the PPeeddssQQLL TTMM 33..00 AAsstthhmmaa MMoodduullee for: - Young Children (ages 5-7), - Children (ages 8-12), - And Teens (ages 13-18),
are composed of 28 items comprising 4 dimensions. DESCRIPTION OF THE ASTHMA MODULE:
Dimensions Number of Items
Cluster of Items
Reversed Scoring
Direction of Dimensions
Asthma 11 1-11 1-11
Higher scores indicate lower problems.
Treatment 11 1-11 1-11
Worry 3 1-3 1-3
Communication 3 1-3 1-3
SCORING OF DIMENSIONS:
Item Scaling 5-point Likert scale from 0 (Never) to 4 (Almost always) 3-point scale: 0 (Not at all), 2 (Sometimes) and 4 (A lot) for the child report for Young Children (ages 5-7)
Weighting of Items No
Extension of the Scoring Scale Scores are transformed on a scale from 0 to 100.
Scoring Procedure
Step 1: Transform Score Items are reversed scored and linearly transformed to a 0-100 scale as follows: 0=100, 1=75, 2=50, 3=25, 4=0. Step 2: Calculate Scores by Dimensions If more than 50% of the items in the scale are missing, the scale scores
should not be computed, Mean score = Sum of the items over the number of items answered. There is no Total Score
Interpretation and Analysis of Missing Data
If more than 50% of the items in the scale are missing, the Scale Scores should not be computed. If 50% or more items are completed: Impute the mean of the completed items in a scale.

PedsQL TM 3.0 SF22 Asthma Module
Version 17: May 2017 Page 24 of 150
PPeeddssQQLL TTMM 33..00 SSFF2222 AAsstthhmmaa MMoodduullee
PARENT Report for Toddlers (ages 2-4)

PedsQL TM 3.0 SF22 Asthma Module
Version 17: May 2017 Page 25 of 150
The Parent Report for Toddlers (ages 2-4) of the PPeeddssQQLL TTMM 33..00 SSFF2222 AAsstthhmmaa MMoodduullee is composed of 20 items comprising 2 dimensions. DESCRIPTION OF THE SF22 ASTHMA MODULE:
Dimensions Number of Items
Cluster of Items
Reversed Scoring
Direction of Dimensions
Asthma 11 1-11 1-11 Higher scores indicate
lower problems. Treatment 9 1-9 1-9
SCORING OF DIMENSIONS:
Item Scaling 5-point Likert scale from 0 (Never) to 4 (Almost always) Weighting of Items No
Extension of the Scoring Scale Scores are transformed on a scale from 0 to 100.
Scoring Procedure
Step 1: Transform Score Items are reversed scored and linearly transformed to a 0-100 scale as follows: 0=100, 1=75, 2=50, 3=25, 4=0. Step 2: Calculate Scores by Dimensions If more than 50% of the items in the scale are missing, the scale scores
should not be computed, Mean score = Sum of the items over the number of items answered. There is no Total Score
Interpretation and Analysis of Missing Data
If more than 50% of the items in the scale are missing, the Scale Scores should not be computed. If 50% or more items are completed: Impute the mean of the completed items in a scale.

PedsQL TM 3.0 SF22 Asthma Module
Version 17: May 2017 Page 26 of 150
CHILD and PARENT Reports for Young Children (ages 5-7), Children (ages 8-12), Teens (ages 13-18)

PedsQL TM 3.0 SF22 Asthma Module
Version 17: May 2017 Page 27 of 150
The Child and Parent Reports of the PPeeddssQQLLTTMM 33..00 SSFF2222 AAsstthhmmaa MMoodduullee for: - Young Children (ages 5-7), - Children (ages 8-12), - And Teens (ages 13-18)
are composed of 22 items comprising 2 dimensions. DESCRIPTION OF THE SF22 ASTHMA MODULE:
Dimensions Number of Items
Cluster of Items
Reversed Scoring
Direction of Dimensions
Asthma 11 1-11 1-11 Higher scores indicate
lower problems. Treatment 11 1-11 1-11
SCORING OF DIMENSIONS:
Item Scaling 5-point Likert scale from 0 (Never) to 4 (Almost always) 3-point scale: 0 (Not at all), 2 (Sometimes) and 4 (A lot) for the Child R Report for Young Children (ages 5-7)
Weighting of Items No
Extension of the Scoring Scale Scores are transformed on a scale from 0 to 100.
Scoring Procedure
Step 1: Transform Score Items are reversed scored and linearly transformed to a 0-100 scale as follows: 0=100, 1=75, 2=50, 3=25, 4=0. Step 2: Calculate Scores by Dimensions If more than 50% of the items in the scale are missing, the scale scores
should not be computed, Mean score = Sum of the items over the number of items answered. There is no Total Score
Interpretation and Analysis of Missing Data
If more than 50% of the items in the scale are missing, the Scale Scores should not be computed. If 50% or more items are completed: Impute the mean of the completed items in a scale.

PedsQL TM Brain Tumor Module
Version 17: May 2017 Page 28 of 150
PPeeddssQQLL TTMM BBrraaiinn TTuummoorr MMoodduullee
PARENT Report for Toddlers (ages 2-4)

PedsQL TM Brain Tumor Module
Version 17: May 2017 Page 29 of 150
The Parent Report for Toddlers (ages 2-4) of the PPeeddssQQLLTTMM BBrraaiinn TTuummoorr MMoodduullee is composed of 17 items comprising 5 dimensions. DESCRIPTION OF THE BRAIN TUMOR MODULE:
Dimensions Number of Items
Cluster of Items
Reversed Scoring
Direction of Dimensions
Pain and Hurt 3 1-3 1-3
Higher scores indicate lower problems.
Movement and Balance
3 1-3 1-3
Procedural Anxiety
3 1-3 1-3
Nausea 5 1-5 1-5
Worry 3 1-3 1-3
SCORING OF DIMENSIONS:
Item Scaling 5-point Likert scale from 0 (Never a problem) to 4 (Almost always a problem)
Weighting of Items No
Extension of the Scoring Scale Scores are transformed on a scale from 0 to 100.
Scoring Procedure
Step 1: Transform Score Items are reversed scored and linearly transformed to a 0-100 scale as follows: 0=100, 1=75, 2=50, 3=25, 4=0. Step 2: Calculate Scores by Dimensions If more than 50% of the items in the scale are missing, the scale scores
should not be computed, Mean score = Sum of the items over the number of items answered. There is no Total Score
Interpretation and Analysis of Missing Data
If more than 50% of the items in the scale are missing, the Scale Scores should not be computed. If 50% or more items are completed: Impute the mean of the completed items in a scale.

PedsQL TM Brain Tumor Module
Version 17: May 2017 Page 30 of 150
CHILD and PARENT Reports for Young Children (ages 5-7)
PedsQL TM Brain Tumor Module
Version 17: May 2017 Page 31 of 150
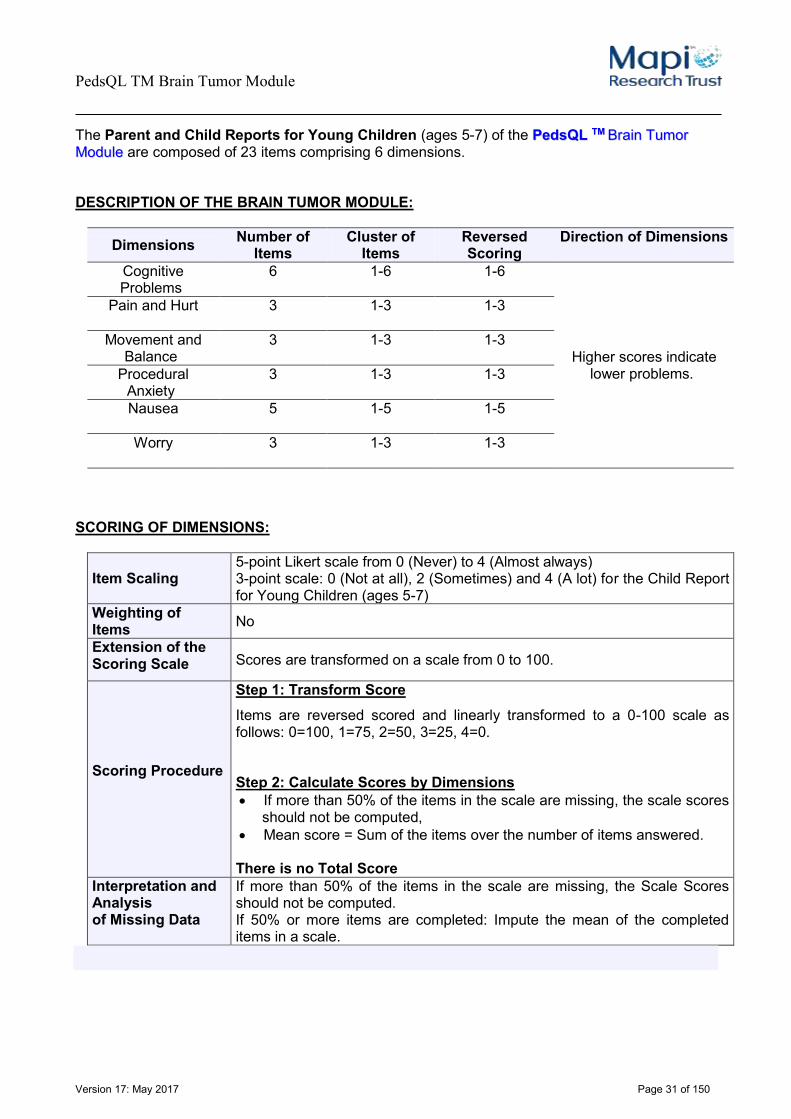
The Parent and Child Reports for Young Children (ages 5-7) of the PPeeddssQQLL TTMM BBrraaiinn TTuummoorr MMoodduullee are composed of 23 items comprising 6 dimensions. DESCRIPTION OF THE BRAIN TUMOR MODULE:
Dimensions Number of Items
Cluster of Items
Reversed Scoring
Direction of Dimensions
Cognitive Problems
6 1-6 1-6
Higher scores indicate lower problems.
Pain and Hurt 3 1-3 1-3
Movement and Balance
3 1-3 1-3
Procedural Anxiety
3 1-3 1-3
Nausea 5 1-5 1-5
Worry 3 1-3 1-3
SCORING OF DIMENSIONS:
Item Scaling 5-point Likert scale from 0 (Never) to 4 (Almost always) 3-point scale: 0 (Not at all), 2 (Sometimes) and 4 (A lot) for the Child Report for Young Children (ages 5-7)
Weighting of Items No
Extension of the Scoring Scale Scores are transformed on a scale from 0 to 100.
Scoring Procedure
Step 1: Transform Score Items are reversed scored and linearly transformed to a 0-100 scale as follows: 0=100, 1=75, 2=50, 3=25, 4=0. Step 2: Calculate Scores by Dimensions If more than 50% of the items in the scale are missing, the scale scores
should not be computed, Mean score = Sum of the items over the number of items answered. There is no Total Score
Interpretation and Analysis of Missing Data
If more than 50% of the items in the scale are missing, the Scale Scores should not be computed. If 50% or more items are completed: Impute the mean of the completed items in a scale.

PedsQL TM Brain Tumor Module
Version 17: May 2017 Page 32 of 150
CHILD and PARENT Reports for Children (ages 8-12), Teens (ages 13-18)

PedsQL TM Brain Tumor Module
Version 17: May 2017 Page 33 of 150
The Parent and Child Reports for Children (ages 8-12) and Teens (ages 13-18) of the PPeeddssQQLLTTMM BBrraaiinn TTuummoorr MMoodduullee are composed of 24 items comprising 6 dimensions. DESCRIPTION OF THE BRAIN TUMOR MODULE:
Dimensions Number of Items
Cluster of Items
Reversed Scoring
Direction of Dimensions
Cognitive Problems
7 1-7 1-7
Higher scores indicate lower problems
Pain and Hurt 3 1-3 1-3
Movement and Balance
3 1-3 1-3
Procedural Anxiety
3 1-3 1-3
Nausea 5 1-5 1-5
Worry 3 1-3 1-3
SCORING OF DIMENSIONS:
Item Scaling 5-point Likert scale from 0 (Never a problem) to 4 (Almost always a problem)
Weighting of Items No
Extension of the Scoring Scale Scores are transformed on a scale from 0 to 100.
Scoring Procedure
Step 1: Transform Score Items are reversed scored and linearly transformed to a 0-100 scale as follows: 0=100, 1=75, 2=50, 3=25, 4=0. Step 2: Calculate Scores by Dimensions If more than 50% of the items in the scale are missing, the scale scores
should not be computed, Mean score = Sum of the items over the number of items answered. There is no Total Score
Interpretation and Analysis of Missing Data
If more than 50% of the items in the scale are missing, the Scale Scores should not be computed. If 50% or more items are completed: Impute the mean of the completed items in a scale.

PedsQL TM 3.0 Cancer Module
Version 17: May 2017 Page 34 of 150
PPeeddssQQLL TTMM 33..00 CCaanncceerr MMoodduullee
PARENT Report for Toddlers (ages 2-4)

PedsQL TM 3.0 Cancer Module
Version 17: May 2017 Page 35 of 150
The Parent Report for Toddlers (ages 2-4) of the PPeeddssQQLLTTMM 33..00 CCaanncceerr MMoodduullee is composed of 25 items comprising 8 dimensions. DESCRIPTION OF THE CANCER MODULE:
Dimensions Number of Items
Cluster of Items
Reversed Scoring
Direction of Dimensions
Pain and Hurt 2 1-2 1-2
Higher scores indicate lower problems.
Nausea 5 1-5 1-5
Procedural Anxiety
3 1-3 1-3
Treatment Anxiety 3 1-3 1-3
Worry 3 1-3 1-3
Cognitive Problems
3 1-3 1-3
Perceived Physical
Appearance
3 1-3 1-3
Communication 3 1-3 1-3
SCORING OF DIMENSIONS:
Item Scaling 5-point Likert scale from 0 (Never) to 4 (Almost always) Weighting of Items No
Extension of the Scoring Scale
Scores are transformed to a 0 to 100 scale.
Scoring Procedure
Step 1: Transform Score
Items are reversed scored and linearly transformed to a 0-100 scale as follows: 0=100, 1=75, 2=50, 3=25, 4=0. Step 2: Calculate Scores by Dimensions If more than 50% of the items in the scale are missing, the scale scores
should not be computed, Mean score = Sum of the items over the number of items answered.
Total Score: Sum of all the items over the number of items answered on all the Scales.
Interpretation and Analysis of Missing Data
If more than 50% of the items in the scale are missing, the Scale Scores should not be computed. If 50% or more items are completed: Impute the mean of the completed items in a scale.

PedsQL TM 3.0 Cancer Module
Version 17: May 2017 Page 36 of 150
CHILD and PARENT Reports for Young Children (ages 5-7)

PedsQL TM 3.0 Cancer Module
Version 17: May 2017 Page 37 of 150
The Child and Parent Reports of the PPeeddssQQLLTTMM 33..00 CCaanncceerr MMoodduullee for Young Children (ages 5-7), are composed of 26 items comprising 8 dimensions. DESCRIPTION OF THE CANCER MODULE:
Dimensions Number of Items
Cluster of Items
Reversed Scoring
Direction of Dimensions
Pain and Hurt 2 1-2 1-2
Higher scores indicate lower problems.
Nausea 5 1-5 1-5
Procedural Anxiety
3 1-3 1-3
Treatment Anxiety 3 1-3 1-3
Worry 3 1-3 1-3
Cognitive Problems
4 1-4 1-4
Perceived Physical
Appearance
3 1-3 1-3
Communication 3 1-3 1-3
SCORING OF DIMENSIONS:
Item Scaling 5-point Likert scale from 0 (Never) to 4 (Almost always) 3-point scale: 0 (Not at all), 2 (Sometimes) and 4 (A lot) for the Child Report for Young Children (ages 5-7)
Weighting of Items No
Extension of the Scoring Scale Scores are transformed on a scale from 0 to 100.
Scoring Procedure
Step 1: Transform Score
Items are reversed scored and linearly transformed to a 0-100 scale as follows: 0=100, 1=75, 2=50, 3=25, 4=0. Step 2: Calculate Scores by Dimensions If more than 50% of the items in the scale are missing, the scale scores
should not be computed, Mean score = Sum of the items over the number of items answered.
Total Score: Sum of all the items over the number of items answered on all the Scales.
Interpretation and Analysis of Missing Data
If more than 50% of the items in the scale are missing, the Scale Scores should not be computed. If 50% or more items are completed: Impute the mean of the completed items in a scale.

PedsQL TM 3.0 Cancer Module
Version 17: May 2017 Page 38 of 150
CHILD and PARENT Reports for Children (ages 8-12), Teens (ages 13-18), Young Adults (ages 18-25), and ADULT Report
(ages over 26)

PedsQL TM 3.0 Cancer Module
Version 17: May 2017 Page 39 of 150
The Child and Parent Reports of the PPeeddssQQLL TTMM 33..00 CCaanncceerr MMoodduullee for: - Children (ages 8-12), - Teens (ages 13-18), - Young Adults (ages 18-25),
and the Adult Report (ages over 26) are composed of 27 items comprising 8 dimensions. DESCRIPTION OF THE CANCER MODULE:
Dimensions Number of Items
Cluster of Items
Reversed Scoring
Direction of Dimensions
Pain and Hurt 2 1-2 1-2
Higher scores indicate lower problems.
Nausea 5 1-5 1-5
Procedural Anxiety
3 1-3 1-3
Treatment Anxiety 3 1-3 1-3
Worry 3 1-3 1-3
Cognitive Problems
5 1-5 1-5
Perceived Physical
Appearance
3 1-3 1-3
Communication 3 1-3 1-3
SCORING OF DIMENSIONS:
Item Scaling 5-point Likert scale from 0 (Never) to 4 (Almost always) 3-point scale: 0 (Not at all), 2 (Sometimes) and 4 (A lot) for the Child Report for Young Children (ages 5-7)
Weighting of Items No
Extension of the Scoring Scale Scores are transformed on a scale from 0 to 100.
Scoring Procedure
Step 1: Transform Score
Items are reversed scored and linearly transformed to a 0-100 scale as follows: 0=100, 1=75, 2=50, 3=25, 4=0. Step 2: Calculate Scores by Dimensions If more than 50% of the items in the scale are missing, the scale scores
should not be computed, Mean score = Sum of the items over the number of items answered.
Total Score: Sum of all the items over the number of items answered on all the Scales.
Interpretation and Analysis of Missing Data
If more than 50% of the items in the scale are missing, the Scale Scores should not be computed. If 50% or more items are completed: Impute the mean of the completed items in a scale.

PedsQL TM 3.0 Cardiac Module
Version 17: May 2017 Page 40 of 150
PPeeddssQQLL TTMM 33..00 CCaarrddiiaacc MMoodduullee
PARENT Report for Toddlers (ages 2-4)

PedsQL TM 3.0 Cardiac Module
Version 17: May 2017 Page 41 of 150
The Parent Report for Toddlers (age 2-4) of the PPeeddssQQLLTTMM 33..00 CCaarrddiiaacc MMoodduullee is composed of 23 items comprising 6 dimensions. DESCRIPTION OF THE CARDIAC MODULE:
Dimensions Number of Items
Cluster of Items
Reversed Scoring
Direction of Dimensions
Heart problems and Treatment
7 1-7 1-7
Higher scores indicate lower problems.
Treatment II 3 1-3 1-3
Perceived Physical
Appearance
3 1-3 1-3
Treatment Anxiety 4 1-4 1-4
Cognitive Problems
3 1-3 1-3
Communication 3 1-3 1-3
SCORING OF DIMENSIONS:
Item Scaling 5-point Likert scale from 0 (Never) to 4 (Almost always) Weighting of Items No
Extension of the Scoring Scale Scores are transformed to a 0 to 100 scale.
Scoring Procedure
Step 1: Transform Score
Items are reversed scored and linearly transformed to a 0-100 scale as follows: 0=100, 1=75, 2=50, 3=25, 4=0. Step 2: Calculate scores by Dimensions If more than 50% of the items in the scale are missing, the scale scores
should not be computed, Mean score = Sum of the items over the number of items answered.
There is no Total Score.
Interpretation and Analysis of Missing Data
If more than 50% of the items in the scale are missing, the Scale Scores should not be computed. If 50% or more items are completed: Impute the mean of the completed items in a scale.

PedsQL TM 3.0 Cardiac Module
Version 17: May 2017 Page 42 of 150
CHILD and PARENT Reports for Young Children (ages 5-7)

PedsQL TM 3.0 Cardiac Module
Version 17: May 2017 Page 43 of 150
The Child and Parent Reports of the PPeeddssQQLLTTMM 33..00 CCaarrddiiaacc MMoodduullee for Young Children (ages 5-7) are composed of 25 items comprising 6 dimensions. DESCRIPTION OF THE CARDIAC MODULE:
Dimensions Number of Items
Cluster of Items
Reversed Scoring
Direction of Dimensions
Heart Problems and Treatment
7 1-7 1-7
Higher scores indicate lower problems.
Treatment II 3 1-3 1-3
Perceived Physical
Appearance
3 1-3 1-3
Treatment Anxiety 4 1-4 1-4
Cognitive Problems
5 1-5 1-5
Communication 3 1-3 1-3
SCORING OF DIMENSIONS:
Item Scaling 5-point Likert scale from 0 (Never) to 4 (Almost always) 3-point scale: 0 (Not at all), 2 (Sometimes) and 4 (A lot) for the Child Report for Young Children (ages 5-7)
Weighting of Items No
Extension of the Scoring Scale Scores are transformed on a scale from 0 to 100.
Scoring Procedure
Step 1: Transform Score
Items are reversed scored and linearly transformed to a 0-100 scale as follows: 0=100, 1=75, 2=50, 3=25, 4=0 Step 2: Calculate Scores by Dimensions If more than 50% of the items in the scale are missing, the scale scores
should not be computed, Mean score = Sum of the items over the number of items answered.
There is no Total Score
Interpretation and Analysis of Missing Data
If more than 50% of the items in the scale are missing, the Scale Scores should not be computed. If 50% or more items are completed: Impute the mean of the completed items in a scale.

PedsQL TM 3.0 Cardiac Module
Version 17: May 2017 Page 44 of 150
CHILD and PARENT Reports for Children (ages 8-12), Teens (ages 13-18), Young Adults (ages 18-25), and Adults (ages over
26)

PedsQL TM 3.0 Cardiac Module
Version 17: May 2017 Page 45 of 150
The Child and Parent Reports of the PPeeddssQQLLTTMM 33..00 CCaarrddiiaacc MMoodduullee for::
- Children (ages 8-12), - Teens (ages 13-18), - Young Adults (ages 18-25), - Adults (ages over 26)
are composed of 27 items comprising 6 dimensions. DESCRIPTION OF THE CARDIAC MODULE:
Dimensions Number of Items
Cluster of Items
Reversed Scoring
Direction of Dimensions
Heart Problems and Treatment
7 1-7 1-7
Higher scores indicate lower problems.
Treatment II 5 1-5 1-5
Perceived Physical
Appearance
3 1-3 1-3
Treatment Anxiety 4 1-4 1-4
Cognitive Problems
5 1-5 1-5
Communication 3 1-3 1-3
SCORING OF DIMENSIONS:
Item Scaling 5-point Likert scale from 0 (Never) to 4 (Almost always)
Weighting of Items No
Extension of the Scoring Scale Scores are transformed on a scale from 0 to 100.
Scoring Procedure
Step 1: Transform Score
Items are reversed scored and linearly transformed to a 0-100 scale as follows: 0=100, 1=75, 2=50, 3=25, 4=0 Step 2: Calculate Scores by Dimensions If more than 50% of the items in the scale are missing, the scale scores
should not be computed, Mean score = Sum of the items over the number of items answered.
There is no Total Score
Interpretation and Analysis of Missing Data
If more than 50% of the items in the scale are missing, the Scale Scores should not be computed. If 50% or more items are completed: Impute the mean of the completed items in a scale.

PedsQL TM 3.0 Cerebral Palsy Module
Version 17: May 2017 Page 46 of 150
PPeeddssQQLL TTMM 33..00 CCeerreebbrraall PPaallssyy MMoodduullee
PARENT Report for Toddlers (ages 2-4)

PedsQL TM 3.0 Cerebral Palsy Module
Version 17: May 2017 Page 47 of 150
The Parent Report for Toddlers (ages 2-4) of the PPeeddssQQLLTTMM 33..00 CCeerreebbrraall PPaallssyy MMoodduullee is
composed of 22 items comprising 5 dimensions.
DESCRIPTION OF THE CEREBRAL PALSY MODULE:
Dimensions Number of Items
Cluster of Items
Reversed Scoring
Direction of Dimensions
Daily Activities 5 1-5 1-5
Higher scores indicate lower problems.
Movement and Balance
5 1-5 1-5
Pain and Hurt 4 1-4 1-4
Fatigue 4 1-4 1-4
Eating Activities 4 1-4 1-4
SCORING OF DIMENSIONS:
Item Scaling 5-point Likert scale from 0 (Never) to 4 (Almost always) Weighting of Items No
Extension of the Scoring Scale
Scores are transformed to a 0 to 100 scale.
Scoring Procedure
Step 1: Transform Score
Items are reversed scored and linearly transformed to a 0-100 scale as follows: 0=100, 1=75, 2=50, 3=25, 4=0 Step 2: Calculate Scores by Dimensions If more than 50% of the items in the scale are missing, the scale scores
should not be computed, Mean score = Sum of the items over the number of items answered.
There is no Total score
Interpretation and Analysis of Missing Data
If more than 50% of the items in the scale are missing, the Scale Scores should not be computed. If 50% or more items are completed: Impute the mean of the completed items in a scale.

PedsQL TM 3.0 Cerebral Palsy Module
Version 17: May 2017 Page 48 of 150
CHILD and PARENT Reports for Young Children (ages 5-7), Children (ages 8-12), Teens (ages 13-18)
PedsQL TM 3.0 Cerebral Palsy Module
Version 17: May 2017 Page 49 of 150
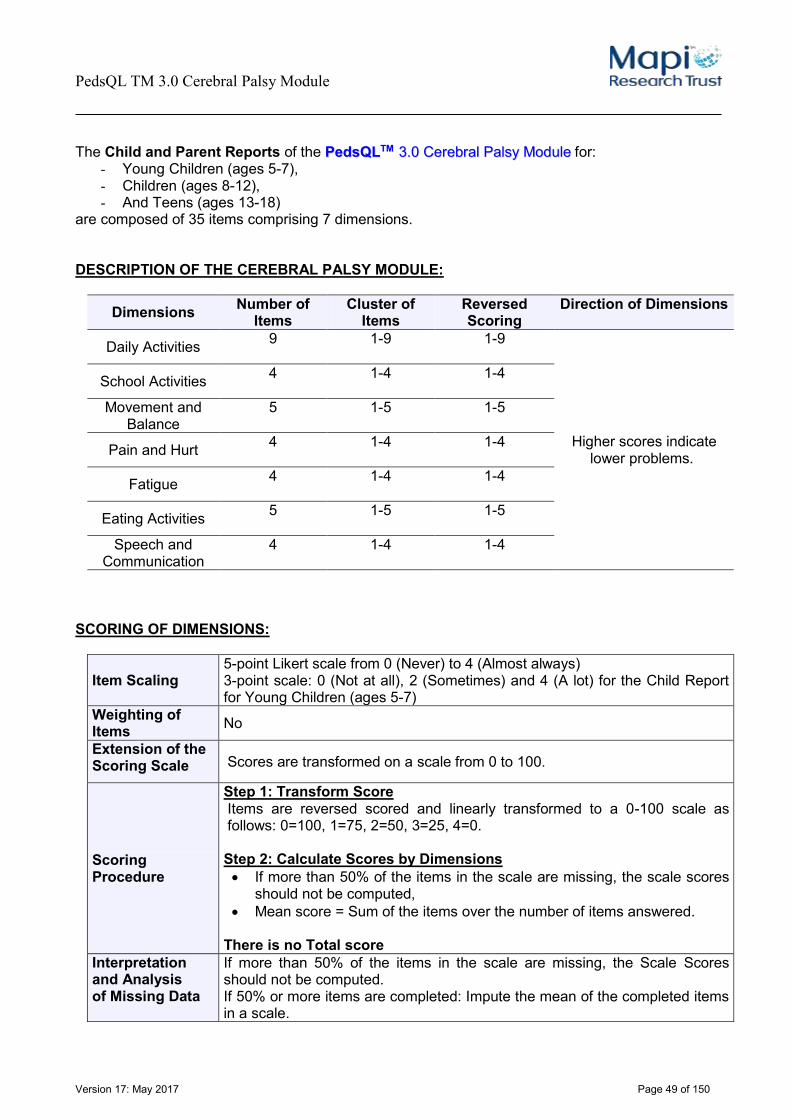
The Child and Parent Reports of the PPeeddssQQLLTTMM 33..00 CCeerreebbrraall PPaallssyy MMoodduullee for:
- Young Children (ages 5-7), - Children (ages 8-12), - And Teens (ages 13-18)
are composed of 35 items comprising 7 dimensions. DESCRIPTION OF THE CEREBRAL PALSY MODULE:
Dimensions Number of Items
Cluster of Items
Reversed Scoring
Direction of Dimensions
Daily Activities 9 1-9 1-9
Higher scores indicate lower problems.
School Activities 4 1-4 1-4
Movement and Balance
5 1-5 1-5
Pain and Hurt 4 1-4 1-4
Fatigue 4 1-4 1-4
Eating Activities 5 1-5 1-5
Speech and Communication
4 1-4 1-4
SCORING OF DIMENSIONS:
Item Scaling 5-point Likert scale from 0 (Never) to 4 (Almost always) 3-point scale: 0 (Not at all), 2 (Sometimes) and 4 (A lot) for the Child Report for Young Children (ages 5-7)
Weighting of Items No
Extension of the Scoring Scale Scores are transformed on a scale from 0 to 100.
Scoring Procedure
Step 1: Transform Score Items are reversed scored and linearly transformed to a 0-100 scale as follows: 0=100, 1=75, 2=50, 3=25, 4=0. Step 2: Calculate Scores by Dimensions If more than 50% of the items in the scale are missing, the scale scores
should not be computed, Mean score = Sum of the items over the number of items answered.
There is no Total score
Interpretation and Analysis of Missing Data
If more than 50% of the items in the scale are missing, the Scale Scores should not be computed. If 50% or more items are completed: Impute the mean of the completed items in a scale.

PedsQL TM Cognitive Functioning Scale
Version 17: May 2017 Page 50 of 150
PPeeddssQQLL TTMM CCooggnniittiivvee FFuunnccttiioonniinngg SSccaallee

PedsQL TM Cognitive Functioning Scale
Version 17: May 2017 Page 51 of 150
The PPeeddssQQLLTTMM CCooggnniittiivvee FFuunnccttiioonniinngg SSccaallee is composed of 6 items comprising 1 dimension. DESCRIPTION OF THE COGNITIVE FUNTIONING SCALE:
Dimensions Number of Items
Cluster of Items
Reversed Scoring
Direction of Dimensions
Cognitive Functioning 6 1-6 1-6 Higher scores indicate
lower problems SCORING OF DIMENSIONS:
Item Scaling 5-point Likert scale from 0 (Never) to 4 (Almost always) 3-point scale: 0 (Not at all), 2 (Sometimes) and 4 (A lot) for the Child Report for Young Children (ages 5-7)
Weighting of Items No
Extension of the Scoring Scale Scores are transformed on a scale from 0 to 100.
Scoring Procedure
Step 1: Transform Score Items are reversed scored and linearly transformed to a 0-100 scale as follows: 0=100, 1=75, 2=50, 3=25, 4=0. Step 2: Calculate Total Score Sum of all the items over the number of items answered
Interpretation and Analysis of Missing Data
If more than 50% of the items in the scale are missing, the Scale Score should not be computed. If 50% or more items are completed: Impute the mean of the completed items in a scale.

PedsQL TM 3.0 Diabetes Module
Version 17: May 2017 Page 52 of 150
PPeeddssQQLL TTMM 33..00 DDiiaabbeetteess MMoodduullee

PedsQL TM 3.0 Diabetes Module
Version 17: May 2017 Page 53 of 150
The PPeeddssQQLLTTMM 33..00 DDiiaabbeetteess MMoodduullee is composed of 28 items comprising 5 dimensions. DESCRIPTION OF THE DIABETES MODULE:
Dimensions Number of Items
Cluster of Items
Reversed Scoring
Direction of Dimensions
Diabetes 11 1-11 1-11
Higher scores indicate lower problems.
Treatment I 4 1-4 1-4
Treatment II 7 1-7 1-7
Worry 3 1-3 1-3
Communication 3 1-3 1-3
SCORING OF DIMENSIONS:
Item Scaling 5-point scale from 0 (Never) to 4 (Almost always) 3-point scale: 0 (Not at all), 2 (Sometimes) and 4 (A lot) for the Child Report for Young Children (ages 5-7)
Weighting of Items No
Extension of the Scoring Scale Scores are transformed on a scale from 0 to 100.
Scoring Procedure
Step 1: Transform Score Items are reversed scored and linearly transformed to a 0-100 scale as follows: 0=100, 1=75, 2=50, 3=25, 4=0. Step 2: Calculate scores by Dimension If more than 50% of the items in the scale are missing, the scale scores
should not be computed, Mean score = Sum of the items over the number of items answered. Total Score: Sum of all the items over the number of items answered on all the Scales.
Interpretation and Analysis of Missing Data
If more than 50% of the items in the scale are missing, the Scale Scores should not be computed. If 50% or more items are completed: Impute the mean of the completed items in a scale.
PedsQL TM 3.2 Diabetes Module
Version 17: May 2017 Page 54 of 150
PPeeddssQQLL TTMM 33..22 DDiiaabbeetteess MMoodduullee

PedsQL TM 3.2 Diabetes Module
Version 17: May 2017 Page 55 of 150
The PedsQLTM 3.2 Diabetes Module is composed of 33 items comprising 5 dimensions for ages 8-45 years. For ages 2-7 years, the PedsQLTM 3.2 Diabetes Module is composed of 32 items comprising 5 dimensions (one less item for the Worry Scale). DESCRIPTION OF THE DIABETES MODULE:
Dimensions Number of Items
Cluster of Items
Reversed Scoring
Direction of Dimensions
Diabetes Symptoms
15 1-15 1-15
Higher scores indicate lower problems.
Treatment I 5 1-5 1-5
Treatment II 6 1-6 1-6
Worry 3 (2 ages 2-7)
1-3 (or 1-2)
1-3 (or 1-2)
Communication 4 1-4 1-4
SCORING OF DIMENSIONS:
Item Scaling 5-point scale from 0 (Never) to 4 (Almost always) 3-point scale: 0 (Not at all), 2 (Sometimes) and 4 (A lot) for the Child Report for Young Children (ages 5-7)
Weighting of Items No
Extension of the Scoring Scale Scores are transformed on a scale from 0 to 100.
Scoring Procedure
Step 1: Transform Score Items are reversed scored and linearly transformed to a 0-100 scale as follows: 0=100, 1=75, 2=50, 3=25, 4=0. Step 2: Calculate Scores Score by Dimensions: If more than 50% of the items in the scale are missing, the scale scores
should not be computed, Mean score = Sum of the items over the number of items answered. Diabetes Symptoms Summary Score = Diabetes Symptoms Scale Score Diabetes Management Summary Score = Sum of the items over the number of items answered in the Treatment I, Treatment II, Worry, and Communication Scales. Total Score: Sum of all the items over the number of items answered on all the Scales.
Interpretation and Analysis of Missing Data
If more than 50% of the items in the scale are missing, the Scale Scores should not be computed. If 50% or more items are completed: Impute the mean of the completed items in a scale.
PedsQL TM 3.0 Duchenne Muscular Dystrophy Module
Version 17: May 2017 Page 56 of 150
PPeeddssQQLL TTMM 33..00 DDuucchheennnnee MMuussccuullaarr DDyyssttrroopphhyy MMoodduullee
Version 17: May 2017 Page 57 of 150
PARENT Report for Young Children (ages 5-7)

Version 17: May 2017 Page 58 of 150
The Parent Report of the PedsQLTM 3.0 Duchenne Muscular Dystrophy Module for Young Children (ages 5-7) is composed of 18 items comprising 4 dimensions. DESCRIPTION OF THE DUCHENNE MUSCULAR DYSTROPHY MODULE:
Dimensions Number of Items
Cluster of Items
Reversed Scoring
Direction of Dimensions
Daily Activities 5 1-5 1-5
Higher scores indicate lower problems.
Treatment 4 1-4 1-4
Worry 6 1-6 1-6
Communication 3 1-3 1-3
SCORING OF DIMENSIONS:
Item Scaling 5-point Likert scale from 0 (Never) to 4 (Almost always)
Weighting of Items No
Extension of the Scoring Scale Scores are transformed on a scale from 0 to 100.
Scoring Procedure
Step 1: Transform Score
Items are reversed scored and linearly transformed to a 0-100 scale as follows: 0=100, 1=75, 2=50, 3=25, 4=0 Step 2: Calculate Scores by Dimensions If more than 50% of the items in the scale are missing, the scale scores
should not be computed, Mean score = Sum of the items over the number of items answered.
No Total Score
Interpretation and Analysis of Missing Data
If more than 50% of the items in the scale are missing, the Scale Scores should not be computed. If 50% or more items are completed: Impute the mean of the completed items in a scale.

Version 17: May 2017 Page 59 of 150
CHILD and PARENT Reports for Children (ages 8-12), Teens
(ages 13-18) and Young Adults (ages 18-25)

Version 17: May 2017 Page 60 of 150
The Child and Parent Reports of the PedsQLTM 3.0 Duchenne Muscular Dystrophy Module for:
- Children (ages 8-12), - Teens (ages 13-18) - Young Adults (ages 18-25)
are composed of 18 items comprising 4 dimensions. DESCRIPTION OF THE DUCHENNE MUSCULAR DYSTROPHY MODULE:
Dimensions Number of Items
Cluster of Items
Reversed Scoring
Direction of Dimensions
Daily Activities 5 1-5 1-5
Higher scores indicate lower problems.
Treatment 4 1-4 1-4
Worry 6 1-6 1-6
Communication 3 1-3 1-3
SCORING OF DIMENSIONS:
Item Scaling 5-point Likert scale from 0 (Never) to 4 (Almost always)
Weighting of Items No
Extension of the Scoring Scale Scores are transformed on a scale from 0 to 100.
Scoring Procedure
Step 1: Transform Score
Items are reversed scored and linearly transformed to a 0-100 scale as follows: 0=100, 1=75, 2=50, 3=25, 4=0 Step 2: Calculate Scores by Dimensions If more than 50% of the items in the scale are missing, the scale scores
should not be computed, Mean score = Sum of the items over the number of items answered.
No Total Score
Interpretation and Analysis of Missing Data
If more than 50% of the items in the scale are missing, the Scale Scores should not be computed. If 50% or more items are completed: Impute the mean of the completed items in a scale.

PedsQL TM 3.0 End Stage Renal Disease Module
Version 17: May 2017 Page 61 of 150
PPeeddssQQLL TTMM 33..00 EEnndd SSttaaggee RReennaall DDiisseeaassee MMoodduullee
PARENT Report for Toddlers (ages 2-4)

PedsQL TM 3.0 End Stage Renal Disease Module
Version 17: May 2017 Page 62 of 150
The Parent Report for Toddlers (ages 2-4) of the PPeeddssQQLLTTMM 33..00 EEnndd SSttaaggee RReennaall DDiisseeaassee MMoodduullee is composed of 13 items comprising 4 dimensions. DESCRIPTION OF THE END STAGE RENAL DISEASE MODULE:
Dimensions Number of Items
Cluster of Items
Reversed Scoring
Direction of Dimensions
General Fatigue 3 1-3 1-3
Higher scores indicate lower problems.
About My Kidney Disease 4 1-4 1-4
Treatment Problems 3 1-3 1-3
Worry 3 1-3 1-3 SCORING OF DIMENSIONS:
Item Scaling 5-point Likert scale from 0 (Never) to 4 (Almost always) Weighting of Items No
Extension of the Scoring Scale Scores are transformed to a 0 to 100 scale.
Scoring Procedure
Step 1: Transform Score
Items are reversed scored and linearly transformed to a 0-100 scale as follows: 0=100, 1=75, 2=50, 3=25, 4=0. Step 2: Calculate Scores by Dimensions If more than 50% of the items in the scale are missing, the scale scores
should not be computed, Mean score = Sum of the items over the number of items answered.
Total Score: Sum of all the items over the number of items answered on all the Scales.
Interpretation and Analysis of Missing Data
If more than 50% of the items in the scale are missing, the Scale Scores should not be computed. If 50% or more items are completed: Impute the mean of the completed items in a scale.

PedsQL TM 3.0 End Stage Renal Disease Module
Version 17: May 2017 Page 63 of 150
CHILD and PARENT Reports for Young Children (ages 5-7), Children (ages 8-12), Teens (ages 13-18), and Young Adults
(ages 18-25)

PedsQL TM 3.0 End Stage Renal Disease Module
Version 17: May 2017 Page 64 of 150
The Child and Parent Reports of the PPeeddssQQLLTTMM 33..00 EEnndd SSttaaggee RReennaall DDiisseeaassee MMoodduullee for: - Young Children (ages 5-7), -- Children (ages 8-12), -- And Teens ages (13-18), - Young Adults (ages 18-25) are composed of 34 items comprising 7 dimensions. DESCRIPTION OF THE END STAGE RENAL DISEASE MODULE:
Dimensions Number of Items
Cluster of Items
Reversed Scoring
Direction of Dimensions
General Fatigue 4 1-4 1-4
Higher scores indicate lower problems.
About My Kidney Disease 5 1-5 1-5
Treatment Problems 4 1-4 1-4
Family and Peer Interaction 3 1-3 1-3
Worry 10 1-10 1-10 Perceived Physical
Appearance 3 1-3 1-3
Communication 5 1-5 1-5 SCORING OF DIMENSIONS:
Item Scaling 5-point Likert scale from 0 (Never) to 4 (Almost always) 3-point scale: 0 (Not at all), 2 (Sometimes) and 4 (A lot) for the Young Children (ages 5-7) child report
Weighting of Items No
Extension of the Scoring Scale Scores are transformed on a scale from 0 to 100.
Scoring Procedure
Step 1: Transform Score Items are reversed scored and linearly transformed to a 0-100 scale as follows: 0=100, 1=75, 2=50, 3=25, 4=0. Step 2: Calculate Scores Score by Dimensions: If more than 50% of the items in the scale are missing, the scale scores
should not be computed, Mean score = Sum of the items over the number of items answered. Total Score: Sum of all the items over the number of items answered on all the Scales.
Interpretation and Analysis of Missing Data
If more than 50% of the items in the scale are missing, the Scale Scores should not be computed. If 50% or more items are completed: Impute the mean of the completed items in a scale.

PedsQL TM 3.0 Eosinophilic Esophagitis Module
Version 17: May 2017 Page 65 of 150
PPeeddssQQLL TTMM 33..00 EEoossiinnoopphhiilliicc EEssoopphhaaggiittiiss MMoodduullee
PARENT Report for Toddlers (ages 2-4)

PedsQL TM 3.0 Eosinophilic Esophagitis Module
Version 17: May 2017 Page 66 of 150
The Parent Report for Toddlers (age 2-4) of the PedsQLTM 3.0 Eosinophilic Esophagitis Module is composed of 21 items comprising 6 dimensions. DESCRIPTION OF THE EOSINOPHILIC ESOPHAGITIS MODULE:
Dimensions Number of Items
Cluster of Items
Reversed Scoring
Direction of Dimensions
Symptoms I 3 1-3 1-3
Higher scores indicate lower problems.
Symptoms II 4 1-4 1-4
Treatment 4 1-4 1-4
Worry 4 1-4 1-4
Food and Eating 3 1-3 1-3
Food Feelings 3 1-3 1-3
Note: Feeding Tube Scale not scored. SCORING OF DIMENSIONS:
Item Scaling 5-point Likert scale from 0 (Never) to 4 (Almost always) Weighting of Items No
Extension of the Scoring Scale Scores are transformed to a 0 to 100 scale.
Scoring Procedure
Step 1: Transform Score
Items are reversed scored and linearly transformed to a 0-100 scale as follows: 0=100, 1=75, 2=50, 3=25, 4=0. Step 2: Calculate scores by Dimensions If more than 50% of the items in the scale are missing, the scale scores
should not be computed, Mean score = Sum of the items over the number of items answered.
Symptoms Total Scale Score = Sum of the items over the number of items answered in the Symptoms I and Symptoms II Scales. Total Score: Sum of all the items over the number of items answered on all the Scales except Feeding Tube Scale.
Interpretation and Analysis of Missing Data
If more than 50% of the items in the scale are missing, the Scale Scores should not be computed. If 50% or more items are completed: Impute the mean of the completed items in a scale.
REFERENCES: Franciosi, J.P., Hommel, K.A., Bendo, C.B., King, E.C., Collins, M.H., Eby, M.D., Marsolo, K., Abonia, J.P., von Tiehl, K.F., Putnam, P.E., Greenler, A.J., Greenberg, A.B., Bryson,

PedsQL TM 3.0 Eosinophilic Esophagitis Module
Version 17: May 2017 Page 67 of 150
CHILD and PARENT Reports for Young Children (ages 5-7)

PedsQL TM 3.0 Eosinophilic Esophagitis Module
Version 17: May 2017 Page 68 of 150
The Child and Parent Reports of the PedsQLTM 3.0 Eosinophilic Esophagitis Module for Young Children (ages 5-7) are composed of 26 items comprising 7 dimensions. DESCRIPTION OF THE EOSINOPHILIC ESOPHAGITIS MODULE:
Dimensions Number of Items
Cluster of Items
Reversed Scoring
Direction of Dimensions
Symptoms I 3 1-3 1-3
Higher scores indicate lower problems.
Symptoms II* 4 1-4 1-4
Treatment 4 1-4 1-4
Worry 4 1-4 1-4
Communication 4 1-4 1-4
Food and Eating 4 1-4 1-4
Food Feelings 3 1-3 1-3
*Symptoms II Scale not scored for child self-report ages 5-7 years. Note: Feeding Tube Scale not scored. SCORING OF DIMENSIONS:
Item Scaling 5-point Likert scale from 0 (Never) to 4 (Almost always) 3-point scale: 0 (Not at all), 2 (Sometimes) and 4 (A lot) for the Child Report for Young Children (ages 5-7)
Weighting of Items No
Extension of the Scoring Scale Scores are transformed on a scale from 0 to 100.
Scoring Procedure
Step 1: Transform Score
Items are reversed scored and linearly transformed to a 0-100 scale as follows: 0=100, 1=75, 2=50, 3=25, 4=0 Step 2: Calculate Scores by Dimensions If more than 50% of the items in the scale are missing, the scale scores
should not be computed, Mean score = Sum of the items over the number of items answered.
Symptoms Total Scale Score = Sum of the items over the number of items answered in the Symptoms I and Symptoms II Scales. No Symptoms Total Scale Score for child self-report ages 5-7 years. Total Score: Sum of all the items over the number of items answered on all the Scales for parent report except Feeding Tube Scale. For child self-report ages 5-7, sum all of the items over the number of items answered on all Scales except for Symptoms II and Feeding Tube Scale.

PedsQL TM 3.0 Eosinophilic Esophagitis Module
Version 17: May 2017 Page 69 of 150
Interpretation and Analysis of Missing Data
If more than 50% of the items in the scale are missing, the Scale Scores should not be computed. If 50% or more items are completed: Impute the mean of the completed items in a scale.

PedsQL TM 3.0 Eosinophilic Esophagitis Module
Version 17: May 2017 Page 70 of 150
CHILD and PARENT Reports for Children (ages 8-12) and Teens (ages 13-18)

PedsQL TM 3.0 Eosinophilic Esophagitis Module
Version 17: May 2017 Page 71 of 150
The Child and Parent Reports of the PedsQLTM 3.0 Eosinophilic Esophagitis Module for: - Children (ages 8-12), - And Teens (ages 13-18)
are composed of 33 items comprising 7 dimensions. DESCRIPTION OF THE EOSINOPHILIC ESOPHAGITIS MODULE:
Dimensions Number of Items
Cluster of Items
Reversed Scoring
Direction of Dimensions
Symptoms I 6 1-6 1-6
Higher scores indicate lower problems.
Symptoms II 4 1-4 1-4
Treatment 5 1-5 1-5
Worry 6 1-6 1-6
Communication 5 1-5 1-5
Food and Eating 4 1-4 1-4
Food Feelings 3 1-3 1-3
Note: Feeding Tube Scale not scored. SCORING OF DIMENSIONS:
Item Scaling 5-point Likert scale from 0 (Never) to 4 (Almost always)
Weighting of Items No
Extension of the Scoring Scale Scores are transformed on a scale from 0 to 100.
Scoring Procedure
Step 1: Transform Score
Items are reversed scored and linearly transformed to a 0-100 scale as follows: 0=100, 1=75, 2=50, 3=25, 4=0 Step 2: Calculate Scores by Dimensions If more than 50% of the items in the scale are missing, the scale scores
should not be computed, Mean score = Sum of the items over the number of items answered.
Symptoms Total Scale Score = Sum of the items over the number of items answered in the Symptoms I and Symptoms II Scales. Total Score: Sum of all the items over the number of items answered on all the Scales except Feeding Tube Scale.
Interpretation and Analysis of Missing Data
If more than 50% of the items in the scale are missing, the Scale Scores should not be computed. If 50% or more items are completed: Impute the mean of the completed items in a scale.

PedsQL TM Eosinophilic Esophagitis Symptoms Scales
Version 17: May 2017 Page 72 of 150
PPeeddssQQLL TTMM EEoossiinnoopphhiilliicc EEssoopphhaaggiittiiss SSyymmppttoommss SSccaalleess
PARENT Report for Toddlers (ages 2-4)

PedsQL TM Eosinophilic Esophagitis Symptoms Scales
Version 17: May 2017 Page 73 of 150
The Parent Report for Toddlers (age 2-4) of the PedsQLTM Eosinophilic Esophagitis Symptoms Scales is composed of 7 items comprising 2 dimensions. DESCRIPTION OF THE EOSINOPHILIC ESOPHAGITIS MODULE:
Dimensions Number of Items
Cluster of Items
Reversed Scoring
Direction of Dimensions
Symptoms I 3 1-3 1-3 Higher scores indicate
lower problems. Symptoms II 4 1-4 1-4
SCORING OF DIMENSIONS:
Item Scaling 5-point Likert scale from 0 (Never) to 4 (Almost always) Weighting of Items No
Extension of the Scoring Scale Scores are transformed to a 0 to 100 scale.
Scoring Procedure
Step 1: Transform Score
Items are reversed scored and linearly transformed to a 0-100 scale as follows: 0=100, 1=75, 2=50, 3=25, 4=0. Step 2: Calculate scores by Dimensions If more than 50% of the items in the scale are missing, the scale
scores should not be computed, Mean score = Sum of the items over the number of items answered.
Symptoms Total Scale Score = Sum of the items over the number of items answered in the Symptoms I and Symptoms II Scales.
Interpretation and Analysis of Missing Data
If more than 50% of the items in the scale are missing, the Scale Scores should not be computed. If 50% or more items are completed: Impute the mean of the completed items in a scale.

PedsQL TM Eosinophilic Esophagitis Symptoms Scales
Version 17: May 2017 Page 74 of 150
PARENT Reports for Young Children (ages 5-7)

PedsQL TM Eosinophilic Esophagitis Symptoms Scales
Version 17: May 2017 Page 75 of 150
The Parent Reports of the PedsQLTM Eosinophilic Esophagitis Symptoms Scales for Young Children (ages 5-7) are composed of 7 items comprising 2 dimensions. Please note that there is no child self-report for ages 5-7. DESCRIPTION OF THE EOSINOPHILIC ESOPHAGITIS MODULE:
Dimensions Number of Items
Cluster of Items
Reversed Scoring
Direction of Dimensions
Symptoms I 3 1-3 1-3 Higher scores indicate
lower problems. Symptoms II 4 1-4 1-4
SCORING OF DIMENSIONS:
Item Scaling 5-point Likert scale from 0 (Never) to 4 (Almost always) 3-point scale: 0 (Not at all), 2 (Sometimes) and 4 (A lot) for the Child Report for Young Children (ages 5-7)
Weighting of Items No
Extension of the Scoring Scale Scores are transformed on a scale from 0 to 100.
Scoring Procedure
Step 1: Transform Score
Items are reversed scored and linearly transformed to a 0-100 scale as follows: 0=100, 1=75, 2=50, 3=25, 4=0 Step 2: Calculate Scores by Dimensions If more than 50% of the items in the scale are missing, the scale
scores should not be computed, Mean score = Sum of the items over the number of items answered.
Symptoms Total Scale Score = Sum of the items over the number of items answered in the Symptoms I and Symptoms II Scales.
Interpretation and Analysis of Missing Data
If more than 50% of the items in the scale are missing, the Scale Scores should not be computed. If 50% or more items are completed: Impute the mean of the completed items in a scale.

PedsQL TM Eosinophilic Esophagitis Symptoms Scales
Version 17: May 2017 Page 76 of 150
CHILD and PARENT Reports for Children (ages 8-12) and Teens (ages 13-18)
PedsQL TM Eosinophilic Esophagitis Symptoms Scales
Version 17: May 2017 Page 77 of 150
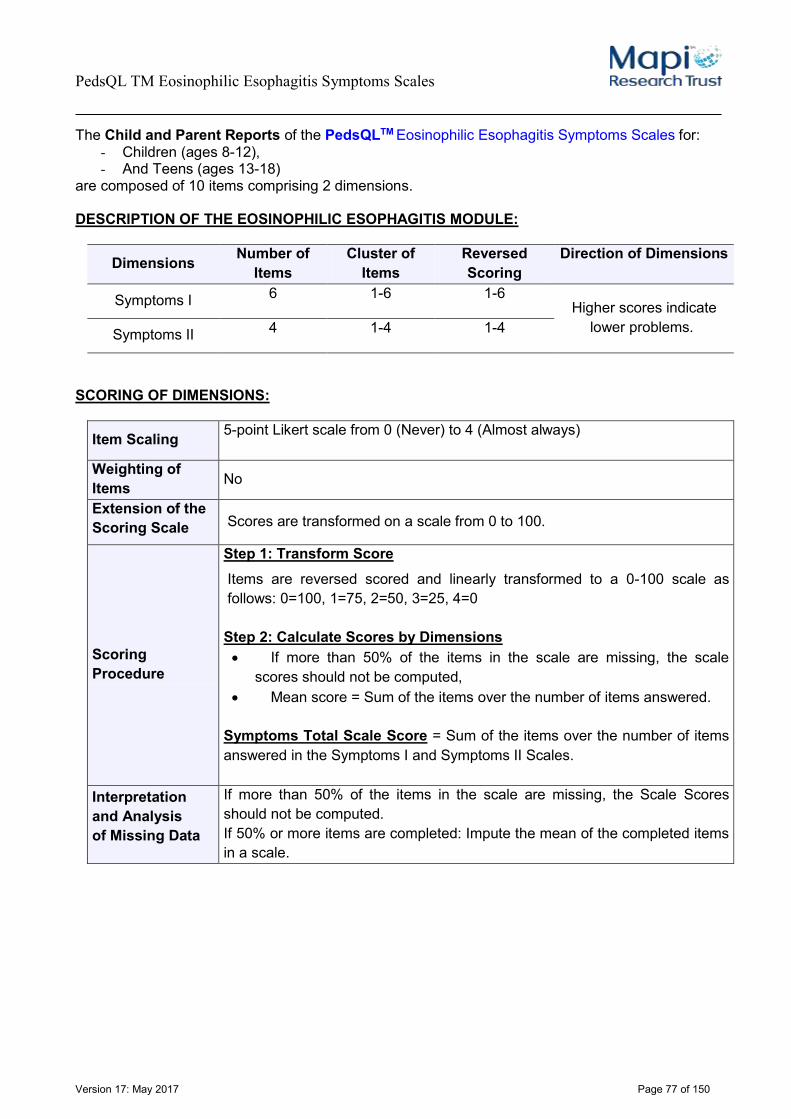
The Child and Parent Reports of the PedsQLTM Eosinophilic Esophagitis Symptoms Scales for: - Children (ages 8-12), - And Teens (ages 13-18)
are composed of 10 items comprising 2 dimensions. DESCRIPTION OF THE EOSINOPHILIC ESOPHAGITIS MODULE:
Dimensions Number of Items
Cluster of Items
Reversed Scoring
Direction of Dimensions
Symptoms I 6 1-6 1-6 Higher scores indicate
lower problems. Symptoms II 4 1-4 1-4
SCORING OF DIMENSIONS:
Item Scaling 5-point Likert scale from 0 (Never) to 4 (Almost always)
Weighting of Items No
Extension of the Scoring Scale Scores are transformed on a scale from 0 to 100.
Scoring Procedure
Step 1: Transform Score
Items are reversed scored and linearly transformed to a 0-100 scale as follows: 0=100, 1=75, 2=50, 3=25, 4=0 Step 2: Calculate Scores by Dimensions If more than 50% of the items in the scale are missing, the scale
scores should not be computed, Mean score = Sum of the items over the number of items answered.
Symptoms Total Scale Score = Sum of the items over the number of items answered in the Symptoms I and Symptoms II Scales.
Interpretation and Analysis of Missing Data
If more than 50% of the items in the scale are missing, the Scale Scores should not be computed. If 50% or more items are completed: Impute the mean of the completed items in a scale.

Version 17: May 2017 Page 78 of 150
PPeeddssQQLL TTMM 33..00 EEppiilleeppssyy MMoodduullee
PARENT Report for Toddlers (ages 2-4)

PedsQL TM 3.0 Epilepsy Module
Version 17: May 2017 Page 79 of 150
The Parent Report for Toddlers (ages 2-4) of the PedsQLTM 3.0 Epilepsy Module is composed of
22 items comprising 5 dimensions.
DESCRIPTION OF THE EPILEPSY MODULE:
Dimensions Number of Items
Cluster of Items
Reversed Scoring
Direction of Dimensions
Impact 6 1-6 1-6
Higher scores indicate lower problems.
Cognitive Functioning
5 1-5 1-5
Sleep/Rest 2 1-2 1-2
Executive Functioning
4 1-4 1-4
Mood/Behavior 5 1-5 1-5
SCORING OF DIMENSIONS:
Item Scaling 5-point Likert scale from 0 (Never) to 4 (Almost always) Weighting of Items No
Extension of the Scoring Scale
Scores are transformed to a 0 to 100 scale.
Scoring Procedure
Step 1: Transform Score
Items are reversed scored and linearly transformed to a 0-100 scale as follows: 0=100, 1=75, 2=50, 3=25, 4=0 Step 2: Calculate Scores by Dimensions If more than 50% of the items in the scale are missing, the scale
scores should not be computed, Mean score = Sum of the items over the number of items answered.
There is no Total score
Interpretation and Analysis of Missing Data
If more than 50% of the items in the scale are missing, the Scale Scores should not be computed. If 50% or more items are completed: Impute the mean of the completed items in a scale.

PedsQL TM 3.0 Epilepsy Module
Version 17: May 2017 Page 80 of 150
CHILD Reports for Young Children (ages 5-7)

PedsQL TM 3.0 Epilepsy Module
Version 17: May 2017 Page 81 of 150
The Child Reports of the PedsQLTM 3.0 Epilepsy Module for:
- Young Children (ages 5-7) are composed of 28 items comprising 5 dimensions. DESCRIPTION OF THE EPILEPSY MODULE:
Dimensions Number of Items
Cluster of Items
Reversed Scoring
Direction of Dimensions
Impact 8 1-8 1-8
Higher scores indicate lower problems.
Cognitive Functioning
6 1-6 1-6
Sleep/Rest 3 1-3 1-3
Executive Functioning
6 1-6 1-6
Mood/Behavior 5 1-5 1-5
SCORING OF DIMENSIONS:
Item Scaling 3-point scale: 0 (Not at all), 2 (Sometimes) and 4 (A lot) for the Child Report for Young Children (ages 5-7)
Weighting of Items No
Extension of the Scoring Scale Scores are transformed on a scale from 0 to 100.
Scoring Procedure
Step 1: Transform Score Items are reversed scored and linearly transformed to a 0-100 scale as follows: 0=100, 2=50, 4=0. Step 2: Calculate Scores by Dimensions If more than 50% of the items in the scale are missing, the scale
scores should not be computed, Mean score = Sum of the items over the number of items answered.
There is no Total score
Interpretation and Analysis of Missing Data
If more than 50% of the items in the scale are missing, the Scale Scores should not be computed. If 50% or more items are completed: Impute the mean of the completed items in a scale.

PedsQL TM 3.0 Epilepsy Module
Version 17: May 2017 Page 82 of 150
PARENT Reports for Young Children (ages 5-7)

PedsQL TM 3.0 Epilepsy Module
Version 17: May 2017 Page 83 of 150
The Parent Reports of the PedsQLTM 3.0 Epilepsy Module for:
- Young Children (ages 5-7) are composed of 29 items comprising 5 dimensions. DESCRIPTION OF THE EPILEPSY MODULE:
Dimensions Number of Items
Cluster of Items
Reversed Scoring
Direction of Dimensions
Impact 9 1-9 1-9
Higher scores indicate lower problems.
Cognitive Functioning
6 1-6 1-6
Sleep/Rest 3 1-3 1-3
Executive Functioning
6 1-6 1-6
Mood/Behavior 5 1-5 1-5
SCORING OF DIMENSIONS:
Item Scaling 5-point Likert scale from 0 (Never) to 4 (Almost always)
Weighting of Items No
Extension of the Scoring Scale Scores are transformed on a scale from 0 to 100.
Scoring Procedure
Step 1: Transform Score Items are reversed scored and linearly transformed to a 0-100 scale as follows: 0=100, 1=75, 2=50, 3=25, 4=0. Step 2: Calculate Scores by Dimensions If more than 50% of the items in the scale are missing, the scale
scores should not be computed, Mean score = Sum of the items over the number of items answered.
There is no Total score
Interpretation and Analysis of Missing Data
If more than 50% of the items in the scale are missing, the Scale Scores should not be computed. If 50% or more items are completed: Impute the mean of the completed items in a scale.

PedsQL TM 3.0 Epilepsy Module
Version 17: May 2017 Page 84 of 150
CHILD and PARENT Reports for Children (ages 8-12), Teens (ages 13-18), Young Adults (ages 18-25)

PedsQL TM 3.0 Epilepsy Module
Version 17: May 2017 Page 85 of 150
The Child and Parent Reports of the PedsQLTM 3.0 Epilepsy Module for: - Children (ages 8-12), - Teens (ages 13-18) - Young Adults (18-25)
are composed of 29 items comprising 5 dimensions. DESCRIPTION OF THE EPILEPSY MODULE:
Dimensions Number of Items
Cluster of Items
Reversed Scoring
Direction of Dimensions
Impact 9 1-9 1-9
Higher scores indicate lower problems.
Cognitive Functioning
6 1-6 1-6
Sleep/Rest 3 1-3 1-3
Executive Functioning
6 1-6 1-6
Mood/Behavior 5 1-5 1-5
SCORING OF DIMENSIONS:
Item Scaling 5-point Likert scale from 0 (Never) to 4 (Almost always)
Weighting of Items No
Extension of the Scoring Scale Scores are transformed on a scale from 0 to 100.
Scoring Procedure
Step 1: Transform Score Items are reversed scored and linearly transformed to a 0-100 scale as follows: 0=100, 1=75, 2=50, 3=25, 4=0. Step 2: Calculate Scores by Dimensions If more than 50% of the items in the scale are missing, the scale
scores should not be computed, Mean score = Sum of the items over the number of items answered.
There is no Total score
Interpretation and Analysis of Missing Data
If more than 50% of the items in the scale are missing, the Scale Scores should not be computed. If 50% or more items are completed: Impute the mean of the completed items in a scale.

Version 17: May 2017 Page 86 of 150
PPeeddssQQLL TTMM 22..00 FFaammiillyy IImmppaacctt MMoodduullee

Version 17: May 2017 Page 87 of 150
PARENT Report

Version 17: May 2017 Page 88 of 150
The Parent report of the PPeeddssQQLLTTMM 22..00 FFaammiillyy iimmppaacctt MMoodduullee is composed of 36 items comprising 8 dimensions. DESCRIPTION OF THE FAMILY IMPACT MODULE:
Dimensions Number of Items
Cluster of Items
Reversed Scoring
Direction of Dimensions
Physical Functioning
6 1-6 1-6
Higher scores indicate better functioning.
Emotional Functioning
5 1-5 1-5
Social Functioning
4 1-4 1-4
Cognitive Functioning
5 1-5 1-5
Communication 3 1-3 1-3
Worry 5 1-5 1-5
Daily Activities
3 1-3 1-3
Family Relationships
5 1-5 1-5
SCORING OF DIMENSIONS:
Item Scaling 5-point Likert scale from 0 (Never) to 4 (Almost always) Weighting of Items No
Extension of the Scoring Scale Scores are transformed to a 0 to 100 scale.
Scoring Procedure
Step 1: Transform Score
Items are reversed scored and linearly transformed to a 0-100 scale as follows: 0=100, 1=75, 2=50, 3=25, 4=0 Step 2: Calculate Scores by Dimensions If more than 50% of the items in the scale are missing, the scale scores
should not be computed, Mean score = Sum of the items over the number of items answered.
Step 3: Total Scores The Total Score is the sum of all 36 items divided by the number of items
answered The Parent HRQL Summary Score (20 items) is computed as the sum of
the items divided by the number of items answered in the Physical, Emotional, Social, and Cognitive Functioning scales.
The Family Functioning Summary Score (8 items) is computed as the sum of the items divided by the number of items answered in the Daily Activities and family Relationships scales.

Version 17: May 2017 Page 89 of 150
Interpretation and Analysis of Missing Data
If more than 50% of the items in the scale are missing, the Scale Scores should not be computed. If 50% or more items are completed: Impute the mean of the completed items in a scale.

PedsQL TM 3.0 Gastrointestinal Symptoms Module
Version 17: May 2017 Page 90 of 150
PPeeddssQQLL TTMM 33..00 GGaassttrrooiinntteessttiinnaall SSyymmppttoommss MMoodduullee
PARENT Report for Toddlers (ages 2-4)

PedsQL TM 3.0 Gastrointestinal Symptoms Module
Version 17: May 2017 Page 91 of 150
The Parent Report for Toddlers (age 2-4) of the PedsQLTM 3.0 Gastrointestinal Symptoms Module is composed of 74 items comprising 14 dimensions. DESCRIPTION OF THE GASTROINTESTINAL SYMPTOMS MODULE:
Dimensions Number of Items
Cluster of Items
Reversed Scoring
Direction of Dimensions
Stomach Pain and Hurt
6 1-6 1-6
Higher scores indicate lower problems.
Stomach Discomfort When
Eating
5 1-5 1-5
Food and Drink Limits
6 1-6 1-6
Trouble Swallowing
3 1-3 1-3
Heart Burn and Reflux
4 1-4 1-4
Nausea and Vomiting
4 1-4 1-4
Gas and Bloating 7 1-7 1-7
Constipation 14 1-14 1-14
Blood in Poop 2 1-2 1-2
Diarrhea 7 1-7 1-7
Worry About Going Poop
5 1-5 1-5
Worry About Stomach Aches
2 1-2 1-2
Medicines 4 1-4 1-4
Communication 5 1-5 1-5
SCORING OF DIMENSIONS:
Item Scaling 5-point Likert scale from 0 (Never) to 4 (Almost always) Weighting of Items No
Extension of the Scoring Scale Scores are transformed to a 0 to 100 scale.
Scoring Procedure
Step 1: Transform Score
Items are reversed scored and linearly transformed to a 0-100 scale as follows: 0=100, 1=75, 2=50, 3=25, 4=0. Step 2: Calculate scores by Dimensions If more than 50% of the items in the scale are missing, the scale scores
should not be computed, Mean score = Sum of the items over the number of items answered.

PedsQL TM 3.0 Gastrointestinal Symptoms Module
Version 17: May 2017 Page 92 of 150
Symptoms Total Scales Score = Sum of the items over the number of items answered in the 10 Symptoms Scales. Total Score: Sum of all the items over the number of items answered on all the Scales.
Interpretation and Analysis of Missing Data
If more than 50% of the items in the scale are missing, the Scale Scores should not be computed. If 50% or more items are completed: Impute the mean of the completed items in a scale.

PedsQL TM 3.0 Gastrointestinal Symptoms Module
Version 17: May 2017 Page 93 of 150
CHILD and PARENT Report for Young Children (ages 5-7)

PedsQL TM 3.0 Gastrointestinal Symptoms Module
Version 17: May 2017 Page 94 of 150
The Child and Parent Reports of the PedsQLTM 3.0 Gastrointestinal Symptoms Module for Young Children (ages 5-7) are composed of 74 items comprising 14 dimensions. DESCRIPTION OF THE GASTROINTESTINAL SYMPTOMS MODULE:
Dimensions Number of Items
Cluster of Items
Reversed Scoring
Direction of Dimensions
Stomach Pain and Hurt
6 1-6 1-6
Higher scores indicate lower problems.
Stomach Discomfort When
Eating
5 1-5 1-5
Food and Drink Limits
6 1-6 1-6
Trouble Swallowing
3 1-3 1-3
Heart Burn and Reflux
4 1-4 1-4
Nausea and Vomiting
4 1-4 1-4
Gas and Bloating 7 1-7 1-7
Constipation 14 1-14 1-14
Blood in Poop 2 1-2 1-2
Diarrhea 7 1-7 1-7
Worry About Going Poop
5 1-5 1-5
Worry About Stomach Aches
2 1-2 1-2
Medicines 4 1-4 1-4
Communication 5 1-5 1-5
SCORING OF DIMENSIONS:
Item Scaling 5-point Likert scale from 0 (Never) to 4 (Almost always) 3-point scale: 0 (Not at all), 2 (Sometimes) and 4 (A lot) for the Child Report for Young Children (ages 5-7)
Weighting of Items No
Extension of the Scoring Scale Scores are transformed on a scale from 0 to 100.
Scoring Procedure
Step 1: Transform Score
Items are reversed scored and linearly transformed to a 0-100 scale as follows: 0=100, 1=75, 2=50, 3=25, 4=0 Step 2: Calculate Scores by Dimensions If more than 50% of the items in the scale are missing, the scale scores

PedsQL TM 3.0 Gastrointestinal Symptoms Module
Version 17: May 2017 Page 95 of 150
should not be computed, Mean score = Sum of the items over the number of items answered.
Symptoms Total Scales Score = Sum of the items over the number of items answered in the 10 Symptoms Scales. Total Score: Sum of all the items over the number of items answered on all the Scales.
Interpretation and Analysis of Missing Data
If more than 50% of the items in the scale are missing, the Scale Scores should not be computed. If 50% or more items are completed: Impute the mean of the completed items in a scale.

PedsQL TM 3.0 Gastrointestinal Symptoms Module
Version 17: May 2017 Page 96 of 150
CHILD and PARENT Reports for Children (ages 8-12), Teens (ages 13-18) and Young Adults (18-25)

PedsQL TM 3.0 Gastrointestinal Symptoms Module
Version 17: May 2017 Page 97 of 150
The Child and Parent Reports of the PedsQLTM 3.0 Gastrointestinal Symptoms Module for: - Children (ages 8-12), - Teens (ages 13-18), - Young Adults (ages 18-25)
are composed of 74 items comprising 14 dimensions. DESCRIPTION OF THE GASTROINTESTINAL SYMPTOMS MODULE:
Dimensions Number of Items
Cluster of Items
Reversed Scoring
Direction of Dimensions
Stomach Pain and Hurt
6 1-6 1-6
Higher scores indicate lower problems.
Stomach Discomfort When
Eating
5 1-5 1-5
Food and Drink Limits
6 1-6 1-6
Trouble Swallowing
3 1-3 1-3
Heart Burn and Reflux
4 1-4 1-4
Nausea and Vomiting
4 1-4 1-4
Gas and Bloating 7 1-7 1-7
Constipation 14 1-14 1-14
Blood in Poop (Bowel Movement)
2 1-2 1-2
Diarrhea 7 1-7 1-7
Worry About Going Poop
(Bowel Movements)
5 1-5 1-5
Worry About Stomach Aches
2 1-2 1-2
Medicines 4 1-4 1-4
Communication 5 1-5 1-5
SCORING OF DIMENSIONS:
Item Scaling 5-point Likert scale from 0 (Never) to 4 (Almost always) Weighting of Items No
Extension of the Scoring Scale Scores are transformed to a 0 to 100 scale.
Scoring Procedure
Step 1: Transform Score
Items are reversed scored and linearly transformed to a 0-100 scale as follows: 0=100, 1=75, 2=50, 3=25, 4=0.

PedsQL TM 3.0 Gastrointestinal Symptoms Module
Version 17: May 2017 Page 98 of 150
Step 2: Calculate scores by Dimensions If more than 50% of the items in the scale are missing, the scale scores
should not be computed, Mean score = Sum of the items over the number of items answered.
Symptoms Total Scales Score = Sum of the items over the number of items answered in the 10 Symptoms Scales. Total Score: Sum of all the items over the number of items answered on all the Scales.
Interpretation and Analysis of Missing Data
If more than 50% of the items in the scale are missing, the Scale Scores should not be computed. If 50% or more items are completed: Impute the mean of the completed items in a scale.

PedsQL TM 3.0 Gastrointestinal Symptoms Scales™
Version 17: May 2017 Page 99 of 150
PPeeddssQQLL TTMM 33..00 GGaassttrrooiinntteessttiinnaall SSyymmppttoommss SSccaalleess™™
PARENT Report for Toddlers (ages 2-4)

PedsQL TM 3.0 Gastrointestinal Symptoms Scales™
Version 17: May 2017 Page 100 of 150
The Parent Report for Toddlers (age 2-4) of the PedsQLTM 3.0 Gastrointestinal Symptoms Scales™ is composed of 58 items comprising 10 dimensions. DESCRIPTION OF THE GASTROINTESTINAL SYMPTOMS SCALES™:
Dimensions Number of Items
Cluster of Items
Reversed Scoring
Direction of Dimensions
Stomach Pain and Hurt
6 1-6 1-6
Higher scores indicate lower problems.
Stomach Discomfort When
Eating
5 1-5 1-5
Food and Drink Limits
6 1-6 1-6
Trouble Swallowing
3 1-3 1-3
Heart Burn and Reflux
4 1-4 1-4
Nausea and Vomiting
4 1-4 1-4
Gas and Bloating 7 1-7 1-7
Constipation 14 1-14 1-14
Blood in Poop 2 1-2 1-2
Diarrhea 7 1-7 1-7
SCORING OF DIMENSIONS:
Item Scaling 5-point Likert scale from 0 (Never) to 4 (Almost always) Weighting of Items No
Extension of the Scoring Scale Scores are transformed to a 0 to 100 scale.
Scoring Procedure
Step 1: Transform Score
Items are reversed scored and linearly transformed to a 0-100 scale as follows: 0=100, 1=75, 2=50, 3=25, 4=0. Step 2: Calculate scores by Dimensions If more than 50% of the items in the scale are missing, the scale scores
should not be computed, Mean score = Sum of the items over the number of items answered.
Symptoms Total Scales Score = Sum of the items over the number of items answered in the 10 Symptoms Scales.
Interpretation and Analysis of Missing Data
If more than 50% of the items in the scale are missing, the Scale Scores should not be computed. If 50% or more items are completed: Impute the mean of the completed items in a scale.

PedsQL TM 3.0 Gastrointestinal Symptoms Scales™
Version 17: May 2017 Page 101 of 150
CHILD and PARENT Reports for Young Children (ages 5-7)

PedsQL TM 3.0 Gastrointestinal Symptoms Scales™
Version 17: May 2017 Page 102 of 150
The Child and Parent Reports of the PedsQLTM 3.0 Gastrointestinal Symptoms Scales™ for Young Children (ages 5-7) are composed of 58 items comprising 10 dimensions. DESCRIPTION OF THE GASTROINTESTINAL SYMPTOMS SCALES™:
Dimensions Number of Items
Cluster of Items
Reversed Scoring
Direction of Dimensions
Stomach Pain and Hurt
6 1-6 1-6
Higher scores indicate lower problems.
Stomach Discomfort When
Eating
5 1-5 1-5
Food and Drink Limits
6 1-6 1-6
Trouble Swallowing
3 1-3 1-3
Heart Burn and Reflux
4 1-4 1-4
Nausea and Vomiting
4 1-4 1-4
Gas and Bloating 7 1-7 1-7
Constipation 14 1-14 1-14
Blood in Poop 2 1-2 1-2
Diarrhea 7 1-7 1-7
SCORING OF DIMENSIONS:
Item Scaling 5-point Likert scale from 0 (Never) to 4 (Almost always) 3-point scale: 0 (Not at all), 2 (Sometimes) and 4 (A lot) for the Child Report for Young Children (ages 5-7)
Weighting of Items No
Extension of the Scoring Scale Scores are transformed on a scale from 0 to 100.
Scoring Procedure
Step 1: Transform Score
Items are reversed scored and linearly transformed to a 0-100 scale as follows: 0=100, 1=75, 2=50, 3=25, 4=0 Step 2: Calculate Scores by Dimensions If more than 50% of the items in the scale are missing, the scale scores
should not be computed, Mean score = Sum of the items over the number of items answered.
Symptoms Total Scales Score = Sum of the items over the number of items answered in the 10 Symptoms Scales.
Interpretation and Analysis of Missing Data
If more than 50% of the items in the scale are missing, the Scale Scores should not be computed. If 50% or more items are completed: Impute the mean of the completed items in a scale.
PedsQL TM 3.0 Gastrointestinal Symptoms Scales™
Version 17: May 2017 Page 103 of 150
CHILD and PARENT Reports for Children (ages 8-12), Teens (ages 13-18) and Young Adults (ages 18-25)

PedsQL TM 3.0 Gastrointestinal Symptoms Scales™
Version 17: May 2017 Page 104 of 150
The Child and Parent Reports of the PedsQLTM 3.0 Gastrointestinal Symptoms Scales™ for: - Children (ages 8-12), - Teens (ages 13-18), - Young Adults (ages 18-25)
are composed of 58 items comprising 10 dimensions. DESCRIPTION OF THE GASTROINTESTINAL SYMPTOMS SCALES™:
Dimensions Number of Items
Cluster of Items
Reversed Scoring
Direction of Dimensions
Stomach Pain and Hurt
6 1-6 1-6
Higher scores indicate lower problems.
Stomach Discomfort When
Eating
5 1-5 1-5
Food and Drink Limits
6 1-6 1-6
Trouble Swallowing
3 1-3 1-3
Heart Burn and Reflux
4 1-4 1-4
Nausea and Vomiting
4 1-4 1-4
Gas and Bloating 7 1-7 1-7
Constipation 14 1-14 1-14
Blood in Poop (Bowel Movement)
2 1-2 1-2
Diarrhea 7 1-7 1-7
SCORING OF DIMENSIONS:
Item Scaling 5-point Likert scale from 0 (Never) to 4 (Almost always) Weighting of Items No
Extension of the Scoring Scale Scores are transformed to a 0 to 100 scale.
Scoring Procedure
Step 1: Transform Score
Items are reversed scored and linearly transformed to a 0-100 scale as follows: 0=100, 1=75, 2=50, 3=25, 4=0.
Step 2: Calculate scores by Dimensions If more than 50% of the items in the scale are missing, the scale scores
should not be computed, Mean score = Sum of the items over the number of items answered.
Symptoms Total Scales Score = Sum of the items over the number of items answered in the 10 Symptoms Scales.
Interpretation and Analysis of Missing Data
If more than 50% of the items in the scale are missing, the Scale Scores should not be computed. If 50% or more items are completed: Impute the mean of the completed items in a scale.

PedsQL TM General Well-Being Scale
Version 17: May 2017 Page 105 of 150
PPeeddssQQLL TTMM GGeenneerraall WWeellll--BBeeiinngg SSccaallee
CHILD, ADOLESCENT and YOUNG ADULT Report (ages 8-25 years of age)

PedsQL TM General Well-Being Scale
Version 17: May 2017 Page 106 of 150
The PPeeddssQQLLTTMM GGeenneerraall WWeellll--BBeeiinngg SSccaallee is composed of 6 items for ages 8-25 years of age, and 1 overall General Health item. DESCRIPTION OF THE QUESTIONNAIRE (ages 8-25 years):
Dimensions Number of Items
Cluster of Items
Reversed Scoring
Direction of Dimensions
General Well-Being
6 1-6 No Higher scores indicate better HRQOL.
Dimensions Number of Items
Cluster of Items
Reversed Scoring
Direction of Dimensions
General Health 1 1 No Higher scores indicate better HRQOL.
SCORING OF DIMENSIONS:
Item Scaling 5-point Likert scale from 0 (Never) to 4 (Almost always) Weighting of Items No
Extension of the Scoring Scale
Scores are transformed on a scale from 0 to 100.
Scoring Procedure
Step 1: Transform Score Items are linearly transformed to a 0-100 scale as follows: 0=0, 1=25, 2=50, 3=75, 4=100.
Step 2: Calculate Scores Score by Dimensions: If more than 50% of the items in the scale are missing, the scale score
should not be computed. Mean score = Sum of the items over the number of items answered. The General Health item is not included in the scale score, but is reported
separately.
Interpretation and Analysis of Missing Data
If more than 50% of the items in the scale are missing, the Scale Score should not be computed. If 50% or more items are completed: Impute the mean of the completed items in a scale.

PedsQLTM Healthcare Satisfaction Generic Module
Version 17: May 2017 Page 107 of 150
PPeeddssQQLLTTMM HHeeaalltthhccaarree SSaattiissffaaccttiioonn GGeenneerriicc MMoodduullee

PedsQLTM Healthcare Satisfaction Generic Module
Version 17: May 2017 Page 108 of 150
The PPeeddssQQLLTTMM HHeeaalltthhccaarree SSaattiissffaaccttiioonn GGeenneerriicc MMoodduullee is composed of 24 items comprising 6 dimensions. DESCRIPTION OF THE MODULE:
Dimensions Number of Items
Cluster of Items
Reversed Scoring
Direction of Dimensions
Information 5 1-5
No Higher scores indicate higher satisfaction.
Inclusion of Family 4 1-4
Communication 5 1-5
Technical Skills 3 1-3
Emotional Needs 4 1-4 Overall
Satisfaction 3 1-3
SCORING OF DIMENSIONS:
Item Scaling 5-point Likert scale: 0 (Never) to 4 (Always) and Not Applicable Weighting of items No
Extension of the Scoring Scale Scores are transformed on a scale from 0 to 100.
Scoring Procedure
Step 1: Transform Score Items are scored and linearly transformed to a 0-100 scale as follows: 0=0, 1=25, 2=50, 3=75, 4=100 Step 2: Calculate Scores by Dimensions If 50% or more items are completed, the Mean score = Sum of the
items divided by the number of items answered in the scale, If more than 50% of the items in the scale are missing, the scale scores
should not be computed. Total Score: Mean score = Sum of all the items in all scales divided by the number of items answered on all the scales.
Interpretation and Analysis of Missing Data
If more than 50% of the items in the scale are missing, the Scale Scores should not be computed. If 50% or more items are completed: Impute the mean of the completed items in the scale.

PedsQLTM Healthcare Satisfaction Hematology / Oncology Module
Version 17: May 2017 Page 109 of 150
PPeeddssQQLLTTMM HHeeaalltthhccaarree SSaattiissffaaccttiioonn HHeemmaattoollooggyy // OOnnccoollooggyy MMoodduullee

PedsQLTM Healthcare Satisfaction Hematology / Oncology Module
Version 17: May 2017 Page 110 of 150
The PPeeddssQQLLTTMM HHeeaalltthhccaarree SSaattiissffaaccttiioonn HHeemmaattoollooggyy // OOnnccoollooggyy MMoodduullee is composed of 25 items comprising 6 dimensions. DESCRIPTION OF THE MODULE:
Dimensions Number of Items
Cluster of Items
Reversed Scoring
Direction of Dimensions
General Satisfaction 3 1-3
No Higher scores indicate higher satisfaction.
Information 5 1-5 Inclusion of Family 4 1-4
Communication 5 1-5 Technical Skills 4 1-4
Emotional Needs 4 1-4 SCORING OF DIMENSIONS:
Item Scaling 5-point Likert scale: 1 (Very dissatisfied) to 5 (Very satisfied) Weighting of Items No
Extension of the Scoring Scale Scores are transformed on a scale from 0 to 100
Scoring Procedure
Step 1: Transform Score Items are scored and linearly transformed to a 0-100 scale as follows: 1=0, 2=25, 3=50, 4=75, 5=100. Step 2: Calculate Scores by Dimensions If 50% or more items are completed, the Mean score = Sum of the
items divided by the number of items answered in the scale, If more than 50% of the items in the scale are missing, the scale scores
should not be computed. Total Score: Mean score = Sum of all the items in all scales divided by the number of items answered on all the scales.
Interpretation and Analysis of Missing Data
If more than 50% of the items in the scale are missing, the Scale Scores should not be computed. If 50% or more items are completed: Impute the mean of the completed items in the scale.

PedsQL TM Infant Scales
Version 17: May 2017 Page 111 of 150
PPeeddssQQLL TTMM IInnffaanntt SSccaalleess
PARENT Report for Infants (ages 1-24 months)

PedsQL TM Infant Scales
Version 17: May 2017 Page 112 of 150
The Parent Report for Infants (ages 1-24 months) of the PPeeddssQQLLTTMM IInnffaanntt SSccaalleess is composed of 36 items for infants ages 1-12 months and 45 items for infants ages 13-24 months comprising 5 dimensions. DESCRIPTION OF THE QUESTIONNAIRE (INFANTS 1-12 MONTHS):
Dimensions Number of Items
Cluster of Items
Reversed Scoring
Direction of Dimensions
Physical Functioning
6 1-6 1-6
Higher scores indicate better HRQOL.
Physical Symptoms
10 1-10 1-10
Emotional Functioning
12 1-12 1-12
Social Functioning
4 1-4 1-4
Cognitive Functioning
4 1-4 1-4
DESCRIPTION OF THE QUESTIONNAIRE (INFANTS 13-24 MONTHS):
Dimensions Number of Items
Cluster of Items
Reversed Scoring
Direction of Dimensions
Physical Functioning
9 1-9 1-9
Higher scores indicate better HRQOL.
Physical Symptoms
10 1-10 1-10
Emotional Functioning
12 1-12 1-12
Social Functioning
5 1-5 1-5
Cognitive Functioning
9 1-9 1-9
SCORING OF DIMENSIONS:
Item Scaling 5-point Likert scale from 0 (Never) to 4 (Almost always) Weighting of Items No
Extension of the Scoring Scale
Scores are transformed on a scale from 0 to 100.

PedsQL TM Infant Scales
Version 17: May 2017 Page 113 of 150
Scoring Procedure
Step 1: Transform Score Items are reversed scored and linearly transformed to a 0-100 scale as follows: 0=100, 1=75, 2=50, 3=25, 4=0.
Step 2: Calculate Scores Score by Dimensions: If more than 50% of the items in the scale are missing, the scale scores
should not be computed. Mean score = Sum of the items over the number of items answered. Psychosocial Health Summary Score = Sum of the items over the number of items answered in the Emotional, Social, and Cognitive Functioning Scales. Physical Health Summary Score = Sum of the items over the number of items answered in the Physical Functioning and Physical Symptoms Scales. Total Score: Sum of all the items over the number of items answered on all the Scales.
Interpretation and Analysis of Missing Data
If more than 50% of the items in the scale are missing, the Scale Scores should not be computed. If 50% or more items are completed: Impute the mean of the completed items in a scale.

PedsQL TM Multidimensional Fatigue Scale
Version 17: May 2017 Page 114 of 150
PPeeddssQQLL TTMM MMuullttiiddiimmeennssiioonnaall FFaattiigguuee SSccaallee

PedsQL TM Multidimensional Fatigue Scale
Version 17: May 2017 Page 115 of 150
The PPeeddssQQLLTTMM MMuullttiiddiimmeennssiioonnaall FFaattiigguuee SSccaallee is composed of 18 items comprising 3 dimensions. DESCRIPTION OF THE MULTIDIMENSIONAL FATIGUE MODULE:
Dimensions Number of Items
Cluster of Items
Reversed Scoring
Direction of Dimensions
General Fatigue 6 1-6 1-6
Higher scores indicate lower problems.
Sleep/Rest Fatigue
6 1-6 1-6
Cognitive Fatigue 6 1-6 1-6
SCORING OF DIMENSIONS:
Item Scaling 5-point Likert scale from 0 (Never) to 4 (Almost always) 3-point scale: 0 (Not at all), 2 (Sometimes) and 4 (A lot) for the Child Report for Young Children (ages 5-7)
Weighting of Items No
Extension of the Scoring Scale Scores are transformed on a scale from 0 to 100.
Scoring Procedure
Step 1: Transform Score Items are reversed scored and linearly transformed to a 0-100 scale as follows: 0=100, 1=75, 2=50, 3=25, 4=0. Step 2: Calculate Scores by Dimensions If more than 50% of the items in the scale are missing, the scale scores
should not be computed, Mean score= Sum of the items over the number of items answered. Total Score: Sum of all the items over the number of items answered on all the Scales
Interpretation and Analysis of Missing Data
If more than 50% of the items in the scale are missing, the Scale Scores should not be computed. If 50% or more items are completed: Impute the mean of the completed items in a scale.

Version 17: May 2017 Page 116 of 150
PPeeddssQQLL TTMM 33..00 NNeeuurrooffiibbrroommaattoossiiss MMoodduullee
CHILD and PARENT Reports for Young Children (ages 5-7), Children (ages 8-12), Teens (ages 13-18), Young Adults (ages
18-25), and Adults (ages over 26)

PedsQL TM 3.0 Neurofibromatosis Module
Version 17: May 2017 Page 117 of 150
The Child and Parent Reports of the PedsQLTM 3.0 Neurofibromatosis Module for: - Young Children (ages 5-7) - Children (ages 8-12), - Teens (ages 13-18), - Young Adults (ages 18-25), - Adults (ages over 26)
are composed of 104 items comprising 18 dimensions. DESCRIPTION OF THE NEUROFIBROMATOSIS MODULE:
Dimensions Number of Items
Cluster of Items
Reversed Scoring
Direction of Dimensions
Skin Itch Bother 6 1-6 1-6
Higher scores indicate lower problems.
Skin Sensations 3 1-3 1-3
Pain 6 1-6 1-6
Pain Impact 16 1-16 1-16
Pain Management 2 1-2 1-2
Cognitive Functioning
15 1-15 1-15
Speech 4 1-4 1-4
Fine Motor 6 1-6 1-6
Balance 5 1-5 1-5
Vision 5 1-5 1-5
Perceived Physical
Appearance
3 1-3 1-3
Communication 6 1-6 1-6
Worry 10 1-10 1-10
Treatment 6 1-6 1-6
Medicines 3 1-3 1-3
Stomach Discomfort
3 1-3 1-3
Constipaton 3 1-3 1-3
Diarrhea 2 1-2 1-2
SCORING OF DIMENSIONS:

PedsQL TM 3.0 Neurofibromatosis Module
Version 17: May 2017 Page 118 of 150
Item Scaling 5-point Likert scale from 0 (Never) to 4 (Almost always) 3-point scale: 0 (Not at all), 2 (Sometimes) and 4 (A lot) for the Young Child (ages 5-7) child report
Weighting of Items No
Extension of the Scoring Scale Scores are transformed on a scale from 0 to 100.
Scoring Procedure
Step 1: Transform Score Items are reversed scored and linearly transformed to a 0-100 scale as follows: 0=100, 1=75, 2=50, 3=25, 4=0. Step 2: Calculate Scores by Dimensions If more than 50% of the items in the scale are missing, the
scale scores should not be computed, Mean score = Sum of the items over the number of items
answered. Total Score: Sum of all the items over the number of items answered on all the Scales.
Interpretation and Analysis of Missing Data
If more than 50% of the items in the scale are missing, the Scale Scores should not be computed. If 50% or more items are completed: Impute the mean of the completed items in a scale.

Version 17: May 2017 Page 119 of 150
PPeeddssQQLL TTMM 33..00 NNeeuurroommuussccuullaarr MMoodduullee

PedsQL TM 3.0 Neuromuscular Module
Version 17: May 2017 Page 120 of 150
Child and Parent Reports of the PPeeddssQQLLTTMM 33..00 NNeeuurroommuussccuullaarr MMoodduullee for: - Children (ages 8-12), - And Teens (ages 13-18),
are composed of 25 items comprising 3 dimensions. - Young Child Report (ages 5-7) only consists of the 17-item About My Neuromuscular Disease
Scale, Parent Report for ages 2-18 includes all 3 dimensions and all 25 items, DESCRIPTION OF THE NEUROMUSCULAR MODULE:
Dimensions Number of Items
Cluster of Items
Reversed Scoring Direction of Dimensions
About My Neuromuscular Disease
17 1-17 1-17
Higher scores indicate lower problems. Communication 3 1-3 1-3
About Our Family Resources
5 1-5 1-5
SCORING OF DIMENSIONS:
Item Scaling 5-point Likert scale from 0 (Never) to 4 (Almost always) Weighting of Items No
Extension of the Scoring Scale Scores are transformed on a scale from 0 to 100.
Scoring Procedure
Step 1: Transform Score Items are reversed scored and linearly transformed to a 0-100 scale as follows: 0=100, 1=75, 2=50, 3=25, 4=0. Step 2: Calculate Scores by Dimensions If more than 50% of the items in the scale are missing, the scale scores
should not be computed, Mean score = Sum of the items over the number of items answered. Total Score: Sum of all the items over the number of items answered on all the Scales.
Interpretation and Analysis of missing data
If more than 50% of the items in the scale are missing, the Scale Scores should not be computed. If 50% or more items are completed: Impute the mean of the completed items in a scale.

PedsQL TM Oral Health Scale
Version 17: May 2017 Page 121 of 150
PPeeddssQQLL TTMM OOrraall HHeeaalltthh SSccaallee

PedsQL TM Oral Health Scale
Version 17: May 2017 Page 122 of 150
The PPeeddssQQLLTTMM OOrraall HHeeaalltthh SSccaallee is composed of 5 items comprising 1 dimension. DESCRIPTION OF THE ORAL HEALTH SCALE:
Dimensions Number of Items
Cluster of Items
Reversed Scoring
Direction of Dimensions
Oral Health 5 1-5 1-5 Higher scores indicate lower problems
SCORING OF DIMENSIONS:
Item Scaling 5-point Likert scale from 0 (Never) to 4 (Almost always) 3-point scale: 0 (Not at all), 2 (Sometimes) and 4 (A lot) for the Child Report for Young Children (ages 5-7)
Weighting of Items No
Extension of the Scoring Scale Scores are transformed on a scale from 0 to 100.
Scoring Procedure
Step 1: Transform Score Items are reversed scored and linearly transformed to a 0-100 scale as follows: 0=100, 1=75, 2=50, 3=25, 4=0. Step 2: Calculate Total Score Sum of all the items over the number of items answered
Interpretation and Analysis of Missing Data
If more than 50% of the items in the scale are missing, the Scale Score should not be computed. If 50% or more items are completed: Impute the mean of the completed items in a scale.

PedsQL TM Pediatric Pain Coping InventoryTM (PPCI)
Version 17: May 2017 Page 123 of 150
PPeeddssQQLL TTMM PPeeddiiaattrriicc PPaaiinn CCooppiinngg IInnvveennttoorryyTTMM
((PPPPCCII))
PARENT Report for Children and Teens (ages 5-18), CHILD Report for Children (ages 5-12), Teens (ages 13-18)

PedsQL TM Pediatric Pain Coping InventoryTM (PPCI)
Version 17: May 2017 Page 124 of 150
The Parent Report of the PPeeddssQQLLTTMM PPeeddiiaattrriicc PPaaiinn CCooppiinngg IInnvveennttoorryy™™ for Children (ages 5-12) and Teens (ages 13-18) is composed of 41 items comprising 5 dimensions. The Child Reports of the PPeeddssQQLLTTMM PPeeddiiaattrriicc PPaaiinn CCooppiinngg IInnvveennttoorryy™™ for: - Children (ages 5-12) - And teens (ages 13-18) are composed of 41 items comprising 5 dimensions. See Varni, J.W. et al. (1996). Development of the Waldron/Varni Pediatric Pain Coping Inventory. Pain, 67, 141-150, for scoring instructions for the a priori and empirically-derived scale scores. DESCRIPTION OF THE PEDIATRIC PAIN COPING INVENTORY:
Dimensions Number of Items
Cluster of Items
Reversed Scoring
Direction of Dimensions
Cognitive Self-Instruction
7 12, 22, 23, 24, 31, 32, 40
No
Higher scores indicate greater use of the coping
strategy.
Problem-Solving 10 1, 2, 11, 15,
26, 27, 30, 33, 34, 35
Distraction 9 6, 8, 9, 10, 14, 16, 17, 18, 19
Seeks Social Support 9 3, 4, 7, 13, 28,
29, 37, 38 ,39 Catastrophizing /
Helplessness 6 5, 20, 21, 25, 36, 41
SCORING OF DIMENSIONS:
Item Scaling 3-point Likert scale from 0 (Never) to 2 (Often) Weighting of Items No
Extension of the Scoring Scale Scores are transformed on a scale from 0 to 2.
Scoring Procedure Calculate Scale Scores Sum of all the items over the number of items answered for each Scale.
Interpretation and Analysis of Missing Data
If more than 50% of the items in the scale are missing, the Scale Scores should not be computed. If 50% or more items are completed: Impute the mean of the completed items in a scale.

PedsQL TM Pediatric Pain Questionnaire TM (PPQ)
Version 17: May 2017 Page 125 of 150
PPeeddssQQLL TTMM PPeeddiiaattrriicc PPaaiinn QQuueessttiioonnnnaaiirree TTMM ((PPPPQQ))

PedsQL TM Pediatric Pain Questionnaire TM (PPQ)
Version 17: May 2017 Page 126 of 150
The PPeeddssQQLLTTMM PPeeddiiaattrriicc PPaaiinn QQuueessttiioonnnnaaiirree™™ is composed of 3 items. DESCRIPTION OF THE QUESTIONNAIRE:
Dimensions Number of Items
Cluster of Items
Reversed Scoring
Direction of Dimensions
Present Pain 1 1
No Higher score = higher pain intensity. Worst Pain 1 2
The third item refers to the localisation of pain and is not scored. SCORING OF DIMENSIONS:
Item Scaling 10cm (100mm) VAS scales from 0 (Not hurting / No discomfort / No pain) to 10 (100) (Hurting a whole lot / Very uncomfortable / Severe pain)
Weighting of Items No
Extension of the Scoring Scale 0-10cm or 0-100mm
Scoring Procedure Present pain and worst pain are scored separately. The score is based on line length to the nearest 0.5 cm (5mm).
Interpretation and Analysis of Missing Data There is no imputation process since these are single item VAS scales.

PedsQL TM Present Functioning Visual Analogue Scale (PedsQL TM VAS)
Version 17: May 2017 Page 127 of 150
PPeeddssQQLL TTMM PPrreesseenntt FFuunnccttiioonniinngg VViissuuaall AAnnaalloogguuee SSccaallee ((PPeeddssQQLL TTMM VVAASS))
CHILD and PARENT reports for CHILD (ages 5-18)

PedsQL TM Present Functioning Visual Analogue Scale (PedsQL TM VAS)
Version 17: May 2017 Page 128 of 150
The PPeeddssQQLLTTMM PPrreesseenntt FFuunnccttiioonniinngg VViissuuaall AAnnaalloogguuee SSccaallee is composed of 6 items. DESCRIPTION OF THE SCALE:
Dimensions Number of Items
Cluster of Items
Reversed Scoring
Direction of Dimensions
Present Functioning
6 1-6 No Higher score = higher distress or intensity.
SCORING OF DIMENSIONS:
Item Scaling 100mm VAS scales from 0 to 100 Weighting of Items No
Extension of the Scoring Scale 0-100
Scoring Procedure - PedsQL VAS Total Symptom Score = average of all six items - PedsQL VAS Emotional Distress Summary Score = mean of the
anxiety, sadness, anger, and worry items Interpretation and Analysis of Missing Data There is no imputation process since these are single item VAS scales.

PedsQL TM 3.0 Rheumatology Module
Version 17: May 2017 Page 129 of 150
PPeeddssQQLL TTMM 33..00 RRhheeuummaattoollooggyy MMoodduullee
PARENT Report for Toddlers (ages 2-4)

PedsQL TM 3.0 Rheumatology Module
Version 17: May 2017 Page 130 of 150
The Parent Report for Toddlers (age 2-4) of the PPeeddssQQLLTTMM 33..00 RRhheeuummaattoollooggyy MMoodduullee is composed of 14 items comprising 3 dimensions. DESCRIPTION OF THE RHEUMATOLOGY MODULE:
Dimensions Number of Items
Cluster of Items
Reversed Scoring
Direction of Dimensions
Pain and Hurt 4 1-4 1-4
Higher scores indicate lower problems. Daily Activities 5 1-5 1-5
Treatment 5 1-5 1-5
SCORING OF DIMENSIONS:
Item Scaling 5-point Likert scale from 0 (Never) to 4 (Almost always) Weighting of Items No
Extension of the Scoring Scale Scores are transformed to a 0 to 100 scale.
Scoring Procedure
Step 1: Transform Score
Items are reversed scored and linearly transformed to a 0-100 scale as follows: 0=100, 1=75, 2=50, 3=25, 4=0. Step 2: Calculate Scores by Dimensions If more than 50% of the items in the scale are missing, the scale scores
should not be computed, Mean score = Sum of the items over the number of items answered.
There is no Total Score
Interpretation and Analysis of Missing Data
If more than 50% of the items in the scale are missing, the Scale Scores should not be computed. If 50% or more items are completed: Impute the mean of the completed items in a scale.

PedsQL TM 3.0 Rheumatology Module
Version 17: May 2017 Page 131 of 150
CHILD and PARENT reports for Young Children (ages 5-7)

PedsQL TM 3.0 Rheumatology Module
Version 17: May 2017 Page 132 of 150
The Child and Parent Reports of the PPeeddssQQLLTTMM 33..00 RRhheeuummaattoollooggyy MMoodduullee ffoorr Young Children (ages 5-7) are composed of 20 items comprising 5 dimensions. DESCRIPTION OF THE RHEUMATOLOGY MODULE:
Dimensions Number of Items
Cluster of Items
Reversed Scoring
Direction of Dimensions
Pain and Hurt 4 1-4 1-4
Higher scores indicate lower problems.
Daily Activities 5 1-5 1-5
Treatment 5 1-5 1-5
Worry 3 1-3 1-3
Communication 3 1-3 1-3
SCORING OF DIMENSIONS:
Item Scaling 5-point Likert scale from 0 (Never) to 4 (Almost always) 3-point scale: 0 (Not at all), 2 (Sometimes) and 4 (A lot) for the child report for Young Children (ages 5-7)
Weighting of Items No
Extension of the Scoring Scale Scores are transformed on a scale from 0 to 100.
Scoring Procedure
Step 1: Transform Score Items are reversed scored and linearly transformed to a 0-100 scale as follows: 0=100, 1=75, 2=50, 3=25, 4=0. Step 2: Calculate Scores by Dimensions If more than 50% of the items in the scale are missing, the scale scores
should not be computed, Mean score = Sum of the items over the number of items answered.
There is no Total Score
Interpretation and Analysis of Missing Data
If more than 50% of the items in the scale are missing, the Scale Scores should not be computed. If 50% or more items are completed: Impute the mean of the completed items in a scale.

PedsQL TM 3.0 Rheumatology Module
Version 17: May 2017 Page 133 of 150
CHILD and PARENT reports for Children (ages 8-12) and Teens (ages 13-18)

PedsQL TM 3.0 Rheumatology Module
Version 17: May 2017 Page 134 of 150
The Child and Parent Reports of the PPeeddssQQLLTTMM 33..00 RRhheeuummaattoollooggyy MMoodduullee ffoorr:: - Children (ages 8-12), - And Teens (ages 13-18)
are composed of 22 items comprising 5 dimensions. DESCRIPTION OF THE RHEUMATOLOGY MODULE:
Dimensions Number of Items
Cluster of Items
Reversed Scoring
Direction of Dimensions
Pain and Hurt 4 1-4 1-4
Higher scores indicate lower problems.
Daily Activities 5 1-5 1-5
Treatment 7 1-5 1-5
Worry 3 1-3 1-3
Communication 3 1-3 1-3
SCORING OF DIMENSIONS:
Item Scaling 5-point Likert scale from 0 (Never) to 4 (Almost always) Weighting of Items No
Extension of the Scoring Scale Scores are transformed on a scale from 0 to 100.
Scoring Procedure
Step 1: Transform Score Items are reversed scored and linearly transformed to a 0-100 scale as follows: 0=100, 1=75, 2=50, 3=25, 4=0. Step 2: Calculate Scores by Dimensions If more than 50% of the items in the scale are missing, the scale scores
should not be computed, Mean score = Sum of the items over the number of items answered.
There is no Total Score
Interpretation and Analysis of Missing Data
If more than 50% of the items in the scale are missing, the Scale Scores should not be computed. If 50% or more items are completed: Impute the mean of the completed items in a scale.

PedsQL TM 3.0 Sickle Cell Disease Module
Version 17: May 2017 Page 135 of 150
PPeeddssQQLL TTMM 33..00 SSiicckkllee CCeellll DDiisseeaassee MMoodduullee
PARENT Report for Toddlers (ages 2-4)

PedsQL TM 3.0 Sickle Cell Disease Module
Version 17: May 2017 Page 136 of 150
The Parent Report for Toddlers (age 2-4) of the PedsQLTM 3.0 Sickle Cell Disease Module is composed of 42 items comprising 9 dimensions. DESCRIPTION OF THE SICKLE CELL DISEASE MODULE:
Dimensions Number of Items
Cluster of Items
Reversed Scoring
Direction of Dimensions
Pain and Hurt 9 1-9 1-9
Higher scores indicate lower problems.
Pain Impact 10 1-10 1-10
Pain Management 2 1-2 1-2
Worry I 5 1-5 1-5
Worry II 2 1-2 1-2
Emotions 2 1-2 1-2
Treatment 6 1-6 1-6
Communication I 3 1-3 1-3
Communication II 3 1-3 1-3
SCORING OF DIMENSIONS:
Item Scaling 5-point Likert scale from 0 (Never) to 4 (Almost always) Weighting of Items No
Extension of the Scoring Scale Scores are transformed to a 0 to 100 scale.
Scoring Procedure
Step 1: Transform Score
Items are reversed scored and linearly transformed to a 0-100 scale as follows: 0=100, 1=75, 2=50, 3=25, 4=0. Step 2: Calculate scores by Dimensions If more than 50% of the items in the scale are missing, the scale scores
should not be computed. Mean score = Sum of the items over the number of items answered.
Total Score: Sum of all the items over the number of items answered on all the Scales.
Interpretation and Analysis of Missing Data
If more than 50% of the items in the scale are missing, the Scale Scores should not be computed. If 50% or more items are completed: Impute the mean of the completed items in a scale.

PedsQL TM 3.0 Sickle Cell Disease Module
Version 17: May 2017 Page 137 of 150
CHILD and PARENT Reports for Young Children (ages 5-7)
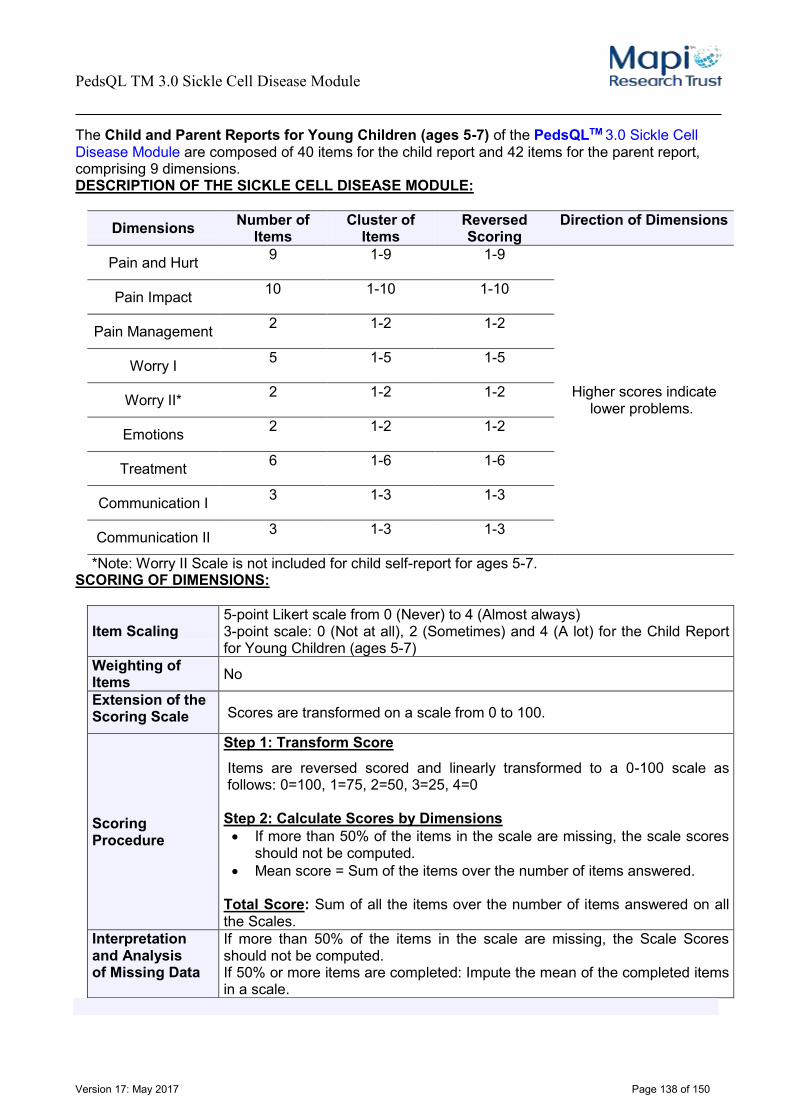
PedsQL TM 3.0 Sickle Cell Disease Module
Version 17: May 2017 Page 138 of 150
The Child and Parent Reports for Young Children (ages 5-7) of the PedsQLTM 3.0 Sickle Cell Disease Module are composed of 40 items for the child report and 42 items for the parent report, comprising 9 dimensions. DESCRIPTION OF THE SICKLE CELL DISEASE MODULE:
Dimensions Number of Items
Cluster of Items
Reversed Scoring
Direction of Dimensions
Pain and Hurt 9 1-9 1-9
Higher scores indicate lower problems.
Pain Impact 10 1-10 1-10
Pain Management 2 1-2 1-2
Worry I 5 1-5 1-5
Worry II* 2 1-2 1-2
Emotions 2 1-2 1-2
Treatment 6 1-6 1-6
Communication I 3 1-3 1-3
Communication II 3 1-3 1-3
*Note: Worry II Scale is not included for child self-report for ages 5-7. SCORING OF DIMENSIONS:
Item Scaling 5-point Likert scale from 0 (Never) to 4 (Almost always) 3-point scale: 0 (Not at all), 2 (Sometimes) and 4 (A lot) for the Child Report for Young Children (ages 5-7)
Weighting of Items No
Extension of the Scoring Scale Scores are transformed on a scale from 0 to 100.
Scoring Procedure
Step 1: Transform Score
Items are reversed scored and linearly transformed to a 0-100 scale as follows: 0=100, 1=75, 2=50, 3=25, 4=0 Step 2: Calculate Scores by Dimensions If more than 50% of the items in the scale are missing, the scale scores
should not be computed. Mean score = Sum of the items over the number of items answered.
Total Score: Sum of all the items over the number of items answered on all the Scales.
Interpretation and Analysis of Missing Data
If more than 50% of the items in the scale are missing, the Scale Scores should not be computed. If 50% or more items are completed: Impute the mean of the completed items in a scale.

PedsQL TM 3.0 Sickle Cell Disease Module
Version 17: May 2017 Page 139 of 150
CHILD and PARENT Reports for Children (ages 8-12),Teens (ages 13-18), Young Adults (ages 18-25), and Adults (ages over
26)

PedsQL TM 3.0 Sickle Cell Disease Module
Version 17: May 2017 Page 140 of 150
The Child and Parent Reports of the PedsQLTM 3.0 Sickle Cell Disease Module for: - Children (ages 8-12) - Teens (ages 13-18) - Young Adults (ages 18-25) - And Adults (ages over 26) are composed of 43 items comprising 9 dimensions. DESCRIPTION OF THE SICKLE CELL DISEASE MODULE:
Dimensions Number of Items
Cluster of Items
Reversed Scoring
Direction of Dimensions
Pain and Hurt 9 1-9 1-9
Higher scores indicate lower problems.
Pain Impact 10 1-10 1-10
Pain Management 2 1-2 1-2
Worry I 5 1-5 1-5
Worry II 2 1-2 1-2
Emotions 2 1-2 1-2
Treatment 7 1-7 1-7
Communication I 3 1-3 1-3
Communication II 3 1-3 1-3
SCORING OF DIMENSIONS:
Item Scaling 5-point Likert scale from 0 (Never) to 4 (Almost always) Weighting of Items No
Extension of the Scoring Scale Scores are transformed on a scale from 0 to 100.
Scoring Procedure
Step 1: Transform Score
Items are reversed scored and linearly transformed to a 0-100 scale as follows: 0=100, 1=75, 2=50, 3=25, 4=0 Step 2: Calculate Scores by Dimensions If more than 50% of the items in the scale are missing, the scale scores
should not be computed. Mean score = Sum of the items over the number of items answered.
Total Score: Sum of all the items over the number of items answered on all the Scales.
Interpretation and Analysis of Missing Data
If more than 50% of the items in the scale are missing, the Scale Scores should not be computed. If 50% or more items are completed: Impute the mean of the completed items in a scale.

PedsQL TM 1.0 Stem Cell Transplant Module
Version 17: May 2017 Page 141 of 150
PPeeddssQQLL TTMM 11..00 SStteemm CCeellll TTrraannssppllaanntt MMoodduullee
PARENT Report for Toddlers (ages 2-4)

PedsQL TM 1.0 Stem Cell Transplant Module
Version 17: May 2017 Page 142 of 150
The Parent Report for Toddlers (age 2-4) of the PedsQLTM 1.0 Stem Cell Transplant Module is composed of 31 items comprising 8 dimensions. DESCRIPTION OF THE STEM CELL TRANSPLANT MODULE:
Dimensions Number of Items
Cluster of Items
Reversed Scoring
Direction of Dimensions
Pain and Hurt 2 1-2 1-2
Higher scores indicate lower problems.
Fatigue and Sleep 5 1-5 1-5
Nausea 4 1-4 1-4
Worry 2 1-2 1-2
Nutrition 5 1-5 1-5
Thinking 4 1-4 1-4
Communication 3 1-3 1-3
Other Complaints 6 1-6 1-6
SCORING OF DIMENSIONS:
Item Scaling 5-point Likert scale from 0 (Never) to 4 (Almost always) Weighting of Items No
Extension of the Scoring Scale Scores are transformed to a 0 to 100 scale.
Scoring Procedure
Step 1: Transform Score
Items are reversed scored and linearly transformed to a 0-100 scale as follows: 0=100, 1=75, 2=50, 3=25, 4=0. Step 2: Calculate scores by Dimensions If more than 50% of the items in the scale are missing, the scale scores
should not be computed. Mean score = Sum of the items over the number of items answered.
Total Score: Sum of all the items over the number of items answered on all the Scales.
Interpretation and Analysis of Missing Data
If more than 50% of the items in the scale are missing, the Scale Scores should not be computed. If 50% or more items are completed: Impute the mean of the completed items in a scale.

PedsQL TM 1.0 Stem Cell Transplant Module
Version 17: May 2017 Page 143 of 150
PARENT Report for Young Children (ages 5-7)

PedsQL TM 1.0 Stem Cell Transplant Module
Version 17: May 2017 Page 144 of 150
The Parent Report for Young Children (ages 5-7) of the PedsQLTM 1.0 Stem Cell Transplant Module is composed of 39 items comprising 8 dimensions. DESCRIPTION OF THE STEM CELL TRANSPLANT MODULE:
Dimensions Number of Items
Cluster of Items
Reversed Scoring
Direction of Dimensions
Pain and Hurt 2 1-2 1-2
Higher scores indicate lower problems.
Fatigue and Sleep 5 1-5 1-5
Nausea 4 1-4 1-4
Worry 10 1-10 1-10
Nutrition 5 1-5 1-5
Thinking 4 1-4 1-4
Communication 3 1-3 1-3
Other Complaints 6 1-6 1-6
SCORING OF DIMENSIONS:
Item Scaling 5-point Likert scale from 0 (Never) to 4 (Almost always) Weighting of Items No
Extension of the Scoring Scale Scores are transformed on a scale from 0 to 100.
Scoring Procedure
Step 1: Transform Score
Items are reversed scored and linearly transformed to a 0-100 scale as follows: 0=100, 1=75, 2=50, 3=25, 4=0 Step 2: Calculate Scores by Dimensions If more than 50% of the items in the scale are missing, the scale scores
should not be computed. Mean score = Sum of the items over the number of items answered.
Total Score: Sum of all the items over the number of items answered on all the Scales.
Interpretation and Analysis of Missing Data
If more than 50% of the items in the scale are missing, the Scale Scores should not be computed. If 50% or more items are completed: Impute the mean of the completed items in a scale.

PedsQL TM 1.0 Stem Cell Transplant Module
Version 17: May 2017 Page 145 of 150
CHILD and PARENT Reports for Children (ages 8-12)

PedsQL TM 1.0 Stem Cell Transplant Module
Version 17: May 2017 Page 146 of 150
The Child and Parent Reports for Children (ages 8-12) of the PedsQLTM 1.0 Stem Cell Transplant Module are composed of 39 items comprising 8 dimensions. DESCRIPTION OF THE STEM CELL TRANSPLANT MODULE:
Dimensions Number of Items
Cluster of Items
Reversed Scoring
Direction of Dimensions
Pain and Hurt 2 1-2 1-2
Higher scores indicate lower problems.
Fatigue and Sleep 5 1-5 1-5
Nausea 4 1-4 1-4
Worry 10 1-10 1-10
Nutrition 5 1-5 1-5
Thinking 4 1-4 1-4
Communication 3 1-3 1-3
Other Complaints 6 1-6 1-6
SCORING OF DIMENSIONS:
Item Scaling 5-point Likert scale from 0 (Never) to 4 (Almost always) Weighting of Items No
Extension of the Scoring Scale Scores are transformed on a scale from 0 to 100.
Scoring Procedure
Step 1: Transform Score
Items are reversed scored and linearly transformed to a 0-100 scale as follows: 0=100, 1=75, 2=50, 3=25, 4=0 Step 2: Calculate Scores by Dimensions If more than 50% of the items in the scale are missing, the scale scores
should not be computed. Mean score = Sum of the items over the number of items answered.
Total Score: Sum of all the items over the number of items answered on all the Scales.
Interpretation and Analysis of Missing Data
If more than 50% of the items in the scale are missing, the Scale Scores should not be computed. If 50% or more items are completed: Impute the mean of the completed items in a scale.

PedsQL TM 1.0 Stem Cell Transplant Module
Version 17: May 2017 Page 147 of 150
TEEN and PARENT Reports for Teens (ages 13-18)

PedsQL TM 1.0 Stem Cell Transplant Module
Version 17: May 2017 Page 148 of 150
The Teen and Parent Reports for Teens (ages 13-18) of the PedsQLTM 1.0 Stem Cell Transplant Module are composed of 41 items comprising 8 dimensions. DESCRIPTION OF THE STEM CELL TRANSPLANT MODULE:
Dimensions Number of Items
Cluster of Items
Reversed Scoring
Direction of Dimensions
Pain and Hurt 2 1-2 1-2
Higher scores indicate lower problems.
Fatigue and Sleep 5 1-5 1-5
Nausea 4 1-4 1-4
Worry 12 1-12 1-12
Nutrition 5 1-5 1-5
Thinking 4 1-4 1-4
Communication 3 1-3 1-3
Other Complaints 6 1-6 1-6
SCORING OF DIMENSIONS:
Item Scaling 5-point Likert scale from 0 (Never) to 4 (Almost always) Weighting of Items No
Extension of the Scoring Scale Scores are transformed on a scale from 0 to 100.
Scoring Procedure
Step 1: Transform Score
Items are reversed scored and linearly transformed to a 0-100 scale as follows: 0=100, 1=75, 2=50, 3=25, 4=0 Step 2: Calculate Scores by Dimensions If more than 50% of the items in the scale are missing, the scale scores
should not be computed. Mean score = Sum of the items over the number of items answered.
Total Score: Sum of all the items over the number of items answered on all the Scales.
Interpretation and Analysis of Missing Data
If more than 50% of the items in the scale are missing, the Scale Scores should not be computed. If 50% or more items are completed: Impute the mean of the completed items in a scale.

PedsQL TM 3.0 Transplant Module
Version 17: May 2017 Page 149 of 150
PPeeddssQQLL TTMM 33..00 TTrraannssppllaanntt MMoodduullee

PedsQL TM 3.0 Transplant Module
Version 17: May 2017 Page 150 of 150
The PedsQLTM 3.0 Transplant Module is composed of 46 items comprising 8 dimensions. DESCRIPTION OF THE TRANSPLANT MODULE:
Dimensions Number of Items
Cluster of Items
Reversed Scoring
Direction of Dimensions
About My Medicines I 9 1-9 1-9
Higher scores indicate lower problems.
About My Medicines II 8 1-8 1-8
My Transplant and Others 8 1-8 1-8
Pain and Hurt 3 1-3 1-3
Worry 7 1-7 1-7
Treatment Anxiety 4 1-4 1-4
How I Look 3 1-3 1-3
Communication 4 1-4 1-4
SCORING OF DIMENSIONS:
Item Scaling 5-point scale from 0 (Never) to 4 (Almost always) 3-point scale: 0 (Not at all), 2 (Sometimes) and 4 (A lot) for the Child Report for Young Children (ages 5-7)
Weighting of Items No
Extension of the Scoring Scale Scores are transformed on a scale from 0 to 100.
Scoring Procedure
Step 1: Transform Score Items are reversed scored and linearly transformed to a 0-100 scale as follows: 0=100, 1=75, 2=50, 3=25, 4=0. Step 2: Calculate scores by Dimension If more than 50% of the items in the scale are missing, the scale scores
should not be computed, Mean score = Sum of the items over the number of items answered. Total Score: Sum of all the items over the number of items answered on all the Scales.
Interpretation and Analysis of Missing Data
If more than 50% of the items in the scale are missing, the Scale Scores should not be computed. If 50% or more items are completed: Impute the mean of the completed items in a scale.