scanning electron microscopic investigations of … · ground improvement techniques have been...
TRANSCRIPT

GTE - 23
SCANNING ELECTRON MICROSCOPIC INVESTIGATIONS OF CEMENT STABILIZED SOIL
Supakij Nontananandh1
Thakon Yoobanpot 2
Sanupong Boonyong 3
1Associate Professor,Dept.of Civil Engineering, Kasetsart University, [email protected]
2Engineer, Resource Engineering Consultants,Co.Ltd.,[email protected] 3Engineer, Toyo-Thai Corporation Co.Ltd.,[email protected]
ABSTRACT : This research aimed at investigation on microstructures of a cement-stabilized soil in order to elucidate their changes in relation to consequent improvement on engineering properties such as strength and permeability. A soil used in this study was soft marine clay with moderate natural moisture content. The average remolded strength of the soil was within a range of 0.07-0.10 kg/cm2 and a coefficient of permeability was 6.71x10⁻⁶ cm/s. The soil was mixed with Ordinary Portland Cement type I, using a mix proportion 200 kg/m3. After mixing, the stabilized soil specimens were prepared and then tested in order to obtain strengths and coefficients of permeability at curing times of 7, 28 and 90 days. In addition, microstructures were investigated on the same specimens after the tests using Scanning Electron Microscope (SEM). It was found that strengths of cement stabilized soil markedly increased, while, permeability markedly decreased at short term. Reaction products and subsequent changes on microstructures due to chemical reactions were clearly seen based on the Scanning Electron Microscope (SEM) observations. In relation to strength development, major reaction products such as calcium silicate hydrate (CSH) and ettringite were abundantly formed on clay fabrics. Growing and binding of such cementitious materials with soil particles thus reduced pore spaces as soil structures became gradually hardened, resulting in an increase in strength and decrease in permeability. KEYWORDS : Cement stabilized soil, Unconfined compressive strength, Scanning Electron Microscope (SEM) Coefficient of permeability, Soil microstructure 1. Introduction Ground improvement techniques have been developed in order to improve undesirable properties of soft ground. The techniques such as deep cement mixing method and soil cement columns have been widely used due to high satisfactory degrees of stabilization for various types of soils. It was reported that deep mixing method with an improvement ratio of 15% could successfully meet technical and economic feasibilities for an improvement of road embankment in Japan (Miki, et al., 2002). In Thailand, it has been reported that soil cement column is an outstanding technique to improve soft ground for highways construction in Bangkok and its vicinity area (Ruenkrairergsa, et al., 2002). Many researches have focused on study of the properties of cement stabilized soils. However, there are not many researches illustrate on how such properties have been improved. Our parallel research has focused on using X-ray Diffraction analysis to observe correlation between amount of reaction products and strength development. Therefore, this study aimed at further elucidation on how engineering properties such as soil strength and permeability were improved using Scanning Electron Microscopic (SEM) observations to investigate changes in microstructures of stabilized soils, as followed the study by Nontananandh and Kamon (1996). Experimentally, the approaches used in this study consisted of unconfined compressive strength tests and permeability tests to evaluate hardening effect of a soft marine clay stabilized with cement. SEM observations
were performed to investigate major reaction products and soil microstructures. Qualitative correlations between changes on microstructures of soil cement and improved strengths and permeability were also elucidated. 2. Materials and Methods 2.1 Materials The clayey soil used in this study was sampled from a construction site at Klong Lat Pho, Samut Prakarn province. The ground water table level was about 1 m below ground surface. The disturbed soil was taken from a depth of 3.0 m., which was located below the weathered zone. Upon visual inspection, the soil had greenish to dark gray color, containing some organic fractions. Further data on their properties are given in Table 1. According to the Unified Soil Classification System, the soil can be classified as clay with high plasticity (CH). Table 1 Properties of untreated soil
Physical and engineering properties Value Liquid limit (%) 85.80 Plastic limit (%) 32.70 Plasticity index (%) 53.10 Shrinkage limit (%) 32.91 Wet unit weight (t/m3) 1.65 Specific gravity 2.76 Natural moisture content (%) 63.53 Remolded strength of untreated soil (ksc) 0.07-0.10 Permeability (cm/s) 6.71 x 10⁻⁶
การประชุมวิชาการวิศวกรรมโยธาแหงชาติคร้ังที่ ๑๐ ชลบุรี ๒ – ๔ พฤษภาคม ๒๕๔๘

GTE - 24
Investigations on chemical compositions of the untreated soils were performed in accordance with ASTM C 323. The results showed that the soils were consist of 0.8 % Calcium oxide (CaO), 1.7 % Magnesium oxide (MgO), 1.0 % Sodium oxide (Na2O) and 0.08 % Sulphate ion (SO4
2-). The remolded strength of untreated soil at its average natural moisture content (63.53%) was within a range of 0.07-0.10 ksc. Based on the test results, the soil was conformed to soft marine clay. 2.2 Experimental procedures Selection on appropriate stabilizer and mix proportion was done as suggested by previous researches. For soft Bangkok clay, suitable cement contents were within a range of 80-200 kg/m3, based on required design strength of each project. Therefore, Ordinary Portland Cement (Type I) at a 200 kg/m3 was used in this study to stabilize the soft marine clay. A water to stabilizer ratio of 0.80 was used to produce soil cement mixture. For strength tests, specimens were made by placing homogeneous mixture in cylindrical molds of 5 cm diameter by 10 cm long. Initial densities of all specimens were controlled to be constant. After de-molding, the specimens were sealed tightly in plastic sheets to prevent loss of moisture due to surface evaporation and then cured for periods of 7, 28 and 90 days before strength tests. Unconfined Compression Strength Test was performed in accordance with ASTM D 2166-91. An unconfined compressive strength (UCS) was determined from the average after running for 3 tests. For permeability tests, the soil cement mixture was initially compacted and cured in standard cylindrical molds having an inside diameter of 10 cm and 11.50 cm in height, based on standard proctor compaction test. After curing times at 7, 28 and 90 days, permeability tests were performed in accordance with ASTM D2434-68 standard; the constant head method under constant water pressure of 2 kg/cm2. The coefficient of permeability (k) at a specified curing time was determined from the average after running for 3 tests. Scanning Electron Microscope was the technique used to investigate reaction products and to observe changes on microstructures of the stabilized soil. Observations were performed on the same specimens after strength and permeability tests, using a Scanning Electron Microscope model JEOL JSM-5600LV with a probe current of 20 mA and an accelerating voltage of 20 kA. 3. Results and Discussions 3.1 Strength and permeability characteristic curves The characteristic curve showing development of strength of the cement-stabilized soil against curing time is illustrated in Figure 1. It was found that the unconfined compressive strength (UCS) significantly increased when compared to strength of the untreated soil. Strength significantly increased during the first two weeks and then slightly increased at long term, where a 90-days strength of approximately 22.50 ksc could be obtained. The result showed that cement had beneficial effects on strength development.
Figure 2 indicates that permeability of the cement-stabilized soil was improved in the early stage. An average coefficient of permeability of the untreated soil of 6.71x10⁻⁶ cm/s decreased about 10-15 times after 7 days. As curing time increased, the coefficient of permeability slightly decreased. The coefficient of permeability at 90 days was 1.63 x10⁻⁷ cm/s.
0.00
5.00
10.00
15.00
20.00
25.00
30.00
0 10 20 30 40 50 60 70 80 90 100
Curing time (days)
UC
S (k
sc)
Figure 1 UCS of soil cement with curing time
Figure 2 Improved k of soil cement with time
Figure 3 UCS and k of soil cement
Correlation between UCS and k is shown in Figure 3. The result revealed that as strength increased permeability of the cement-stabilized soil decreased. Hardening effect was mainly attributed to cement hydration in the early stage in combination with pozzolanic reactions at long term.
Untreated soil
2000
-7
-7
2.00 x 10
4.00 x 10
-7
-7
Perm
eabi
lity
(cm
/s)
8.00 x 10
6.00 x 10
-6
-66.00 x 10
8.00 x 10
6040
Curing time (days)
10080
6.71 x 10 cm/s-6
10 30 50 70 90
Curing time (days)
Perm
eabi
lity
(cm
/s)
25.00
20.00
30.00
10.00
30.00
15.00
5.00
UC
S (k
sc)
2R=0.7877
6.00 x 10-70.00 2.00 x 10 4.00 x 10
Permeability (cm/s)
-7 -78.00 x 10⁻⁷
y=-1E+07x+24.403
5.00
GTE - 25
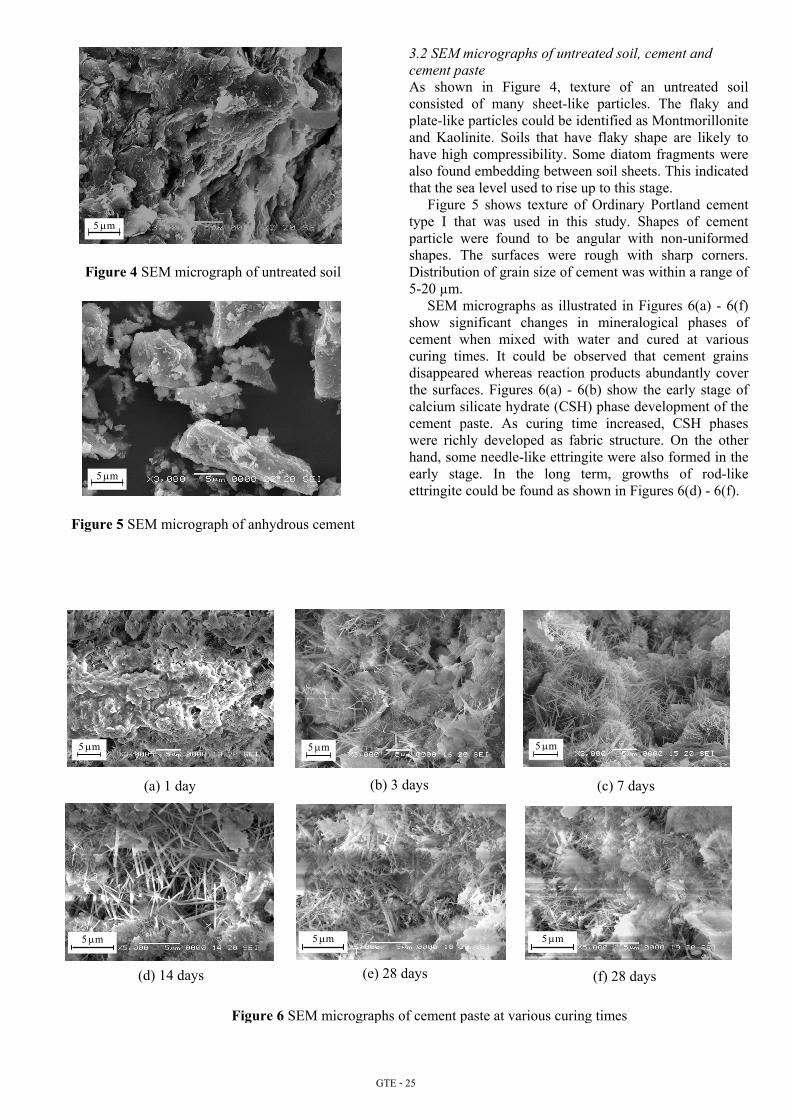
Figure 4 SEM micrograph of untreated soil
Figure 5 SEM micrograph of anhydrous cement
3.2 SEM micrographs of untreated soil, cement and cement paste As shown in Figure 4, texture of an untreated soil consisted of many sheet-like particles. The flaky and plate-like particles could be identified as Montmorillonite and Kaolinite. Soils that have flaky shape are likely to have high compressibility. Some diatom fragments were also found embedding between soil sheets. This indicated that the sea level used to rise up to this stage. Figure 5 shows texture of Ordinary Portland cement type I that was used in this study. Shapes of cement particle were found to be angular with non-uniformed shapes. The surfaces were rough with sharp corners. Distribution of grain size of cement was within a range of 5-20 µm. SEM micrographs as illustrated in Figures 6(a) - 6(f) show significant changes in mineralogical phases of cement when mixed with water and cured at various curing times. It could be observed that cement grains disappeared whereas reaction products abundantly cover the surfaces. Figures 6(a) - 6(b) show the early stage of calcium silicate hydrate (CSH) phase development of the cement paste. As curing time increased, CSH phases were richly developed as fabric structure. On the other hand, some needle-like ettringite were also formed in the early stage. In the long term, growths of rod-like ettringite could be found as shown in Figures 6(d) - 6(f).
5 µm
5 µm
Figure 6 SEM micrographs of cement paste at various curing times
(b) 3 days (a) 1 day (c) 7 days
(d) 14 days (e) 28 days (f) 28 days
5 µm 5 µm 5 µm
5 µm 5 µm 5 µm

GTE - 26
3.3 SEM micrographs of the cement stabilized soil Significant changes in soil structures due to cement hydration could be observed by SEM micrographs of soil cement after UCS tests. Figure 7(a) illustrates that in the early stage cementitious products such as CSH and ettringite are abundantly formed. Substantial growths of reaction products can be observed as curing time increased. As shown in Figure 7(b), CSH fabrics and ettringite hardened on surface of the stabilized soil. In the long term, as shown in Figure 7(c), some ettringite reacted with free gypsum and produces a hexagonal plate-like reaction product known as monosulfate. It was assumed that formation and growth of these reaction products made the stabilized soil structures denser and stronger, resulting in an increase in strength. SEM micrographs observed after the Permeability tests as shown in Figure 7(a) - Figure 7(c) were identical to those observed after the UCS tests. Soil microstructures of the stabilized soil were relatively denser than the untreated soil. However, a slight expansion of reaction products and clay particles due to seepage of water and subsequent absorption could be observed. As curing time increased, the structures became slightly denser. Decrease in soil permeability was attributed to the rich formation and growth of CSH and ettringite. These major reaction products filled up voids which, it was assumed, were previously filled up with pore water, resulting in a decrease in permeability.
4. Conclusion The Ordinary Portland Cement (Type I) with a suitable mixing content could be effectively used to stabilize soft marine clay. Engineering properties such as unconfined compressive strength and coefficient of permeability were markedly improved. It could be concluded that formation of reaction products such as CSH and ettringite contributed to strength development of the cement stabilized soil. In addition, growth of reaction products made structures denser, resulting in a decrease in permeability. Results of SEM observations agreed well with results from strength and permeability tests. Consequently, qualitative correlations between the improved strength and permeability could be illustrated by observations of changes on microstructures. 5. Reference [1] Miki, H. et al., 2002. Low Improvement Ratio Deep Mixing Method in Japan and Thailand, 4th Seminar on Soft Ground Improvement in Highways Construction, Bangkok, Thailand, p.37-50. [2] Ruenkrairergsa, T. et al., 2002. Current Ground Improvement Techniques Utilized by Department of Highways, 4th Seminar on Soft Ground Improvement in Highways Construction, Bangkok,Thailand, p.1-20. [3] Nontananandh, S. and Kamon, M., 1996. Hydration Mechanisms of Fly Ash Stabilized by Lime, Proc.of the 2nd International Congress on Environmental Geotechniques, Osaka, Japan, p.857-862.
(a) 7 days (b) 28 days (c) 90 days
Figure 8 SEM micrographs of cement stabilized soil after permeability tests at various curing times
(a) 7 days (b) 28 days (c) 90 days
Figure 7 SEM micrographs of cement stabilized soil after UCS tests at various curing times
1 µm 1 µm 1 µm
1 µm 1 µm 1 µm