sccuwity classification of zntwrmd) this ^acc … · sccuwity classification of zntwrmd) this ^acc...
TRANSCRIPT
Unclassified SCCUWITY CLASSIFICATION OF THIS ^ACC fVhmn Dmtm Zntwrmd)
REPORT DOCUMENTATION PAGE READ INSTRUCTIONS BEFORE COMPLETING FORM
1. REPORT NUMBER
80-1
2. OOVT ACCESSION NO. J. RCCIPIENT-S CATALOG NUMBER
4. TITLE (*nd Submit)
Building Naval Vessels: A Handbook of Shipyard Costs
S. TYPE OF REPORT 4 PERIOD COVERED
Final Report ■ 1 June 1979 - 31 March 1980 6. PERFORMING ORC. REPORT NUMBER
7. AUTHORf«;
Edward M. Kaitz & Associates, Inc.
«. CONTRACT OR GRANT NUMBERC*)
N00014-79-C-0521 '
S. PERFORMING ORGANIZATION NAME AND ADDRESS
Edward M. Kaitz & Associates, Inc. 1800 M St., N-.W. - Suite 310 North Washington, D.C. 20036
10. PROGRAM ELEMENT. PROJECT, TASK AREA * WORK UNIT NUMBERS
M. CONTROLLING OFFICE NAME AND ADDRESS
Office of Naval Research (Code 434) 800 N. Quincy St. Arlington', VA 22217
12. REPORT QAT1
March 1980 ■ 13. NUMBER OF PACES
14. MONITORING AGENCY NAME ft ADDRESS^/ dlllmrmnl /ram Controlling Olllcmj IS. SECURITY CLASS, (ol UiJa rmport)
Unclassified ISa. DECLASSIFI CATION/DOWN GRADING
SCHEDULE
16. DISTRIBUTION STATEMENT (at ttllm Rmport)
■ Approved for public release; distribution unlimited
17. DISTRIBUTION STATEMENT (at Lh. sbmtrmct mnlmrmd In Slock 30, II dilltrwnt fraoi Rmport)
9
1«. SUPPLEMENTARY NOTES
19. KEY WORDS (Conltmim on nrvrto rnld* 11 nocommmrf mnd Idmmttr by block number)
• Shipbuilding FFG7 Shipyard Cost of Naval Combatants
20. ABSTHACT (Cantlntio on rvvvrm* mldo 11 noc***mrr mnd Idmntltr by block mmbofX
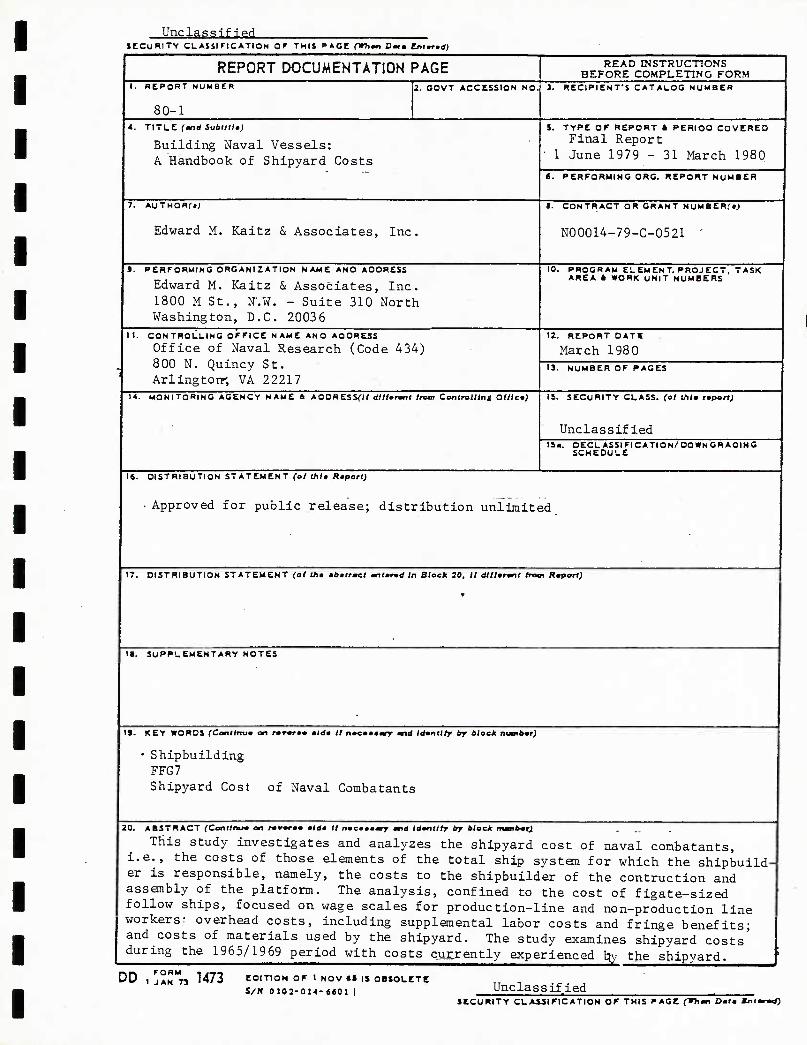
This study investigates and analyzes the shipyard cost of naval combatants, i.e., the costs of those elements of the total ship system for which the shipbuild- er is responsible, namely, the costs to the shipbuilder of the contruction and assembly of the platform. The analysis, confined to the cost of figate-sized follow ships, focused on wage scales for production-line and non-production line workers- overhead costs, including supplemental labor costs and fringe benefits- and costs of materials used by the shipyard. The study examines shipyard costs' during the 1965/1969 period with costs currently experienced Ijy the shipyard. f
DD , ^ 1473 EDITIOM OF 1 NOV «I IS OBSOLETE S/K 0102-014- 6601 | Unclassified
SECURITY CLASSIFICATION OF THIS PACE pri«i Dmlm KntmroO)
Based on this analysis, the increased cost at the shipyard of frigate-sized naval combatants can be explained by the following factors: 1) the general infla- tionary trend within the U.S. economy; 2) increased overhead costs; 3) general increases in capital and energy costs; 4) underutilization of the full capacity of specific segments of the shipbuilding industry and 5) increased complexity of the modern naval combatant.
Unclassified SECURITY CLASSIFICATION OF THIS PACEfwri*" C«'« Enimrmd)
mq)%ii5<]
BUILDING NAVAL VESSELS:
A HANDBOOK OF SHIPYARD COSTS
E M K
EDWARD M. KAITZ & ASSOCIATES, INC. 1800 M Street, N.W., Suite 310 North Washington, D.C. 20036 Telephone (202) 466-3581
M K
EDWARD M. KAITZ & ASSOCIATES, INC. 1800 M Street, N.W., Suite 310 North Washington, D.C. 20036 Telephone (202) 466-3581
BUILDING NAVAL VESSELS:
A HANDBOOK OF SHIPYARD COSTS
Prepared pursuant to Department of the Navy Contract No. N00014-79-C-0521. Views or conclusions contained in this document should not be interpreted as represent- ing official opinion or policy of the Department of the Navy. Except for use for Government purposes, permission to quote from or reproduce portions of this document must be obtained from Edward M. Kaitz & Associates, Inc.
March 19 80
TABLE OF CONTENTS
Page I. Executive Summary 1
II. Focus of the Study 3
III. Direct Labor 5
A. Wage Scales 7
B. Changes in Direct Labor Man-hours 16
IV. Overhead Rates and Costs 19
A. Overhead Costs 23
B. Supplemental Labor Costs 27
C. Fringe Benefits and Related Costs: Todd/Seattle 32
D. Indirect Labor 34
E. S ummary 36
V. Direct Material 37
A. Raw Material Prices 38
B. Raw Material Utilization: U.S. Shipbuilding Industry 4 2
VI. Conclusion 45
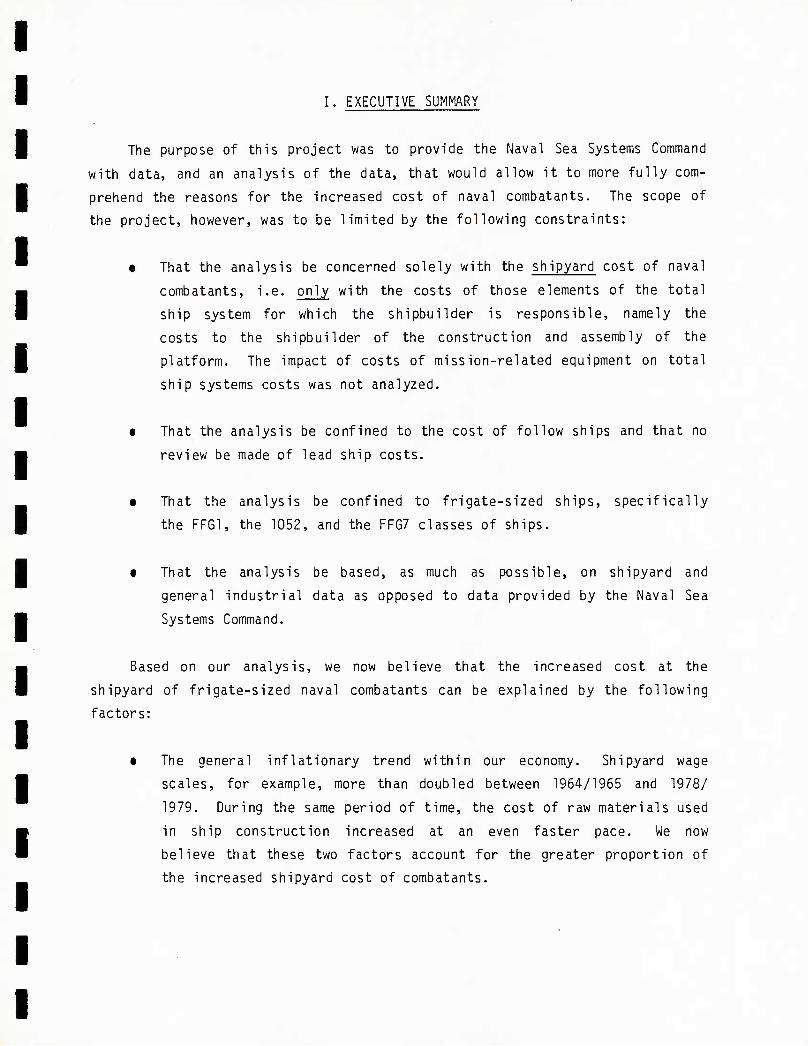
I. EXECUTIVE SUMMARY
The purpose of this project was to provide the Naval Sea Systems Command
with data, and an analysis of the data, that would allow it to more fully com-
prehend the reasons for the increased cost of naval combatants. The scope of
the project, however, was to be limited by the following constraints:
• That the analysis be concerned solely with the shipyard cost of naval
combatants, i.e. only with the costs of those elements of the total
ship system for which the shipbuilder is responsible, namely the
costs to the shipbuilder of the construction and assembly of the
platform. The impact of costs of mission-related equipment on total
ship systems costs was not analyzed.
• That the analysis be confined to the cost of follow ships and that no
review be made of lead ship costs.
• That the analysis be confined to frigate-sized ships, specifically
the FFG1, the 1052, and the FFG7 classes of ships.
• That the analysis be based, as much as possible, on shipyard and
general industrial data as opposed to data provided by the Naval Sea
Systems Command.
Based on our analysis, we now believe that the increased cost at the
shipyard of frigate-sized naval combatants can be explained by the following
factors:
• The general inflationary trend within our economy. Shipyard wage
scales, for example, more than doubled between 1954/1965 and 1978/
1979. During the same period of time, the cost of raw materials used
in ship construction increased at an even faster pace. We now
believe that these two factors account for the greater proportion of
the increased shipyard cost of combatants.
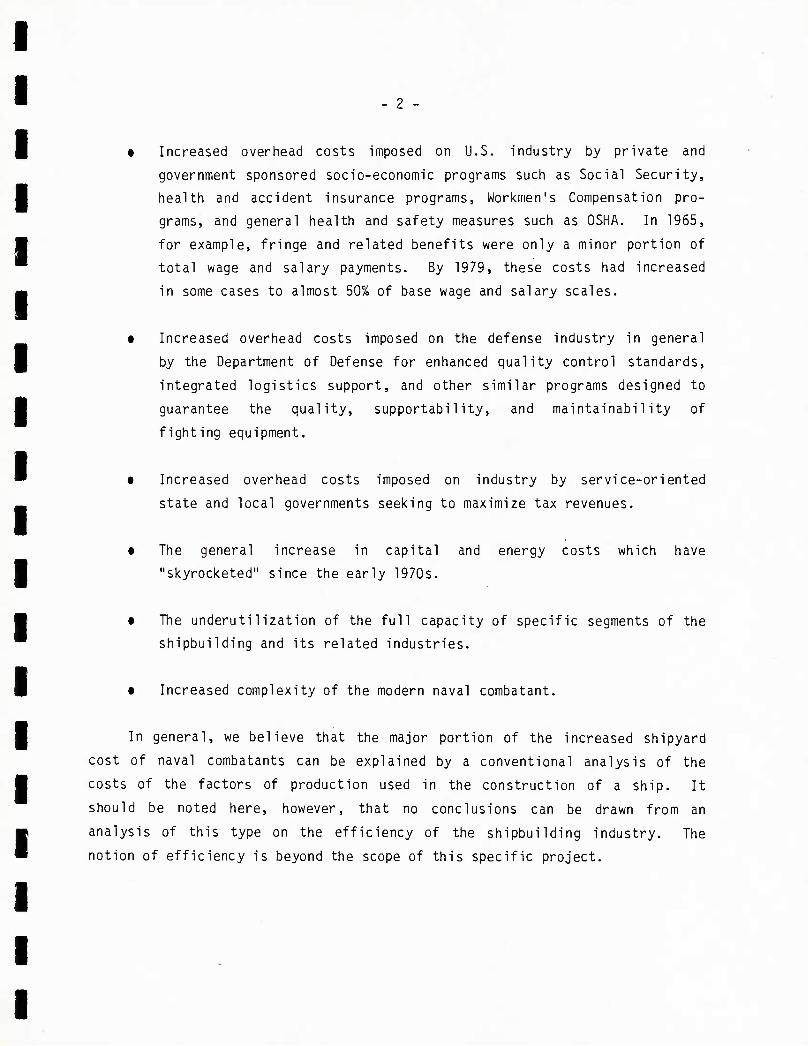
0 Increased overhead costs imposed on U.S. industry by private and
government sponsored socio-economic programs such as Social Security,
health and accident insurance programs, Workmen's Compensation pro-
grams, and general health and safety measures such as OSHA. In 1965,
for example, fringe and related benefits were only a minor portion of
total wage and salary payments. By 1979, these costs had increased
in some cases to almost 50% of base wage and salary scales.
• Increased overhead costs imposed on the defense industry in general
by the Department of Defense for enhanced quality control standards,
integrated logistics support, and other similar programs designed to
guarantee the quality, supportability, and maintainability of
fighting equipment.
• Increased overhead costs imposed on industry by service-oriented
state and local governments seeking to maximize tax revenues.
• The general increase in capital and energy costs which have
"skyrocketed" since the early 1970s.
• The underutilization of the full capacity of specific segments of the
shipbuilding and its related industries.
• Increased complexity of the modern naval combatant.
In general, we believe that the major portion of the increased shipyard
cost of naval combatants can be explained by a conventional analysis of the
costs of the factors of production used in the construction of a ship. It
should be noted here, however, that no conclusions can be drawn from an
analysis of this type on the efficiency of the shipbuilding industry. The
notion of efficiency is beyond the scope of this specific project.
- 3 -
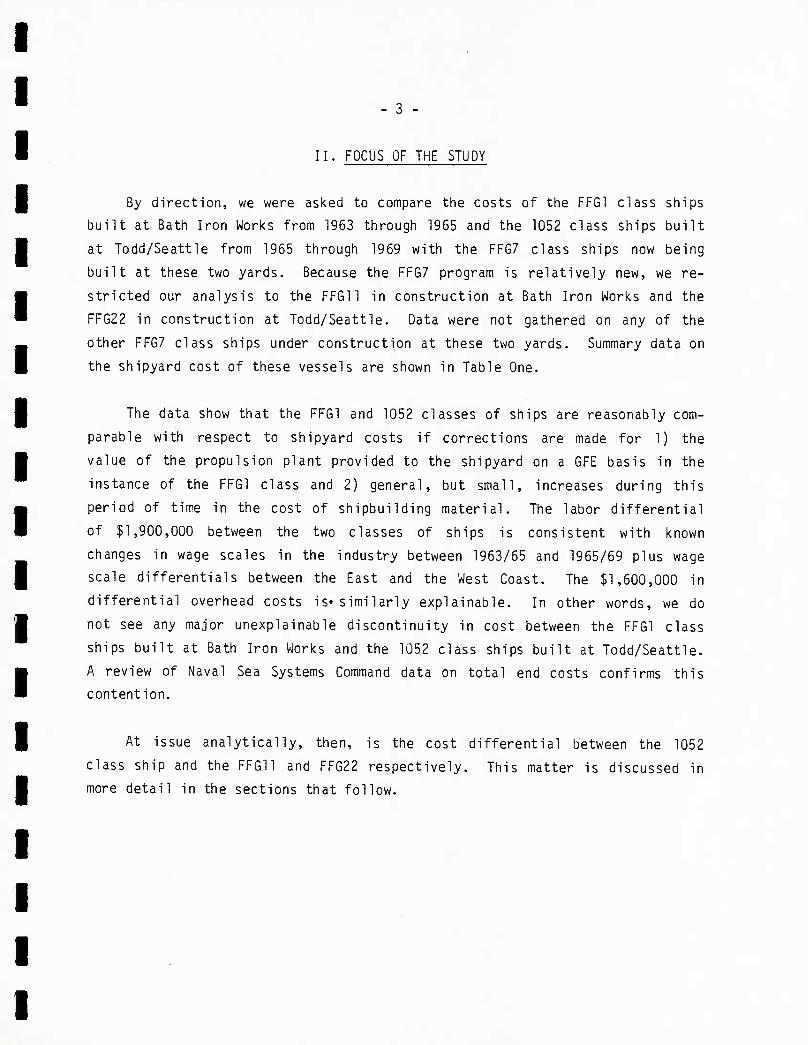
II. FOCUS OF THE STUDY
By direction, we were asked to compare the costs of the FFG1 class ships
built at Bath Iron Works from 1963 through 1965 and the 1052 class ships built
at Todd/Seattle from 1965 through 1969 with the FFG7 class ships now being
built at these two yards. Because the FFG7 program is relatively new, we re-
stricted our analysis to the FFG11 in construction at Bath Iron Works and the
FFG22 in construction at Todd/Seattle. Data were not gathered on any of the
other FFG7 class ships under construction at these two yards. Summary data on
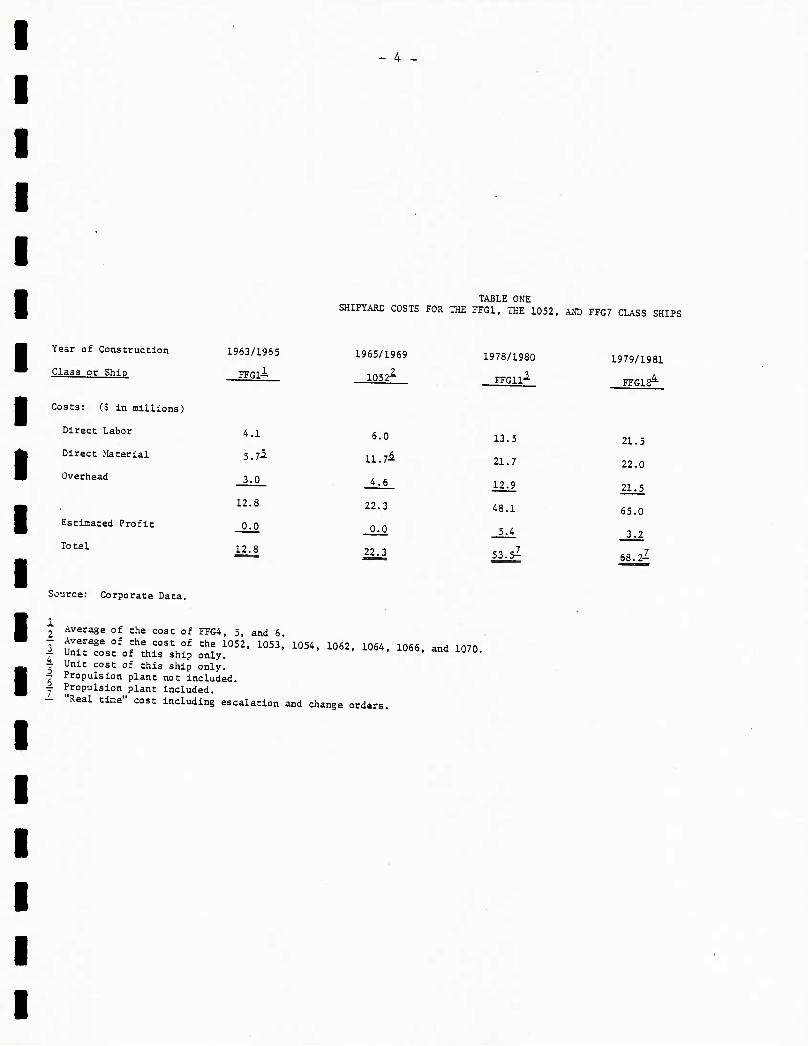
the shipyard cost of these vessels are shown in Table One.
The data show that the FFG1 and 1052 classes of ships are reasonably com-
parable with respect to shipyard costs if corrections are made for 1) the
value of the propulsion plant provided to the shipyard on a GFE basis in the
instance of the FFG1 class and 2) general, but small, increases during this
period of time in the cost of shipbuilding material. The labor differential
of $1,900,000 between the two classes of ships is consistent with known
changes in wage scales in the industry between 1963/65 and 1965/69 plus wage
scale differentials between the East ana the West Coast. The $1,600,000 in
differential overhead costs is* similarly explainable. In other words, we do
not see any major unexplainable discontinuity in cost between the FFG1 class
ships built at Bath Iron Works and the 1052 class ships built at Todd/Seattle.
A review of Naval Sea Systems Command data on total end costs confirms this
contention.
At issue analytically, then, is the cost differential between the 1052
class ship and the FFG11 and FFG22 respectively. This matter is discussed in
more detail in the sections that follow.
Source: Corporate Data.
- 4 -
TABLE ONE SHIPYARD COSTS FOR THE 7FG1, THE 1052, AND FFG7 CLASS SHIPS
Year of Construction
Class or Ship
Costs: ($ in millions)
Direct Labor
Direct Material
Overhead
Estimated Profit
Total
1963/1965
FFGl-^
4 .1
5 T*
3 0
12 8
0 0
12. 8
1965/1969
1052^-
6.0
11.7&
4.6
22.3
0.0
22.3
1978/1980
FFG11-
13 .5
21 .7
12 ± 48 1
5 _4
53. 5l
1979/1981
FFGIS^"
21 .5
22 0
il _5 55 0
3 2
68. ll
2 Average of the cost of FFG4, 5, and 6
i Tui:si\T\*ui:iX™2'1053'1054,1062'l064'1066'andio70- A Unit cost of this ship only. — Propulsion plant not included. -r Propulsion plant included. - "Real time" cost including escalation and change orders.
- D -
III. DIRECT LABOR
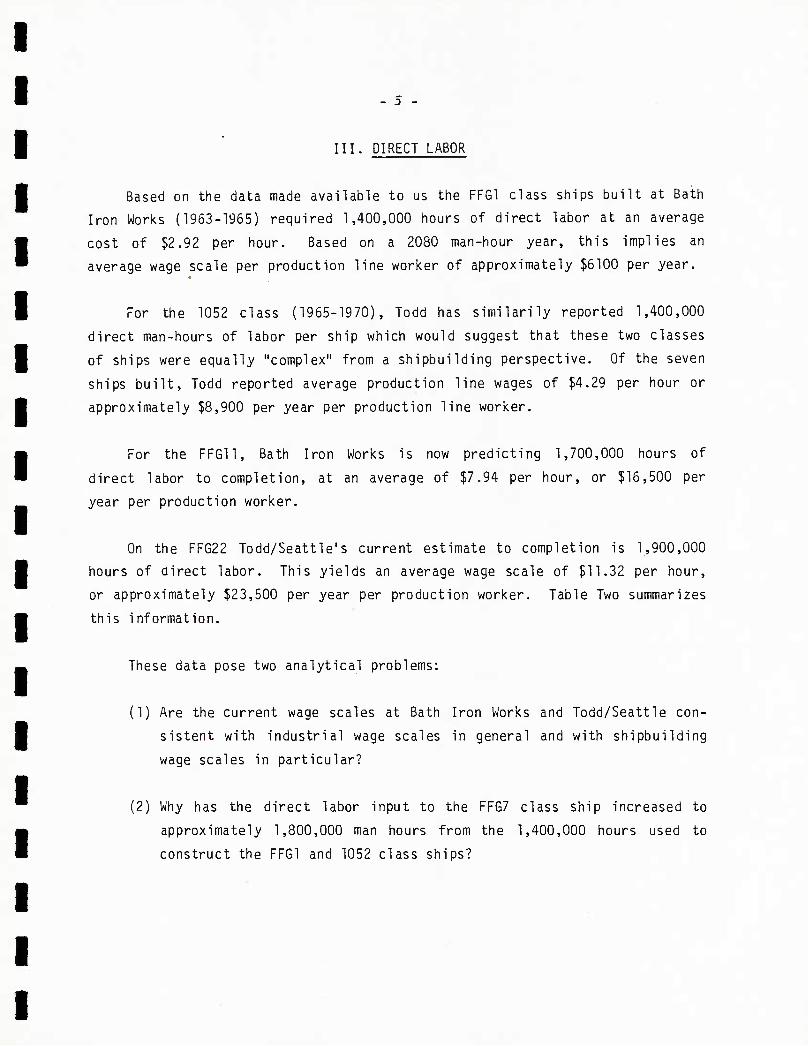
Based on the data made available to us the FFG1 class ships built at Bath
Iron Works (1953-1965) required 1,400,000 hours of direct labor at an average
cost of $2.92 per hour. Based on a 2080 man-hour year, this implies an
average wage scale per production line worker of approximately $5100 per year.
For the 1052 class (1955-1970), Todd has similarily reported 1,400,000
direct man-hours of labor per ship which would suggest that these two classes
of ships were equally "complex" from a shipbuilding perspective. Of the seven
ships built, Todd reported average production line wages of $4.29 per hour or
approximately $8,900 per year per production line worker.
For the FFG11, Bath Iron Works is now predicting 1,700,000 hours of
direct labor to completion, at an average of $7.94 per hour, or $15,500 per
year per production worker.
On the FFG22 Todd/Seattle's current estimate to completion is 1,900,000
hours of direct labor. This yields an average wage scale of $11.32 per hour,
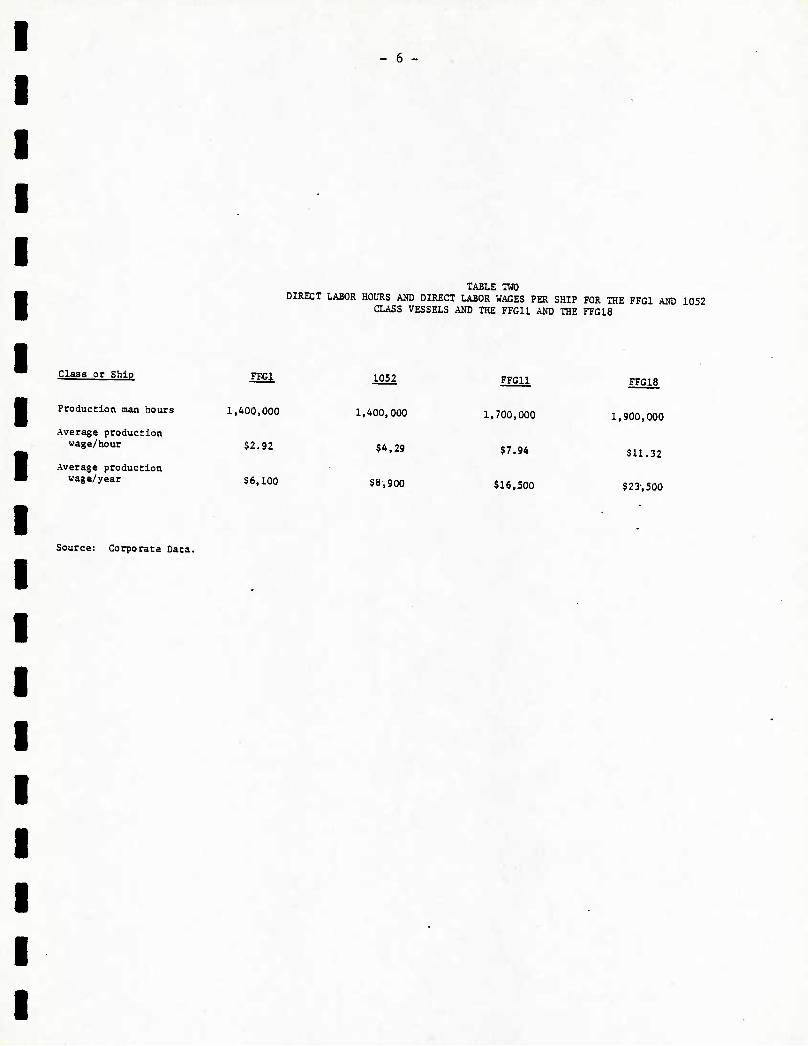
or approximately $23,500 per year per production worker. Table Two summarizes
this information.
These data pose two analytical problems:
(1) Are the current wage scales at Bath Iron Works and Todd/Seattle con-
sistent with industrial wage scales in general and with shipbuilding
wage scales in particular?
(2) Why has the direct labor input to the FFG7 class ship increased to
approximately 1,800,000 man hours from the 1,400,000 hours used to
construct the FFG1 and 1052 class ships?
- 6 -
TABLE TWO DIRECT LABOR HOURS AND DIRECT LABOR WAGES PER SHIP FOR THE FFG1 AND 1052
CLASS VESSELS AND THE FFG11 AND THE FFG18
Class or Ship FEG1 1052 FFG11 FFG18
Production man hours 1,400,000 1,400,000 1,700,000 1,900,000
Average production wage/hour $2.92 $4,29 $7.94 $U.32
Average production wage/year 56,100 $8,900 $16,500 $23,500
Source: Corporate Data.
- 7 -
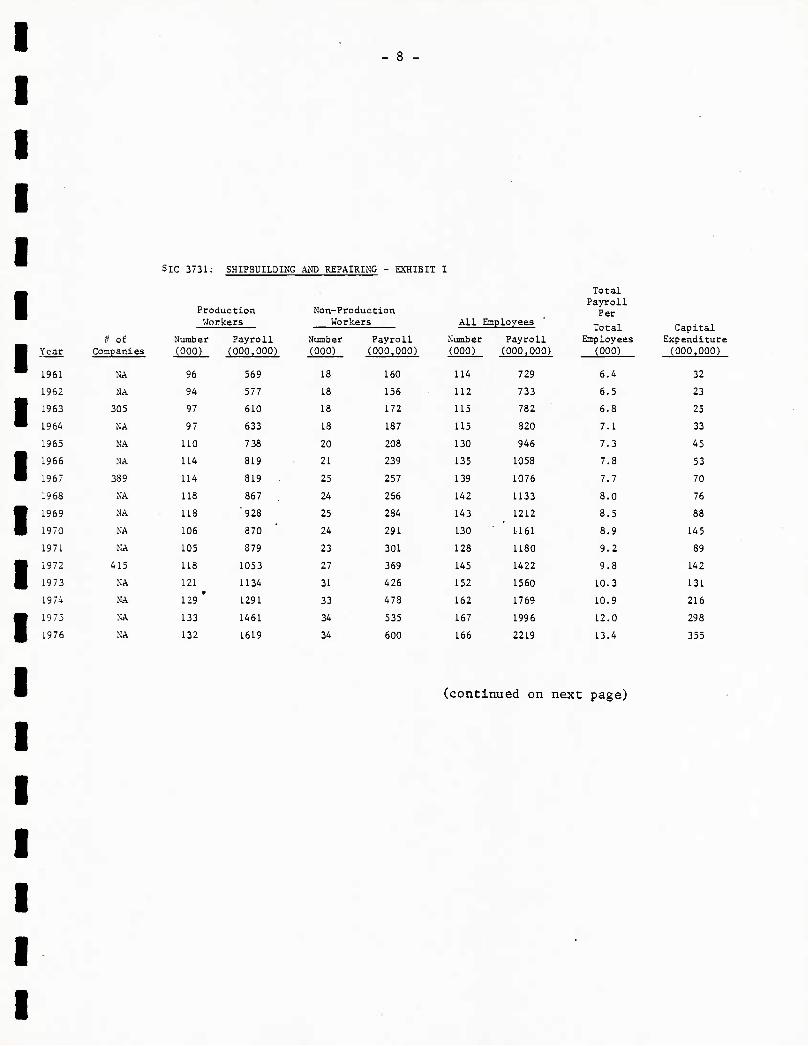
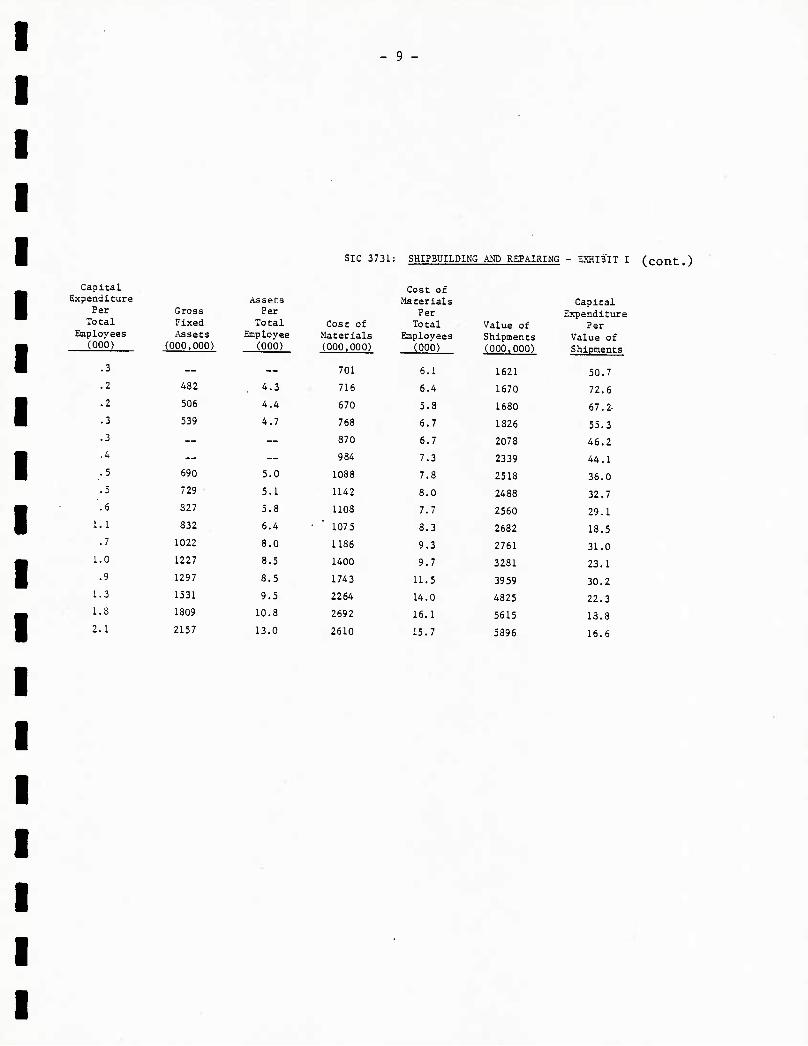
A. WAGE SCALES
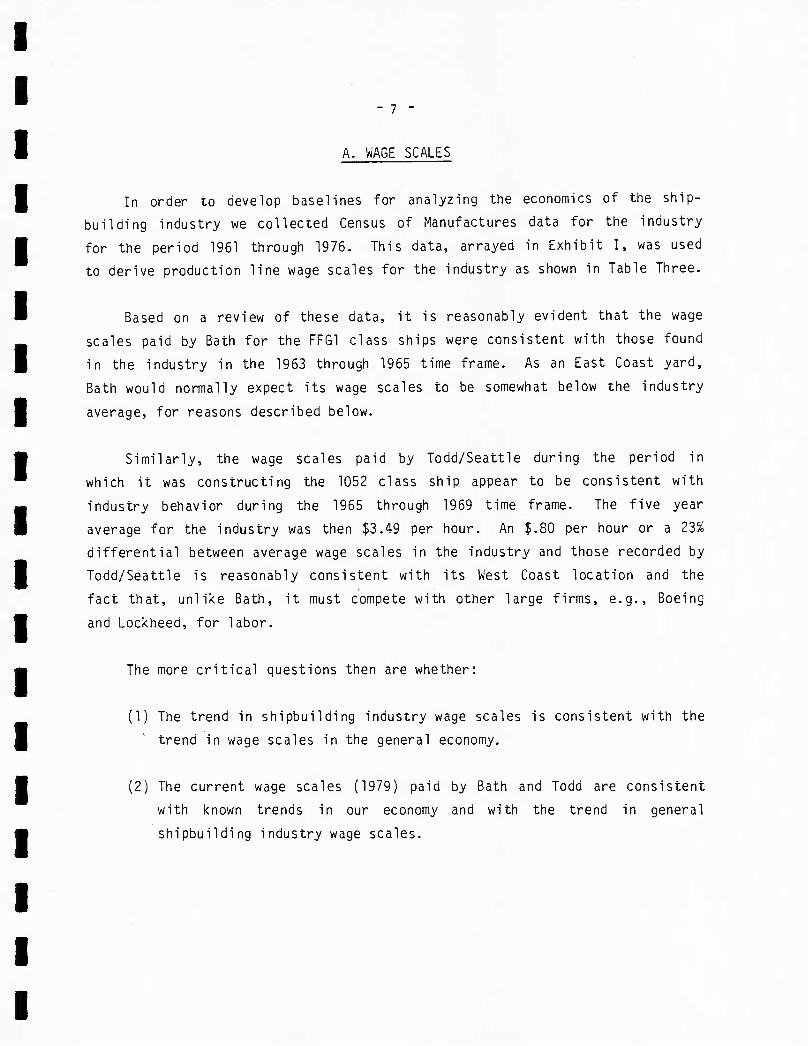
In order to develop baselines for analyzing the economics of the ship-
building industry we collected Census of Manufactures data for the industry
for the period 1961 through 1976. This data, arrayed in Exhibit I, was used
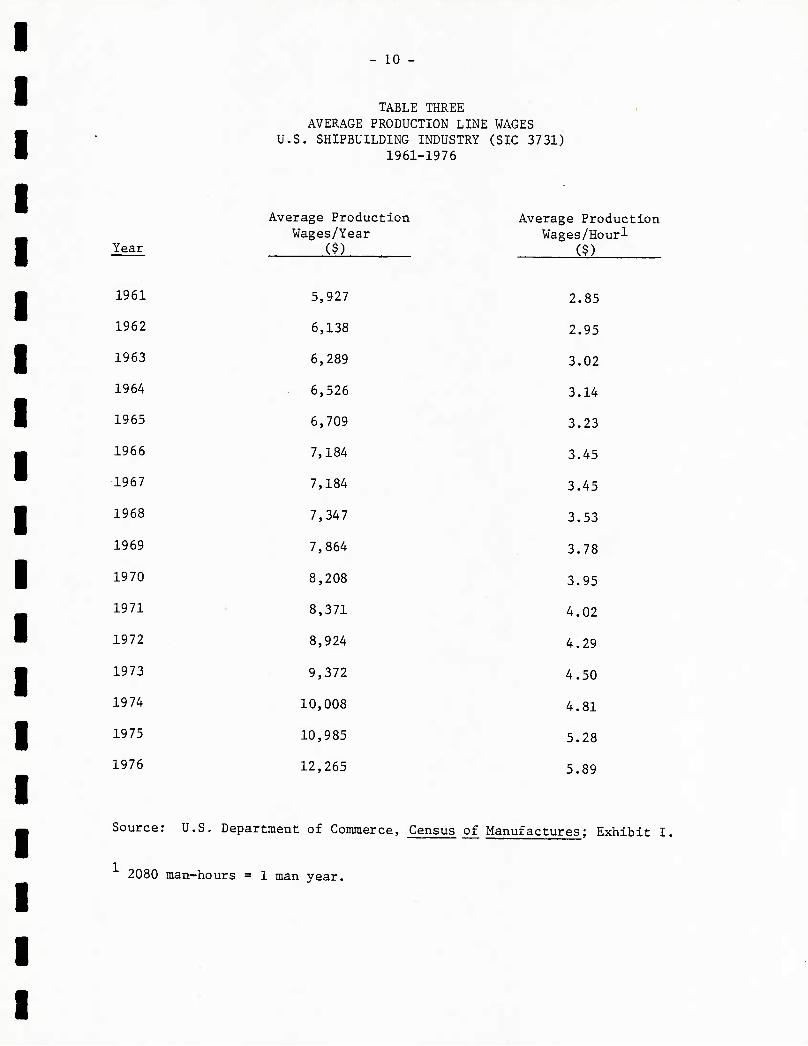
to derive production line wage scales for the industry as shown in Table Three.
Based on a review of these data, it is reasonably evident that the wage
scales paid by Bath for the FFG1 class ships were consistent with those found
in the industry in the 1963 through 1965 time frame. As an East Coast yard,
Bath would normally expect its wage scales to be somewhat below the industry
average, for reasons described below.
Similarly, the wage scales paid by Todd/Seattle during the period in
which it was constructing the 1052 class ship appear to be consistent with
industry behavior during the 1965 through 1969 time frame. The five year
average for the industry was then $3.49 per hour. An $.80 per hour or a 23%
differential between average wage scales in the industry and those recorded by
Todd/Seattle is reasonably consistent with its West Coast location and the
fact that, unlike Bath, it must compete with other large firms, e.g., Boeing
and Lockheed, for labor.
The more critical questions then are whether:
(1) The trend in shipbuilding industry wage scales is consistent with the
trend in wage scales in the general economy.
(2) The current wage scales (1979) paid by Bath and Todd are consistent
with known trends in our economy and with the trend in general
shipbuilding industry wage scales.
- 8 -
SIC 3731: SHIPBUILDING AND REPAIRING - EXHIBIT I
Production Workers
if of Number Payroll Year Companies (000) (000,000)
1961 NA 96 569
1962 NA 94 577
1963 305 97 610
1964 NA 97 633
1965 NA 110 738
1966 NA 114 819
1967 389 114 819
1968 NA 118 867
1969 NA 118 '928
1970 NA 106 370
1971 NA 105 379
1972 415 118 1053
1973 NA 121 1134
1974 NA 129 ' 1291
1973 NA 133 1461
1976 NA 132 1619
Non-Production Workers All
Number (000)
Emplovees
Number (000)
Payroll (000.000)
Payro. (000,0
18 160 114 729
18 156 112 733
18 172 115 782
18 187 115 320
20 208 130 946
21 239 135 1053
25 257 139 1076
24 256 142 1133
25 284 143 1212
24 291 130 1161
23 301 128 1180
27 369 145 1422
31 426 152 1560
33 478 162 1769
34 535 167 1996
34 600 166 2219
Total Payroll
Per
Total Employees
(000)
Capital Expenditure (000,000)
6.4 32
6.5 23
6.3 25
7.1 33
7.3 45
7.3 53
7.7 70
8.0 76
8.5 88
8.9 145
9.2 89
9.8 142
10.3 131
10.9 216
12.0 298
13.4 355
(continued on next page)
- 9 -
SIC 3731: SHIPBUILDING AND REPAIRING - EXHIBIT I (cont.)
Capital Expenditure
Per Total
Employees (000)
Gross Fixed Assets
(000,000)
Assets Per
Total Employee
(000)
Cost of Materials (000,000)
701
Cost of Materials
Per Total
Employees (000)
Value of Shipments (000,000)
.3 6.1 1621
.2 482 4.3 716 6.4 1670 5 • *- 506 4.4 670 5.8 1680
.3 539 4.7 768 6.7 1826
.3 — ~ 870 6.7 2078
.4 — ~ 984 7.3 2339
.5 690 5.0 1088 7.8 2518
.5 729 5.1 1142 8.0 2488
.6 827 5.8 1108 7.7 2560 1.1 832 6.4 • ' 1075 8.3 2682
. 7 1022 8.0 1136 9.3 2761 1.0 1227 8.5 1400 9.7 3281 .9 1297 8.5 1743 11.5 3959
1.3 1531 9.5 2264 14.0 4825 1.8 1809 10.8 2692 16.1 5615 2.1 2157 13.0 2610 15.7 5896
Capital Expenditure
Per Value of Shipments
50.7
72.6
67.2-
55.3
46.2
44.1
36.0
32.7
29.1
18.5
31.0
23.1
30.2
22.3
18.8
16.6
- 10
TABLE THREE AVERAGE PRODUCTION LINE WAGES
U.S. SHIPBUILDING INDUSTRY (SIC 3731) 1961-1976
Average Production Average Production Wages/Year Wages/Hourl
Year ($) ($)
1961 5,927 2.85
1962 6,138 2.95
1963 6,289 3.02
1964 6,526 3.14
1965 6,709 3.23
1966 7,184 3.45
1967 7,184 3.45
1968 7,347 3.53
1969 7,864 3.78
1970 8,208 3.95
1971 8,371 4.02
1972 8,924 4.29
1973 9,372 4.50
1974 10,008 4.81
1975 10,985 5.28
1976 12,265 5.89
Source: U.S. Department of Commerce, Census of Manufactures; Exhibit I.
2080 man-hours = 1 man year.
- 11
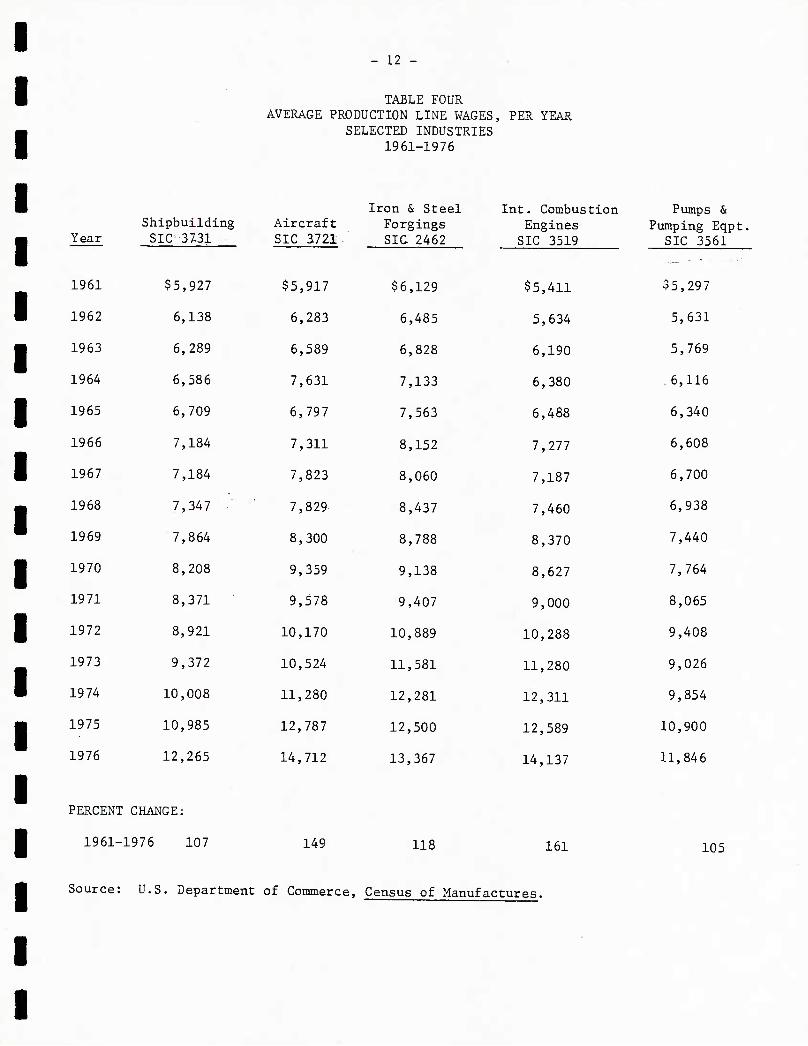
Question One is easily answered. Table Four presents data on production
line wage scales for five heavy industries. To the extent that these indus-
tries are representative of the trend in production wage scales in U.S. heavy
industry, as we believe they are, it can be concluded that the trend in ship-
building wage scales is consistent with that found in U.S. heavy industry in
general.
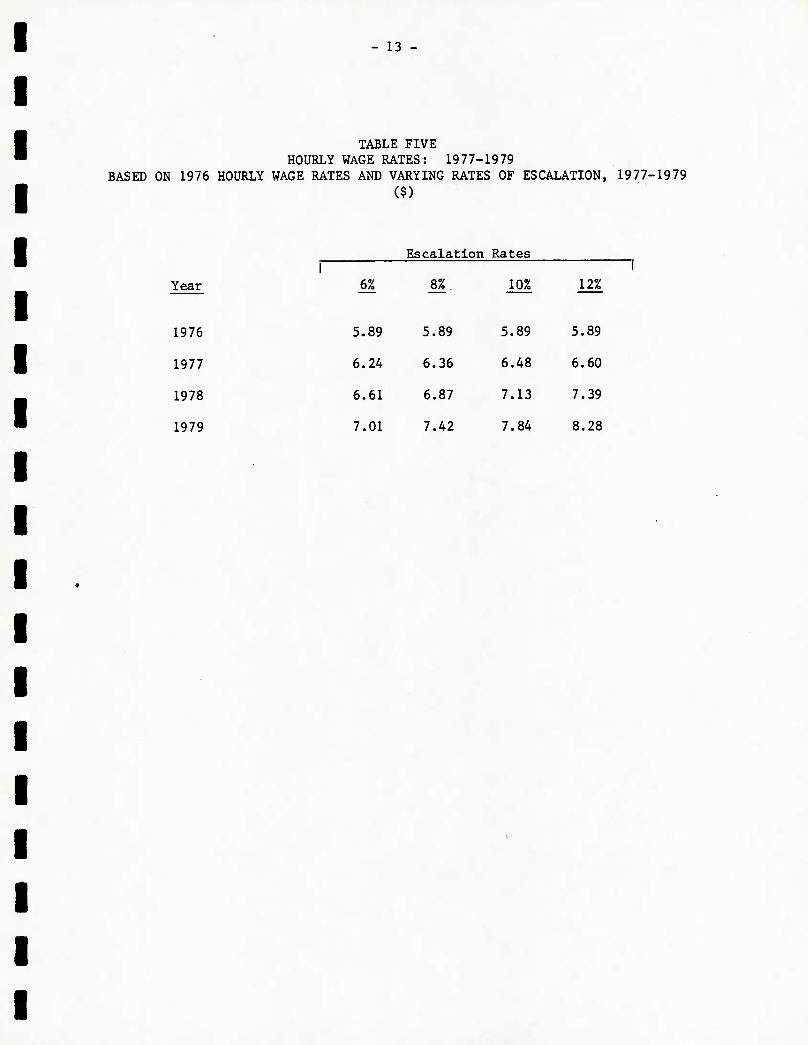
The remaining question, then, is whether the current production line wage
scales for Bath and Todd/Seattle are consistent with known inflationary trends
within our economy since 1976. Table Five presents data on this. When cor-
rections for labor mix (to be discussed later) are made, Bath's 1979 wage
scale of $7.94 per hour is consistent with an 8% per year escalation rate.
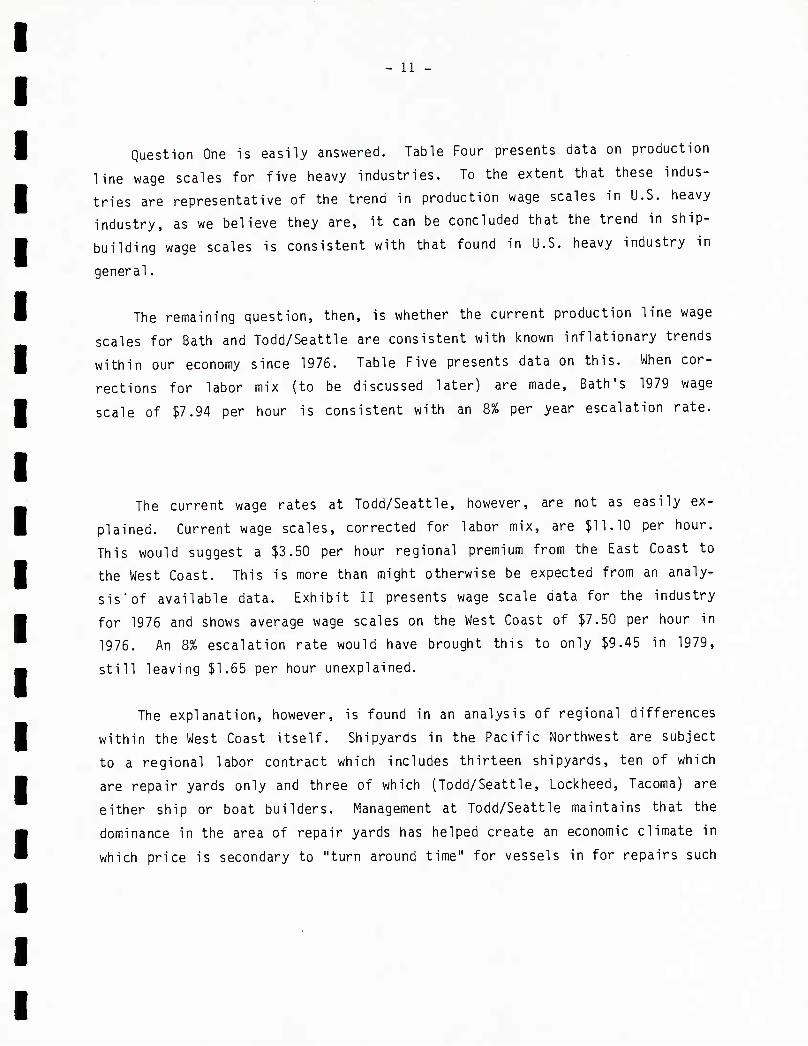
The current wage rates at Todd/Seattle, however, are not as easily ex-
plained. Current wage scales, corrected for labor mix, are $11.10 per hour.
This would suggest a $3.50 per hour regional premium from the East Coast to
the West Coast. This is more than might otherwise be expected from an analy-
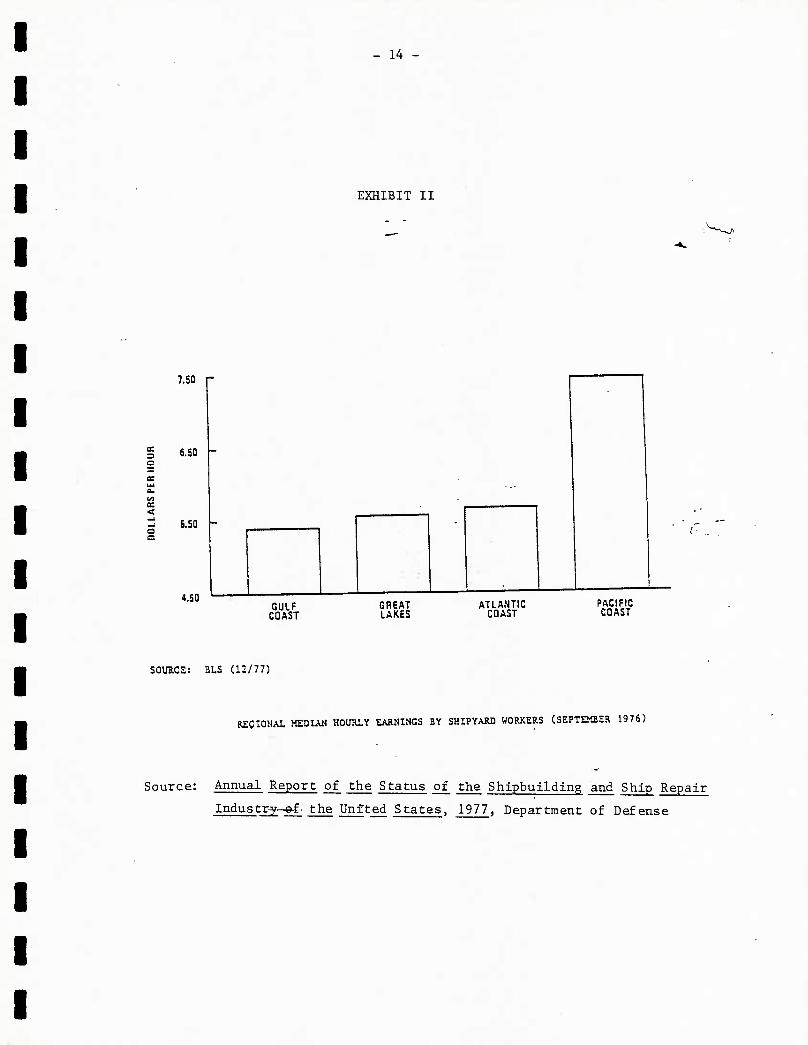
sis' of available data. Exhibit II presents wage scale data for the industry
for 1976 and shows average wage scales on the West Coast of $7.50 per hour in
1976. An 8% escalation rate would have brought this to only $9.45 in 1979,
still leaving $1.65 per hour unexplained.
The explanation, however, is found in an analysis of regional differences
within the West Coast itself. Shipyards in the Pacific Northwest are subject
to a regional labor contract which includes thirteen shipyards, ten of which
are repair yards only and three of which (Todd/Seattle, Lockheed, Tacoma) are
either ship or boat builders. Management at Todd/Seattle maintains that the
dominance in the area of repair yards has helped create an economic climate in
which price is secondary to "turn around time" for vessels in for repairs such
- 12 -
TABLE FOUR AVERAGE PRODUCTION LINE WAGES, PER YEAR
SELECTED INDUSTRIES 1961-1976
Iron & Steel Shipbuilding Aircraft Forgings
Year SIC 37-31
$5,927
SIC 3721
$5,917
SIC 2462
1961 $6,129
1962 6,138 6,283 6,485
1963 6,289 6,589 6,828
1964 6,586 7,631 7,133
1965 6,709 6,797 7,563
1966 7,184 7,311 8,152
1967 7,184 7,823 8,060
1968 7,347 7,829 8,437
1969 7,864 8,300 8,788
1970 8,208 9,359 9,138
1971 8,371 9,578 9,407
1972 8,921 10,170 10,889
1973 9,372 10,524 11,581
1974 10,008 11,280 12,281
1975 10,985 12,787 12,500
1976 12,265 14,712 13,367
Int. Combustion Pumps & Engines Pumping Eqpt.
SIC 3519 SIC 3561
$5,411
5,634
6,190
6,380
6,488
7,277
7,187
7,460
8,370
8,627
9,000
10,288
11,280
12,311
12,589
14,137
$5,297
5,631
5,769
6,116
6,340
6,608
6,700
6,938
7,440
7,764
8,065
9,408
9,026
9,854
10,900
11,846
PERCENT CHANGE:
1961-1976 107 149 118 161 105
Source: U.S. Department of Commerce, Census of Manufactur es.
- 13 -
TABLE FIVE HOURLY WAGE RATES: 1977-1979
BASED ON 1976 HOURLY WAGE RATES AND VARYING RATES OF ESCALATION, 1977-1979 ($)
Escalation Rates I
Year
1976
1977
1978
1979
1 6% 8%. 10%
i 12%
5.89 5.89 5.89 5.89
6.24 6.36 6.48 6.60
6.61 6.87 7.13 7.39
7.01 7.42 7.84 8.28
- 14 -
EXHIBIT II
3 a
IT <
7.50 r
6.50
5.5Q
4.50 GULF
CQAST CHEAT LAKES
ATLANTIC CQAST
PACIFIC COAST
SOURCE: BLS (12/77)
REgiOHAL MEDIAN HOURLY EARNINGS BY SHIPYARD WORKERS (SEPTEMBER 1976)
Source: Annual Report of the Status of the Shipbuilding and Ship Repair
Industry—of. the United States, 1977, Department of Defense
15 -
that the unions representing production line workers are able to bargain for
wages substantially higher than would otherwise obtain were the shipbuild-
ing job opportunities in the area limited, as they are in most key geographical
areas, to only one or two shipbuilders. In economic terms, this outcome is
consistent with generally accepted labor relations theory and practice. Inso-
far as the Navy needs to maintain a shipbuilding and repair capability in the
Pacific Northwest, it has no choice but to pay the wage scale premium called
for in the region. Regional differences in wage scales are a fact of life.
Based on the wage scale data, then, we believe that it is reasonably safe
to conclude that the direct labor costs required to construct the FFG11 and
FFG22 are not inconsistent with general economic trends within the United
States. This statement neither condemns nor justifies the cost but simply
states, subject to the change in man-hours of direct labor, that there is no
unexplainable discontinuity in the labor portion of the total shipyard cost of
constructing an FFG1, 1052, or an FFG7 class follow ship. The as yet unex-
plained variation in direct labor hours per ship is discussed in the section
that follows.
- 16 -
B. CHANGES IN DIRECT LABOR MAN-HOURS
In keeping with Cost Accounting Standards Board rules and regulations,
Bath Iron Works and Todd, prior to the receipt of the various contracts for
the FFG7 class vessels, reclassified as direct labor certain shipbuilding
costs heretofore classified as overhead, e.g., purchasing, quality assurance,
certain data processing functions, etc. The management of each of the ship-
yards visited during the field phase of this projct stated that this require-
ment accounted for the 300,000 man-hour direct labor differential noted
earlier between the FFG1 and 1052 class ship, and the FFG7 class vessel and
that, from their point of view as shipbuilder, the three classes of ships
reviewed in this project were of equal complexity. In other words, the man-
agement of both shipyards believe, and offered reasonable proof, that the FFG7
class of ships required no more direct hours of construction line labor than
did either the FFG1 or 1052 classes.
It should be noted here, when spread over three years, that 50 persons
account for 300,000 man-hours of labor. In this regard, Todd management
specifically noted that they now have a 40 man quality assurance program
office for the FFG7 class ship, a function that was performed solely by the
Navy on the 1052 class vessel. They also stated that the Todd Program Office
for the 1052 program was staffed by 2 persons whereas the Todd Program Office
is now staffed by 10 personnel. Bath cited a 14 person Data Processing unit,
a 5 person Industrial Relations group, and a 3 person Overhead Budgeting Group
as instances of costs reclassified, for contractural purposes, from overhead
and into the direct labor category. In addition, both stated that the FFG7
program contract required them to perform functions, e.g., integrated logistics
support, that they were not required to perform on either their FFG1 or 1052
contracts. This, then, leads to the conclusion that the 1,400,000 in direct
man-hours used to construct the FFG1 and 1052 class ship is comparable to the
1,700,000 man-hours allocated as direct labor on the FFG7 class. This, of
- 17 -
course, is subject to the caveat that the size of the overhead labor force is
smaller than might otherwise be anticipated based on current standards within
the industry. As will be discussed in the Overhead Section of this report,
this appears to be so, i.e., the indirect labor portion of overhead costs are
somewhat lower in each of the two yards than might otherwise be anticipated.
This, of course, leaves unexplained the 200,000 man-hour increment between
predicted man-hours to complete the FFG11 at Bath and to complete the FFG22 at
Todd/Seattle. Todd management stated that they were as yet not able to fully
explain this difference. They currently attribute the labor hour overrun to
two specific areas: the electric/electronics area, and their different rela-
tionship to the design agent (Gibbs & Cox). On the 1052 class they noted that
they had "control" of the design such that they could reject any change
suggested by the agent. They do not now have this option available to them
except as they take responsibility for refusing to act on a change specified
by the design agent. They believe that a portion of the 200,000 in unaccounted
for direct labor is due to problems created by this relationship.
Apart from the 200,000 man-hour differential at Todd/Seattle, then, the
increased indirect labor costs between the FFG1, 1052, and FFG7 classes of
ships can be explained by a reasonably standard financial and economic analy-
sis. Although the costs appear to be radically higher from one class of ship
to another, nearly all of these differences are due to (1) wage scale infla-
tion in the general economy and (2) regional differences in wage scales in the
shipbuilding industry.
Once again, it should be noted here that an analysis of this type can
make no valid statements on the efficiency of the two contractors involved.
All that can be said is that Bath appears to be constructing the FFG7 class
ships for which it is responsible as_ efficiently as it constructed the three
- 18 -
FFG1 class vessels if the ships are, in fact, of equal complexity from a ship
construction perspective. Conversely, if the 1052 class is directly compar-
able to the FFG7 class ship, then Todd/Seattle appears to be somewhat less
efficient than might otherwise be anticipated. In absolute terms, Todd/
Seattle is somewhat less efficient than Bath but it would be specious analyti-
cally to assume that the two yards are able to be directly compared in this
regard.
- 19 -
IV. OVERHEAD RATES AND COSTS
In order to begin our analysis of the overhead rates and costs incurred
in the three programs under review, we once again began with a review of the
data set out in Exhibit I. Given the limitations of this data, we defined:
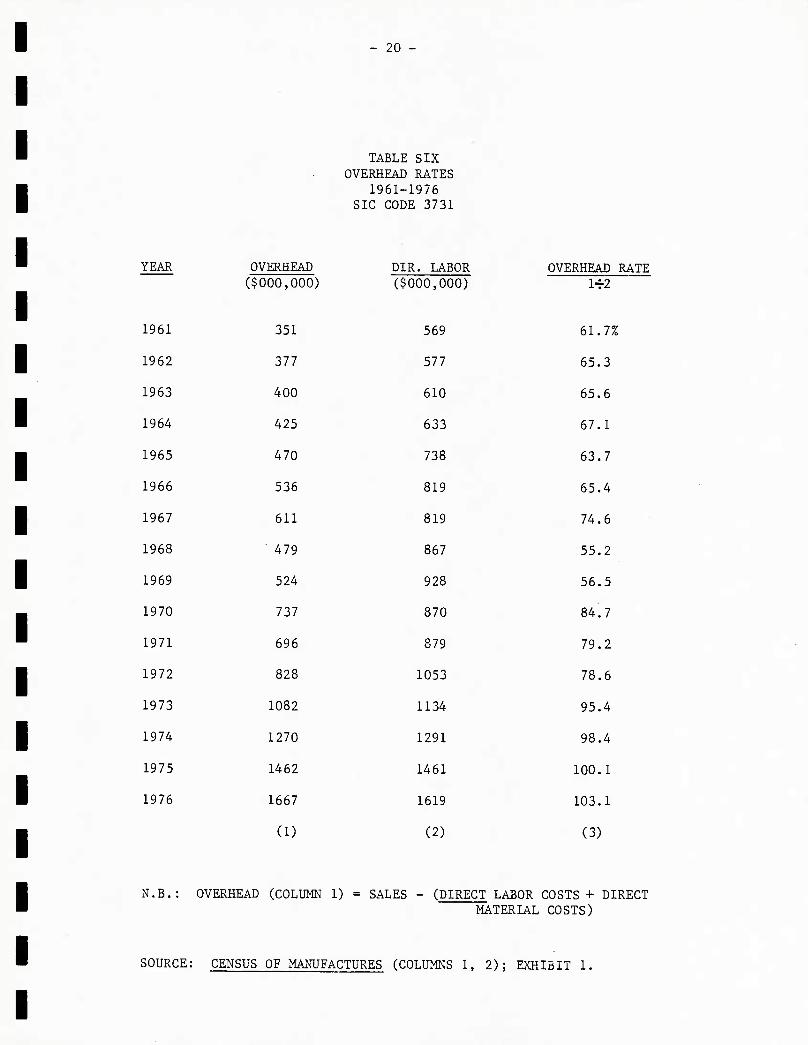
1. Overhead as the arithmetic equivalent of sales less the sum of direct
labor and direct material costs. Overhead Costs = Sales - (Direct
Labor Costs + Direct Material Costs).
2. The overhead rate as the equivalent of overhead costs divided by
direct labor costs. Overhead Rate = Ove^ead Costs Direct Labor Costs
We are aware that defining overhead as we have done is somewhat of a
simplification inasmuch as it includes 1) some costs that industry normally
categorizes as direct and 2) earned profits. Conversely, this definition of
overhead and of overhead rates is reasonably consistent with government pro-
cedures and sufficient for our purposes to allow us to discern and interpret
trends.
Table Six presents data on the outcome of this analysis and shows the
trend in overhead costs and rates for the industry for the fifteen years for
which complete data is available. Other than for 1968 and 1969, the trend has
been steadily upwards with a sharp acceleration seen after 1973 due, no doubt,
to the rapid runup in energy and other costs during the 1973/74 time frame.
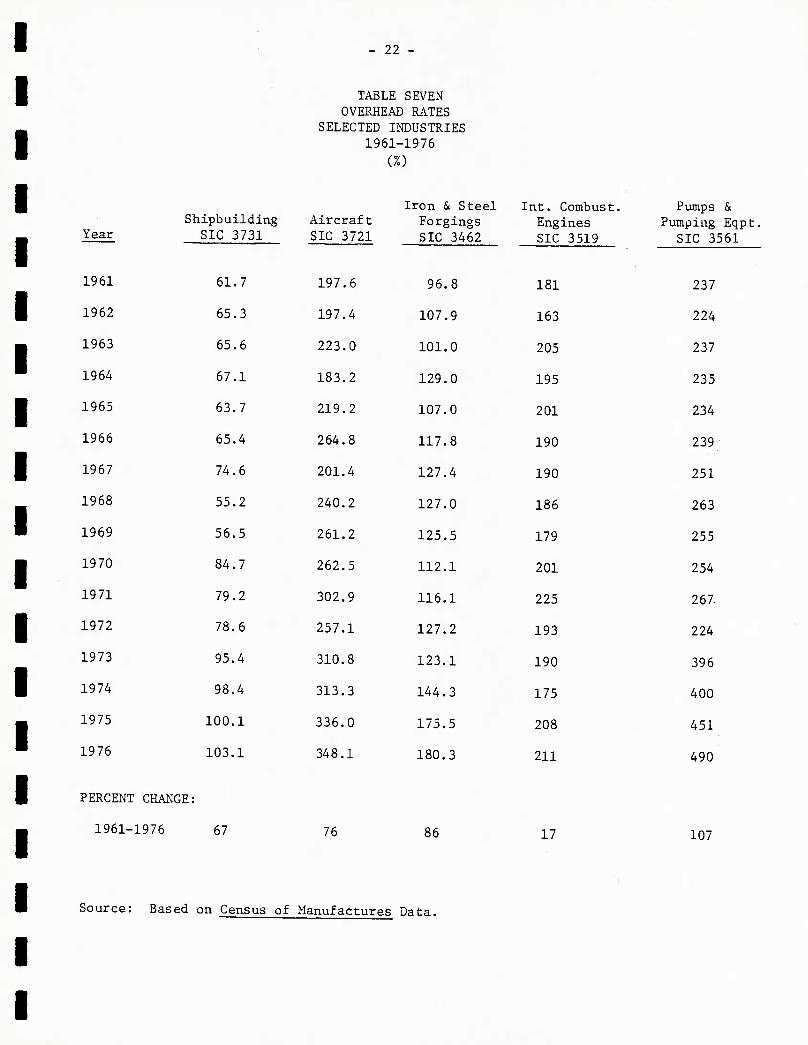
In order to determine whether the trend we observed in the shipbuilding
industry was consistent with trends in the U.S. economy as a whole we once
again derived data for four other industries. These data are set out in Table
- 20
TABLE SIX OVERHEAD RATES
1961-1976 SIC CODE 3731
YEAR OVERHEAD ($000,000)
DIR. LABOR ($000,000)
OVERHEAD RATE 1+2
1961 351 569 61.7%
1962 377 577 65.3
1963 400 610 65.6
1964 425 633 67.1
1965 470 738 63.7
1966 536 819 65.4
1967 611 819 74.6
1968 479 867 55.2
1969 524 928 56.5
1970 737 870 84.7
1971 696 879 79.2
1972 828 1053 78.6
1973 1082 1134 95.4
1974 1270 1291 98.4
1975 1462 1461 100.1
1976 1667 1619 103.1
(1) (2) (3)
N.B.: OVERHEAD (COLUMN 1) = SALES - (DIRECT LABOR COSTS + DIRECT MATERIAL COSTS)
SOURCE: CENSUS OF MANUFACTURES (COLUMNS 1, 2); EXHIBIT 1.
- 21 -
Seven. As shown, there has been a steady increase in overhead costs and over-
head rates throughout U.S. industry for the period under review. The observed
behavior of the U.S. shipbuilding industry is consistent with that found in
the U.S. economy as a whole, although a case can be made for alleging that the
rate of growth in overhead costs in shipbuilding has lagged behind that in the
economy in general.
Here it should be noted that this is neither "good" nor "bad"; it simply
is.
- 22 -
TABLE SEVEN OVERHEAT RATES
SELECTED INDUSTRIES 1961- 1976
(%)
Year Shipbuilding
SIC 3731 Aircraft SIC 3721
197.6
Iron & Steel Forgings SIC 3462
Int. Combust. Engines SIC 3519
Pumps & Pumping Eqpt.
SIC 3561
1961 61.7 96.8 181 237
1962 65.3 197.4 107.9 163 224
1963 65.6 223.0 101.0 205 237
1964 67.1 183.2 129.0 195 235
1965 63.7 219.2 107.0 201 234
1966 65.4 264. S 117.8 190 239
1967 74.6 201.4 127.4 190 251
1968 55.2 240.2 127.0 186 263
1969 56.5 261.2 125.5 179 255
1970 84.7 262.5 112.1 201 254
1971 79.2 302.9 116.1 225 267.
1972 78.6 257.1 127.2 193 224
1973 95.4 310.8 123.1 190 396
1974 98.4 313.3 144.3 175 400
1975 100.1 336.0 175.5 208 451
1976 103.1 348.1 180.3 211 490
PERCENT CHANGE:
1961-1976 67 76 86 17 107
Source: Based on Census of Manufactures Data.
- 23
A. OVERHEAD COSTS
In order to determine whether the trends in overhead costs and rates
between the FFG1, 1052, and FF67 programs were consistent with trends within
the general shipbuilding industry and, in turn, consistent with trends within
the economy as a whole, we recast the data on the FFG7 program by reclass-
ifying into overhead the 300,000 man-hours of labor now reported in the direct
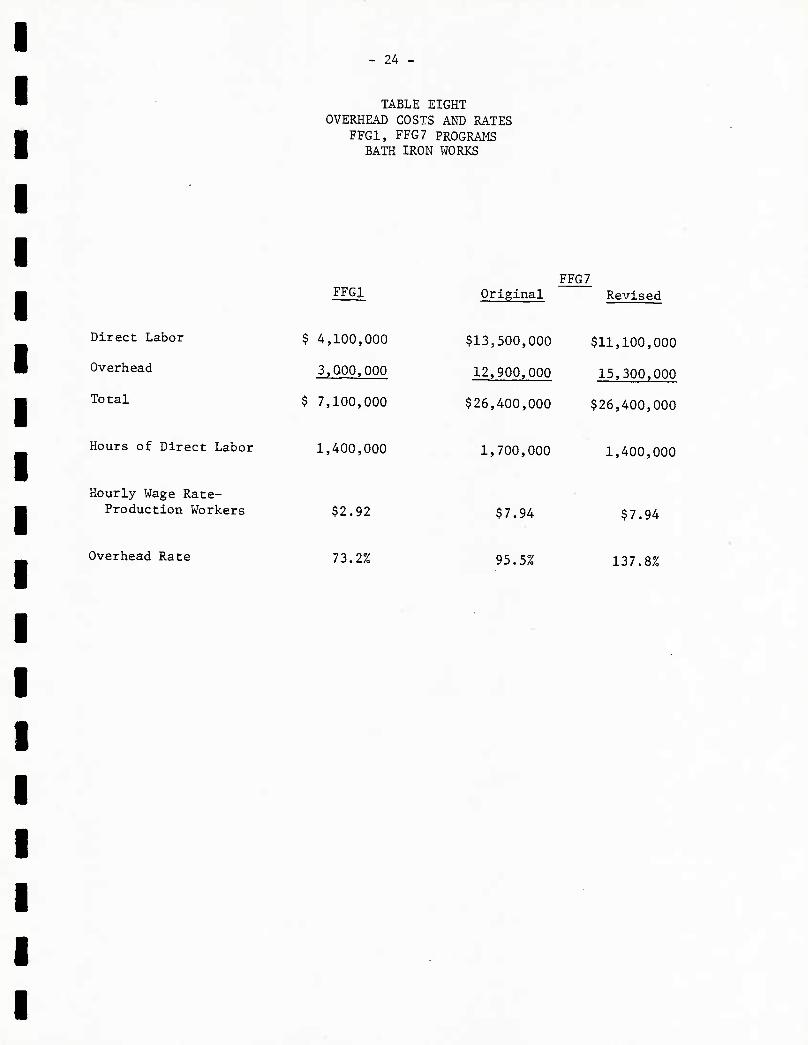
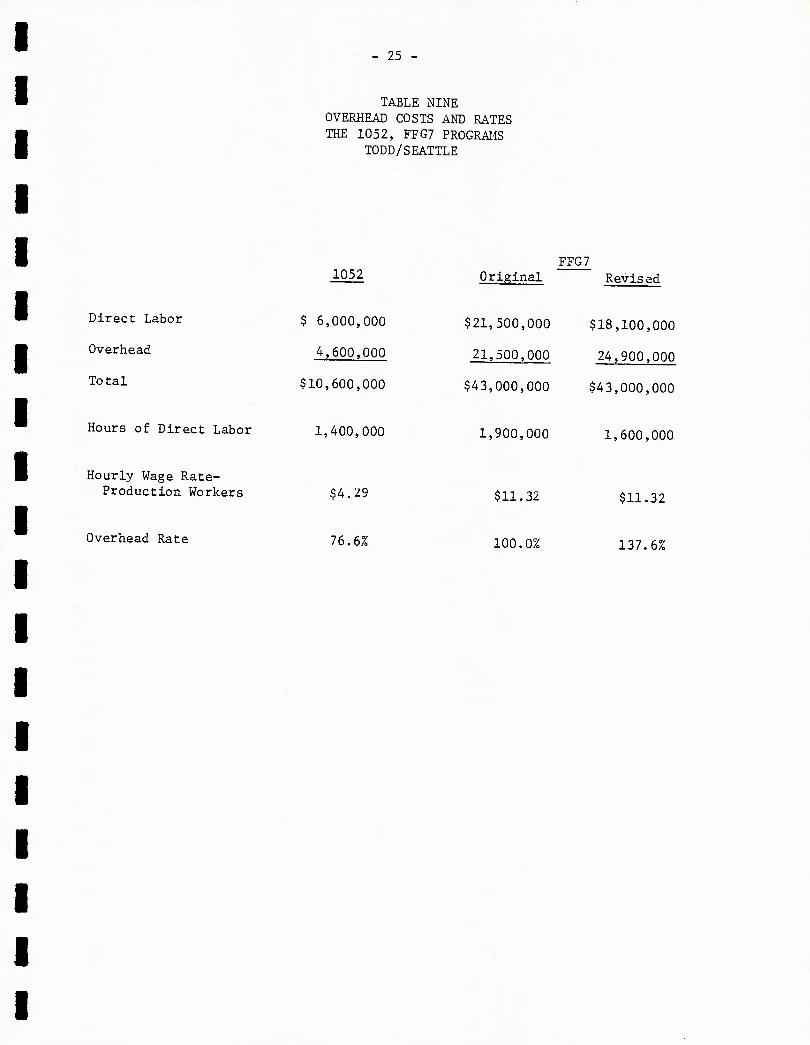
labor category. Tables Eight ana Nine show the impact on the various cost
categories resulting from this labor classification change.
These tables present us with a number of analytical issues:
• Bath's overhead rate on the FFG1 program was some 30% higher than
would be anticipated by a review of data on the industry.
• Todd's overhead rate on the 1052 was consistent with average rates
within the industry during the 1965 through 1970 time frame when
corrections are made for the statistical aberrations in 1968 and 1969.
• The corrected overhead rate on the FFG7 program appears to be consi-
derably higher than might otherwise be anticipated from a simple
extrapolation of data on the industry (Table Six). Based on industry
data, and known trends within our economy, we would anticipate a
current average overhead rate in the industry of 113% of direct labor.
This would suggest that the overhead rates on the FFG7 programs are
some 20 to 24% higher than might othewise be anticipated from a review
of trends within the shipbuilding industry in particular and the
economy in general.
• If we accept this 24% figure as correct, the cost of the FFG11 now
being built at Bath Iron Works is some 52,800,000 higher than would
otherwise be anticipated. The equivalent figure for Todd/Seattle is
some $4,500,000.
- 24 -
TABLE EIGHT OVERHEAD COSTS AND RATES
FFG1, FFG7 PROGRAMS BATH IRON WORKS
FFGX FFG7
Original Revised
Direct Labor
Overhead
Total
$ 4,100,000
3,000,000
$ 7,100,000
$13,500,000 $11,100,000
12,900,000 15,300,000
$26,400,000 $26,400,000
Hours of Direct Labor 1,400,000 1,700,000 1,400,000
Hourly Wage Rate- Production Workers $2.92 $7.94 $7.94
Overhead Rate 73.2% 95.5% 137.8%
- 25 -
TABLE NINE OVERHEAD COSTS AND RATES THE 1052, FFG7 PROGRAMS
TODD/SEATTLE
Direct Labor
Overhead
Total
Hours of Direct Labor
Hourly Wage Rate- Production Workers
1052
$ 6,000,000
4,600,000
$10,600,000
1,400,000
$4.29
FFG7 Original
1,900,000
$11.32
Revised
$21,500,000 $18,100,000
21,500,000 24,900,000
$43,000,000 $43,000,000
1,600,000
$11.32
Overhead Rate 76.6% 100.0% 137.6%
- 26 -
At the present time, we have no full explanation for this apparent dis-
continuity. Here it should be noted that the effect of this discontinuity, if
it cannot otherwise be explained, serves to increase above predictable trend
the cost of the FFG22 (Todd) by 5.5% and that of the FFG11 (Bath) by 5.2%.
Here we would caution against imputing any great degree of significance to
these figures in that:
• First and foremost, the FFG7 program is not yet far enough along to
draw definitive conclusions on costs and the trends in these costs.
Further, a 5% or 6% variation from apparent cost trends within the
industry is no doubt consistent with the increased complexity of a
naval combatant vis a vis noncombatant or commercial vessel.
• Basea on the FFG1 program, Bath appears historically to have had an
overhead rate higher than the industry as a whole. As such the
higher overhead rate at Bath might well have been anticipated.
• Last, and perhaps most important of all, the use of a "rate" is an
analytical technique only. The more important figure is the actual
cost itself...the $12,900,000 (or $15,300,000) per ship at Bath and
the $21,500,000 (or $24,900,000) at Todd/Seattle actually being spent
to construct the FFG7 class. A very substantial portion of these
costs can be explained, as will be discussed below, by a review of
labor and labor related costs at each of these yards.
- 27
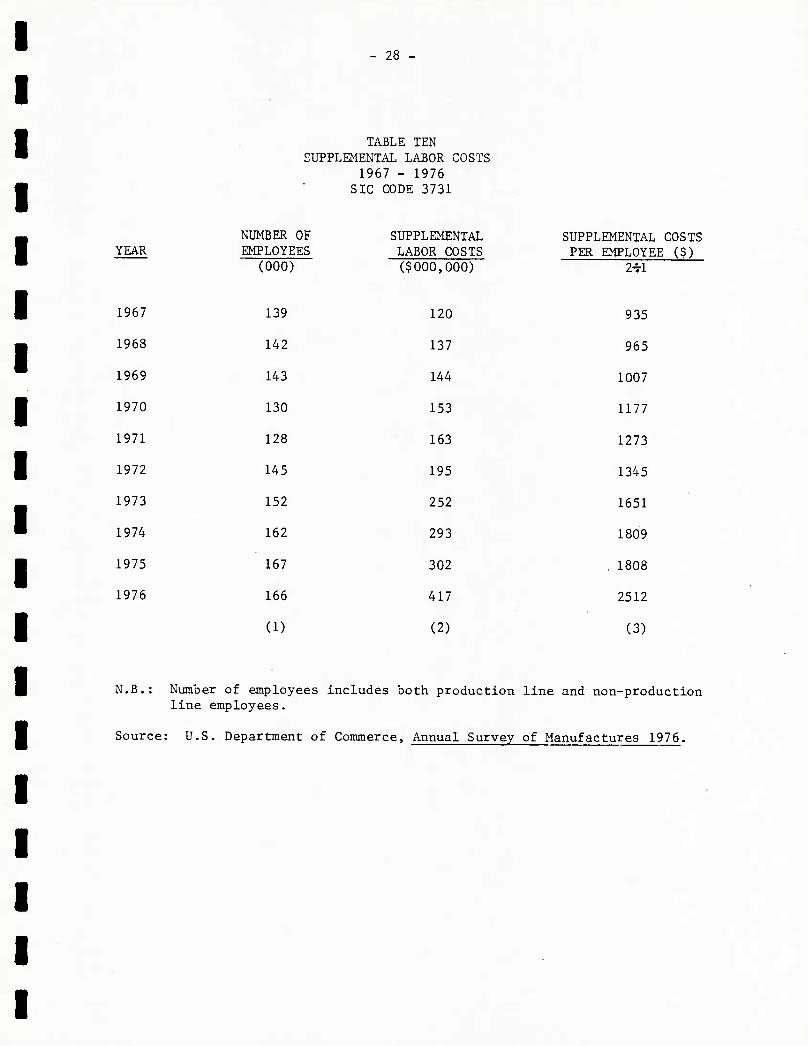
B. SUPPLEMENTAL LABOR COSTS
One of the major factors underlying the rapid increase in overhead costs
in the U.S. economy is a somewhat hidden growth in the cost of labor. Table
Three shows, for example, that average production line wages in the shipbuild-
ing industry increased from approximately $7,180 in 1966 to $12,265 in 1976.
Further increases have, of course, been recorded through 1979 such that an
average wage scale of some $17,000 per year per person should now be
anticipated.
However, concentrating on wage scales alone hides the more rapid growth
in non-wage benefits which have served to increase radically the overall cost
of labor throughout U.S. industry. Tables Ten and Eleven present data on some
of the so-called supplemental labor costs that must now be absorbed by the
U.S. shipbuilding industry, e.g.. Social Security payments, health and ac-
cident insurance policies, and other cash payments made by the employer for
the benefit of the shipyard employee. These Tables point to key reasons for
the rapid runup in overhead costs between the FFG1, 1052, and FFG7 programs:
• As shown in Table Ten, "Supplementary Labor Costs" in the industry
increased from $120,000,000 in 1967 to $417,000,000 in 1975 or from
$935 per year per employee in 1967 to $2512 per year per employee in
1976. On the reasonably correct assumption that a frigate-sized
combatant requires 1200 man-years of labor for completion, the over-
head costs incurred in the construction of such a ship would have
increased by $1,902,400 for this one item alone from 1967 through
1976, or from $1,112,000 per ship in 1972 to $3,014,000 per ship.
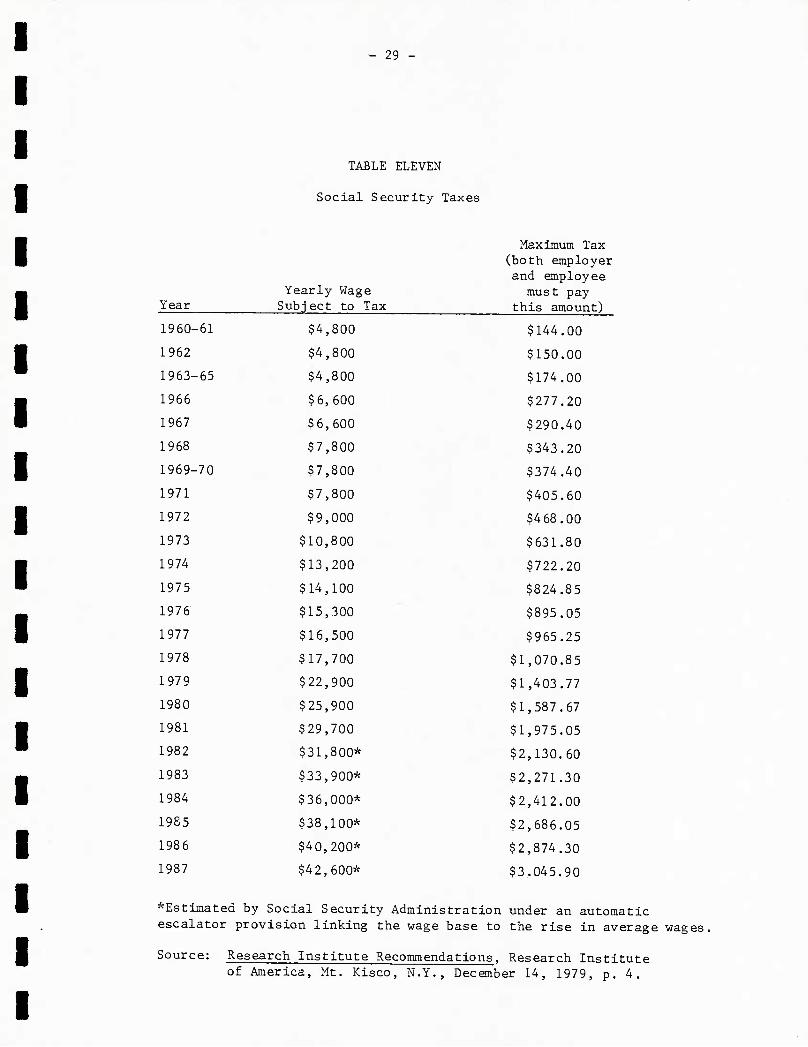
• If direct comparisons between the FFG1 and FFG7 class ships are
desired. Table Eleven is even more revealing. For ships in the FFG1
and FFG7 classes, which required some 1000 man-years of direct labor,
and 200 man-years of overhead labor, the cost to the shipyard of
28 -
YEAR
1967
1968
1969
1970
1971
1972
1973
1974
1975
1976
TABLE TEN SUPPLEMENTAL LABOR COSTS
1967 - 1976 SIC CODE 3731
NUMBER OF SUPPLEMENTAL SUPPLEMENTAL COSTS EMPLOYEES LABOR COSTS PER EMPLOYEE ($)
(000) ($000,000) 2-rl
139 120 935
142 137 965
143 144 1007
130 153 1177
128 163 1273
145 195 1345
152 252 1651
162 293 1809
167 302 1808
166 417 2512
(1) (2) (3)
N.B.: Number of employees includes both production line and non-production line employees.
Source: U.S. Department of Commerce, Annual Survey of Manufactures 1976.
- 29 -
TABLE ELEVEN
Social Security Taxes
Maximum Tax (both employer and employee
Yearly Wage must pay Year Subject to Tax this amount)
1960-61 $4,800 $144.00
1962 $4,800 $150.00
1963-65 $4,800 $174.00
1966 $6,600 $277.20
1967 $6,600 $290.40
1968 $7,800 $343.20
1969-70 $7,800 $374.40
1971 $7,800 $405.60
1972 $9,000 $468.00
1973 $10,800 $631.80
1974 $13,200 $722.20
1975 $14,100 $824.85
1976 $15,300 $895.05
1977 $16,500 $965.25
1978 $17,700 $1,070.85
1979 $22,900 $1,403.77
1980 $25,900 $1,587.67
1981 $29,700 $1,975.05
1982 $31,800* $2,130.60
1983 $33,900* $2,271.30
1984 $36,000* $2,412.00
1985 $38,100* $2,686.05
1986 $40,200* $2,874.30
1987 $42,600* $3,045.90
*Estimated by Social Security Administration under an automatic escalator provision linking the wage base to the rise in average wages
Source: Research Institute Recommendations, Research Institute of America, Mt. Kisco, N.Y., December 14, 1979, p. 4.
- 30 -
Social Security taxes alone for the 1200 man-years needed to con-
struct this ship would have increased from $208,800/ship in 1962 to
$l,684,524/ship in 1979. Put another way, the Social Security tax
costs on the FFG1 class vessel would have accounted for $200,000 of
the $3,000,000 in overhead costs needed to construct this class
vessel, or 6.66% of all overhead costs. On the FFG7, the $1,684,524
in Social Security taxes built into the cost of the ship would have
absorbed some 13.2% of the overhead costs incurred at Bath Iron
Works. Here it should be noted that these costs are not under the
control of management but are in fact federally mandated cost
increases.
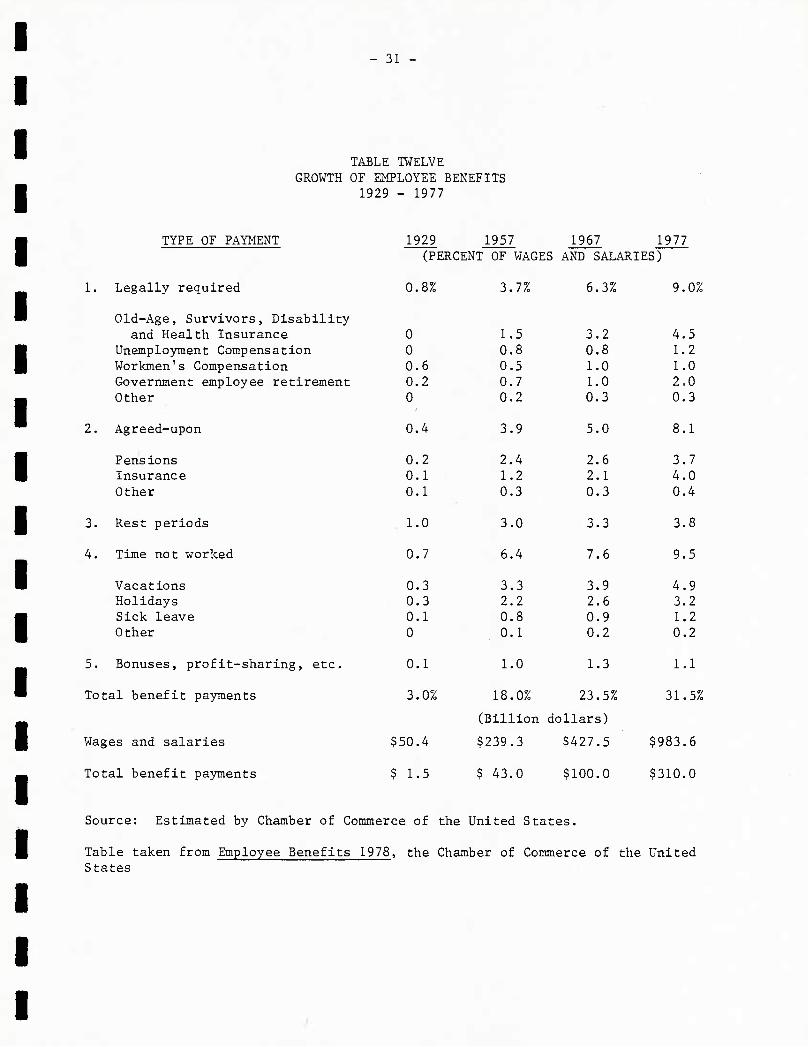
Social Security taxes, however, are but one form of supplemental labor
cost. There are, in fact, a broad range of other such costs now being absorbed
by U.S. industry and, for contract or accounting purposes, classified as over-
head. Although not specifically applicable to the shipbuilding inaustry. Table
Twelve provides data on the more general trend within our economy. In 1967,
for example, benefit payments were 23.5% of wage payments. By 1977, the last'
year for which data is available, they had increased to 31.5%.
If, once again, we assume the construction of a ship requiring 1200 man-
years of labor both in 1967 and 1976, and apply the 23.5% and 31.5% baseline
noted in Table Twelve to average industry wage scales of $7,700 in 1967 and
$13,400 in 1976, we would find that these costs accounted for $2,171,400 of
the costs charged to overhead in 1967, and $5,065,200 of the costs charged to
overhead in 1976. Whereas wages defined as such would have increased by 74%
during the ten year time span, overhead costs related to these wage payments
increased by 133%. These increased payments to labor are one of the major
factors driving overhead rates within the U.S. economy and, in fact, account
for a heavy portion of the increase in overhead costs and rates between the
FFG1, 1052, and FFG7 classes of combatants. Indeed, a full investigation of
these costs reveals that they are the major cost absorbed in overhead at Todd/ Seattle.
- 31
TABLE TWELVE GROWTH OF EMPLOYEE BENEFITS
1929 - 1977
TYPE OF PAYMENT
1. Legally required
Old-Age, Survivors, Disability and Health Insurance
Unemployment Compensation Workmen's Compensation Government employee retirement Other
2. Agreed-upon
Pensions Insurance Other
3. Rest periods
4. Time not worked
Vacations Holidays Sick leave Other
5. Bonuses, profit-sharing, etc.
Total benefit payments
Wages and salaries
Total benefit payments
1929 1957 1967 1977 (PERCENT OF WAGES AND SALARIES)
0.8%
0.4
3.7%
3.9
6.3%
5.0
9.0%
0 1.5 3.2 4.5 0 0.8 0.8 1.2 0.6 0.5 1.0 1.0 0.2 0.7 1.0 2.0 0 0.2 0.3 0.3
8.1
0.2 2.4 2.6 3.7 0.1 1.2 2.1 4.0 0.1 0.3 0.3 0.4
1.0 3.0 3.3 3.8
0.7 6.4 7.6 9.5
0.3 3.3 3.9 4.9 0.3 2.2 2.6 3.2 0.1 0.8 0.9 1.2 0 0.1 0.2 0.2
0.1 1.0 1.3 1.1
3.0% 18.0% 23.5% 31.5%
(Billion dollars)
$50.4 $239.3 $427.5 $983.6
$ 1.5 $ 43.0 $100.0 $310.0
Source: Estimated by Chamber of Commerce of the United States.
Table taken from Employee Benefits 1978, the Chamber of Connnerce of the United States
- 32
C. FRINGE BENEFITS AND RELATED COSTS:
TODD/SEATTLE
Supplemental wage costs at Todd/Seattle have increased even more than
noted above reflecting two factors:
• The wage scales in the Pacific Coast Conference to which Todd as a
union shop belongs.
• The extremely high cost of Workmen's Compensation Insurance required
at facilities covered by the Harbor and Longshoreman's Act. In 1979,
Workmen's Compensation by itself represented a charge to overhead
equal to 15% of all direct labor charges.
Data on actual wage costs at the yard for January 1975 and July 1979 are
presented below:
Direct Wage
Related Fringe and Supplemental
Labor Costs
Total hourly labor cost
Jan. 1975 July 1979
$6.48 $11.10
2.40
$8.88
5.33
$16.43
Fringe as a % of direct
1abor hourly rate 37% 48%
If the current $5.33 per hour rate is applied to the actual overhead costs
incurred by Todd shipyards in the construction of the FFG22, this would then
mean that approximately $10,000,000, or 47% of the cost now being charged to
the overhead cost account is, in fact, labor-related. Bath indicated that its
current rate for the equivalent supplemental labor costs was approximately 40%
- 33 -
of direct labor or $3.18 per hour. For Bath, that means that approximately
$5,400,000 .of the total overhead cost charged to the FFG11 is due to supple-
mental labor costs, most of which are legislatively mandated. These costs
account then for almost 42% of the total overhead costs charged to the FFG11.
Many of these costs were either non-existent or virtually negligible in 1963/65
when the FFG1 class was built, and significantly greater today than when the
1052 class was constructed at Todd/Seattle in 1965/1970.
Although it is beyond the scope of this paper, it is reasonably evident
that there have been major structual changes in the economy since the mid-1960s
and that these have served to increase the actual cost of labor at a far faster
rate than is generally realized. Because of accounting conventions, these
labor-related costs are generally included in the overhead accounts despite the
fact that this convention obscures the full cost of production line labor.
Correcting for this convention, however, will not serve to reduce total cost
but only to shift it from one account to another, i.e., from overhead to
direct labor.
More important to our analysis, however, is the fact that this trend has
occured throughout our entire economy and helps to explain the trend in over-
head rates shown in Tables Six and Seven. In other words, we now see little
discontinuity between trends in overhead costs and rates for the economy as a
whole and the trends exhibited in the FFG1, 1052 and FFG7 programs.
- 34 -
D. INDIRECT LABOR
In order to verify the contention that the direct labor charge on the
FFG7 program included the personnel normally charged as overhead, we asked for
data on the number of personnel charged to various overhead accounts at both
yards. Bath reported that 600 people, or 13.0% of its 4500 personnel were now
carried as "indirect labor". The equivalent figure for Todd/Seattle was 15.2%
or 550 persons out of a total labor force of 3600. Both of these figures are
significantly lower than what would otherwise be expected from a review of
data in the industry (Table Thirteen), and would appear to support their con-
tentions that changes in manpower reporting techniques account for the 300,000
direct man-hour differential between the FFGl and 1052, and the FFG7 class
ships.
- 35 -
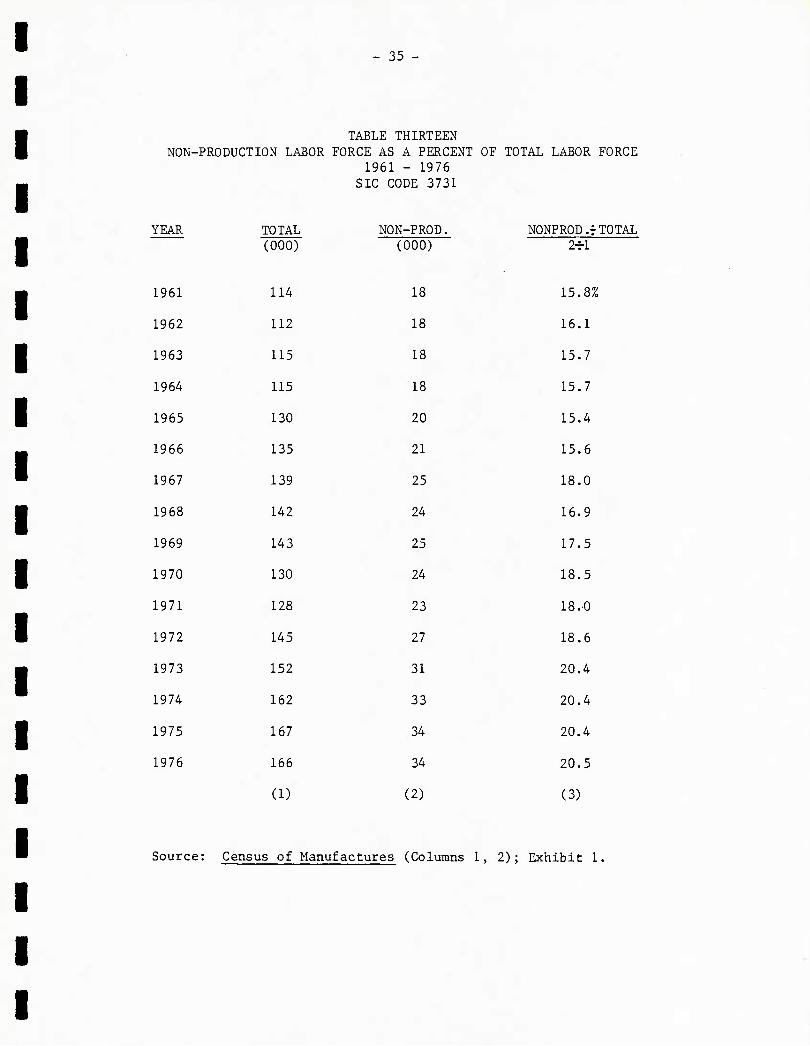
TABLE THIRTEEN NON-PRODUCTION LABOR FORCE AS A PERCENT OF TOTAL LABOR FORCE
1961 - 1976 SIC CODE 3731
YEAR TOTAL (000)
1961 114
1962 112
1963 115
1964 115
1965 130
1966 135
1967 139
1968 142
1969 143
1970 130
1971 128
1972 145
1973 152
1974 162
1975 167
1976 166
(1)
NON-PROD. NONPROD.rTOTAL (000) 2-rl
18 15.8%
18 16.1
18 15.7
18 15.7
20 15.4
21 15.6
25 18.0
24 16.9
25 17.5
24 18.5
23 18.0
27 18.6
31 20.4
33 20.4
34 20.4
34 20.5
(2) (3)
Source: Census of Manufactures (Columns 1, 2); Exhibit 1.
- 36 -
E. SUMMARY
Based on our review of the data made available to us, and a comparison of
these data with trends in the economy as a whole, we do not now see any major
discontinuity in either the direct labor or overhead accounts at the shipyard
level between the FFG1, 1052 and FFG7 programs. The most cogent reality under-
lying these figures is (1) the high rate of inflation that has obtained in the
economy since the early 1970s, and (2) the significant change in the structure
of wage and salary payments in the United States since 1965.
The difference in the cost between the FFG11 (Bath) and the FFG22 (Todd)
is, for the most part, a function of regional differences in wage scales once
corrections have been made for the 200,000 hours of additional labor now
required by Todd on its FFG7 class vessels.
- 37 -
V. DIRECT MATERIAL
Of the three major cost categories - Direct Labor, Overhead, and Direct
Material - we believe that the trend in the cost of Direct Material is perhaps
the least complex to identify and analyze.
In order to accomplish this task, we relied on three specific data bases:
• Once again, we used Exhibit I as a major source document, this time
to determine the trend in the dollar value of the materials used by
shipyard workers.
• Comparative data on material utilization rates per production line
worker in four other industries; i.e., the aircraft, iron and steel
forgings, internal combustion engine and pumps and pumping equipment
industries.
• Specific data on the prices of a limited number of raw materials and
metals commonly used in the shipbuilding industry. These data are
direct indicators of the material cost inflation to which the indu'stry
has been exposed since 1961.
- 38 -
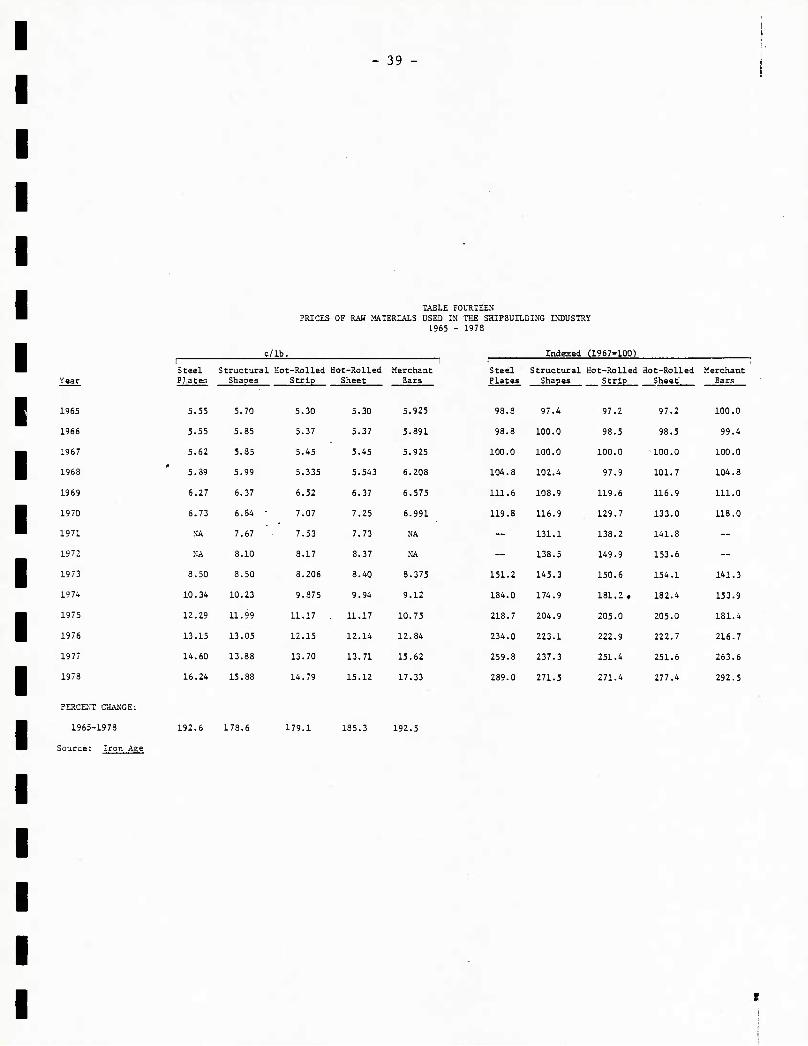
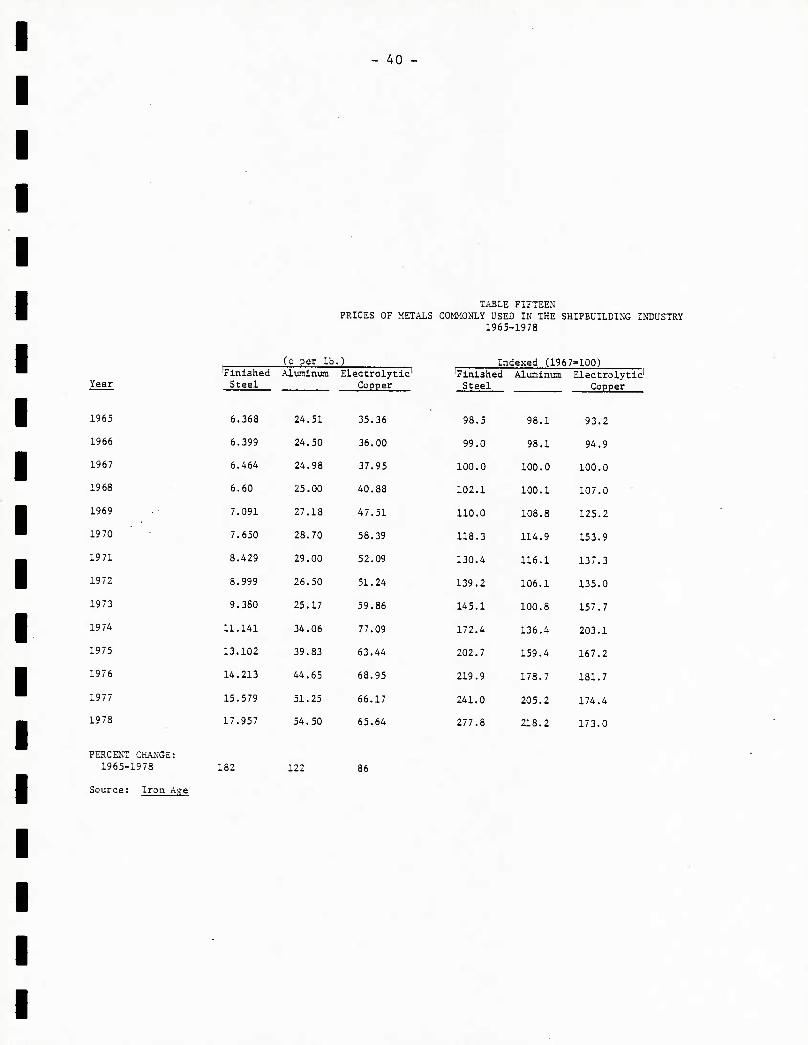
A. RAW MATERIAL PRICES
Before discussing the data set out in Tables Fourteen and Fifteen, it
should be noted here that we are aware of the fact that the range of raw
materials used in the FFG7 class is not a duplicate of the material used in
the FFG1 or 1052 class. We are aware, for example, of (1) the change in
propulsion system in the FFG7 from the two earlier classes of vessels and the
implication of this change on the type of materials and other equipment going
into the FFG7 class ship; and (2) the greater use of electronics and other
equipment for ship control purposes in the FFG7 class vis a vis the FFG1 and
1052 classes. Notwithstanding these changes, we believe that the use of
general economic data is sufficiently revealing for the purposes of this
project since a review of the data on the shipbuilding industry strongly
suggests that the rate of utilization of raw material has not changed in the
industry, i.e., that there has been a relatively constant substitution factor.
In order to develop comparative data, we have reduced the material cost
for the 1052 by some $5,000,000 to account for the fact that its propulsion
system was supplied by the contractor, whereas it is GFE on FFG1 and FFG7
class ships. This adjustment then gives us the following revised material
costs for the three ships.
FFG1 - $ 5,700,000 (1953/1965)
1052 - $ 5,700,000 (1965/1970)
FFG7 - $21,700,000 (1978/1980)
Based on this, the direct material cost for these three classes of com-
batants increased by a very moderate 17.5% from 1953/1965 to 1965/1970 (FFG1
vs 1052) and by an apparently extreme 224% from 1965/1970 (1052 vs FFG7) and
281% from 1953/1965 respectively to 1978/1980 (FFG1 vs FFG7).
39 -
TABLE FOURTEEN PRICES OF RAH MATERIALS USED IN THE SHIPBUILDING INDUSTRY
1965 - 1978
c/lb. Indexed (1967-100) 1 Steel Structural Hot-Rolled Hot-Rolled
— '■■ 1
Merchant 1 Steel Structural Hot-Rolled Hot-Rolled Merchant
Plateo Shaoes Strip Sheet Bars Plates
98.3
Shapes
97.4
Strip
97.2
Sheet
97.2
Bars
5.55 5.70 5.30 5.30 5.925 100.0
5.55 5.85 5.37 5.37 5.891 98.8 100.0 98.5 98.5 99.4
5.62 5.35 5.45 5.45 5.925 100.0 100.0 100.0 100.0 100.0
5.39 5.99 5.335 5.543 6.208 104.8 102.4 97.9 101.7 104.8
6.27 6.37 6.52 6.37 6.575 111.6 108.9 119.6 116.9 111.0
6.73 6.84 • 7.07 7.25 6.991 119.8 116.9 129.7 133.0 113.0
NA 7.67 7.53 7.73 NA - 131.1 133.2 141.3 —
MA 3.10 8.17 3.37 NA — 133.5 149.9 153.6 ~
8.50 3.50 3.206 3.40 8.375 151.2 145.3 150.6 154.1 141.3
10.34 10.23 9.375 9.94 9.12 184.0 174.9 181.2, 182.4 153.9
12.29 11.99 11.17 11.17 10.75 218.7 204.9 205.0 205.0 131.4
13.15 13.05 12.15 12.14 12.84 234.0 223.1 222.9 222.7 216.7
14.60 13.33 13.70 13.71 15.62 259.3 237.3 251.4 251.6 263.6
16.24 15.83 14.79 15.12 17.33 239.0 271.5 271.4 277.4 292.5
Year
1965
1966
1967
1968
1969
1970
1971
1972
1973
1974
1975
1976
1977
1978
PERCENT CHANGE:
1965-1978 192.6 173.6 179.1 135.3 192.5
Source: Iron Age
- 40 -
TABLE FIFTEEN PRICES OF METALS COMMONLY USED IN THE SHIPBUILDING INDUSTRY
1965-1978
(C per lb ) Indexed (1967 -100)
Year 'finished Steel
6.368
Aluminum Electrolytic' Copper
'Finished Steel
98.5
Aluminum Electrolytic' Copper
1965 24.51 35.36 98.1 93.2
1966 6.399 24.50 36.00 99.0 98.1 94.9
1967 6.464 24.98 37.95 100.0 100.0 100.0
1968 6.50 25.00 40.88 102.1 100.1 107.0
1969 7.091 27.18 47.51 110.0 108.8 125.2
1970 7.650 28.70 58.39 118.3 114.9 153.9
1971 8.429 29.00 52.09 130.4 116.1 137.3
1972 8.999 26.50 51.24 139.2 106.1 135.0
1973 9.380 25.17 59.86 145.1 100.8 157.7
19 74 11.141 34.06 77.09 172.4 136.4 203.1
1975 13.102 39.83 63.44 202.7 159.4 167.2
1976 14.213 44.65 68.95 219.9 178.7 181.7
1977 15.579 51.25 66.17 241.0 205.2 174.4
1978 17.957 54.50 65.64 277.8 218.2 173.0
PERCENT CHANGE: 1965-1978 182 122 86
Source: Iron Age
41 -
This data turns out to be reasonably consistent with that shown in Table
Fourteen. The price of steel plate, for example, increased by 21.3% from 1965
to 1970. However, the increase from 1965 to 1978 was rather astounding 193%
with the greater bulk of the change coming after 1973. Equally moderate price
increases were recorded for structural shapes, hot rolled strip, hot rolled
sheets, and merchant bars between 1965 to 1970. Indeed, price increases were
relatively moderate until 1973 when they accelerated sharply to the point that
price increases for individual shipbuilding metals of 14-20% per year are no
longer uncommon. Indeed, the prices of most of the items listed in Table
Fourteen virtually doubled from 1973 through 1979 and would appear to be
ready to double again between 1978 and 1983. To the extent that Table Four-
teen is representative of the type of materials used in the shipbuilding
industry, these data support our earlier contention that there is no major
dicontinuity in the trends in the cost of shipbuilding material when the FFG7
class is compared to either the FFG1 or 1052 class vessels. Annual rates of
increases of from 14 to 20% annually mean that prices will double every three
to five years. As must be obvious, none of these costs can be controlled
either by the Navy or the shipbuilding industry.
Table Fourteen provides additional insight into the data displayed in
Table Thirteen and provides additional confirmation on our contention of veri-
fiable changes in the cost of raw materials. Here it should be noted that the
prices of materials used in shipbuilding, and other forms of heavy construc-
tion, have accelerated at rates far in excess of the market basket of goods
classified in either the Consumer Price Index or the Wholesale Price Index and
that reference to these indices are inappropriate for the task at hand. The
reasons for the unusual rate of growth in the prices of raw material are, of
course, beyond the scope of this report and have to do with such factors as
the increased need for the U.S. to import high grade iron ores, the increased
cost of processing lower grade ores otherwise available domestically, and
economic trends within the so-called Third World. Irrespective of the reasons
for these increased prices, however, they are a fact of the market place to
which the Navy has no choice but to accommodate.
42 -
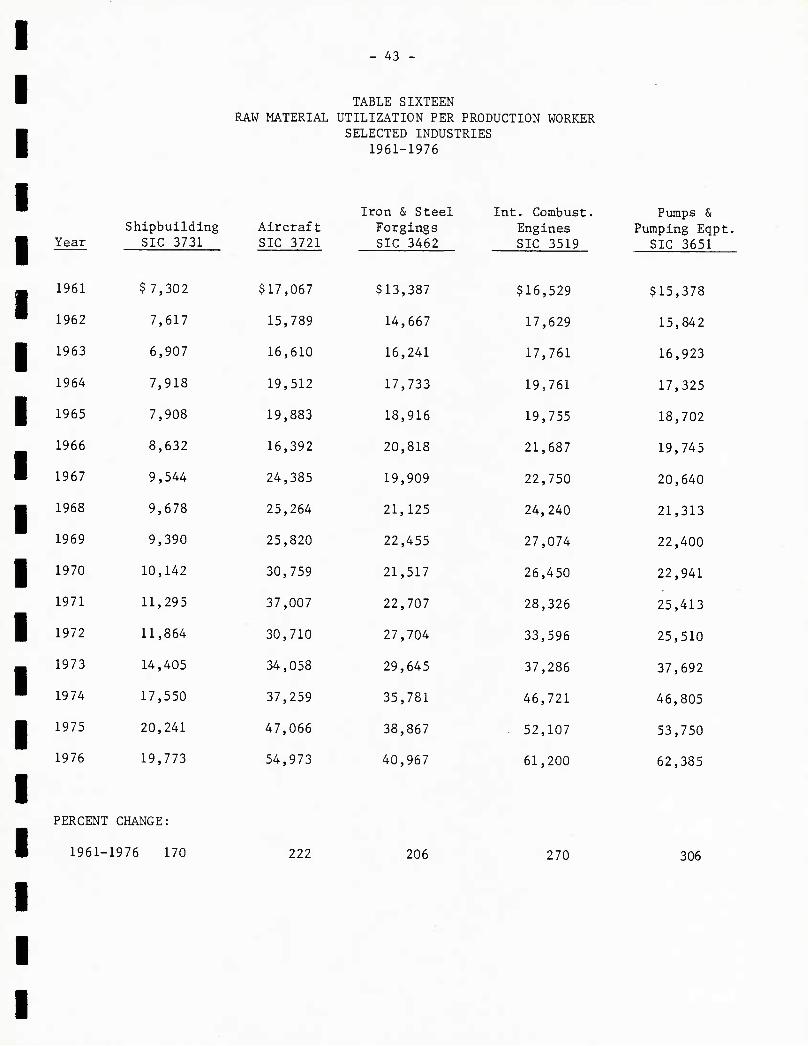
B. RAW MATERIAL UTILIZATION:
U.S. SHIPBUILDING INDUSTRY
In order to verify the applicability of the data contained in Tables
Fourteen and Fifteen to the shipbuilding industry, we also developed data on
the utilization of raw material per shipyard production worker for the 15 year
period beginning in 1961 and ending in 1976. This data, as with earlier data
on the industry, is based on an analysis of Exhibit I and is presented in
Table Sixteen. It confirms the cost trends established by the basic data set
out in Tables Fourteen and Fifteen and shows the increased monetary value of
raw material consumed by the shipyard production line worker. Once again, in
order to make certain that trends within the shipbuilding industry were con-
sistent with those found in other industries, we gathered similar data for
four other industries. As the data show, the trend in the shipbuilding
industry is not unlike that found in other key industries in the United States.
Indeed, the monetary value of the raw material consumed per shipyard
worker increased at a lower rate than that which obtained in the other indus-
tries tracked in this project.
As is obvious, these figures are uncorrected for any imputed increase in
worker productivity and, as such, reflect solely the inflationary factors
alluded to in Tables Fourteen and Fifteen. The sheer, unadorned fact is that
our economy has been subject to significant inflationary pressures ever since
1945, with gradual increases in inflation rates through the 1960s. These
rates then reached explosive proportions in 1972 and 1973 such that direct
comparisons between the prices, products and/or services after 1973 are
subject to significant adjustments.
In a sense, this has been the key message of this entire report -- that
inflation in wage scales, in related supplementary salary costs, in the costs
of supplies, equipment, and raw materials used in the construction of a ship
have increased more rapidly since the early 1960s than is otherwise contem-
- 43 -
TABLE SIXTEEN RAW MATERIAL UTILIZATION PER PRODUCTION WORKER
SELECTED INDUSTRIES 1961-1976
Year Shipbuilding
SIC 3731 Aircraft SIC 3721
$17,067
Iron & Steel Forgings SIC 3462
Int. Combust. Engines SIC 3519
$16,529
Pumps & Pumping Eqpt.
SIC 3651
1961 $7,302 $13,387 $15,378
1962 7,617 15,789 14,667 17,629 15,842
1963 6,907 16,610 16,241 17,761 16,923
1964 7,918 19,512 17,733 19,761 17,325
1965 7,908 19,883 18,916 19,755 18,702
1966 8,632 16,392 20,818 21,687 19,745
1967 9,544 24,385 19,909 22,750 20,640
1968 9,678 25,264 21,125 24,240 21,313
1969 9,390 25,820 22,455 27,074 22,400
1970 10,142 30,759 21,517 26,450 22,941
1971 11,295 37,007 22,707 28,326 25,413
1972 11,864 30,710 27,704 33,596 25,510
1973 14,405 34,058 29,645 37,286 37,692
1974 17,550 37,259 35,781 46,721 46,805
1975 20,241 47,066 38,867 . 52,107 53,750
1976 19,773 54,973 40,967 61,200 62,385
PERCENT CHANGE:
1961-1976 170 222 206 270 306
- 44 -
plated. Further, the impact of inflation has not been felt equally by all
segments of our economy; some costs have risen at a faster pace than others
Of these the rapid rise in the cost of housing is perhaps the most significant
to this project since residential housing is the largest construction-oriented
industry in the United States and, along with industrial construction, a major
competitor for the labor skills used in a shipyard and, to a lesser extent
the raw materials. The increased costs of naval construction then have been
somewhat a mirror image of increased costs in our civilian economy.
- 45
VI. CONCLUSION
Based on our analysis, we do not believe that there are any major discon-
tinuities in the shipyard costs of the FFG1, 1052, and FFG7 programs when
these programs are compared to each other. At the shipyard level, the major
factor driving costs upwards has been the general inflationary trend within
our economy.
Labor costs at Bath Iron Works appear to be more consistent with general
economic trends than those at Todd/Seattle. However, Bath is the prime if not
the sole major employer of persons in the Bath, Maine area and Todd/Seattle
competes not only with other busy shipbuilding and repair yards but also with
the aerospace and construction industry for personnel. Given their locations,
then, these differences are explainable.
Overhead costs and rates at the two yards are similarly divergent but
since a heavy portion of overhead is related to supplemental labor costs,
these differences must be expected. Of note here is the fact that the over-
head account must also absorb the salary costs and benefits of indirect labor
personnel, some 600 people at Bath, and 550 people at Todd. Thus, overhead
costs and rates, as we have defined them, are very much a function of under-
lying wage and salary scales and account for between 60-70% of the total
overhead costs incurred by both yards. On the assumption that labor costs are
reasonably well controlled by the shipyard, the amount of costs otherwise con-
trollable by management in the Direct Labor and Overhead Cost category are
small when measured against the total cost incurred.
Material costs at both yards are reasonably similar as would be antic-
ipated by a review of the planning process that preceded the implementation of
the FFG7 program. Once again, material costs appear to be consistent with
known trends within our economy. We see no major divergence here if appro-
priate indicators are used.
- 46
As noted in the report, the one cost category that we are not able to
reconcile to our complete satisfaction is overhead. Here costs appear to be
$3-5,000,000 higher than might otherwise be anticipated. Although we cannot
prove it, it appears evident from our analysis that these costs reflect the
costs of federally mandated programs such as 0SHA, the cost of compliance with
an increased number of federal and state programs, and the inevitable result
of new DoD regulations and DARs calling for more "control" functions to be
performed at the contractor level. Because industry does not maintain its
records in a manner consistent with a detailed analysis of these cost drivers,
it is now impossible to fully assess their cost. The existence of the discre-
pency noted above, however, does not point in this direction.
In summation, then, the current shipyard cost of the FFG7 program is due
primarily to factors above and beyond the control of either the Navy or the
shipbuilding industry. For the most part, these high costs are due to the
inflationary trend within our economy, a trend which has rapidly accelerated
since 1973 and now appears to be the main cost driver not only for the U.S.
shipbuilding industry but for our industrial economy in its entirety.