scenarios for future co2 emissions in transport: the … lee... · scenarios for future co2...
TRANSCRIPT

1
Scenarios for Future CO2 Emissions in Transport:The Role of the Car as a Constraint or Challenge?
Lee Schipper, Ph.D. Senior Project Engineer
Precourt Institute for Energy EfficiencyStanford
AlsoGlobal Metropolitan Studies,
Univ. of California, Berkeley CA 94707 USA
Precourt Energy Efficiency CenterStanford University
• A research and analysis institute at Stanford• Established in October 2006• Initial funding: $30 million pledge by Jay Precourt• Mission
– To improve opportunities for and implementation of energy efficient technologies, systems, and practices, with an emphasis on economically attractive deployment
– Focus on the demand side of energy markets– Energy efficiency: economically efficient reductions
in energy use (or energy intensity)
Outline of this Presentation
• Broad Approach to Saving Carbon from Cars– Background– Developed Countries– Developing Countries
• Conclusions: the Challenge is to Act Now, Keep Acting• Background Material• References:
– Millard Ball and Schipper, 2010. Are we Reaching Peak Travel? Transport Reviews (in press) (also US TRB)
– Schipper and Fulton 2009. Daunted by Diesel. Transport Research Record 2139– Schipper, Banerjee and Ng (2009). CO2 Emissions from Land Transport in India.
Transport Research Record 2114
– Schipper, Deakin et al. 2009. Considering Climate Change (Latin America), Available athttp://metrostudies.berkeley.edu/pubs/reports/Shipper-ConsidClimateChange-LatinAmer.pdf
– Schipper, Ng., Gould and Deakin 2010. “Carbon in Motion 2050” Scenarios for North America and Latin America. Tokyo. Institute for Transport Policy Studies
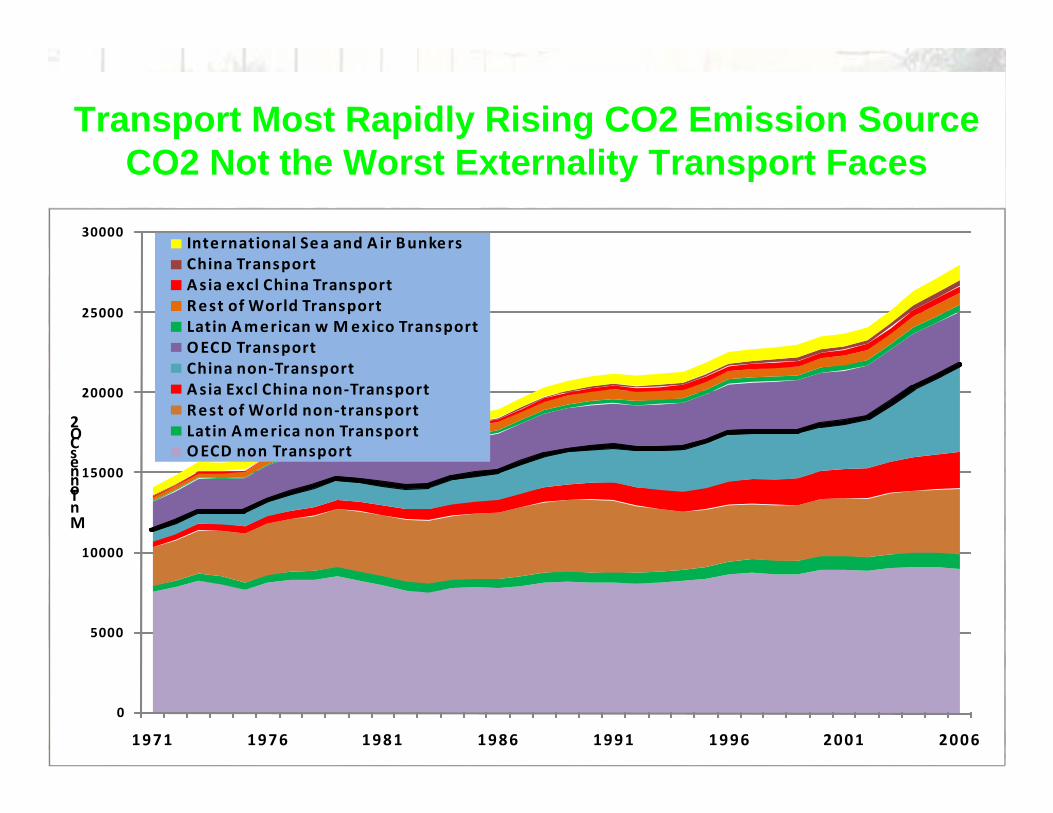
Transport Most Rapidly Rising CO2 Emission SourceCO2 Not the Worst Externality Transport Faces
0
5000
10000
15000
20000
25000
30000
1971 1976 1981 1986 1991 1996 2001 2006
Mn Tonnes CO2
International Sea and A ir BunkersChina TransportAsia excl China TransportRest of World TransportLatin American w Mexico TransportOECD TransportChina non‐TransportAsia Excl China non‐TransportRest of World non‐transportLatin America non TransportOECD non Transport
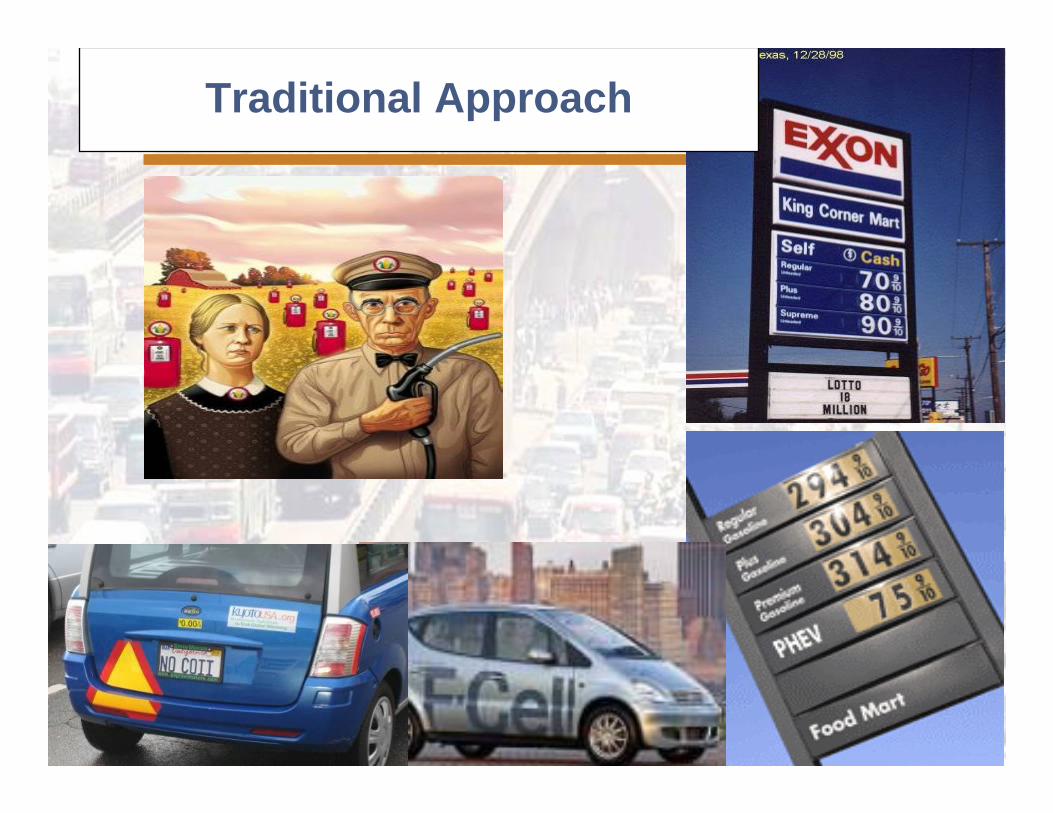
Traditional Approach

“ASIF” Decomposition of Transport Impacts (incl CO2)Note Technology and Other Factors too in New Approach
G = A Si Ii Fi,j
Impacts from Transport
* * *
Occupancy/ Load Factor
Vehicle fuel intensity Vehicle characteristics
Technological energy efficiency
Real drive cycles and routing
Veh-km and pass-km by mode
Modal Energy Intensity
Emissions per unit of energy
or volume or km
Total Transport Activity
Lesson : Challenges and Opportunities in Each Component
Fuel UseCO2, Air pollutionCongestionAccidents
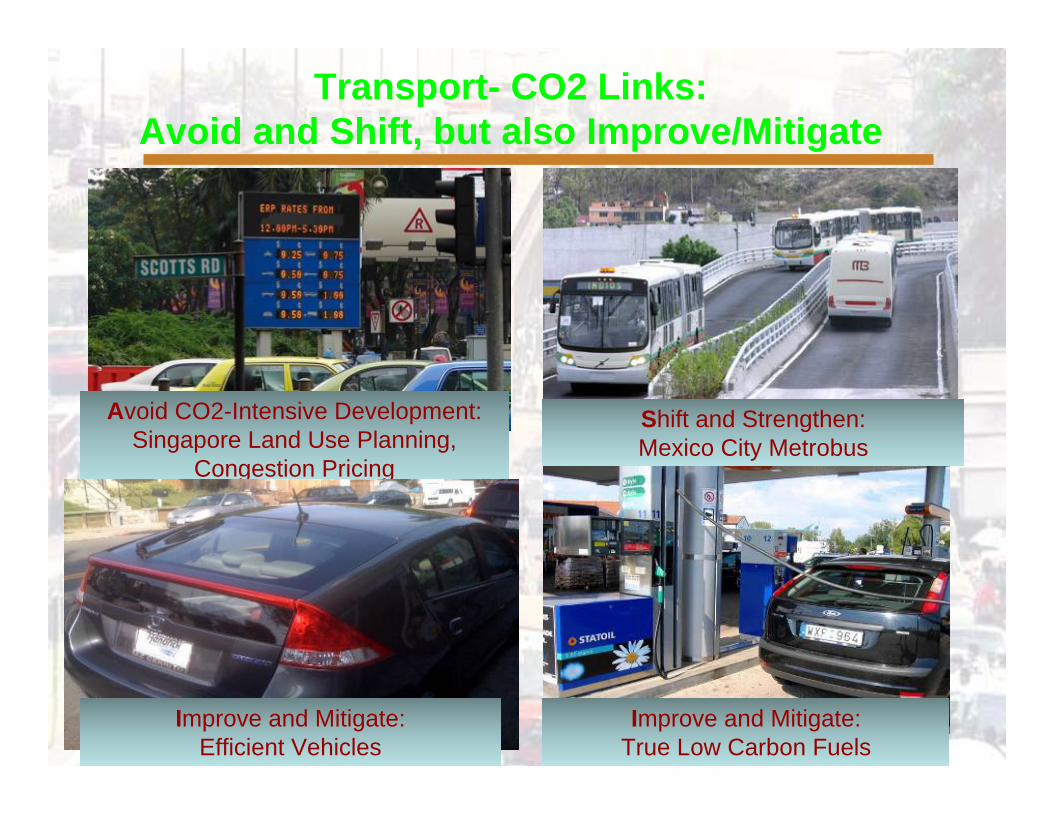
Transport- CO2 Links: Avoid and Shift, but also Improve/Mitigate
Avoid CO2-Intensive Development:Singapore Land Use Planning,
Congestion Pricing
Shift and Strengthen:Mexico City Metrobus
Improve and Mitigate: True Low Carbon Fuels
Improve and Mitigate: Efficient Vehicles
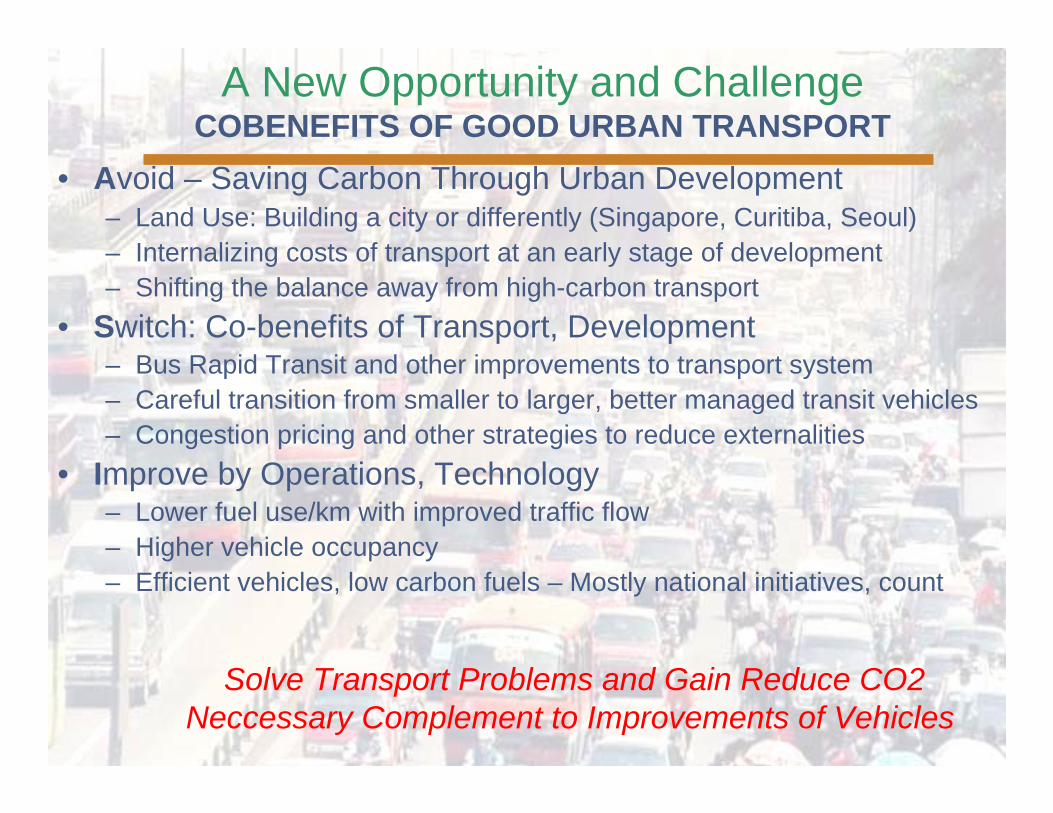
A New Opportunity and Challenge COBENEFITS OF GOOD URBAN TRANSPORT
• Avoid – Saving Carbon Through Urban Development– Land Use: Building a city or differently (Singapore, Curitiba, Seoul)– Internalizing costs of transport at an early stage of development– Shifting the balance away from high-carbon transport
• Switch: Co-benefits of Transport, Development– Bus Rapid Transit and other improvements to transport system– Careful transition from smaller to larger, better managed transit vehicles– Congestion pricing and other strategies to reduce externalities
• Improve by Operations, Technology– Lower fuel use/km with improved traffic flow– Higher vehicle occupancy– Efficient vehicles, low carbon fuels – Mostly national initiatives, count
Solve Transport Problems and Gain Reduce CO2Neccessary Complement to Improvements of Vehicles

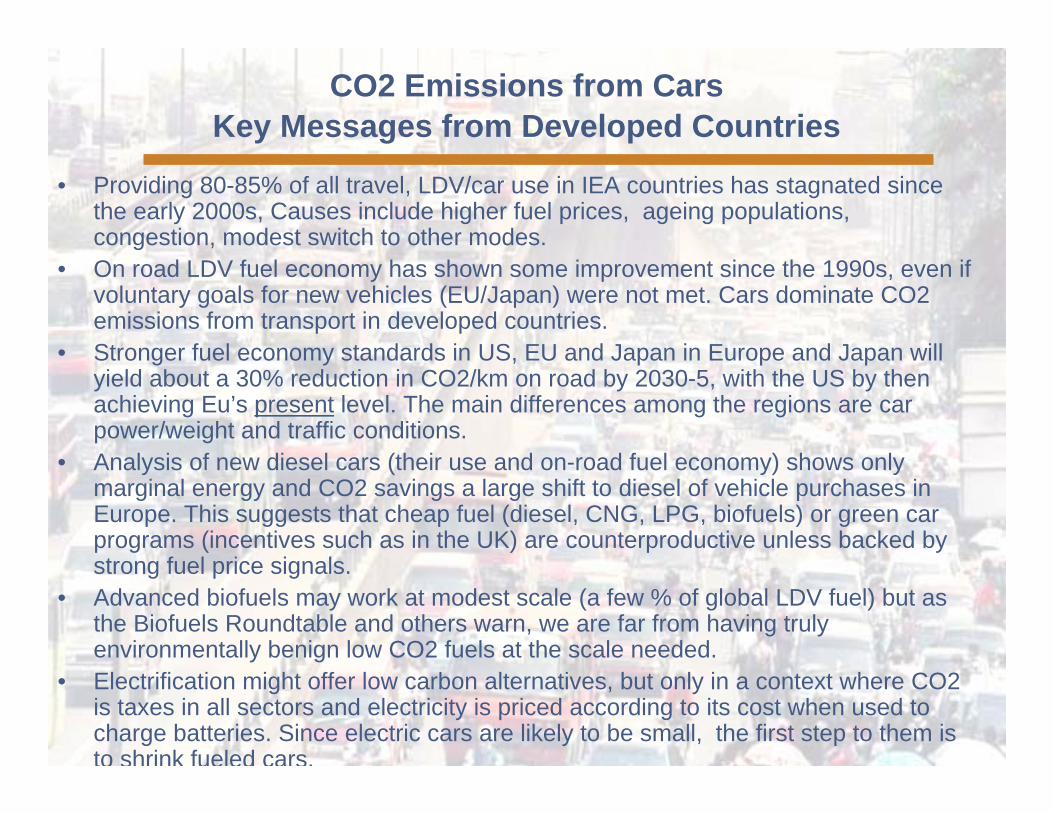
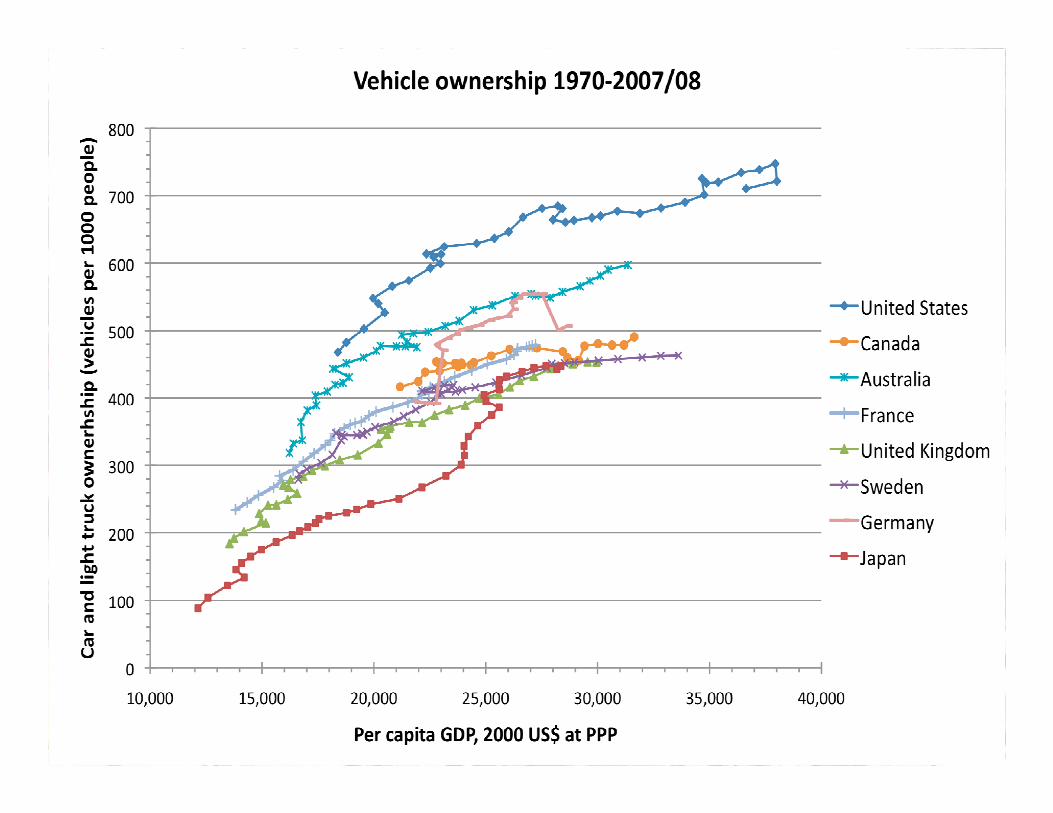
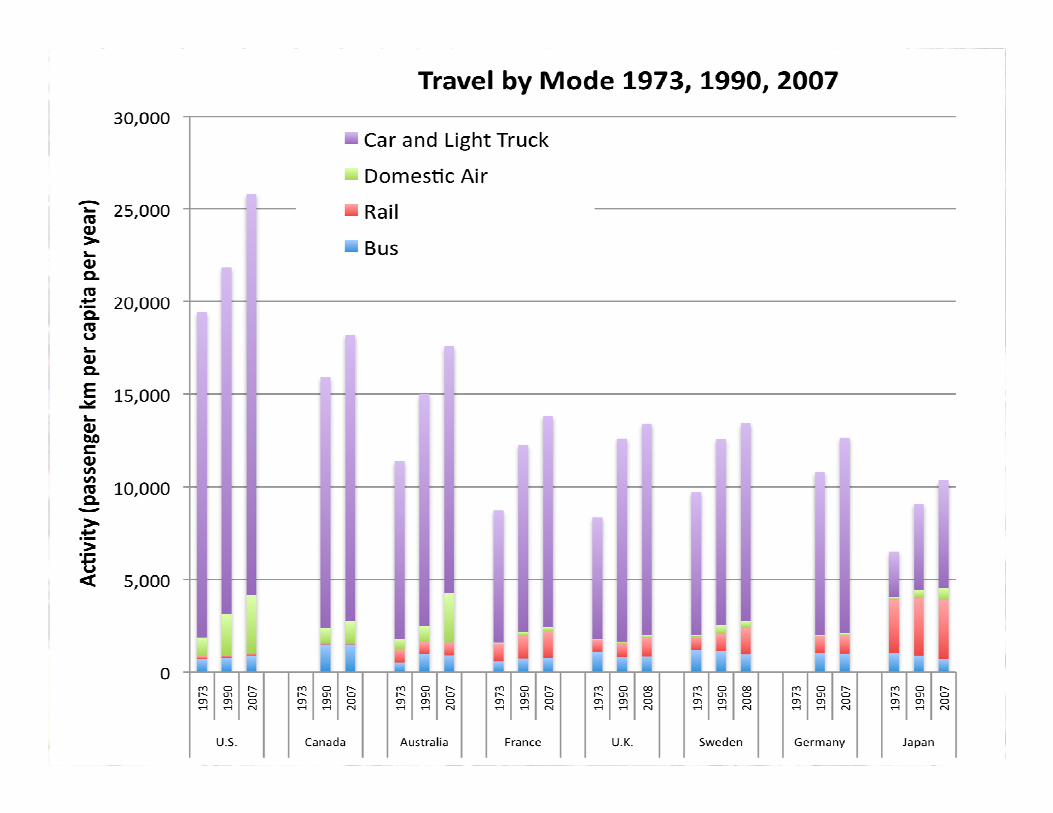
• Providing 80-85% of all travel, LDV/car use in IEA countries has stagnated since the early 2000s, Causes include higher fuel prices, ageing populations, congestion, modest switch to other modes.
• On road LDV fuel economy has shown some improvement since the 1990s, even if voluntary goals for new vehicles (EU/Japan) were not met. Cars dominate CO2 emissions from transport in developed countries.
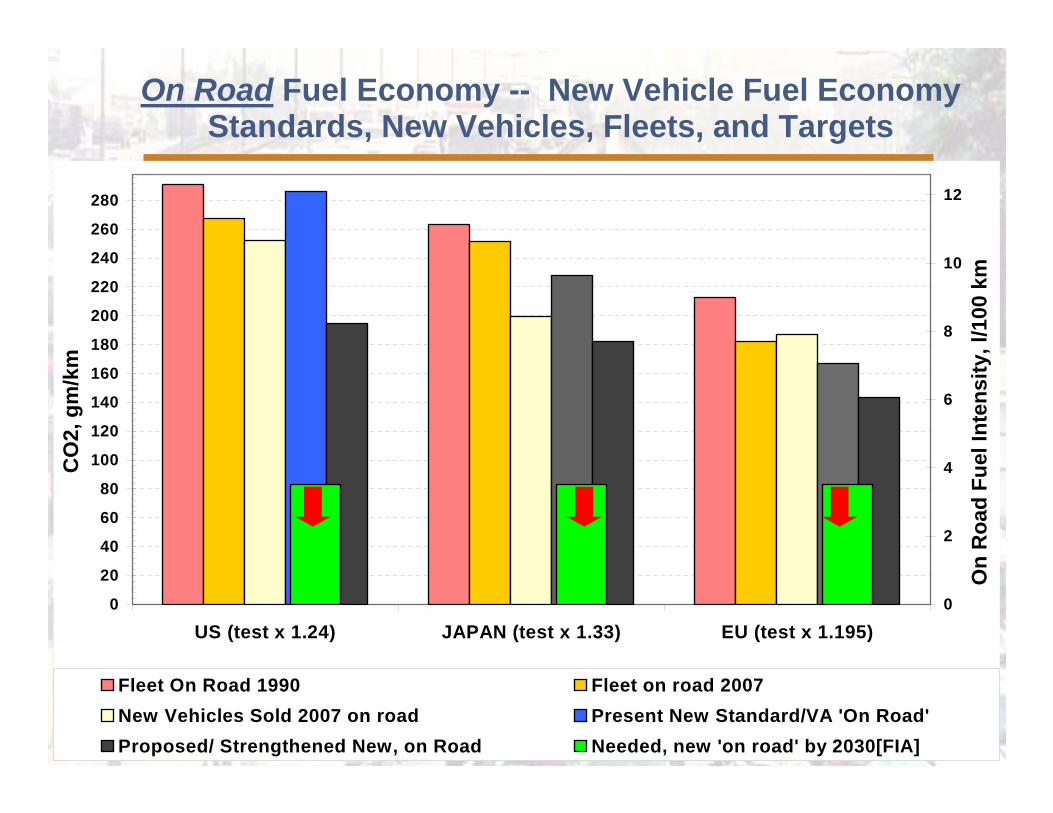
• Stronger fuel economy standards in US, EU and Japan in Europe and Japan will yield about a 30% reduction in CO2/km on road by 2030-5, with the US by then achieving Eu’s present level. The main differences among the regions are car power/weight and traffic conditions.
• Analysis of new diesel cars (their use and on-road fuel economy) shows only marginal energy and CO2 savings a large shift to diesel of vehicle purchases in Europe. This suggests that cheap fuel (diesel, CNG, LPG, biofuels) or green car programs (incentives such as in the UK) are counterproductive unless backed by strong fuel price signals.
• Advanced biofuels may work at modest scale (a few % of global LDV fuel) but as the Biofuels Roundtable and others warn, we are far from having truly environmentally benign low CO2 fuels at the scale needed.
• Electrification might offer low carbon alternatives, but only in a context where CO2 is taxes in all sectors and electricity is priced according to its cost when used to charge batteries. Since electric cars are likely to be small, the first step to them is to shrink fueled cars.
CO2 Emissions from CarsKey Messages from Developed Countries

Trends in On-Road (“real”) Fuel Intensity“Gasoline Equivalents”
0
2
4
6
8
10
12
14
16
18
20
1970 1975 1980 1985 1990 1995 2000 2005
L/10
0 km
, on
road
, gas
olin
e eq
.
0
50
100
150
200
250
300
350
400
450
CO
2, g
ram
s/km
US Cars and Household light trucks/SUVJapan incl mini carsAustraliaFranceAll GermanyItalyUKSwedenSpainCanada
\
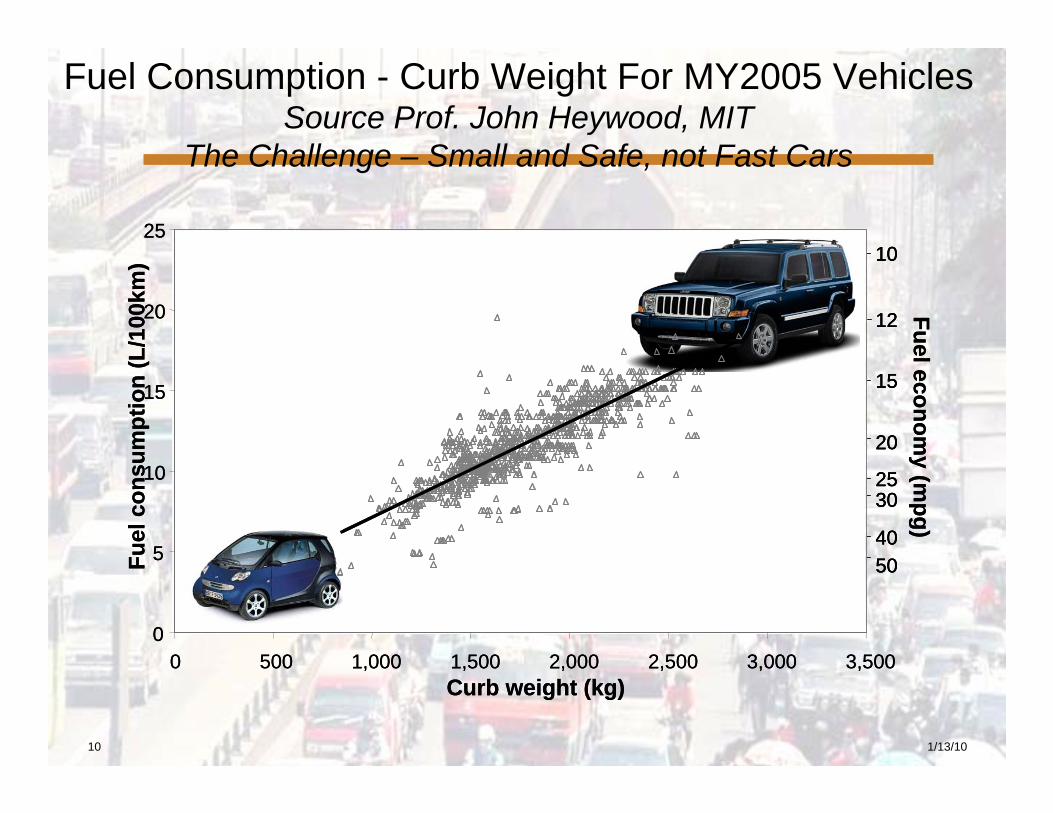
Fuel Consumption - Curb Weight For MY2005 VehiclesSource Prof. John Heywood, MIT
The Challenge – Small and Safe, not Fast CarsFuel econom
y (mpg)
5040
3025
20
15
10
12
0
5
10
15
20
25
0 500 1,000 1,500 2,000 2,500 3,000 3,500Curb weight (kg)
Fuel
con
sum
ptio
n (L
/100
km)
Fuel economy (m
pg)
5040
3025
20
15
10
12
5040
3025
20
15
10
12
0
5
10
15
20
25
0 500 1,000 1,500 2,000 2,500 3,000 3,500Curb weight (kg)
Fuel
con
sum
ptio
n (L
/100
km)
10 1/13/10
12
On Road Fuel Economy -- New Vehicle Fuel Economy Standards, New Vehicles, Fleets, and Targets
0
20
40
60
80
100
120
140
160
180
200
220
240
260
280
US (test x 1.24) JAPAN (test x 1.33) EU (test x 1.195)
CO
2, g
m/k
m
0
2
4
6
8
10
12
On
Roa
d Fu
el In
tens
ity, l
/100
km
Fleet On Road 1990 Fleet on road 2007New Vehicles Sold 2007 on road Present New Standard/VA 'On Road'Proposed/ Strengthened New, on Road Needed, new 'on road' by 2030[FIA]
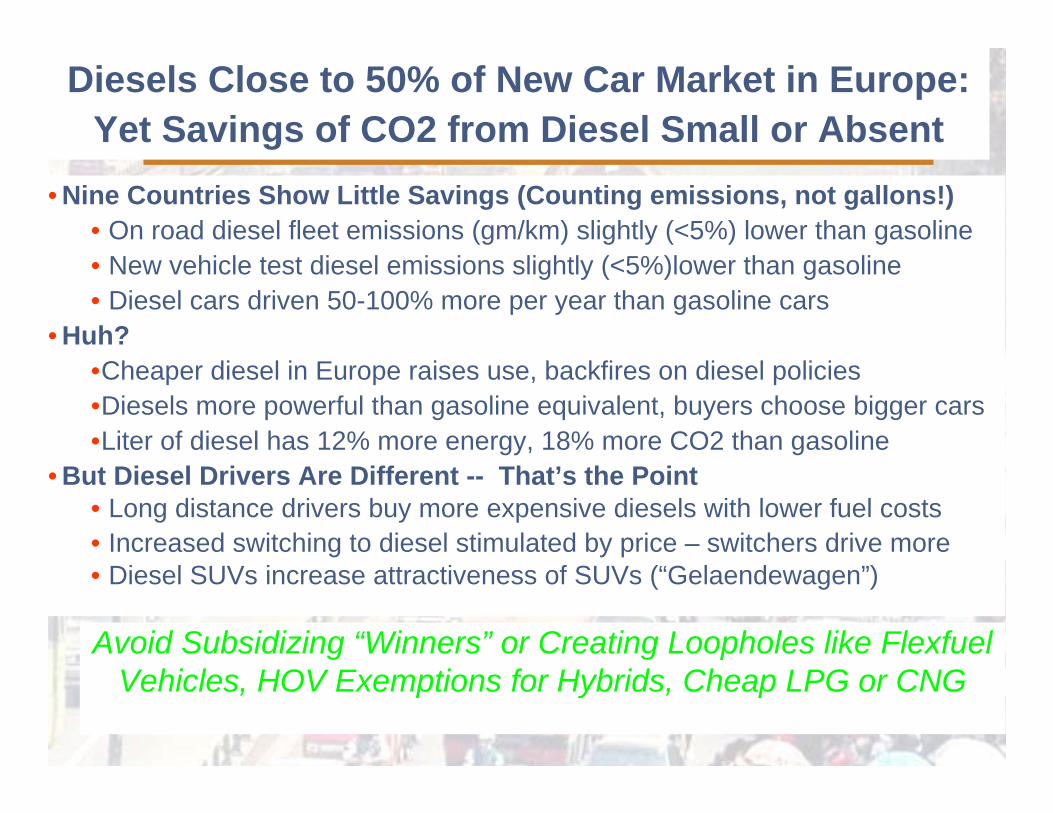
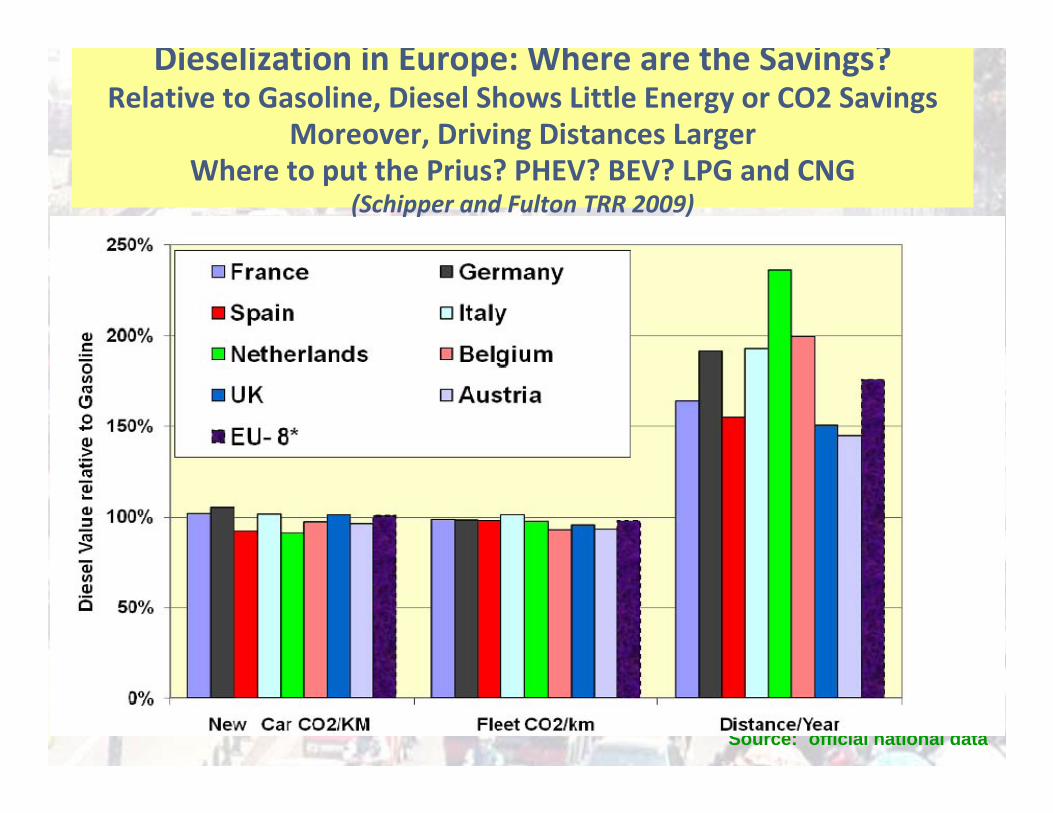
Diesels Close to 50% of New Car Market in Europe:Yet Savings of CO2 from Diesel Small or Absent
• Nine Countries Show Little Savings (Counting emissions, not gallons!)• On road diesel fleet emissions (gm/km) slightly (<5%) lower than gasoline• New vehicle test diesel emissions slightly (<5%)lower than gasoline• Diesel cars driven 50-100% more per year than gasoline cars
• Huh?•Cheaper diesel in Europe raises use, backfires on diesel policies •Diesels more powerful than gasoline equivalent, buyers choose bigger cars•Liter of diesel has 12% more energy, 18% more CO2 than gasoline
• But Diesel Drivers Are Different -- That’s the Point• Long distance drivers buy more expensive diesels with lower fuel costs• Increased switching to diesel stimulated by price – switchers drive more • Diesel SUVs increase attractiveness of SUVs (“Gelaendewagen”)
Avoid Subsidizing “Winners” or Creating Loopholes like FlexfuelVehicles, HOV Exemptions for Hybrids, Cheap LPG or CNG
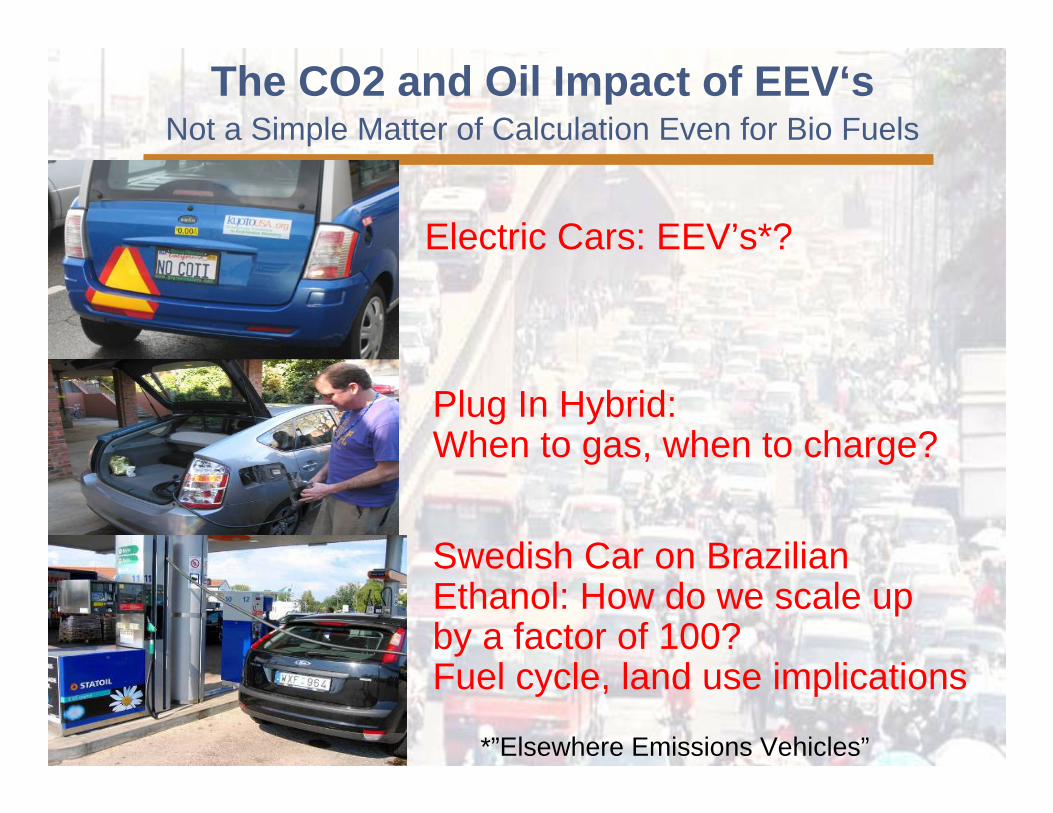
Electric Cars: EEV’s*?
Plug In Hybrid: When to gas, when to charge?
*”Elsewhere Emissions Vehicles”
The CO2 and Oil Impact of EEV‘sNot a Simple Matter of Calculation Even for Bio Fuels
Swedish Car on Brazilian Ethanol: How do we scale upby a factor of 100? Fuel cycle, land use implications
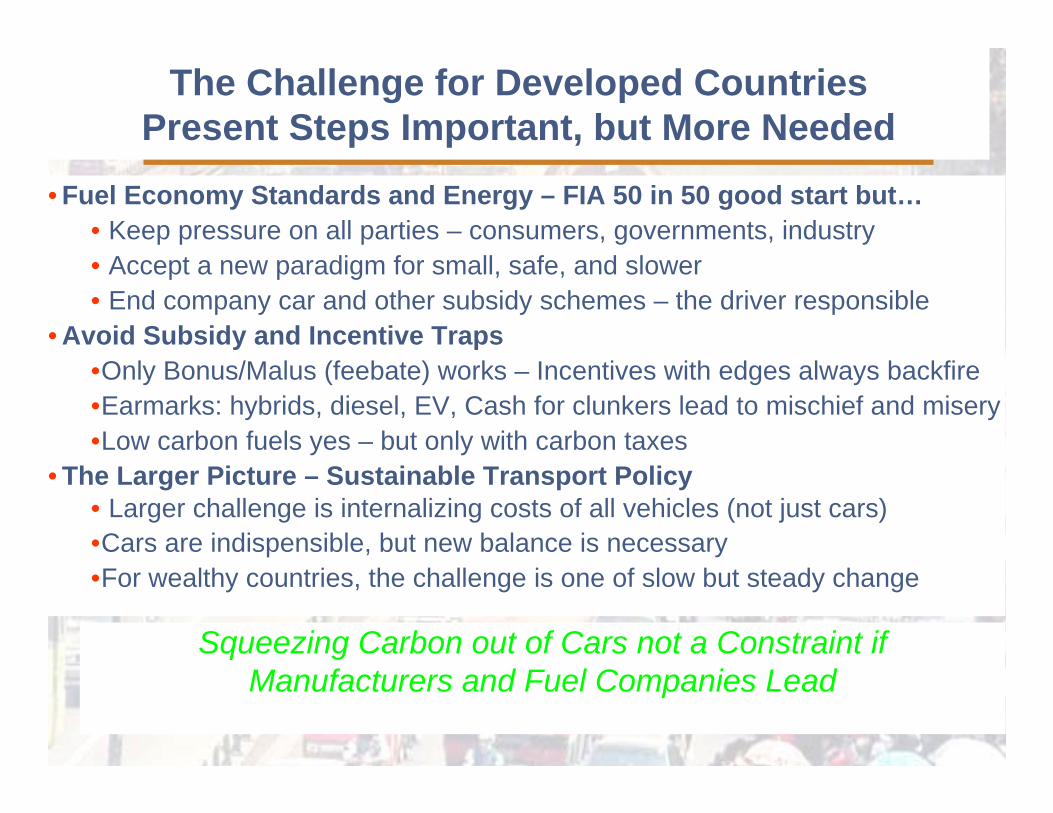
The Challenge for Developed CountriesPresent Steps Important, but More Needed
• Fuel Economy Standards and Energy – FIA 50 in 50 good start but…• Keep pressure on all parties – consumers, governments, industry• Accept a new paradigm for small, safe, and slower• End company car and other subsidy schemes – the driver responsible
• Avoid Subsidy and Incentive Traps•Only Bonus/Malus (feebate) works – Incentives with edges always backfire•Earmarks: hybrids, diesel, EV, Cash for clunkers lead to mischief and misery•Low carbon fuels yes – but only with carbon taxes
• The Larger Picture – Sustainable Transport Policy• Larger challenge is internalizing costs of all vehicles (not just cars)•Cars are indispensible, but new balance is necessary•For wealthy countries, the challenge is one of slow but steady change
Squeezing Carbon out of Cars not a Constraint ifManufacturers and Fuel Companies Lead
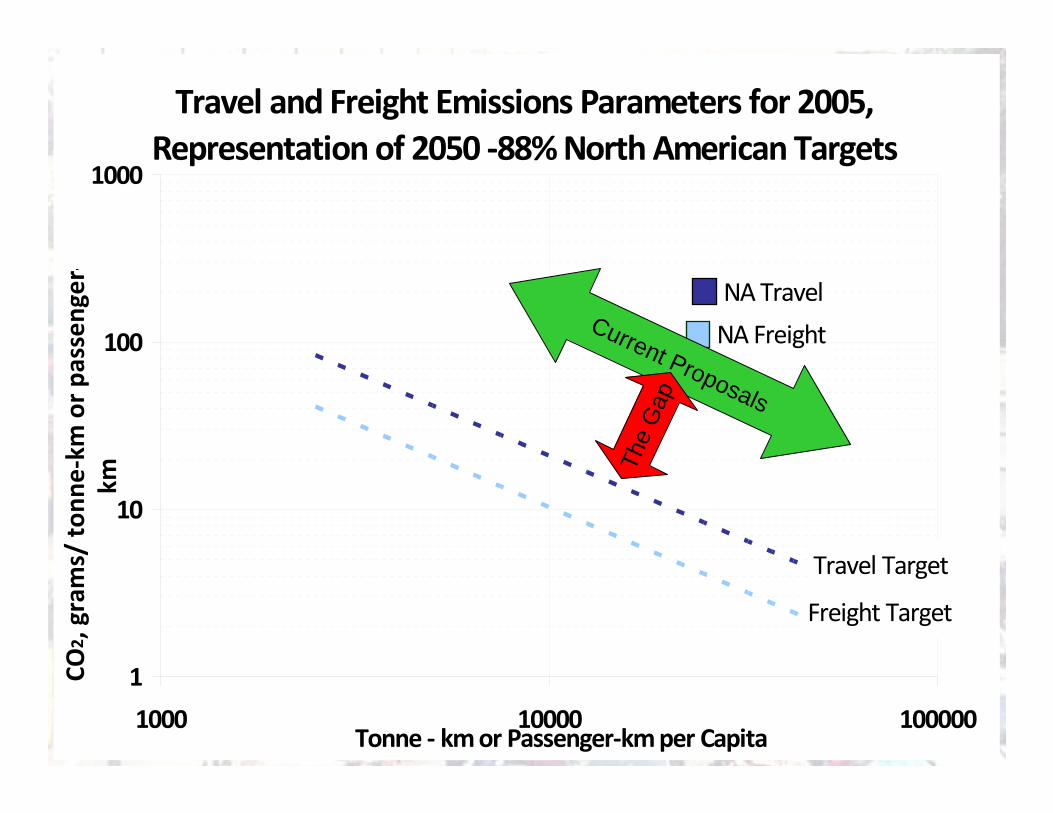
Plateau of Travel and Emissions
Travel and Freight Emissions Parameters for 2005,Representation of 2050 ‐88% North American Targets
NA Travel
NA Freight
Travel Target
Freight Target
1
10
100
1000
1000 10000 100000Tonne ‐ km or Passenger‐km per Capita
CO2 , grams/ ton
ne‐km or pa
ssen
ger‐
km
Current Proposals
The
Gap
Plateau of Travel and Emissions
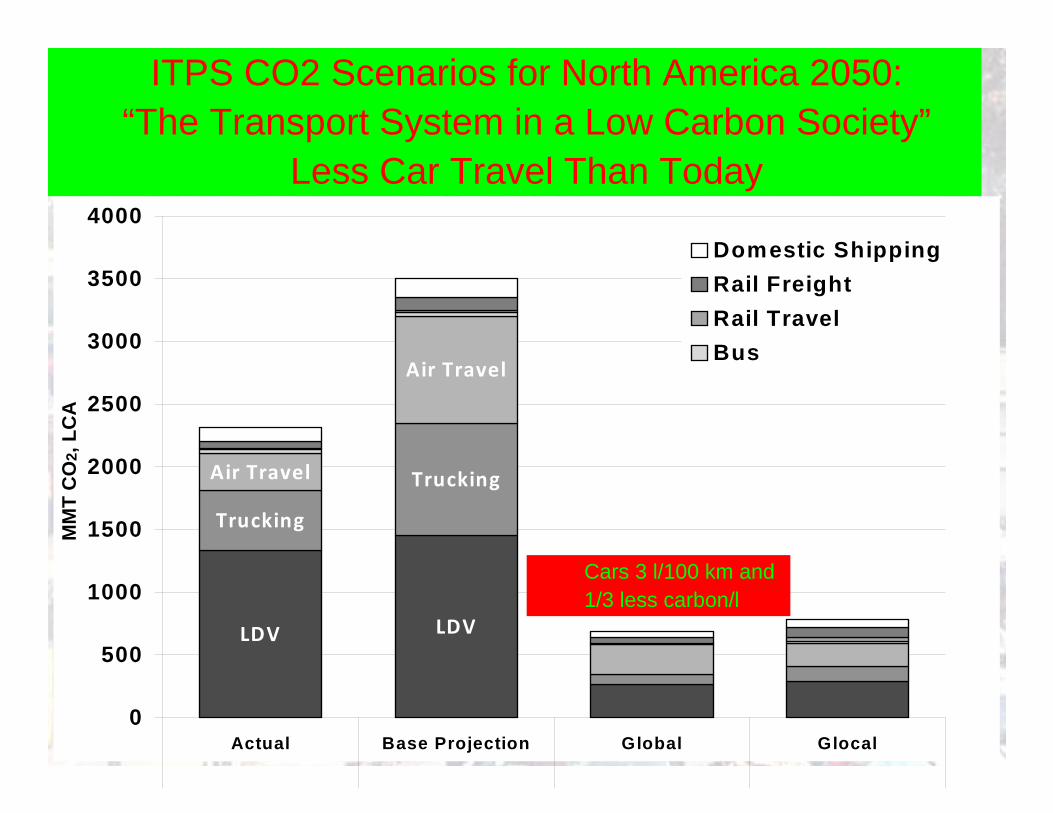
LDV LDV
Trucking
TruckingAir Travel
Air Travel
0
500
1000
1500
2000
2500
3000
3500
4000
Actual Base Projection Global Glocal
MM
T C
O2,
LC
A
Domestic ShippingRail FreightRail TravelBus
ITPS CO2 Scenarios for North America 2050:“The Transport System in a Low Carbon Society”
Less Car Travel Than Today
Cars 3 l/100 km and 1/3 less carbon/l
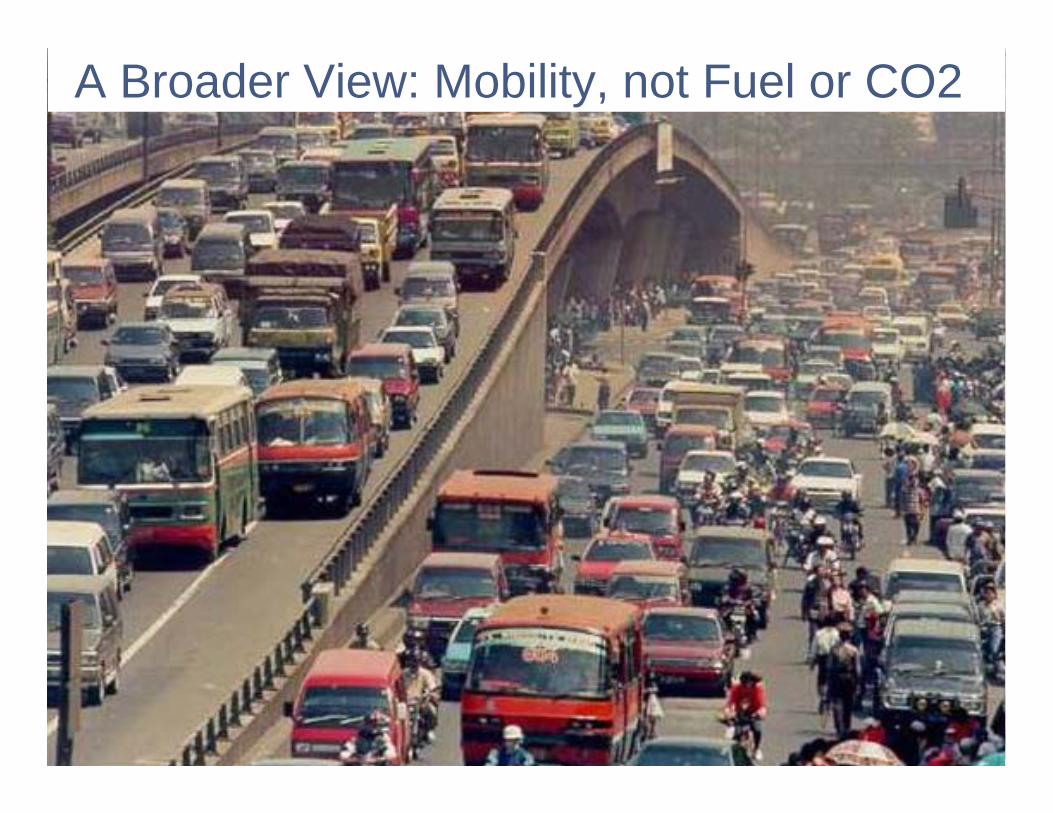
• Cars provides roughly 10-15% of trips and 20% of travel in the developing world, yet are the principal cause of congestion keeping the overwhelming majority of people and goods tied up in traffic. Something is out of balance.
• Projections for future car ownership and use in the developing world are staggering, but profound congestion and air pollution problems likely will slow growth in car use much more than higher fuel prices or taxes alone will.
• Developing country authorities can unfreeze mobility. access by strengthening collective and non motorized transport and removing the subsidies to fuels and individual car ownership before these trends become politically irreversible.
• This broad approach to sustainable transport will mean fewer cars and less car travel than otherwise yet result in more access than present trends in car use. CO2 savings from improved transport will rival that from more efficiency and lower CO2 fuels, and as such is a necessary part of future development strategies.
• Recognition of the real constraints on car use is important for the vehicle industry so it can adjust its strategies accordingly and prosper in a crowded world.
• Financing “low carbon transport” is perhaps an oxymoron: truly sustainable transport is built mostly on low emission collective modes that better utilize road and rail capacity than individual vehicles. What is needed is balanced set of transport prices and taxes that reflect the real costs of the whole system including externalities from congestion accidents barriers to mobility and access as well as the smaller (but still important concerns of CO2 and oil security.
CO2 Emissions from CarsKey Messages from Developing Countries
19
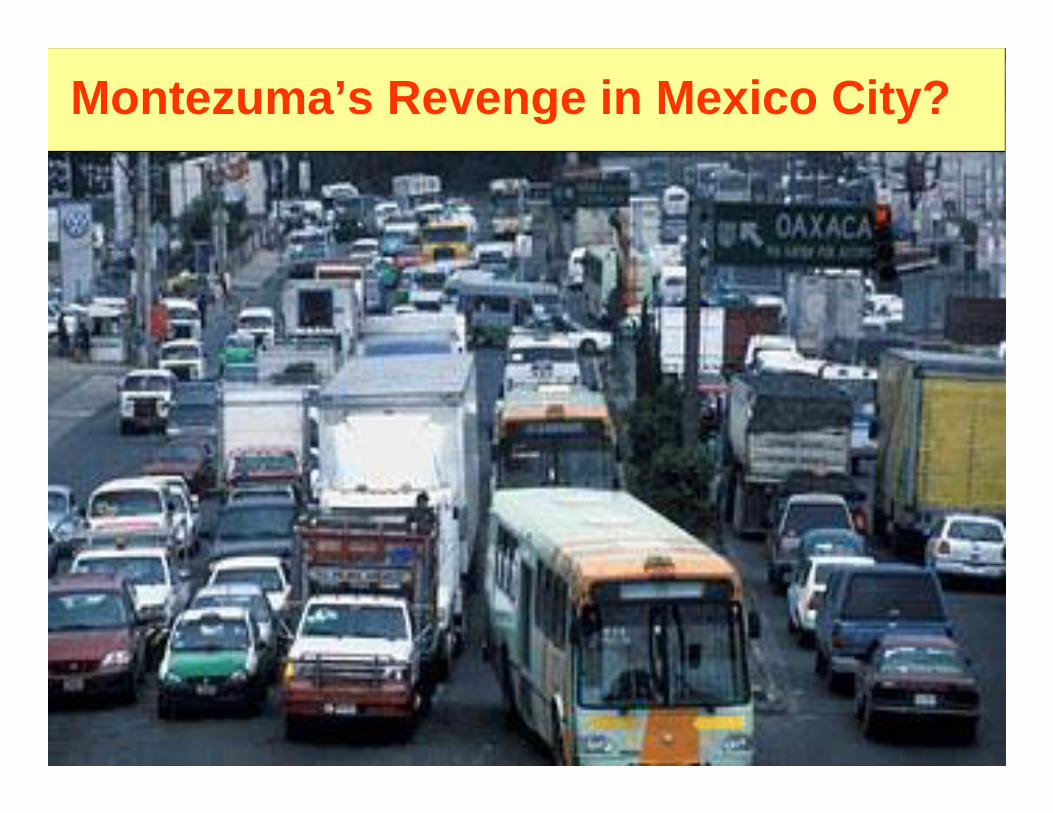
Montezuma’s Revenge in Mexico City?
Plateau of Travel and Emissions
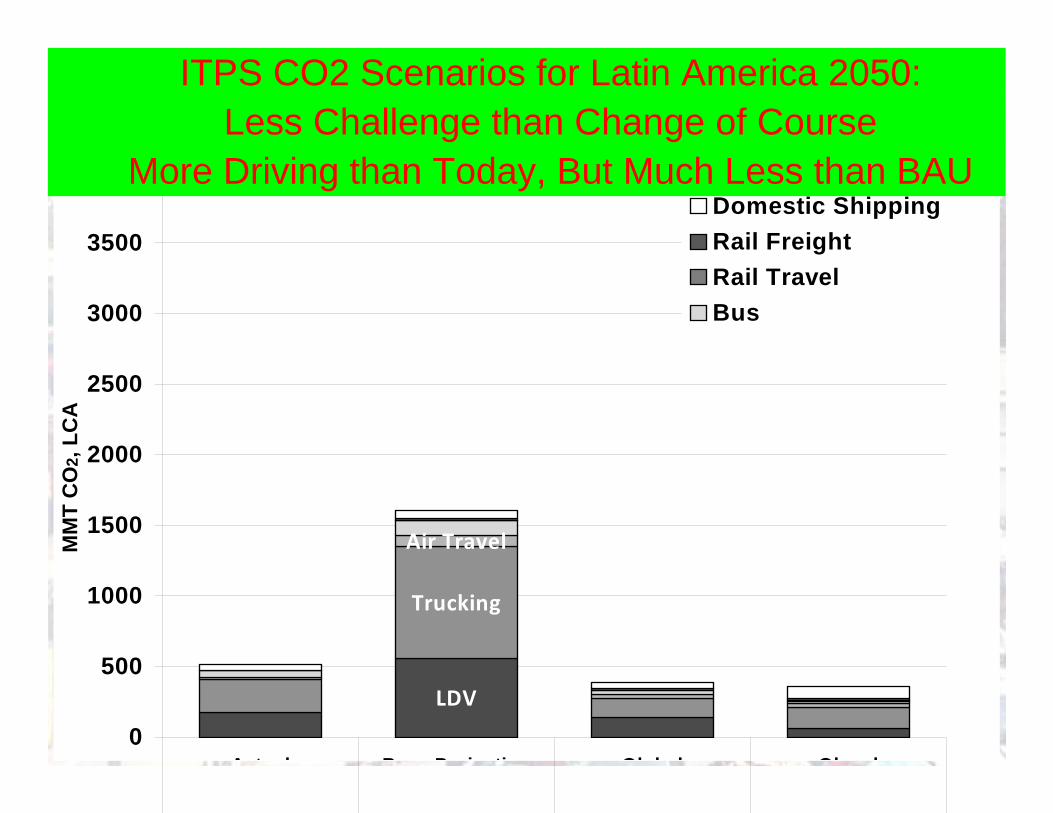
LDV
Trucking
Air Travel
0
500
1000
1500
2000
2500
3000
3500
4000
A t l B P j ti Gl b l Gl l
MM
T C
O2,
LC
A
Domestic ShippingRail FreightRail TravelBus
ITPS CO2 Scenarios for Latin America 2050:Less Challenge than Change of Course
More Driving than Today, But Much Less than BAU
Schipper PEEC Stanford
A Broader View: Mobility, not Fuel or CO2
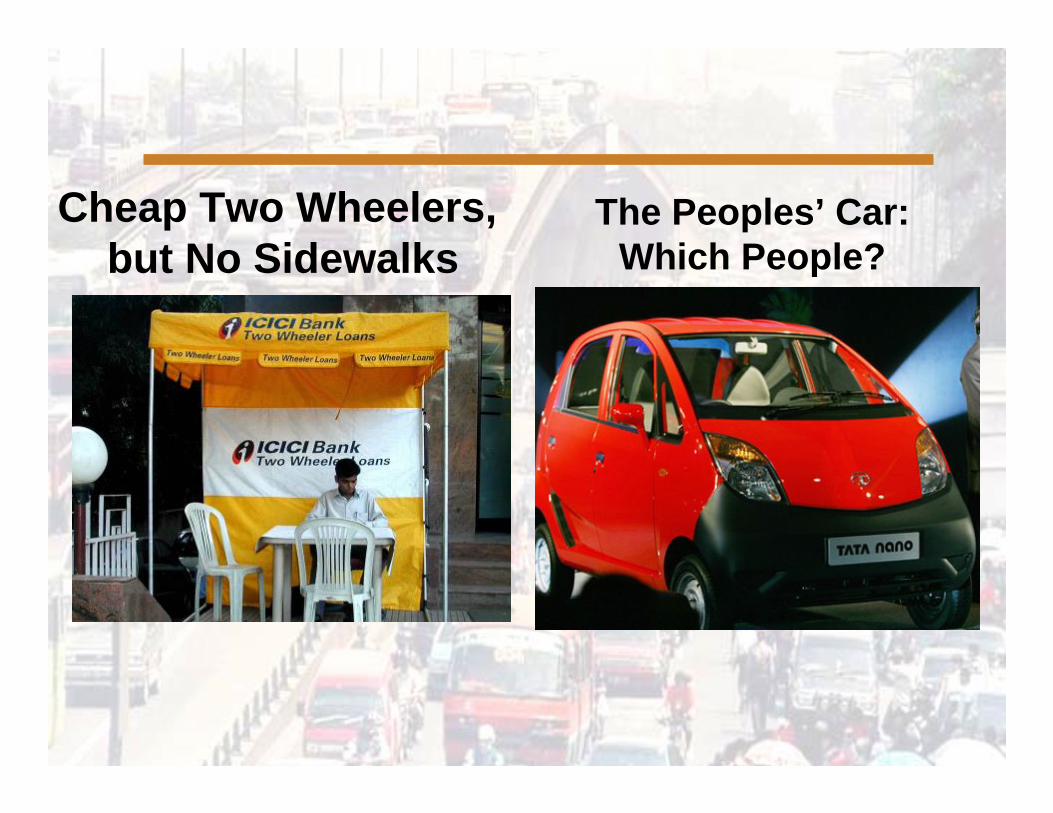
Cheap Two Wheelers, but No Sidewalks
The Peoples’ Car:Which People?

OR + OR
Sustainable Transport? Yes

• Present Goals (US, EU, Japan) Too Timid– Start with FIA “50 by 50” or IEA 50% by 2030 – Work now on even bolder goals– Reverse the decline in share of other modes
• What Has To Happen in Policy?– Realistic pricing of transport, not just energy– Reorientation of urban and rural development - more wealth, less motion– Stronger integration of CO2 concerns into development
• The Vehicles and Fuels Industries– Help reverse engineer the problem – rather than reversing progress– Stake out realistic R&D needs now– Re-work ‘Sustainable Mobility’ to get it right the next time
What Needs To Happen Everywhere
The Present Transport System Doesn’t work for Most People
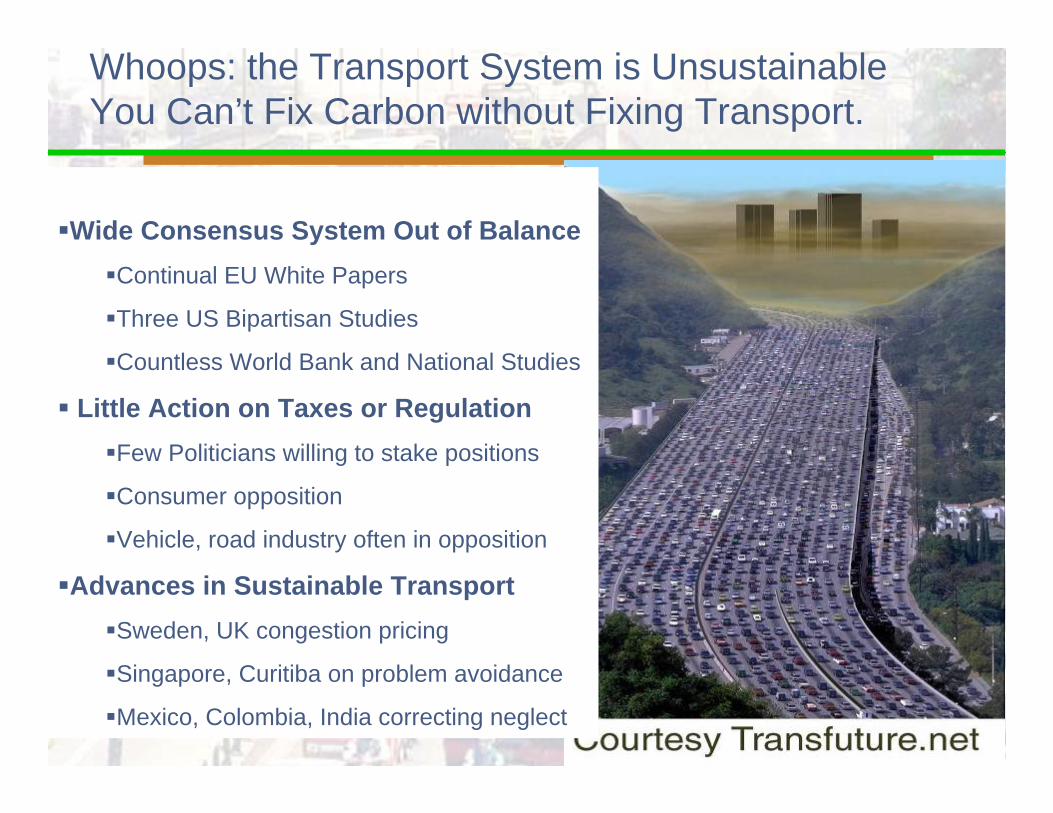
Whoops: the Transport System is UnsustainableYou Can’t Fix Carbon without Fixing Transport.
Wide Consensus System Out of BalanceContinual EU White Papers
Three US Bipartisan Studies
Countless World Bank and National Studies
Little Action on Taxes or RegulationFew Politicians willing to stake positions
Consumer opposition
Vehicle, road industry often in opposition
Advances in Sustainable TransportSweden, UK congestion pricing
Singapore, Curitiba on problem avoidance
Mexico, Colombia, India correcting neglect
26
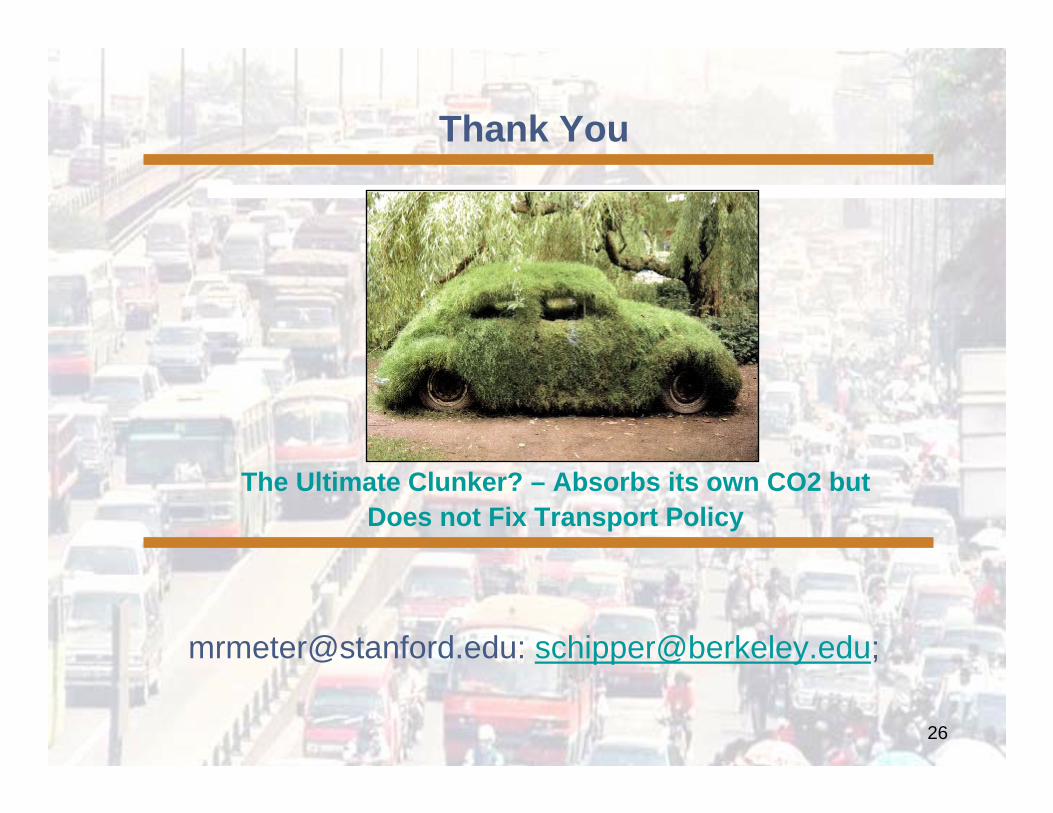
[email protected]: [email protected];
The Ultimate Clunker? – Absorbs its own CO2 butDoes not Fix Transport Policy
Thank You
• Providing 80-85% of all travel, LDV/car use in IEA countries has stagnated since the early 2000s, Causes include higher fuel prices, ageing populations, congestion, modest switch to other modes.
• On road LDV fuel economy has shown some improvement since the 1990s, even if voluntary goals for new vehicles (EU/Japan) were not met. Cars dominate CO2 emissions from transport in developed countries.
• Stronger fuel economy standards in US, EU and Japan in Europe and Japan will yield about a 30% reduction in CO2/km on road by 2030-5, with the US by then achieving Eu’s present level. The main differences among the regions are car power/weight and traffic conditions.
• Analysis of new diesel cars (their use and on-road fuel economy) shows only marginal energy and CO2 savings a large shift to diesel of vehicle purchases in Europe. This suggests that cheap fuel (diesel, CNG, LPG, biofuels) or green car programs (incentives such as in the UK) are counterproductive unless backed by strong fuel price signals.
• Advanced biofuels may work at modest scale (a few % of global LDV fuel) but as the Biofuels Roundtable and others warn, we are far from having truly environmentally benign low CO2 fuels at the scale needed.
• Electrification might offer low carbon alternatives, but only in a context where CO2 is taxes in all sectors and electricity is priced according to its cost when used to charge batteries. Since electric cars are likely to be small, the first step to them is to shrink fueled cars.
CO2 Emissions from CarsKey Messages from Developed Countries
28

29
30
Source:` official national data
Dieselization in Europe: Where are the Savings?Relative to Gasoline, Diesel Shows Little Energy or CO2 Savings
Moreover, Driving Distances LargerWhere to put the Prius? PHEV? BEV? LPG and CNG
(Schipper and Fulton TRR 2009)
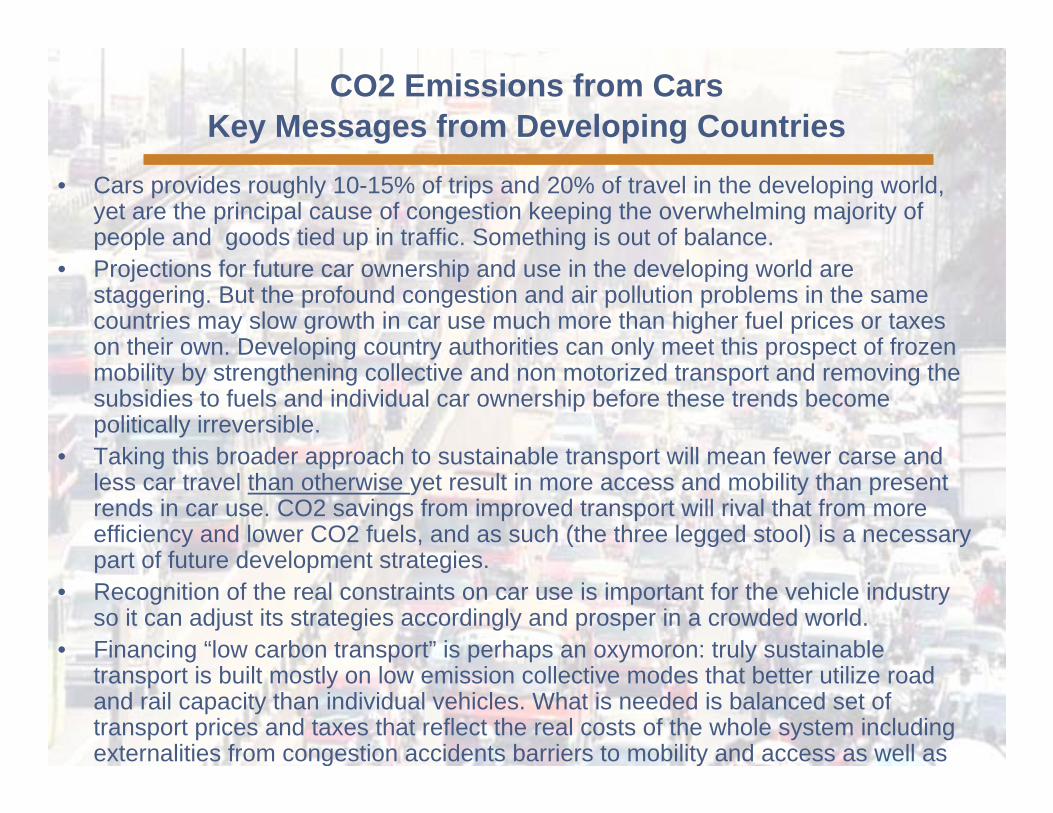
• Cars provides roughly 10-15% of trips and 20% of travel in the developing world, yet are the principal cause of congestion keeping the overwhelming majority of people and goods tied up in traffic. Something is out of balance.
• Projections for future car ownership and use in the developing world are staggering. But the profound congestion and air pollution problems in the same countries may slow growth in car use much more than higher fuel prices or taxes on their own. Developing country authorities can only meet this prospect of frozen mobility by strengthening collective and non motorized transport and removing the subsidies to fuels and individual car ownership before these trends become politically irreversible.
• Taking this broader approach to sustainable transport will mean fewer carse and less car travel than otherwise yet result in more access and mobility than present rends in car use. CO2 savings from improved transport will rival that from more efficiency and lower CO2 fuels, and as such (the three legged stool) is a necessary part of future development strategies.
• Recognition of the real constraints on car use is important for the vehicle industry so it can adjust its strategies accordingly and prosper in a crowded world.
• Financing “low carbon transport” is perhaps an oxymoron: truly sustainable transport is built mostly on low emission collective modes that better utilize road and rail capacity than individual vehicles. What is needed is balanced set of transport prices and taxes that reflect the real costs of the whole system including externalities from congestion accidents barriers to mobility and access as well as
CO2 Emissions from CarsKey Messages from Developing Countries
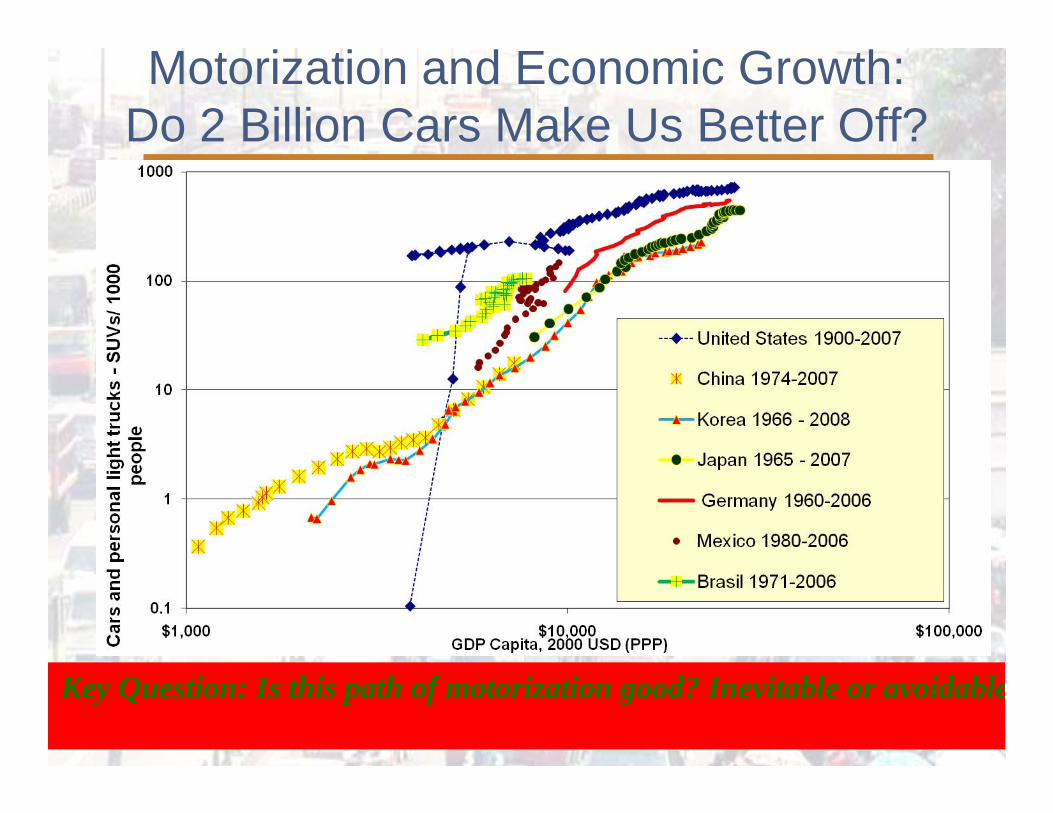
33Key Question: Is this path of motorization good? Inevitable or avoidable
Source: EMBARQ
Motorization and Economic Growth:Do 2 Billion Cars Make Us Better Off?
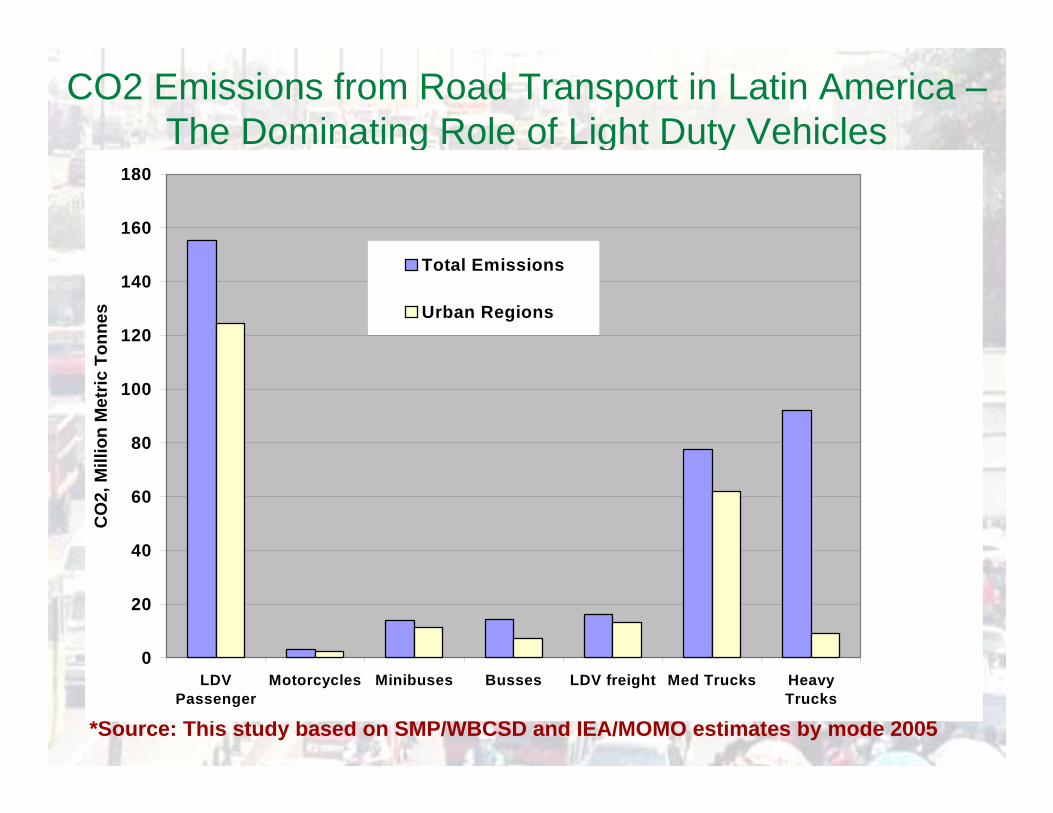
CO2 Emissions from Road Transport in Latin America –The Dominating Role of Light Duty Vehicles
*Source: This study based on SMP/WBCSD and IEA/MOMO estimates by mode 2005
0
20
40
60
80
100
120
140
160
180
LDVPassenger
Motorcycles Minibuses Busses LDV freight Med Trucks HeavyTrucks
CO
2, M
illio
n M
etric
Ton
nes
Total Emissions
Urban Regions
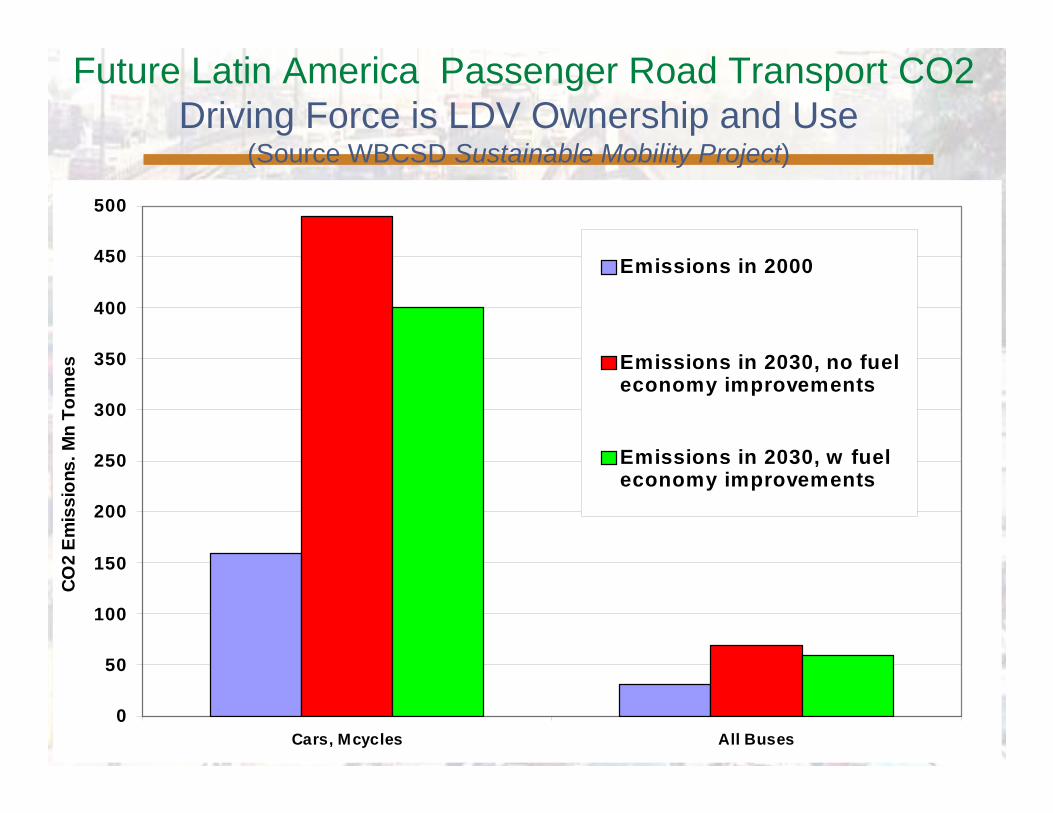
Future Latin America Passenger Road Transport CO2Driving Force is LDV Ownership and Use
(Source WBCSD Sustainable Mobility Project)
LDVs out of control
0
50
100
150
200
250
300
350
400
450
500
Cars, Mcycles All Buses
CO2
Emis
sion
s. M
n To
nnes
Emissions in 2000
Emissions in 2030, no fueleconomy improvements
Emissions in 2030, w fueleconomy improvements
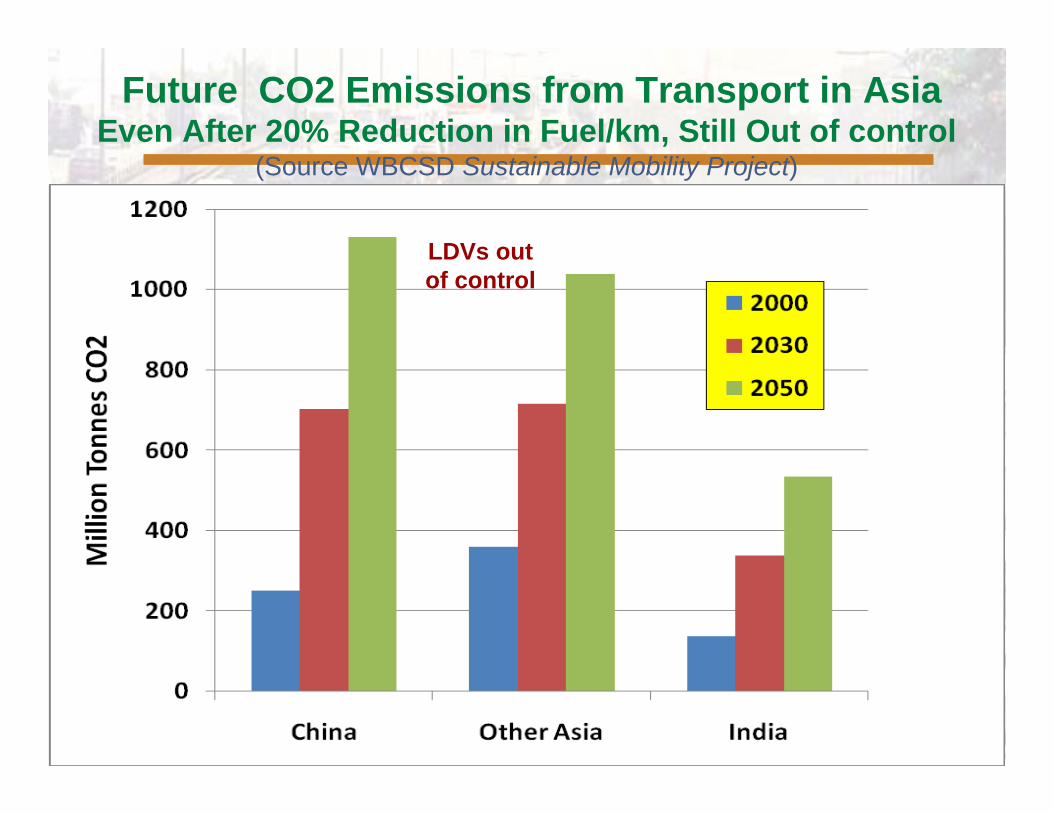
Future CO2 Emissions from Transport in Asia Even After 20% Reduction in Fuel/km, Still Out of control
(Source WBCSD Sustainable Mobility Project)
LDVs out of control