school annual report 2015 - albert state school · pdf filequeensland state school reporting...
TRANSCRIPT

Albert State School Queensland State School Reporting 2015 School Annual Report
Postal address 210-220 Albert Street Maryborough 4650
Phone (07) 4120 0888
Fax (07) 4120 0800
Email [email protected]
Webpages Additional reporting information pertaining to Queensland state schools is located on the My School website and the Queensland Government data website.
Contact person Phillip Murtagh (Principal)
Principal’s foreword Introduction
Thank you for taking the time to read our school’s Annual Report for the 2015 school year. We have continued to strive to live up to our motto “Only My Best” during the year. Our students continued to perform well in the academic, social and sporting arenas and our staff members have remained true in their commitment to assisting student hearts and minds to achieve their hopes and dreams. In this report you will find information regarding our school’s scores on national tests, the programs that we offered in 2015, the work of our staff members, attendance data for our students and on our school’s climate.
School progress towards its goals in 2015
Priority Areas:
• Whole school improvement in English, Mathematics and Science in Year 1 to 6. Target is to have 75% of students achieving C or higher.
• Increased number of students in the upper two bands in Years 3 and 5 in reading and numeracy.
• Increased attendance
• Ensuring all students in Years 3 and 5 attain NMS in both reading and numeracy or have an individual learning plan
Steps taken to achieve these priorities:
Implement the Australian Curriculum • Reviewed and refined the operations of the Head of Curriculum. • Facilitated release time for teacher planning, including the SEU teacher as appropriate to
differentiate the curriculum for the students with Special Needs or learning difficulties. • Reviewed and implemented the Albert SS Curriculum Framework. • Enacted processes to allow the moderation of student learning achievements.
Improve the School’s Reading Program
• Engaged with and enacted the “Teaching Reading Comprehension Strategies” process, providing the necessary materials and training for staff members. Focused on one strategy as a whole staff, using Strategy Meetings to enable staff members to use and discuss each strategy.
• Formal observation & feedback sessions around the teaching of reading.

• Used school data to set targets for student achievement. Included the students and their parents/caregivers in this process.
• Reviewed and enhanced the Albert State School Balanced Reading Program. • Reviewed and enhanced the Albert State School Literacy Framework.
Develop and Enact a Pedagogical Framework Based on ASOT
• Engaged with the Art and Science of Teaching (ASOT) framework. • Liaised with other schools that are at a similar level of engagement with ASOT to share
information, successes and challenges. T&L Audit priorities
• Set targets for students’ learning, involving the students and their families in this process e.g. NAPLAN Upper 2 Bands, PAT-R, PAT-M. Publicise school-wide targets.
• Worked as a staff to identify when the student achievement of our school will reach NAPLAN National standards and set some milestones at key points.
Implement the Developing Performance Framework for all staff
• Principal met informally with each staff member each term to discuss their work. • Our school’s Developing Performance Framework, the Career Performance Review (CPR), was
enacted. All staff members completed a CPR plan by the end of Term 1, with an initial review at the beginning of Term 3 and a final review before the end of Term 4.
• Provided access for staff members to professional development to support programs articulated in the school’s Strategic Plan and/or from the staff section of the School Opinion Survey e.g. reading comprehension, using data to enhance student learning, ICT Pedagogical Licenses, Aboriginal and Torres Strait Islander perspectives, re-engaging disengaged students, ASOT.
• Increased the opportunities for staff members to share and recognise good practice through a standing item at Operations Meetings.
Getting Ready For Secondary School
• State high school (SHS) principals shared information – at Operations Meetings, P&C Meetings, Parade, in our newsletter etc. We included relevant information from the newsletters of the high schools in our newsletter.
• Enabled students to visit the high schools in a meaningful way – enrichment days, transitions processes etc.
• Worked with SHS principals to have their staff members attend our school to teach some lessons, to allow SHS teachers to get to know the students, for the SHS teachers to have a fuller understanding of the operations of a primary school, for our teachers to develop networks with SHS teachers, for our teachers to see the pedagogy of SHS teachers and for our students to add to their knowledge about high school.
Social and Emotional Learning. • Continued the operations of the School Wide Positive Behaviour for Learning (PBL) committee. • Using behaviour data to strategically plan methods of promoting positive behaviour. • Implement specific behaviour lessons to support this process. • Utilised referrals to the Guidance Officer Intensive Behaviour Support more proactively. • Targeted bullying behaviours in relevant sectors of the student population as appropriate.
Future outlook
Use the Department’s Strategic Plan to further deve lop: Successful Learners • Implement the Australian Curriculum • Key literacy and numeracy improvement strategies • Differentiation strategies Great People • Implement performance reviews for all staff • Learning and Wellbeing Framework • Formal observation & feedback sessions around the teaching of reading. Principal observation &
instructional rounds Empowerment • Continue to develop and enact a pedagogical framework based on ASOT Engaged Partners • Transition Programs with Secondary Schools • Parent and Community Engagement Framework • Transition Plans with Early Learning Centres High Standards • School Improvement Unit Review priorities • Discipline Audit priorities • Internal Audit priorities • School Opinion Survey priorities • Promoting the expectation that students attend school every day We will support the above actions financially in 20 16 by:
• Providing effective and efficient financial support to enable sustained school improvement in the priorities areas of English, Mathematics and Science.
• Increasing teacher aide hours to work with students in classrooms specifically targeting reading. • Increasing teacher aides with maximised hours to implement Daily Rapid Reading and Reading Link
Program. • Employing additional teacher aides to increase staff to three to enable more students to participate in the
Daily Rapid Reading & Reading Link Program. • Allocating Daily Rapid Reading & Reading Link Program for Prep, Yr 1, Yr 2, Yr 3 & Yr 5. • Purchasing additional 0.1 Speech language Pathologist for 2016 to work with students around oral
language and further support students with speech language impairments. • Ensuring a variety of processes are in place to maximize the number of students in the U2B (process to
begin in Prep)

Our school at a glance
School Profile
Coeducational or single sex: Coeducational
Independent Public School: No
Year levels offered in 2015: Prep Year - Year 6
Student enrolments for this school:
Total Girls Boys Indigenous
Enrolment Continuity
(Feb – Nov)
2013 148 58 90 13 88%
2014 148 56 92 16 86%
2015 116 46 70 15 90%
Student counts are based on the Census (August) enrolment collection.
*From 2015, data for all state high schools include Year 7 students. Prior to 2015, only state high schools offering Year 7 had these students included in their counts.
In 2015, there were no students enrolled in a Pre-Prep program.* *Pre-Prep is a kindergarten program for Aboriginal and Torres Strait Islander children, living across 35 Aboriginal and Torres Strait Islander communities, in the year before school (http://deta.qld.gov.au/earlychildhood/families/pre-prep-indigenous.html).
Characteristics of the student body:
Our students are chiefly drawn from inner-city Maryborough, with most students living near our school. 15 of our students identify as being of Aboriginal and/or Torres Strait Islander descent. 1 of our students use English as their second language. 15 of our students have a diagnosed disability.
Average class sizes
Phase
Average Class Size
2013 2014 2015
Prep – Year 3 21 24 20
Year 4 – Year 7 Primary 29 28 15
Year 7 Secondary – Year 10
Year 11 – Year 12
*From 2015, data for all state high schools include Year 7 students. Prior to 2015, only state high schools offering Year 7 had these students included in their counts.
School Disciplinary Absences
Disciplinary Absences
Count of Incidents
2013 2014* 2015**
Short Suspensions - 1 to 5 days 30 13 44
Long Suspensions - 6 to 20 days 1 0 0

* Caution should be used when comparing post 2013 SDA data as amendments to EGPA disciplinary provisions and changes in methodology created time series breaks in 2014 and 2015.
**From 2015, Exclusion represents principal decisions to exclude rather than recommendations for exclusion. From 2015 where a principal decided not to exclude, a small number of recommendations for exclusions have been counted as a long suspension. Exclusions, Cancellations and Long & Charge Suspensions may be upheld or set aside through an appeals process.
Curriculum delivery
Our approach to curriculum delivery
• C2C Curriculum delivery • Technology integration in classrooms and the Special Education program • Music program • Sporting opportunities • Special Education Program • Extensive intervention processes and supports • Early Childhood Developmental Program • Pre-prep program • School pedagogical framework based on Marzano’s Art & Science of Teaching • We coordinate the timetables of our teacher aides and specialist teachers to allow students to
be in small groups as they undertake literacy and numeracy activities.
Extra curricula activities
• Music opportunities – Instrumental Music, Orchestral Music, Choirs, KidSing, Eisteddfods • Educational Excursions • A variety of inter and intra school sporting activities • Chaplaincy services • Lunchtime Robotics Clubs • School Skipping Team • Lunchtime sporting activities • School camps • Indigenous Learning Experiences • Spelling Bees
How Information and Communication Technologies are used to improve learning
Albert State School uses technology to enhance learning, with classes utilising and enhancing their skills in movie making, word processing, digital still photography, PowerPoint and animations on a regular basis. Classes often work together on projects and activities, allowing our students to develop skills as both learners and leaders. In 2015 some classes continued their use of robotics and worked on developing web sites and blogs. All classrooms have an interactive whiteboard and data projector to enhance lessons. These are used by teachers and students as a tool to better understand concepts and to make learning more motivating. Students have access to portable digital media for learning such as ipads and Nintendo DS Students use laptops or desktop computers in their classrooms. Laptops for Teachers program – all teachers have their own laptops to allow them access to a computer at any time and to enhance their computer skills.
Exclusions 0 0 0
Cancellations of Enrolment 0 0 0
Social Climate
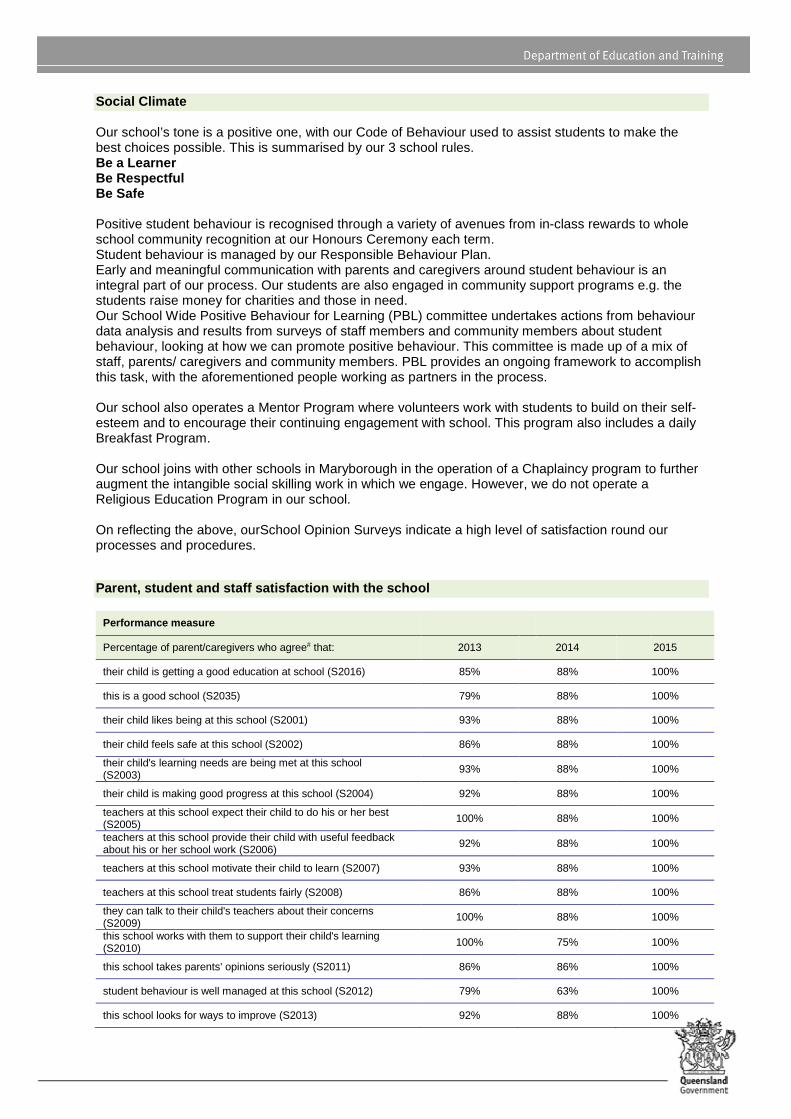
Our school’s tone is a positive one, with our Code of Behaviour used to assist students to make the best choices possible. This is summarised by our 3 school rules. Be a Learner Be Respectful Be Safe Positive student behaviour is recognised through a variety of avenues from in-class rewards to whole school community recognition at our Honours Ceremony each term. Student behaviour is managed by our Responsible Behaviour Plan. Early and meaningful communication with parents and caregivers around student behaviour is an integral part of our process. Our students are also engaged in community support programs e.g. the students raise money for charities and those in need. Our School Wide Positive Behaviour for Learning (PBL) committee undertakes actions from behaviour data analysis and results from surveys of staff members and community members about student behaviour, looking at how we can promote positive behaviour. This committee is made up of a mix of staff, parents/ caregivers and community members. PBL provides an ongoing framework to accomplish this task, with the aforementioned people working as partners in the process. Our school also operates a Mentor Program where volunteers work with students to build on their self-esteem and to encourage their continuing engagement with school. This program also includes a daily Breakfast Program. Our school joins with other schools in Maryborough in the operation of a Chaplaincy program to further augment the intangible social skilling work in which we engage. However, we do not operate a Religious Education Program in our school. On reflecting the above, ourSchool Opinion Surveys indicate a high level of satisfaction round our processes and procedures. Parent, student and staff satisfaction with the sch ool
Performance measure
Percentage of parent/caregivers who agree# that: 2013 2014 2015
their child is getting a good education at school (S2016) 85% 88% 100%
this is a good school (S2035) 79% 88% 100%
their child likes being at this school (S2001) 93% 88% 100%
their child feels safe at this school (S2002) 86% 88% 100%
their child's learning needs are being met at this school (S2003) 93% 88% 100%
their child is making good progress at this school (S2004) 92% 88% 100%
teachers at this school expect their child to do his or her best (S2005) 100% 88% 100%
teachers at this school provide their child with useful feedback about his or her school work (S2006)
92% 88% 100%
teachers at this school motivate their child to learn (S2007) 93% 88% 100%
teachers at this school treat students fairly (S2008) 86% 88% 100%
they can talk to their child's teachers about their concerns (S2009)
100% 88% 100%
this school works with them to support their child's learning (S2010) 100% 75% 100%
this school takes parents' opinions seriously (S2011) 86% 86% 100%
student behaviour is well managed at this school (S2012) 79% 63% 100%
this school looks for ways to improve (S2013) 92% 88% 100%

Performance measure
Percentage of parent/caregivers who agree# that: 2013 2014 2015
this school is well maintained (S2014) 86% 88% 100%
Performance measure
Percentage of students who agree# that: 2013 2014 2015
they are getting a good education at school (S2048) 92% 97% 97%
they like being at their school (S2036) 92% 90% 97%
they feel safe at their school (S2037) 96% 93% 94%
their teachers motivate them to learn (S2038) 92% 100% 91%
their teachers expect them to do their best (S2039) 96% 100% 100%
their teachers provide them with useful feedback about their school work (S2040) 88% 97% 91%
teachers treat students fairly at their school (S2041) 80% 97% 88%
they can talk to their teachers about their concerns (S2042) 88% 100% 88%
their school takes students' opinions seriously (S2043) 87% 96% 94%
student behaviour is well managed at their school (S2044) 69% 83% 91%
their school looks for ways to improve (S2045) 96% 100% 94%
their school is well maintained (S2046) 92% 100% 94%
their school gives them opportunities to do interesting things (S2047) 92% 97% 91%
Performance measure
Percentage of school staff who agree# that: 2013 2014 2015
they enjoy working at their school (S2069) 100% 100% 100%
they feel that their school is a safe place in which to work (S2070) 100% 100% 90%
they receive useful feedback about their work at their school (S2071) 91% 90% 95%
they feel confident embedding Aboriginal and Torres Strait Islander perspectives across the learning areas (S2114) 100% 100% 89%
students are encouraged to do their best at their school (S2072) 100% 100% 95%
students are treated fairly at their school (S2073) 100% 100% 90%
student behaviour is well managed at their school (S2074) 91% 100% 79%
staff are well supported at their school (S2075) 91% 100% 90%
their school takes staff opinions seriously (S2076) 91% 100% 84%
their school looks for ways to improve (S2077) 100% 100% 80%
their school is well maintained (S2078) 100% 100% 80%
their school gives them opportunities to do interesting things (S2079)
100% 100% 90%
# ‘Agree’ represents the percentage of respondents who Somewhat Agree, Agree or Strongly Agree with the statement. DW = Data withheld to ensure confidentiality.
Parent and Community Engagement
Parents are involved in their children’s education at Albert State School on a variety of levels and through processes depending on their interests, commitment and availability. Some examples of these
levels of involvement include involvement at strategic decision making through our school’s P. & C. as we work on the school’s Annual Improvement Plan, the School Budget and the production of an School Annual Report. Involvement at a classroom support level is encouraged through volunteering for listening to sight words and reading, attending year level parent information sessions, assisting with activities in classrooms, supporting individual children with special projects and presentations in their classrooms and involvement in excursions and camps. Parents with particular interests or skills are also encouraged to volunteer their time to share these with our students. Parents are kept up to date with school events through our Facebook page, the newsletter and special notes. Information about student progress is provided through report cards and interviews, which are offered twice per year at the end of each semester, however, parents are also encouraged to maintain a close, informal contact with their child’s teacher throughout the year. Reducing the school’s environmental footprint
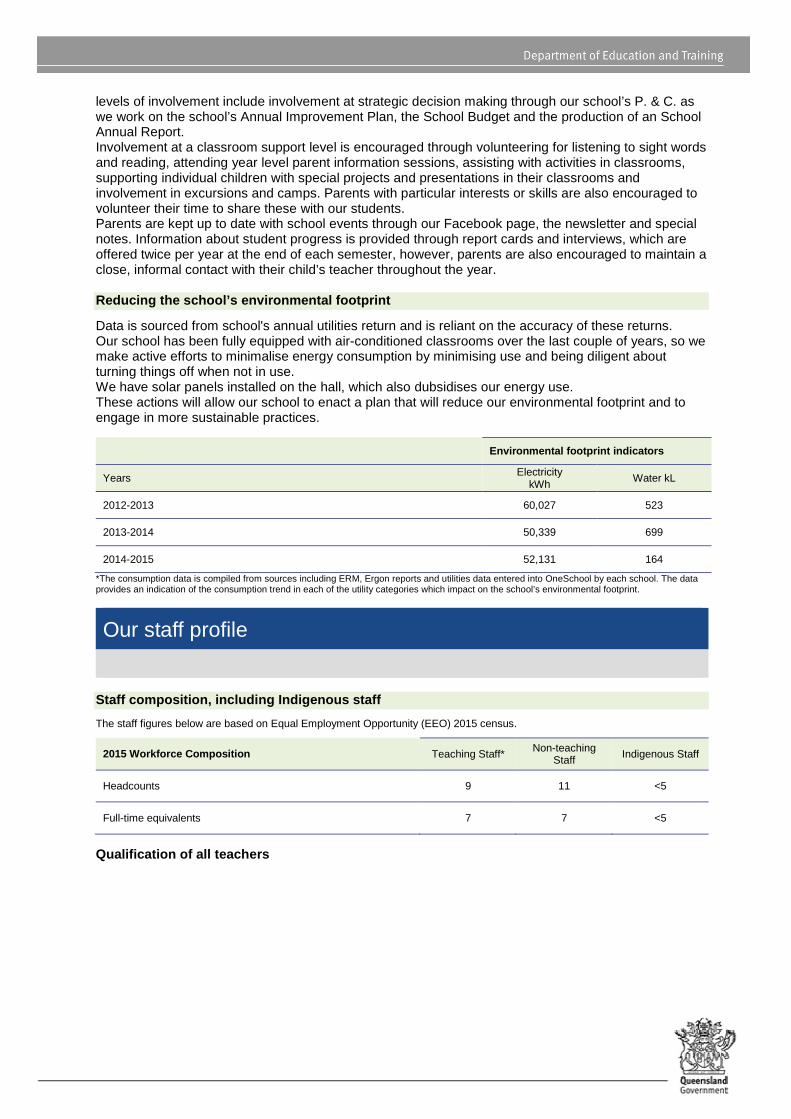
Data is sourced from school's annual utilities return and is reliant on the accuracy of these returns. Our school has been fully equipped with air-conditioned classrooms over the last couple of years, so we make active efforts to minimalise energy consumption by minimising use and being diligent about turning things off when not in use. We have solar panels installed on the hall, which also dubsidises our energy use. These actions will allow our school to enact a plan that will reduce our environmental footprint and to engage in more sustainable practices.
Environmental footprint indicators
Years Electricity kWh
Water kL
2012-2013 60,027 523
2013-2014 50,339 699
2014-2015 52,131 164
*The consumption data is compiled from sources including ERM, Ergon reports and utilities data entered into OneSchool by each school. The data provides an indication of the consumption trend in each of the utility categories which impact on the school’s environmental footprint.
Our staff profile
Staff composition, including Indigenous staff
The staff figures below are based on Equal Employment Opportunity (EEO) 2015 census.
2015 Workforce Composition Teaching Staff* Non-teaching Staff Indigenous Staff
Headcounts 9 11 <5
Full-time equivalents 7 7 <5
Qualification of all teachers

Highest level ofattainment
Number of Teaching Staff *
Certificate 0
Diploma 0
Advanced Diploma 0
Bachelor Degree 8
Graduate Diploma etc.** 0
Masters 1
Doctorate 0
Total 9
0 0 0
8
0
1
00
1
2
3
4
5
6
7
8
9
Certificate Diploma AdvancedDiploma
BachelorDegree
GraduateDiploma
etc.**
Masters Doctorate
*Teaching staff includes School Leaders
**Graduate Diploma etc. includes Graduate Diploma, Bachelor Honours Degree, and Graduate Certificate.
Expenditure on and teacher participation in profess ional development
The total funds expended on teacher professional development in 2015 were $13 015.
The major professional development initiatives are as follows:
• Curriculum Development days to focus on C2C preparations and current focus areas of Literacy and Numeracy and other curriculum initiatives
• Speciffic PD around the facilitation of a balanced reading program • The Art & Science of Teaching • Leadership PD included Principal Conferences and Business days • Release for observation and feedback sessions • Release for Peer classroom visits • Beginning Teacher Mentoring and Professional Development • Gifted and Talented Education Professional Development • Rehabilitation and Workplace Health and Safety Professional Development • Behaviour Support and ESCM training • First Aid (including Asthma and Anaphalaxis) • Asbestos Awareness • Code of Conduct • Child Safety • Non Violent Chris Intervention • Fire Warden Training • Finance and Facilities Training • Classroom Profiling Training • Principal Professional Development
The proportion of the teaching staff involved in professional development activities during 2015 was 100%
Average staff attendance 2013 2014 2015
Staff attendance for permanent and temporary staff and school leaders. 95% 95% 95%
Proportion of staff retained from the previous scho ol year
From the end of the previous school year, 86% of staff was retained by the school for the entire 2015 school year.
School income broken down by funding source
School income broken down by funding source is available via the My School website at http://www.myschool.edu.au/.
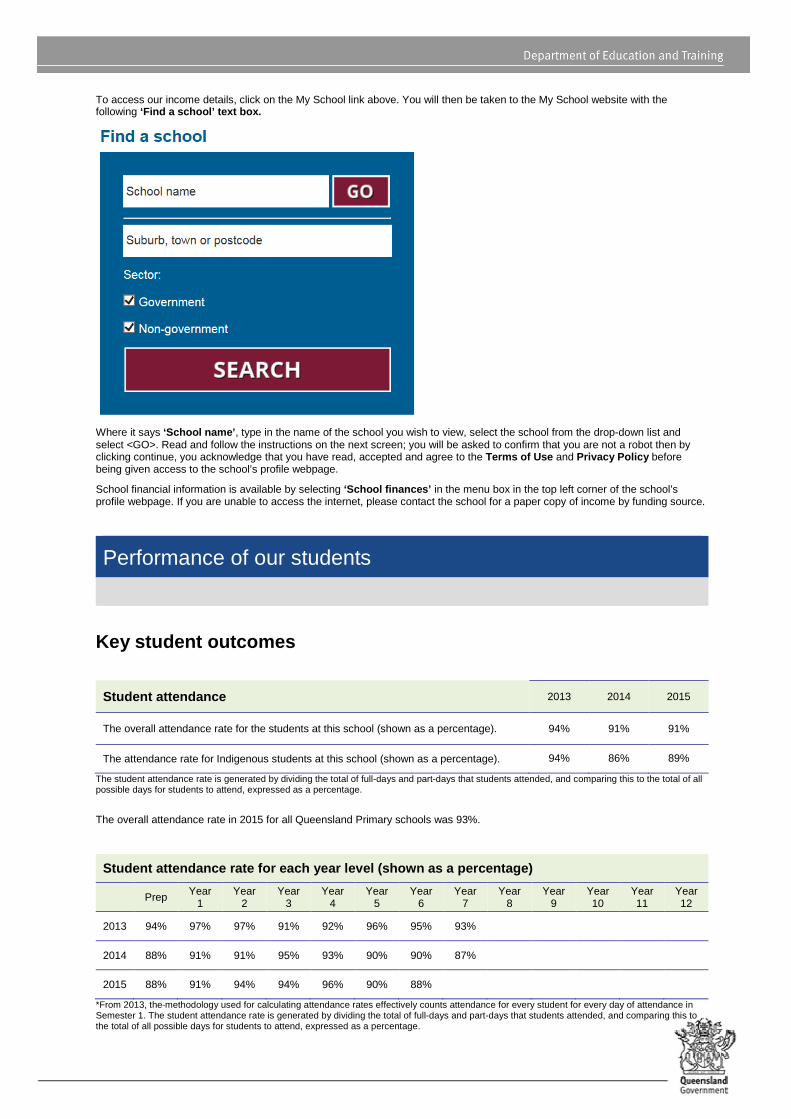
To access our income details, click on the My School link above. You will then be taken to the My School website with the following ‘Find a school’ text box.
Where it says ‘School name’ , type in the name of the school you wish to view, select the school from the drop-down list and select <GO>. Read and follow the instructions on the next screen; you will be asked to confirm that you are not a robot then by clicking continue, you acknowledge that you have read, accepted and agree to the Terms of Use and Privacy Policy before being given access to the school’s profile webpage.
School financial information is available by selecting ‘School finances’ in the menu box in the top left corner of the school’s profile webpage. If you are unable to access the internet, please contact the school for a paper copy of income by funding source.
Performance of our students
Key student outcomes
Student attendance 2013 2014 2015
The overall attendance rate for the students at this school (shown as a percentage). 94% 91% 91%
The attendance rate for Indigenous students at this school (shown as a percentage). 94% 86% 89%
The student attendance rate is generated by dividing the total of full-days and part-days that students attended, and comparing this to the total of all possible days for students to attend, expressed as a percentage.
The overall attendance rate in 2015 for all Queensland Primary schools was 93%.
Student attendance rate for each year level (shown as a percentage)
Prep Year 1
Year 2
Year 3
Year 4
Year 5
Year 6
Year 7
Year 8
Year 9
Year 10
Year 11
Year 12
2013 94% 97% 97% 91% 92% 96% 95% 93%
2014 88% 91% 91% 95% 93% 90% 90% 87%
2015 88% 91% 94% 94% 96% 90% 88%
*From 2013, the methodology used for calculating attendance rates effectively counts attendance for every student for every day of attendance in Semester 1. The student attendance rate is generated by dividing the total of full-days and part-days that students attended, and comparing this to the total of all possible days for students to attend, expressed as a percentage.

DW = Data withheld to ensure confidentiality.
Student attendance distribution
The proportions of students by attendance range.
23
21
8
9
11
12
27
22
15
40
46
64
0% 20% 40% 60% 80% 100%
2015
2014
2013
Proportion of Students
Attendance Rate: 0% to <85% 85% to <90% 90% to <95% 95% to 100%
Description of how non-attendance is managed by the school
Non-attendance is managed in state schools in line with the DET procedures, Managing Student Absences and Enforcing Enrolment and Attendance at State Schools and Roll Marking in State Schools, which outline processes for managing and recording student attendance and absenteeism.
Our school implements the following measures in this area: Students who arrive late or who are to be collected early must be taken through the office by the child’s parent/ caregiver so that this can be recorded and the student’s teacher can be informed.
Class rolls are marked twice per day, soon after 9:00 am and soon after 1:55 pm. Parents can phone in reasons for the absence of a student, leave a message on the school’s Student Absence Line, send a note, speak with the teacher etc. Unexplained absences are followed up the class teacher. Rolls are sent to the office once per week so that the data can be entered into the administration system. Absences of more than three days are followed up by the principal with the student’s parent/ caregiver, as are any trends e.g. if a student is away every Friday.
Departmental policies are enacted for ongoing student absences.
National Assessment Program – Literacy and Numeracy (NAPLAN) results – our reading, writing, spelling, grammar and punctuation, and num eracy results for the Years 3, 5, 7, and 9.
Our reading, writing, spelling, grammar and punctuation, and numeracy results for the Years 3, 5, 7 and 9 are available via the My School website at http://www.myschool.edu.au/.
To access our NAPLAN results, click on the My School link above. You will then be taken to the My School website with the following ‘Find a school’ text box.
Where it says ‘School name’ , type in the name of the school you wish to view, select the school from the drop-down list and select <GO>. Read and follow the instructions on the next screen; you will be asked to confirm that you are not a robot then by clicking continue, you acknowledge that you have read, accepted and agree to the Terms of Use and Privacy Policy before being given access to the school’s profile webpage.
School NAPLAN information is available by selecting ‘NAPLAN’ in the menu box in the top left corner of the school’s profile webpage. If you are unable to access the internet, please contact the school for a paper copy of our school’s NAPLAN results.
Post-school destination information
At the time of publishing this School Annual Report, the results of the 2016 post-school destinations survey, Next Step – Student Destination Report (2015 Year 12 cohort) for the school were not available. Information about these post-school destinations of our students will be uploaded to the school’s website in September.