science - 1 february 2013
TRANSCRIPT


487
EDITED BY STELLA HURTLEY
CR
ED
ITS
(T
OP
TO
BO
TT
OM
): N
AS
A; H
U E
T A
L.
www.sciencemag.org SCIENCE VOL 339 1 FEBRUARY 2013
Exploiting Carbon NanotubesIndividual defect-free carbon nanotubes can
have exceptional mechanical, thermal, and
electrical properties, which has led to specula-
tion on a wide range of potential applications.
However, challenges in growing large quantities
of pure nanotubes, and for some applications
tubes of only one type, have limited their wide-
spread use. De Volder et al. (p. 535) review
the efforts that have been made to scale up car-
bon nanotube production and discuss a number
of applications where enhanced materials have
made use of carbon nanotubes.
The Third Way Because organic carbon contains a larger frac-
tion of the light isotope 12C than inorganic car-
bonate, variations in the carbon isotopic record
of sedimentary rocks are thought to represent
changes in the amount of organic carbon buried
as sediments (and thus removed from the rest
of the carbon cycle). Schrag et al. (p. 540; see
the Perspective by Canfi eld and Kump) suggest
that historically a third component was impor-
tant: authigenic carbonate. Authigenic carbon-
ate is not produced in any appreciable quantity
today, but was much more abundant when the
level of atmospheric oxygen was low.
Not Just WastingMalnutrition is well known in Malawi, including
a severe form—kwashiorkor—in which children
do not simply waste away, they also suffer edema,
liver damage, skin ulceration, and anorexia.
Smith et al. (p. 548; see the Perspective by
Relman) investigated the microbiota of pairs of
twins in Malawian villages and found notable
differences in the composition of the gut mi-
crobiota in children with kwashiorkor. In these
children, a bacterial species related to Desul-
fovibrio, which has been associated with bowel
disease and infl ammation, was noticeable.
When the fecal fl ora from either the healthy
or the sick twin was transplanted into groups
of germ-free mice, the mice that received the
kwashiorkor sample started to lose weight, like
their human counterpart.
Nanoscale NMR with Diamond DefectsAlthough nuclear magnetic resonance (NMR)
methods can be used for spatial imaging, the
low sensitivity of detectors limits the minimum
sample size. Two reports now describe the use of
near-surface nitrogen-vacancy (NV) defects in
diamond for detecting nanotesla magnetic fi elds
from very small volumes of material (see the
Perspective by Hemmer). The spin of the defect
can be detected by changes in its fl uorescence,
which allows proton NMR of organic samples
only a few nanometers thick on the diamond
surface. Mamin et al. (p. 557) used a combina-
tion of electron spin echoes and pulsed NMR
manipulation of the proton spins to detect the
very weak fi elds. Staudacher et al. (p. 561)
measured statistical polarization of a population
of about 104 spins near the NV center with a
dynamical decoupling method.
The Power of the Collective
Sensing the environment is generally
considered to require signifi cant cogni-
tive sampling and comparison, not to
mention time. However, species that do
not necessarily have the cognitive ability,
or the time, have also proven to be quite
adept at sensing and evaluating their
environment. Berdahl et al. (p. 574) show
that in shiners, a species of schooling fi sh,
mere attraction to, and movement toward,
neighboring individuals allows the group to
track preferred darkness in a variable-light
environment.
Phage InvasionBacteriophages are responsible for much of
bacterial evolution, both by imposing selection
for resistance to infection and by horizontal
gene transfer of host genes to new bacteria.
However, we know surprisingly little about the
initiation of phage infection. Hu et al.
(p. 576, published online 10 January) used
high-throughput cryo–
electron tomography
and sub-volume
analysis to examine
Escherichia coli mini-
cells infected with both
wild-type and mutant
T7 bacteriophages.
High-resolution views
of phage structures
at different stages of
infection reveal the de
novo formation of an
extended tail by the ejection of internal head
proteins, in order to form the channel for DNA
transport into the cytoplasm.
Dissecting Microtubule StabilityMicrotubule-stabilizing agents (MSAs), like
taxol, inhibit cell division and are widely used
in cancer chemotherapy. Prota et al. (p. 587,
published online 3 January) present structural
data on the molecular mechanism of action of
antimitotic drugs. Tubulin structures in complex
with the MSAs zampanolide and epothilone A,
revealed a general mechanism for how MSAs
promote microtubule assembly and stability by
affecting lateral tubulin interactions.
As the combined effects of Antarctic strato-
spheric ozone depletion and climate warm-
ing have forced the westerly surface winds
in the Southern Hemisphere to shift
toward the pole, mixing between the
upper ocean and deeper waters has
also changed. Waugh et al. (p. 568)
now show that water originating at the
surface at subtropical latitudes is mix-
ing into the deeper ocean at a higher
rate than 20 years ago, while the reverse
is true for those originating at higher
latitudes. The summer westerly winds
that blow in the Southern Hemisphere have
shifted toward the South Pole over the past sev-
eral decades, but why? Lee and Feldstein (p. 563)
show that greenhouse gas forcing and ozone depletion
impart different signatures to wind patterns and conclude
that ozone depletion has been responsible for more than half of the observed shift.
The Change of Winds >>
Published by AAAS
on
Janu
ary
31, 2
013
ww
w.s
cien
cem
ag.o
rgD
ownl
oade
d fr
om

Improving Education Standards THIS MONTH, ACHIEVE, AN ORGANIZATION ESTABLISHED BY THE 50 U.S. STATE GOVERNORS
to improve academic standards and testing, will begin fi nalizing its draft document (released
in January 2013) of the Next Generation Science Standards (NGSS).* This document aims to
establish new common standards for science education for students aged 5 to 18 in the United
States, and it explicitly builds on the U.S. National Academies’ 2011 Framework for K-12
Science Education. The Framework put forth a vision of science education that is notable for
emphasizing student participation in key science and engineering practices, such as asking
questions and defi ning problems; developing and using models; engaging in argument from
evidence; and learning cross-cutting concepts such as energy and matter, cause and effect,
and structure and function. To allow room for these in the school day, the Framework stressed
the importance of minimizing the number of disciplinary core ideas that standards require to
be taught. Now that the NGSS document has entered its fi nal revision
stage, it is important to ask how well these standards match the power-
ful vision for them that was laid down by the Framework.
There is much to be commended in the draft. In particular, its
emphasis on science and engineering practices could lay the ground-
work for productive shifts toward helping students understand how
science helps us make sense of the natural world, instead of just what
science has learned. But the sheer volume of content referenced in the
Framework moves to the foreground in the NGSS draft and threatens to
undermine this promise. Any emphasis on practices requires a science-
rich conceptual context, and certainly the core ideas and cross-cutting
concepts presented are useful here. However, the draft contains a vast
number of core disciplinary ideas and sub-ideas, leaving little or no
room for anything else. In the three grades of middle school (ages 11
to 13) alone, the NGSS draft specifi es more than twice the disciplinary
content than did the 1996 National Science Education Standards. Thus, before fi nalizing the
new standards, we urge Achieve to quickly convene small groups of the nation’s best teachers
at the primary, middle-school, and high-school levels. Although teachers have been involved in
the writing effort, their new charge should be to bring ground truth to the NGSS by determin-
ing the maximum number of disciplinary core ideas that can be covered in a single school year,
while still leaving time for a productive focus on practices and cross-cutting ideas. And scien-
tists should immediately be charged with prioritizing the disciplinary core ideas in the current
draft (and their performance expectations) to reduce them to a more feasible number.
The welcome shift in priorities to teaching science and engineering practices along with the
content brings an assessment challenge. The NGSS draft document addresses this challenge by
delineating many performance expectations. However, current measurements and approaches
do not allow these types of performances to be assessed easily; it is much more diffi cult to
evaluate the quality of such engagement than to determine the accuracy of an explanation or
a word defi nition. Urgently needed is a vigorous R&D agenda that pursues new methods of
and approaches to assessment. This will be diffi cult but critically important long-term work. A
systematic commitment to the wrong quantitative measures, such as the inexpensive multiple-
choice testing of factoids, may well result in the appearance of gains at the tremendous cost of
suppressing important aspects of learning, attending to the wrong things in instruction, and
conveying to students a distorted view of science. Outstanding scientists must be willing to
work side by side with measurement specialists and science educators to develop methods for
evaluating what is important to measure, after completing the short-term task of prioritizing and
reducing the number of disciplinary core concepts in the new standards.
10.1126/science.1225590
– Janet Coffey and Bruce Alberts
489
EDITORIALC
RE
DIT
S: (T
OP
LE
FT
) M
AR
K S
AN
CH
EZ
; (B
OT
TO
M L
EF
T) T
OM
KO
CH
EL; (R
IGH
T) IS
TO
CK
PH
OT
O.C
OM
Janet Coffey is a pro-
gram offi cer with a
focus on science learn-
ing at the Gordon and
Betty Moore Founda-
tion, Palo Alto, CA, and
a former faculty mem-
ber in science educa-
tion at the University of
Maryland, College Park,
MD. E-mail: janet.
www.sciencemag.org SCIENCE VOL 339 1 FEBRUARY 2013
*www.nextgenscience.org/next-generation-science-standards. http://www7.nationalacademies.org/bose/Standards_Framework_Homepage.html.
Bruce Alberts is Editor-
in-Chief of Science.
Published by AAAS
on
Janu
ary
31, 2
013
ww
w.s
cien
cem
ag.o
rgD
ownl
oade
d fr
om

490
EDITORS’CHOICE
CR
ED
IT: ©
LU
IS A
LE
JA
ND
RO
BE
RN
AL R
OM
ER
O
EDITED BY KRISTEN MUELLER AND MARIA CRUZ
1 FEBRUARY 2013 VOL 339 SCIENCE www.sciencemag.org
E C O L O G Y
Downstream Discharge
Wastewater has the potential to serve as
a renewable source of energy, nutrients,
and clean water. However, most waste-
water is treated minimally to remove
pathogens and organic matter and
released into the environment. In highly
urbanized, developed areas, a single riv-
er may receive discharged effl uent from
several wastewater treatment plants, so
that a sizable fraction of the downstream
water is recycled wastewater. By studying
two rivers in and around Chicago, Drury
et al. showed that although wastewater
effl uent released into rivers may meet
water quality standards, it can have
an impact on downstream ecosystems.
Discharged effl uent resulted in increased
nutrients such as nitrate and phosphate
in the water column and, perhaps
surprisingly, decreased sediment organic
matter. The downstream sediments showed
decreased bacterial abundance and diversity,
shifting from communities that included sulfate-
reducing bacteria to communities dominated
by nitrate-oxidizing bacteria. Although the
two rivers have very different biological and
chemical properties upstream of the wastewater
treatment plants, they were homogenized to the
point where they were nearly indistinguishable
downstream. — NW
Appl. Environ. Microbiol.
10.1128/AEM.03527-12 (2013).
M O L E C U L A R B I O L O G Y
RNA Methylation and Metabolism
The methylation—and demethylation—of
DNA play an important role in the dynamic
regulation of gene expression and in genome
stability. RNA in eukaryotes is also methyl-
ated on the A base (m6A), the most abundant
posttranscriptional modifi cation of mammalian
mRNA. The modifi cation is known to have
biological function in meiosis and sporulation
in yeast and potentially in RNA processing in
mammalian cells.
Zheng et al. identify a mammalian RNA
demethylase, ALKBH5, that is capable of
removing the m6A mark from RNA both in vitro
and in vivo. The ALKBH5 protein localized to
nuclear speckles and associated with specifi c
mRNA processing factors there, and also
affected mRNA export, with both functions
requiring the ALKBH5 demethylation activ-
ity. A knockout of the ALKBH5 gene in mice
resulted in reduced male fertility and revealed
B I O C H E M I S T R Y
Signaling by Unfolding
In response to DNA damage, nuclear p53, a
tumor suppressor, induces expression of the p53
up-regulated modulator of apoptosis (PUMA).
PUMA in turn regulates the activity of cytosolic
p53. In the cytosol, p53 is sequestered by the
anti-apoptotic protein BCL-xL, a member of the
BCL-2 family of anti-apoptotic proteins. PUMA
disrupts this interaction and frees p53 to initi-
ate apoptosis. BCL-2 proteins are composed of
BCL-2 homology (BH) domains, and PUMA is
a single–BH domain protein. Follis et al. used
NMR spectroscopy and biophysical methods to
show that PUMA is intrinsically unstructured,
but that its BH3 domain folds upon binding to a
hydrophobic groove in BCL-xL. NMR spectroscopy
and x-ray crystallography showed that PUMA
binding caused partial unfolding of two helices
in BCL-xL. Although PUMA forms complexes with
other anti-apoptotic complexes, it did not induce
similar structural perturbations in these proteins.
Structural data suggested that a π-stacking
interaction between Trp-71 of PUMA and His-113
of BCL-xL was key to the destabilization of regions
of the BCL-xL structure. Thus, the p53 apoptotic
pathway is activated by regulated unfolding of an
anti-apoptotic protein. — VV
Nat. Chem. Biol. 10.1038/NCHEMBIO.1166 (2013).
E C O L O G Y
Changes at the Core
Airborne pollen grains deposited in sediments—particularly in undisturbed lake beds—
are a crucial element in understanding how vegetation and its constituent species respond
to changing climates. Research on the high-altitude lake sediments from the Bogotá basin
in the Colombian Andes has produced a rich record of climate and vegetation over the
Quaternary period. In particular, two deep sediment cores obtained in the late 1980s have
provided detailed information on climatic fl uctuations and vegetation change. However,
interpretation of the record has been hampered by uncertainties. Torres et al. now present
a new analysis of these cores, in which many of the technical challenges concerning the
chronology have been addressed. The development of the Andean forest and high-altitude
páramo vegetation—the uniquely Andean biome that occurs above the treeline and has
evolved de novo with the uplift of the Andes—was shown to be a dynamic process, with
ephemeral associations of plant species continually fl uctuating over the past 2 million
years as temperatures rose and fell with glacial cycles. This unbroken record provides
further evidence that plant communities at any given point in time often have no analog,
in terms of species composition, with past or future associations of species. — AMS
Quat. Sci. Rev. 63, 59 (2013).
Published by AAAS
on
Janu
ary
31, 2
013
ww
w.s
cien
cem
ag.o
rgD
ownl
oade
d fr
om

EDITORS’CHOICEC
RE
DIT
: A
DA
PT
ED
FR
OM
C. G
. F
ICH
OT
ET
AL.,
SC
IEN
TIF
IC R
EP
OR
TS 3
, 1053
(1
1 J
AN
UA
RY
201
3) ©
NA
TU
RE
PU
BLIS
HIN
G G
RO
UP
www.sciencemag.org SCIENCE VOL 339 1 FEBRUARY 2013
that the demethylase infl uences the expression of many genes, including key genes involved in spermatogenesis, resulting in defects in spermatogenesis and aberrant apoptosis in the testes of the mutant male mice. Thus, the dynamic methylation and demethylation of RNA, like DNA, may play an important role in gene regulation. — GR
Mol. Cell 49, 18 (2013).
M I C R O B I O L O G Y
Probing the Microbial Mix
In the past decade, it has become appar-ent that we are colonized by microbes that probably shape many of our most important physiological processes. Much of the work has taken a metagenomics approach—character-izing what microbes are there and what genes they express. Maurice et al. now go one step further and begin to investigate how our mi-crobial inhabitants respond to pharmacologi-cal perturbations. A combination of single-cell analysis by fl ow cytometry, DNA sequencing, and metatranscriptomics revealed that the bacteria within the human gut vary with respect to membrane integrity, polarization, and metabolic activity. Metabolic activity was enriched in Firmicutes, whereas Bacteroidetes were less metabolically active. Exposure to both antibiotics and host-targeted drugs resulted in alterations in the physiology, structure, and gene expression profi le of the bacteria. An increase in genes associated with resistance, stress responses, and me-tabolism was observed after antibiotic treatment. These results represent an important step toward understanding on a broad scale how specifi c per-turbations affect our microbial communities. — KLM
Cell 152, 39 (2013).
C H E M I S T R Y
Keeping Pigments in Sync
It has been clear for decades that photosynthesis involves an intricate chain of energy transfer steps, channeling the energy in light absorbed by dedicated pigments to a central complex that chemically splits water. Over the past 7 or 8 years, the advent of two-dimensional electronic spectroscopy has offered an increasingly detailed understanding of how the transfer process works. In particular, the data suggest a persistence of quantum-mechanical coherence—essentially a
steady phase relationship in electronic excitation across the donors and acceptors that facilitates effi cient transfer—for a much longer time than the complex molecular structure of the system would seem to allow. The underlying mechanism for sustaining coherence has remained somewhat mysterious and subject to debate. Tiwari et al.
have modeled the transfer process in a framework that allows mixing of vibrational and electronic excitation, and they fi nd that anticorrelated vibrations across the associated proteins (i.e., contraction on one side concurrent with extension on the other) could mediate electronic dynamics that give rise to the spectral signatures observed in the experiments. They further note that certain pigment vibrational frequencies match the as-sociated electronic energy gaps, lending further plausibility to this mechanism. — JSY
Proc. Natl. Acad. Sci. U.S.A. 110, 1203 (2013).
O C E A N S C I E N C E
Runoff in the Arctic
The Arctic is a bellwether region for climate change, with temperatures there increasing at approximately twice the g lobal average rate. That rapid temperature rise has caused widespread melting of sea ice, land ice, and permafrost which,
along with greater amounts of precipitation, have
increased the fl ux of fresh water into
northern high-latitude seas. This enhanced freshwater in-put has many important effects on the
Arctic Ocean—namely, on sur-
face salinity, tem-perature structure,
biological productivity, and carbon sequestration.
To determine the distribution of con-tinental runoff in the Arctic Ocean over the past decade, Fichot et al. developed an optical proxy for terrigenous dissolved organic matter, which they implemented using remote sensing of ocean color from space. By measuring the amounts of dissolved organic matter in the ocean’s surface, they illustrate how runoff has changed over the past decade across the entire pan-Arctic region. This approach should be an important tool for monitoring the effects of climate change on this high-latitude region. — HJS
Sci. Rep. 3, 1053 (2013).
W
W
−2000
−2000
−2000
−2000
−2000
−2000
−2000
−2000
−2000
−2000
−2000
−2000
−2000
−2000
−2000
−2000
−2000
−2000
−2000
−2000
−2000
−2000
−2000
−2000
−2000
Canad
a Bas
in
Eura
sian
Bas
in
Published by AAAS
on
Janu
ary
31, 2
013
ww
w.s
cien
cem
ag.o
rgD
ownl
oade
d fr
om

1 FEBRUARY 2013 VOL 339 SCIENCE www.sciencemag.org494
NEWS OF THE WEEK
CR
ED
ITS
(T
OP
TO
BO
TT
OM
): T
HE
GLO
BA
L P
OLIO
ER
AD
ICA
TIO
N IN
ITIA
TIV
E; P
ET
ER
RE
JC
EK
/NSF
Sandy. It includes more than $250 million to help the National Oceanic and Atmospheric Administration (NOAA) replace and repair buoys, radars, and other research assets dam-aged by the storm, as well as to strengthen weather and coastal science programs designed to track future storms. The total includes $111 million to cover an expected data gap when several weather satellites die over the next few years, $50 million for the agency’s cooperative research programs in northeastern states, and $44.5 million to put new wings on two of NOAA’s aging Orion “hurricane hunter” aircraft.
Cairo 3
Polio Virus Spreads From Pakistan to EgyptEgyptian and international health offi -cials are on high alert after poliovirus from Pakistan was discovered in sewage water collected during routine sampling in Cairo in December. Genetic sleuths linked the Cairo poliovirus to one last seen in Sindh Province in Pakistan in September 2012, the World Health Organization (WHO) reported last week. How the virus got to Cairo is unclear—people can carry the virus asymptomatically when they travel—but the analysis, conducted by the U.S. Centers for Disease Control and Prevention, suggests that it made the leap in the past few months. Egypt has not had a case of polio since 2004.
So far, no polio cases have been detected in Cairo, and there is no evidence that the virus is circulating widely. But the risk that this imported virus could spark an out-break there is real, says Bruce Aylward, who runs the global polio eradication effort from WHO in Geneva, Switzerland. Emer-gency vaccination campaigns are slated for Cairo and the rest of the country in the
next few weeks. Meanwhile, Pakistan, one of just three countries where polio is still entrenched, is under even more pressure to stamp out the virus within its borders. http://scim.ag/polioEgypt
Taipei 4
‘Richer-Than-Nobel’ Science Prize Comes With a TwistA Taiwanese tycoon has established a new science prize that will not only pay out more than the Nobel Prize but will support research as well. Individuals or institutions that have demonstrated the most creative and infl uential research in four fi elds will receive about $1.36 million, while an addi-tional $341,000 will support a plan pro-posed by recipients to support research and develop talent in a related area over 5 years. (The Nobel Prize amount for 2012 was about $1.2 million.)
The Tang Prizes, named after China’s Tang Dynasty, will be awarded biennially for work in sustainable development, biophar-maceutical science, sinology (excluding literary works), and rule of law. Samuel Yin, who made a fortune in diversifi ed real estate, fi nancial, and retail investments, is endow-ing the prize. Academia Sinica, which over-sees Taiwan’s premier research labs, will be responsible for the nomination and selection process. The fi rst prize announcement is set for July 2014.
Whillans Ice Stream, Antarctica 5
U.S. Mission to Whillans Ice Stream a Success A U.S.-based team announced on 28 Janu-ary that it had successfully retrieved its fi rst samples of sediment and water from the Whillans Ice Stream, a body of water sealed nearly a kilometer below the Antarctic ice. The interdisciplinary project is looking for subglacial microbial life, and also study-ing the continent’s climate history and ice sheet dynamics. The samples of sedi-ment and basal ice from beneath the water are expected to help scientists understand whether subglacial lakes act to stabilize or
Mount Elizabeth, Antarctica 1
No Survivors in Antarctic Plane CrashThe wreckage of a Twin Otter aircraft that went missing in the Antarctic was found near the summit of a mountain in the Queen Alexandra mountain range, about 700 kilo-meters from both the South Pole and the United States’ McMurdo Station. The plane, which was to be used as part of Italy’s polar
research program, crashed on 23 January, but bad weather prevented rescuers from reach-ing it for several days. The three Canadian crew members that were aboard the plane are all presumed to have died in the crash. Why the plane crashed was still unclear when Science went to press. Citing poor weather conditions, on 28 January offi cials with the United States Antarctic Program and Ant-arctica New Zealand jointly chose to recall search-and-rescue teams from the site and delay efforts to recover any remains until the next Antarctic research season.
Washington, D.C. 2
Sandy Relief for Hurricane Hunters
Hurricane researchers are about to get some new wings. The U.S. Senate on 28 January approved a $50.5 billion bill designed to help people recover from last year’s superstorm
3
1
4
2
5
AROUND THE WORLD
Published by AAAS
on
Janu
ary
31, 2
013
ww
w.s
cien
cem
ag.o
rgD
ownl
oade
d fr
om

www.sciencemag.org SCIENCE VOL 339 1 FEBRUARY 2013 495
Each category carries a 50 million yen ($550,000) award, which laureates will receive along with medals at a ceremony in Tokyo in April.
Marine ecologist J. Frederick Grassle of Rutgers University in New Brunswick, New Jersey, won for his studies of deep-sea hydrothermal vent ecosystems and organ-isms. He also helped launch the Census of Marine Life, intended to catalog the diversity of marine life, and the Ocean Biogeographic Information System, which is used in marine conservation efforts.
Chemists Grant Willson, now of the Uni-versity of Texas, Austin, and Jean Fréchet, of King Abdullah University of Science and Technology in Thuwal, Saudi Arabia, won for developing chemically amplifi ed resists: photosensitive materials that allow semiconductor makers to shrink integrated circuits for microprocessors and memory chips, such as those in personal computers and mobile phones. C
RE
DIT
S (T
OP
TO
BO
TT
OM
): N
AS
A; I2
IN
ST
ITU
TE
FO
R IM
AG
INA
TIO
N A
ND
IN
GE
NU
ITY; JA
PA
N P
RIZ
E F
OU
ND
AT
ION
(3
); U
.S. S
EN
AT
E
Astrophysics Over Antarctica: Balloon Breaks Flight Record
Now on its third orbit around the South Pole, a NASA scientifi c balloon has broken the record for the longest-fl ying balloon of its size. As it soars at an altitude of 39,000 meters—about the same stratospheric height from which daredevil Felix Baumgartner completed his record-breaking space dive last October—the balloon wields an instrument called the Super Trans-Iron Galactic Element Recorder (more pithily known as Super-TIGER), which measures heavy elements in the fl ux of high-energy galactic rays that bombard Earth. Super-TIGER, which launched on 8 December 2012 from a site near McMurdo Station, had stayed aloft for 46 days when Science went to press, shattering the previous record of 41 days for a long-duration scientifi c balloon, set in 2005. The team plans to continue fl y-ing it for another week or so to bring it closer to McMurdo before ending its fl ight.
Three Q’s
Biotechnologist Hayat Sindi received her Ph.D. from the University of Cambridge and was a visiting scholar at Har-vard University before returning to Saudi Arabia in 2011 to create an institute to promote science and entrepre-neurship. She’s one of the fi rst 30 women to be appointed to the country’s 150-member Shura Council, which advises the govern-ment on science and technology.
Q: What issues are you hoping to address as a council member?H.S.: I’m [geared] toward entrepreneurship and how we can encourage our youth to be innovative. Also, I’m interested in women’s issues. So I’m going to concentrate on inno-vation, scientifi c research, youth, and women.
Q: How do you see the role of science in the Middle East and around the world?H.S.: Science was born to solve problems, to look at how to improve quality of life. What I’m trying to fi gure out is how can I make sci-ence affordable and accessible to everybody?
Q: What does having women on the Shura Council mean for women in Saudi Arabia?H.S.: This is the best thing to happen [for Saudi women] since women were permitted to study. Women look at different problems with different angles, in terms of economics or science or health or social studies. We can-not ignore [their] contribution.
Deep-Sea, Semiconductor Research Net Japan Prizes Research at the bottom of the sea and wiz-ardry in semiconductor clean rooms have netted this year’s Japan Prizes, among the world’s top science and technology awards.
NEWSMAKERS
Sindi
Fréchet WillsonGrassle
NIH Loses a Senate Champion
The National Institutes of Health (NIH) will lose one of its longtime champions with the upcoming retirement of Senator Tom Harkin (D–IA). Last week, Harkin announced he would not seek a sixth term, ending a 40-year congressional career.
Harkin is currently chair of the Senate panel that sets funding levels for NIH, and he also chairs the committee that over-sees federal policies in health, education,
and labor. He teamed up with his then-Republican counterpart, Arlen Specter of Pennsylvania, to win a doubling of the NIH budget from 1998 to 2003. He and Specter also led an effort to include $10.4 billion for
NIH in the 2009 stimulus package. With Specter, Harkin also sponsored
legislation in the 2000s that would have expanded federal funding for research on human embryonic stem cells. But Harkin didn’t always please scientists: In the 1990s, he pushed to create NIH’s National Center for Complementary and Alternative Medicine, which critics claim wastes money testing fringe treatments. http://scim.ag/Harkinret
destabilize the West Antarctic Ice Sheet.The team is the second of three research
groups this season to achieve its goal of retrieving samples from some of the conti-nent’s mysterious buried waters. In Decem-ber, a British Antarctic Survey team seeking to penetrate subglacial Lake Ellsworth was forced to pull the plug on its mission due to technical problems. Last month, a Russian team nabbed its fi rst sample from subglacial Lake Vostok.
Harkin
NEWS
Published by AAAS
on
Janu
ary
31, 2
013
ww
w.s
cien
cem
ag.o
rgD
ownl
oade
d fr
om
496 1 FEBRUARY 2013 VOL 339 SCIENCE www.sciencemag.org
NEWS OF THE WEEK
CR
ED
ITS
(C
LO
CK
WIS
E F
RO
M L
EF
T):
MIK
E S
HA
PIR
O/U
NIV
ER
SIT
Y O
F U
TA
H; L. C
. H
AM
ILT
ON
AN
D M
. D
. S
TA
MP
ON
E, W
EA
TH
ER
, C
LIM
AT
E, A
ND
SO
CIE
TY
(201
3) ©
20
13
AM
ER
ICA
N M
ET
EO
RO
LO
GIC
AL S
OC
IET
Y; A
RK
AD
Y Z
AR
UB
IN/W
IKIM
ED
IA C
OM
MO
NS
Join us on Thursday, 7 February, at 3 p.m. EST for a live chat with experts about a hot topic
in science. http://scim.ag/science-live
models,” says Hans Ellegren, an evolution-
ary biologist at Uppsala University in Swe-
den who was not involved with the work.
http://scim.ag/pigeonplum
Paradox Lost
Last April, Masud Mansuripur, an electrical
engineer at the University of Arizona in
Tucson, claimed classical electrodynamics
and relativity can lead to a paradox. Now,
four physicists say in comments in press
at Physical Review Letters that they have
resolved the contradiction.
Mansuripur’s paradox posited an electric
charge sitting near a magnet. In the “refer-
ence frame,” where both are stationary, they
don’t interact. But, in the “moving frame,”
where they glide together, the magnet feels
a twisting torque, according to both relativ-
ity and the standard formula for electric and
magnetic forces. Yet the magnet can’t spin in
one frame and not in the other—so the force
formula must be wrong, Mansuripur argues.
But, others say, relativity demands that the
magnet possess “hidden angular momen-
tum,” which, in the moving frame, constantly
increases. So the torque in that frame feeds
the hidden angular momentum instead of
spinning the magnet. Problem solved.
Mansuripur says hidden momentum is an
ill-defi ned concept that papers over the prob-
lem. But Daniel Vanzella of the University of
São Paulo in São Carlos, Brazil, says it’s bed-
rock relativity, “not an ad hoc invention put in
to reconcile things.” http://scim.ag/Lorpara
Genes the Secret to Surviving A Siberian WinterFrigid Siberia has been home to humans for
tens of thousands of years, including Homo
sapiens and Neandertals. A study of today’s
Siberian peoples, presented last month at the
Unravelling Human Origins meeting in Cam-
bridge, U.K., fi nds that their genes may help
them adapt to cold conditions.
Alexia Cardona, a graduate student at
the University of Cambridge, and her col-
leagues analyzed 200 DNA samples from
10 indigenous Siberian populations and
looked for genes that might correlate with
cold adaptation.
Using techniques that detect natural selec-
tion in the human genome—that is, genetic
variants favored by evolution because they
helped humans
survive and repro-
duce—Cardona
found evidence for
such variants in three
genes in the Siberian
populations. One
gene, called UCP1,
helps convert fat
directly into heat to
keep the body warm.
A second, called ENPP7, is implicated in the
metabolism of fats from meat and dairy prod-
ucts. And a third gene, PRKG1, is involved in
smooth muscle contraction, key to shivering
and the constriction of blood vessels to avoid
heat loss. http://scim.ag/coldgenes
FINDINGS
With Genomes, Pecking Away At Pigeons’ PlumageFor centuries, bird breeders have cultivated
pigeons with a startling variety of colors,
feather arrangements, and behaviors, creat-
ing about 350 breeds that compete to be the
fastest, longest-fl ying, or most beautiful.
Now, Michael Shapiro,
an evolutionary biolo-
gist at the University of
Utah in Salt Lake City,
and his colleagues have
tracked down the muta-
tion leading to one of the
pigeon’s more osten-
tatious traits: its head
crest, which ranges from
a simple peak to a hood of plumage. Using
the pigeon genome newly sequenced by BGI
in Shenzhen, China, Shapiro and colleagues
found that the presence of a crest of any sort
is determined by a gene called EphB2, they
report online this week in Science. Now,
researchers can look to see if this gene leads
to head crests in wild birds. “The work now
puts the spot on pigeons … [and] may attract
other scientists to start using pigeons as
Random Sample
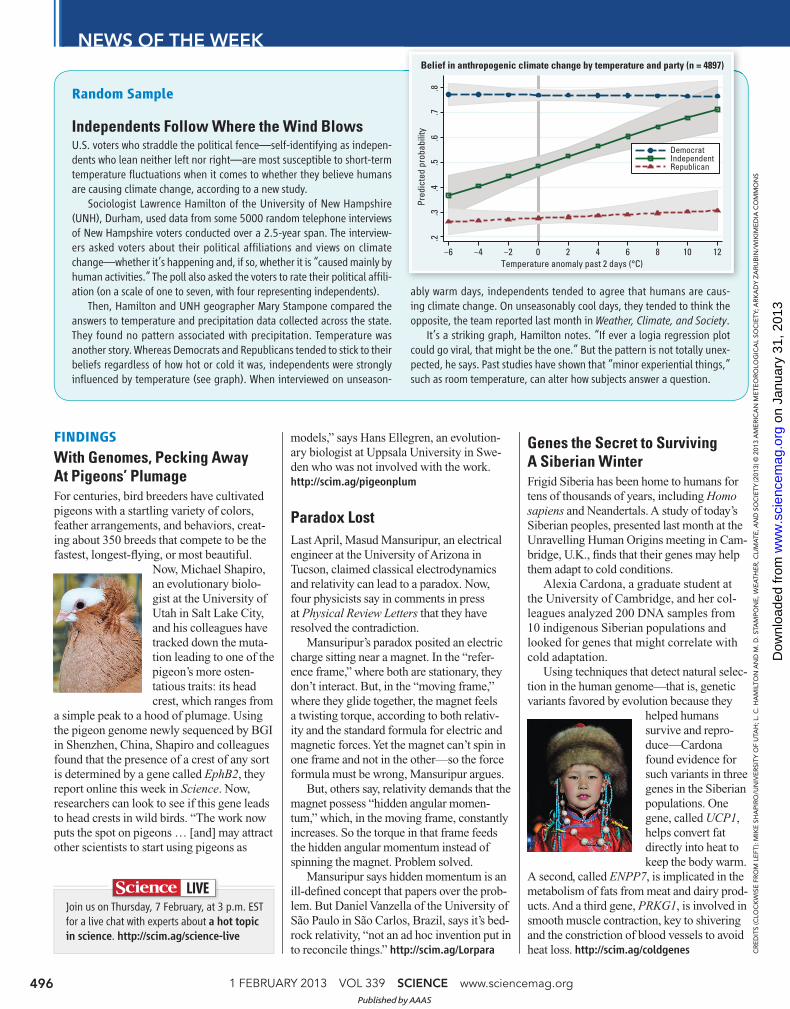
Independents Follow Where the Wind BlowsU.S. voters who straddle the political fence—self-identifying as indepen-dents who lean neither left nor right—are most susceptible to short-term temperature fl uctuations when it comes to whether they believe humans are causing climate change, according to a new study.
Sociologist Lawrence Hamilton of the University of New Hampshire (UNH), Durham, used data from some 5000 random telephone interviews of New Hampshire voters conducted over a 2.5-year span. The interview-ers asked voters about their political affi liations and views on climate change—whether it’s happening and, if so, whether it is “caused mainly by human activities.” The poll also asked the voters to rate their political affi li-ation (on a scale of one to seven, with four representing independents).
Then, Hamilton and UNH geographer Mary Stampone compared the answers to temperature and precipitation data collected across the state. They found no pattern associated with precipitation. Temperature was another story. Whereas Democrats and Republicans tended to stick to their beliefs regardless of how hot or cold it was, independents were strongly infl uenced by temperature (see graph). When interviewed on unseason-
ably warm days, independents tended to agree that humans are caus-ing climate change. On unseasonably cool days, they tended to think the opposite, the team reported last month in Weather, Climate, and Society.
It’s a striking graph, Hamilton notes. “If ever a logia regression plot could go viral, that might be the one.” But the pattern is not totally unex-pected, he says. Past studies have shown that “minor experiential things,” such as room temperature, can alter how subjects answer a question.
.2.3
.4.5
.6.7
.8
Pre
dic
ted
pro
ba
bili
ty
−6 −4 −2 0 2 4 6 8 10 12
Temperature anomaly past 2 days (°C)
DemocratIndependentRepublican
Belief in anthropogenic climate change by temperature and party (n = 4897)
Published by AAAS
on
Janu
ary
31, 2
013
ww
w.s
cien
cem
ag.o
rgD
ownl
oade
d fr
om

NEWS & ANALYSIS
www.sciencemag.org SCIENCE VOL 339 1 FEBRUARY 2013 497
NEWS & ANALYSISC
RE
DIT
S: K
OST
YA
NO
VO
SE
LO
V; E
PF
L/B
LU
E B
RA
IN P
RO
JE
CT
BRUSSELS—There was no champagne and
no Academy Awards–style ceremony, not
even flowers for the winners, when Neelie
Kroes, the Dutch vice president of the Euro-
pean Commission, announced the outcome of
the biggest research funding competition in
Europe’s history here on 28 January.
The low-key proceedings were in stark
contrast to the massive hopes riding on two
futuristic projects that may now get up to
€1 billion each—one to study a promising
new material called graphene, and the other
to model the entire human brain. The proj-
ects, Kroes promised, would help to “keep
Europe as the home of scientifi c excellence”
and “fertilize the green shoots of economic
growth” in the struggling union. “Today,” she
added, “there aren’t just two winners, there are
500 million winners.”
The anointment marked the end of a gru-
eling process during which six international
teams had produced extensive research plans
for the Future and Emerging Technologies
Flagship Initiatives, as well as elaborate PR
campaigns. The two winning groups will now
enter into negotiations with the commission to
agree on the exact research plan.
Yet doubts and questions remain. Some
neuroscientists are surprised that the Human
Brain Project, a controversial effort to inte-
grate data from tens of thousands of papers
published in the fi eld every year, came out on
top. The selection process, opaque even to the
winners, has frustrated some participants, and
it’s unclear whether the promised €1 billion in
funding will materialize; it could be far less.
The Flagship Initiatives were created to
fund two large-scale projects with a “vision-
ary goal.” The four that did not make it to the
fi nish included an ambitious effort to model
society, called FuturICT, in order to predict
fi nancial crises or revolutions; a computer-
generated “virtual patient” to test therapies;
a new generation of user-friendly robots for
the home; and a project to develop “guardian
angel” chips that would monitor people and
environments and warn of impending dangers
(Science, 4 January, p. 28).
For Henry Markram of the Swiss Federal
Institute of Technology in Lausanne, who
heads the Human Brain Project, the announce-
ment was a personal triumph. Critics have
dismissed the effort to recreate the human
brain in silico as misguided and a possible
diversion of money from more immediate
research questions in neuroscience (Science,
11 November 2011, p. 748). Rather than divide
the fi eld, Markram says he hopes to unite it
by bringing everything that’s known in neu-
roscience together. “At the moment, everyone
is digging in his little corner,” he says. “We
are asking the whole world of neuro science to
come together.”
The success of Graphene, a project led by
Jari Kinaret of Chalmers University of Tech-
nology in Gothenburg, Sweden, was less of
a surprise. The plan is to develop new appli-
cations for graphene, which is made up of
single layers of carbon atoms; the research
is expected to lead to innovative products
such as better batteries or fl exible electron-
ics. Among the partners are groups from more
than 50 universities in 17 countries, but also
companies such as Airbus and Nokia.
Kinaret isn’t sure, however, of what exactly
his group has won. Over the fi rst 30 months,
each project will receive only €54 million—
an amount that Kinaret says disappointed
many of his collaborators. “We thought the
budget would be higher,” he says. Funding is
supposed to ramp up to €100 million a year
per project, but that depends on Europe’s
new science and innovation program, Hori-
zon 2020, and its uncertain budget (Science, 16 November 2012, p. 872.) Moreover, the
European Union is counting on member states
to provide half the money; few countries so far
have volunteered to commit anything. Still,
Kroes said that she was “nearly certain” the
€1 billion promise would be fulfi lled.
Scientists are still scratching their heads
over the selection process. “The goalposts
kept moving and that was very frustrating
at times,” Kinaret says. Dirk Helbing of the
Swiss Federal Institute of Technology in Zur-
ich, who coordinated FuturICT, says planning
“disruptive technologies” 10 years ahead isn’t
really possible to begin with. What the Flag-
ship Initiatives asked of scientists, he says,
is, “Please write down how you would start a
company like Microsoft or Facebook.”
In the end, two of the six proposals short-
listed in 2011 weren’t even asked to defend
their proposals before an expert panel that
made the fi nal cut last December. “After [we
spent] more than a year and €1.5 million on
writing a detailed research plan, they should
at least have invited us and listened to us,”
says Hans Lehrach, coordinator of the virtual
patient proposal. Wolfgang Boch, who coor-
dinates the initiatives at the European Com-
mission, says the two projects simply didn’t
surpass a scoring threshold set by the panel.
Still, even the losers expect a payoff from
their blood, sweat and tears. The Guardian
Angels project has announced that it will live
on with funding from its consortium. Futur-
ICT, too, hopes to build on the momentum and
visibility from crafting its proposal. “This has
brought together social scientists, engineers,
and other scientists in an unprecedented way,”
Helbing says. “But the most important thing
was that Europe dared to do this at all.”
That’s a sentiment echoed by Anne Glover,
chief scientifi c adviser to the European Com-
mission. Europe has a problem translating
research into technological leadership, she
says; the Flagship Initiatives try to address
that. “Is this the right thing to do? I don’t
know. Should we try it? Absolutely!”
–KAI KUPFERSCHMIDT
Graphene and Brain Projects Win European Jackpot
R E S E A R C H F U N D I N G
Thinking big. The winning teams will explore the potential of graphene
and use supercomputers to simulate the human brain.
Published by AAAS
on
Janu
ary
31, 2
013
ww
w.s
cien
cem
ag.o
rgD
ownl
oade
d fr
om

1 FEBRUARY 2013 VOL 339 SCIENCE www.sciencemag.org 498
CR
ED
ITS
(T
OP
TO
BO
TT
OM
): J
OSE
PH
RU
BIN
O P
HO
TO
GR
AP
HY
/BR
OO
KH
AV
EN
NA
TIO
NA
L L
AB
OR
AT
OR
Y; T
EX
AS A
&M
UN
IVE
RSIT
Y
BETHESDA, MARYLAND—This week a com-mittee of nuclear scientists recommended that the cash-strapped Department of Energy (DOE) shut down the last grand U.S. atom-smasher, the Relativistic Heavy Ion Collider (RHIC) at Brookhaven National Laboratory in Upton, New York. The clos-ing would be necessary to free up money for a new nuclear physics facility, says a report to DOE’s Nuclear Science Advisory Committee (NSAC).
But the physicists whose project, the Facility for Rare Isotope Beams (FRIB), came out on top in the committee’s report aren’t gloating. Along with the rest of the nuclear physics community, they fear that any trade-off will lead to a massive contrac-tion of U.S. nuclear physics.
“That’s what is really coming out of this report: There are no really good solu-tions,” says Konrad Gelbke, a physicist at Michigan State University in East Lansing, which would host FRIB. That’s a sentiment stressed by Robert Tribble, a nuclear physi-cist at Texas A&M University, College Sta-tion, who chaired the committee. “We’re all losers if this comes to pass,” he says. “It’s pretty clear we will lose a facility that sup-ports or will support more than a quarter of the nuclear science workforce.”
The problem is that DOE’s $547-million-a-year nuclear physics program is facing the prospect of stagnating budgets at the same time that it is trying to expand its portfolio of activi-ties. In addition to operating RHIC and ready-ing plans for the $615 million FRIB, the offi ce is completing a $310 million upgrade to the Continuous Electron Beam Accelerator Facil-ity (CEBAF) at Thomas Jefferson National
Accelerator Facility in Newport News, Vir-ginia. Anticipating that dire budget scenario last spring, William Brinkman, director of DOE’s Offi ce of Science, asked NSAC to pri-oritize the projects. NSAC enlisted Tribble and 21 other scientists.
The Tribble committee weighed the rela-tive importance of three very different facili-ties. RHIC uses twin accelerators to smash heavy nuclei together to produce fleeting puffs of a weird type of mat-ter called quark-gluon plasma that filled the newborn uni-verse. It studies nuclear mat-ter under the most extreme conditions, which has con-ceptual connections to cos-mology, string theory, and condensed matter physics.
In contrast, CEBAF fi res electrons into protons and neutrons to probe their inner workings, which aren’t com-pletely understood. The pro-posed FRIB would generate and study the structure of myriad exotic nuclei that are usually produced only in supernova explo-sions, addressing such questions as the ori-gins of half the elements heavier than iron.
The committee decided that the CEBAF upgrade should be exploited, Tribble told NSAC. So the choice came down to continu-ing support for RHIC, which has been col-lecting data since 2000 and has an annual operating budget of $160 million, or building FRIB, which could start taking data by the end of the decade. The committee included representatives from all three projects (who
didn’t vote), and Tribble said the other mem-bers were nearly evenly split on the decision. He declined to give a vote tally.
The committee also responded to Brinkman’s additional request to spell out what could be done with “modest increases” to the budget. The panel estimated that DOE could just barely keep running RHIC and CEBAF and build FRIB if its nuclear phys-ics budget were to increase by 1.6% per year above infl ation. “The fi eld sees a very posi-tive scenario at a very modest growth level,” says Jamie Nagle, a member of NSAC and the Tribble committee from the University of Colorado, Boulder. “That’s the take-home message.”
That message might clash with fiscal realities, Brinkman told NSAC by video link. He noted that automatic, across-the-board cuts to all federal programs required under the Budget Control Act of 2011—the so-called sequestration—would slice $300 million from the $4.9 billion Offi ce of Science budget this year if they go into effect in March. Once imposed, he added, the cuts would “set a new baseline for going forward” for all of DOE’s research pro-grams, including nuclear physics. Under such a scenario, many physicists worry
that DOE might not be able to build FRIB even if RHIC were turned off.
For the moment, however, the closure of RHIC is far from a done deal. Although DOE traditionally accepts the advice of its advisory committees on such matters, it is not required to do so. And even if it does, Congress will have the fi nal word. In fact, physicists are banking on legislators from the three states most affected by any trade-off to push for more attractive alternatives.
In a statement released during the meeting, Doon Gibbs, interim director of Brookhaven, said, “I have been in touch with the leadership of each of the other two affected facilities, and we have agreed to work together to realize the modest growth path.” He also added: “We also expect the strong support of the NY State Congres-sional delegation.”
In other words, when impartial scientifi c advice proves unpalatable, look for a politi-cal solution. –ADRIAN CHO
If Budget Woes Continue, Panel Says DOE Should Shut Last U.S. Collider
N U C L E A R P H Y S I C S
Rare bird. The PHENIX detector is fed by the
Relativistic Heavy Ion Collider.
Lament. Panel chair Robert
Tribble says closing RHIC would
be a disaster.
Published by AAAS
on
Janu
ary
31, 2
013
ww
w.s
cien
cem
ag.o
rgD
ownl
oade
d fr
om

www.sciencemag.org SCIENCE VOL 339 1 FEBRUARY 2013 499
CR
ED
IT: A
P P
HO
TO
/YV
ES L
OG
GH
ENEWS&ANALYSIS
When a massive brain injury leaves a per-
son unresponsive, physicians rely on out-
ward signs of recovery, like reaching for a
cup or saying an occasional word, to deter-
mine whether the patient is likely to regain
awareness. In recent years, however, stud-
ies of patients diagnosed as “vegetative”
have revealed that roughly 40% are actually
aware to some extent, spurring efforts to
develop clinical tools to detect hidden signs
of consciousness.
In 2011, a much-publicized study in The
Lancet suggested a way forward. Scientists
at what is now the Brain and
Mind Institute of Western Uni-
versity in London, Canada, as
well as the University of Cam-
bridge in the United Kingdom
and the University of Liege in
Belgium, reported that they
had detected awareness in
three vegetative patients using
electroencephalograph (EEG)
machines to measure electri-
cal activity in the brain. But
now, a team of scientists from
the Weill Cornell Medical
College in New York City has
published a withering critique
of that work.
After reanalyzing the other
group’s data, the research-
ers report in the 26 January
issue of The Lancet that what
their colleagues interpreted
as conscious behavior was actually random
noise, and that hopes for a reliable new bed-
side EEG method of measuring awareness
were premature. The Western University–led
group is standing by its results, however. The
disagreement hinges on different approaches
to the statistical challenge of interpreting
messy electrical signals from severely disor-
dered brains.
In the 2011 study, the Canadian research-
ers and their collaborators, led by postdoctoral
student Damian Cruse and neuroscientist
Adrian Owen, used EEG machines to mea-
sure electrical activity in the brains of 16
vegetative patients and 12 healthy controls.
The participants were asked to imagine
clenching their right fi st or moving their feet
each time they heard a beep. The authors fed
those recordings into a sophisticated statis-
tical model that detects patterns in data and
learns over time. Based on the output of that
model, the authors claimed that three of the
16 vegetative patients and nine of the 12 con-
trols had followed the commands—the fi rst
time a simple and affordable method had
been shown to be successful in detecting
awareness in unresponsive patients.
Nicholas Schiff, who heads the Weill
Cornell lab, says his group had concerns
about the validity of the data long before
the paper was published. Schiff says the
high rate of positive results among the
vegetative subjects “didn’t make a lot of
sense” given that only 75% healthy con-
trols were successful.
Both research teams are part of a con-
sortium funded by the James S. McDonnell
Foundation and charged with generating
different methods for detecting conscious-
ness and validating each other’s results. The
consortium’s work began 5 years ago after
Owen published a series of papers showing
that it was possible to use functional mag-
netic resonance imaging (fMRI) to com-
municate with people thought to be in a
vegetative state.
An fMRI can detect changes with far
more precision than an EEG, says Andrew
Goldfi ne, lead author on the critique. fMRI
measures blood fl ow, so “you know exactly
what part of the brain is producing the sig-
nal,” Goldfine says. In contrast, he says,
EEGs involve a vast number of variables,
including the individual metal cups distrib-
uted across the skull, the wide range of fre-
quencies produced through brain activity,
and even minor movements of the scalp.
These potentially confounding factors
mean that researchers need to be extremely
careful in how they design their statistical
analyses, Goldfi ne says. Cruse and his col-
leagues overlooked a number of important
factors such as muscle twitches that can con-
tribute to false positive results, he says. When
Goldfi ne and colleagues reanalyzed the EEG
data, taking such factors into account, all
signs of consciousness in the three partici-
pants disappeared, he says.
Cruse maintains that because Goldfi ne did
not follow the same approach it is “not at all
surprising” that they came up with different
results. Cruse adds that Goldfi ne’s approach
is less sensitive than theirs. “EEG remains a
viable bedside method for detecting covert
awareness in the vegetative
state,” he says. “What this
exchange amounts to is a
series of minor scientifi c quib-
bles about how that might best
be demonstrated.”
One way for researchers
to navigate the “morass” of
EEG data is to keep things
simple, says Emery Brown,
an anesthesiologist and com-
putational neuroscientist at
the Massachusetts Institute
of Technology in Cambridge
who was not involved in either
study. Rather than including a
vast range of variables in their
study, he says, Cruse and his
colleagues could have focused
on a smaller number of vari-
ables to minimize the possi-
bility of fi nding patterns that
just aren’t there. Similar problems arise when
sifting through massive amounts of genomic
data looking for correlations, he says. “Sci-
entifi cally, you should avoid hunting expedi-
tions like that.”
The consortium is set to meet in New
York next month to begin the second phase
of their grant—a period when all research-
ers adhere to the same methodology and
build a shared database. Although it’s not
yet clear what methods they’ll agree upon,
Cruse’s team recently published a second
study in PLOS ONE that they say addresses
many of the other team’s concerns while
confirming their original results. That’s a
positive sign of rigorous scientifi c debate,
says Joseph Fins, professor of medicine
at Weill Cornell Medical College and a
co-author of the critique. “These tests have
huge consequences,” he says. “We have to
get this right.”
–EMILY UNDERWOOD
Brain Studies Stymied by Statistics
N E U R O S C I E N C E
Tuning in. A vegetative patient scanned for signs of consciousness with EEG.
Published by AAAS
on
Janu
ary
31, 2
013
ww
w.s
cien
cem
ag.o
rgD
ownl
oade
d fr
om

1 FEBRUARY 2013 VOL 339 SCIENCE www.sciencemag.org 500
NEWS&ANALYSIS
CR
ED
ITS
: (S
OU
RC
ES
) N
AS
A A
ND
EU
RO
-AR
GO
Chlorofl uorocarbons (CFCs) seemed like a
wonder of modern chemistry: inert, nontoxic
chemicals that could do it all, from cooling
your fridge to spritzing your hair. But to the
surprise of chemists, the gases seeped into the
stratosphere and destroyed the ozone there
to create the Antarctic ozone hole. And the
hole, in turn, stunned meteorologists when it
reached down to boost the ring of wind encir-
cling the icy continent.
Now it’s the oceanographers’ turn to
scratch their heads. In an ironic twist, they
have used the same CFCs that created the
ozone hole to track its effects on the ocean.
The stronger winds induced by the hole’s for-
mation, they’ve shown, are stirring the South-
ern Ocean surrounding Antarctica harder than
ever. The added churning may already be
slowing the ocean’s storage of greenhouse
gases from fossil fuels. The lesson is that
humans are not farsighted enough to be
fooling with Mother Nature.
It’s a winding path from hair
spray to the deep sea. The fi rst twist
came in the 1970s, when atmo-
spheric chemists realized that ultra-
violet light could tear CFCs apart
in the stratosphere and that the bits
of chlorine would go on to destroy
the stratospheric ozone that works to
keep the same ultraviolet from reach-
ing the surface. The next surprise
came in the 1980s, when researchers
monitoring stratospheric ozone via sat-
ellite realized that the blotch of low-ozone
readings appearing over Antarctica every aus-
tral spring was no data glitch, but a hole in the
stratospheric ozone layer. Much to everyone’s
surprise, the icy cloud particles found in the
Antarctic stratosphere greatly accelerate chlo-
rine’s destruction of ozone.
In the 1980s, meteorologists did not expect
things to go much further. After all, the tro-
posphere beneath the stratosphere, where
weather happens, constitutes a full 80% of
the atmosphere’s total mass. Changes in the
stratosphere affecting the troposphere beneath
would be like the tail wagging the dog. But,
it turned out, around Antarctica, the tail gets
its way. The near disappearance each spring of
ultraviolet-absorbing ozone chilled a disk of
stratosphere over Antarctica. That change in
the pattern of stratosphere temperature man-
aged to reach down into the troposphere and
accelerate the ring of wind—the westerlies—
that encircles Antarctica. It also shifted the
westerlies slightly poleward.
That downward link in the chain worked in
climate models. Now, atmospheric scientists
Sukyoung Lee and Steven Feldstein of Pennsyl-
vania State University, University Park, report
on page 563 that the real atmosphere responds
in the same way and even gets some help from
greenhouse gases. Using a statistical technique
called self-organized maps, they identified
four repeating wind patterns in the wintertime
troposphere around Antarctica and tracked
their changing frequency from 1979 to 2008.
Two of the patterns resemble those seen in
climate models simulating strengthening west-
erly winds. One pattern, which Lee and Feld-
stein attribute to the springtime ozone hole,
accounts for almost two-thirds of the change
in the westerlies. The researchers link the sec-
ond pattern to the tropics, where greenhouse
warming has pumped up the churning of the
atmosphere. That enhanced convection can
boost a poleward circulation that could, in turn,
increase the westerlies. The added tropical
driver could account for almost one-third of
the strengthening of the westerlies, they report.
Oceanographers knew such stronger west-
erlies were sure to affect the ocean beneath.
The question was how. In a second paper, on
page 568, fluid dynamicist Darryn Waugh
of Johns Hopkins University and colleagues
answer that question by putting CFCs to work.
Peaking in the lower atmosphere at more than
500 parts per trillion in the early 2000s, CFCs
not only seeped into the stratosphere but also
dissolved in the surface waters of the world
ocean. From there, they have ridden the water
wherever it was going.
Waugh and his colleagues found that—
rather than merely further stirring up eddies
in the Southern Ocean, as some oceanogra-
phers had thought—the intensified wester-
lies have accelerated ocean overturning there.
The group analyzed measurements of CFC-
12 in seawater made in the early 1990s and
compared them with measurements made
in the mid- to late 2000s. They also com-
pared observed CFC concentrations with
two ocean models that stimulated CFC
movement assuming no change in cur-
rents. They found that the strength-
ened westerlies had accelerated an
existing wind-driven circulation in
which the wind draws water to the
surface from deep down beneath
the southern edge of the band of
westerlies and draws it northward
across the northern edge, where it
sinks down a kilometer or more in
the subtropics.
The CFC tracer work “makes
a pretty strong case” for an acceler-
ated overturning, says oceanographer J.
Robert Toggweiler of the National Oceanic
and Atmospheric Administration’s Geophysi-
cal Fluid Dynamics Laboratory in Prince-
ton, New Jersey. “This is a very big topic in
world climate change and even paleoclimate,”
he says. Faster overturning is probably slow-
ing the ocean’s uptake of carbon dioxide and
therefore stoking greenhouse warming. And
changes in high-latitude overturning may have
been a key to changing atmospheric carbon
dioxide levels in the geologic past and drag-
ging the world out of ice ages or sending it
back into them.
What the future holds depends on future
human actions. Under the international Mon-
treal Protocol, atmospheric CFCs are declining
so that the ozone hole should heal by around
mid-century. By Lee and Feldstein’s calcula-
tion, that will eliminate the hole’s effect on the
westerlies, leaving a strengthening greenhouse
in control. That’s assuming humans do nothing
about rising greenhouse gases.
–RICHARD A. KERR
The Psst That Pierced the Sky Is Now Churning the Sea
G LO B A L C H A N G E
Ring around the hole. Manmade CFCs create the
ozone hole each spring. It in turn accelerates the
westerlies, a ring of wind driving the underlying Ant-
arctic Circumpolar Current. The strengthened west-
erlies also accelerate deep water northward.
hole s for-
he South-
arder than
ready be
house
that
be
r
-
se
ers
sat-
-ozone
very aus-
ole in the
veryone’s
nd in the
The group
12 in seaw
compared
in the mid
pared o
two o
mov
ren
en
e
w
t
w
a
s
th
a pr
ated o
Robert T
and Atmos
cal Fluid
ton, New J
world clim
AUSTRALIA
South Pole
NEW ZEALAND
SOUTH AMERICA
ANTARCTICA
AN
TARCTIC CIRCUMPOLAR CU
RRE
NT
OZONE HOLE
AFRICA
Published by AAAS
on
Janu
ary
31, 2
013
ww
w.s
cien
cem
ag.o
rgD
ownl
oade
d fr
om
www.sciencemag.org SCIENCE VOL 339 1 FEBRUARY 2013 501
NEWS&ANALYSISC
RE
DIT
: C
HIM
P H
AV
EN
/AM
Y F
ULT
Z
Last week, a top-level panel of advisers urged the National Institutes of Health (NIH) to phase out most medical research on chimpanzees in the United States, bringing what many researchers think is the inevitable end to a long and emotional debate. Specifi cally, the panel’s report said NIH should retire most of the 360 research chimps it owns, end half of 22 research proj-ects, and make sure chimps still being stud-ied are kept in suitable living conditions.
Although the panel left room for behav-ioral and genomics research—many studies could continue under proper conditions—it all but ruled out invasive medical research. “Clearly there is going to be a reduction in the use of chimpanzees in research,” said veterinary researcher Kent Lloyd of the University of California (UC), Davis, who co-chaired the NIH advisory panel. “I don’t believe that that will be at the cost of research advances.”
The working group’s 84-page report is a response to a December 2011 Institute of Medicine (IOM) study requested by NIH that found most research on chimps was “unnecessary” (Science, 16 December 2011, p. 1484). NIH Director Francis Collins asked the working group, part of the NIH Council of Councils, to help NIH implement the IOM report, which laid out criteria for when chimp studies are justifi ed. Such a study should take place only if it is needed to advance public health, could not be done ethically in humans or in another animal model, and if the chimps are housed in an ethologically appropriate environment or natural habitat.
After applying the IOM criteria to 22 NIH-funded research studies using chimps, the working group found that half should be phased out. That includes six of nine bio-medical projects; only three projects using 12 chimps should continue. The working group also recommended continuing eight of 13 comparative genomics and behavioral studies; these involve 290 animals.
Most of the approved projects could con-tinue only if they are modifi ed to meet new standards for living conditions. For example, each chimp should have at least 1000 square feet of outdoor space, live with no fewer than six other chimps, and have room to climb.
The working group did not reveal the list of 30 projects it reviewed because of confi denti-ality, said neurologist and working group co-
chair Daniel Geschwind of UC Los Angeles. However, the report said the three approved biomedical projects involve research on immunology and infectious agents such as hepatitis. Some researchers have been worried that studies of hepatitis C vaccines, in particu-lar, would be ruled out, arguing that the chimp is the only good model for testing. (The IOM panel did not reach consensus on whether chimps are needed for these studies.)
Any newly proposed projects that pass scientifi c review will then go before a yet-to-be-created, independent NIH oversight committee that would evaluate whether the
project complies with the IOM principles. The bar will be high for medical studies, but much behavioral and genomics research would “sail right through,” Geschwind sug-gested. (For now, NIH will continue a mora-torium on new chimp studies that it imposed when the IOM report came out.)
The working group also examined the number of chimps NIH owns or supports. This includes 451 chimps at research or research reserve facilities and 219 in retire-ment. It said that NIH should “immediately” begin planning to retire the 360 research chimps it owns to a federal sanctuary and reduce its research supply to a single colony of just 50 chimps. NIH would reassess the adequacy of this colony every 5 years but could lift its moratorium on breeding only after consulting with other agencies. Behav-ioral and genetics studies requiring more
than the 50 animals could potentially be done in nontraditional settings such as sanc-tuaries or zoos, the report says.
Kathleen Conlee, vice president of animal research issues for the Humane Society of the United States, which has pushed to end chimp research, praised the report. “We’re very pleased … and we hope that NIH will move forward to implement the recommendations. I think they largely refl ect what the public has been asking for,” she said.
But John VandeBerg, director of the Southwest National Primate Research Cen-ter in San Antonio, Texas, forwarded a state-ment to the press saying that his institution “respectfully disagrees with the Working Group’s recommendations that severely limit the future use of chimpanzees in biomedical research and that will slow urgently needed medical advances.”
After a 60-day comment period on the report, Collins will decide whether to accept it, probably by late March. But NIH has already begun to downsize its chimp col-lection: In December, it agreed to transfer 113 chimps from New Iberia Research Cen-ter in Louisiana to Chimp Haven in Keith-ville, Louisiana, which runs the federal chimp sanctuary.
One question is who will pay the costs of chimp retirement. In 2000, Congress capped how much the agency can spend on construction and care at federal chimp sanc-tuaries at $30 million, and Chimp Haven will reach that limit this summer. James Anderson, an NIH deputy director, said, “It is a concern for us and it’s something that we would have to have addressed at the congressional level.”
–JOCELYN KAISER
Advisers Urge NIH to Scale Back Chimpanzee Research
A N I M A L M O D E L S
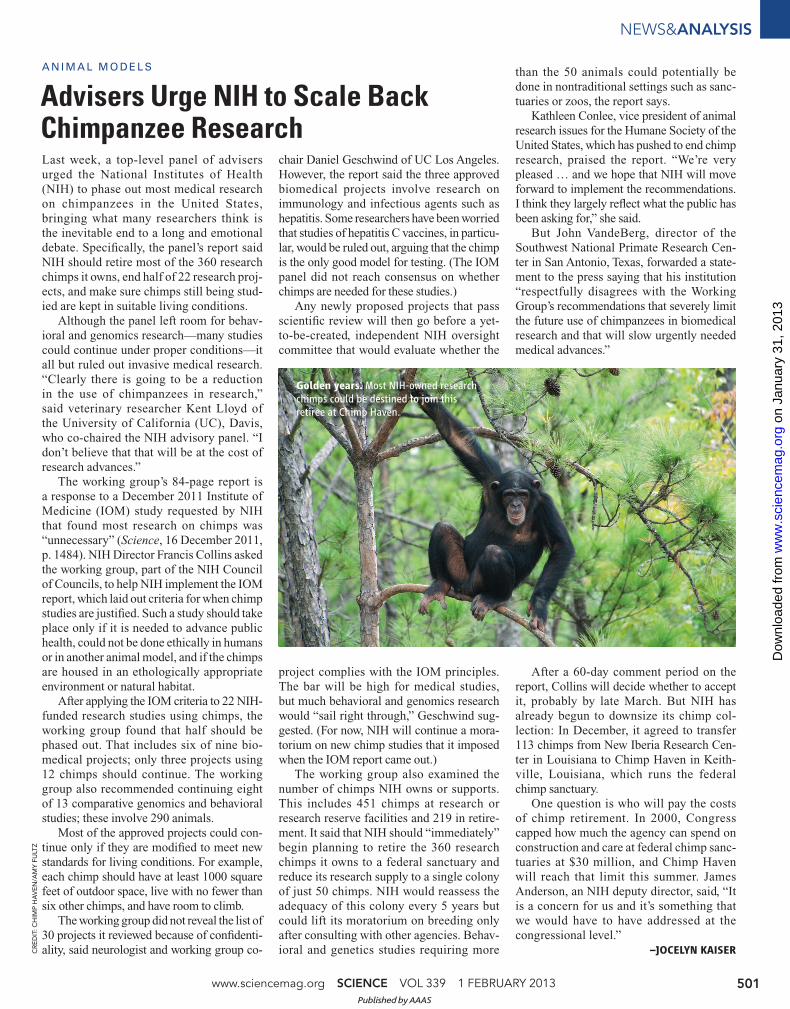
Golden years. Most NIH-owned research
chimps could be destined to join this
retiree at Chimp Haven.
Published by AAAS
on
Janu
ary
31, 2
013
ww
w.s
cien
cem
ag.o
rgD
ownl
oade
d fr
om

1 FEBRUARY 2013 VOL 339 SCIENCE www.sciencemag.org 502
CR
ED
IT: K
. K
UP
FE
RS
CH
MID
T/S
CIE
NC
E
RIO DE JANEIRO, BRAZIL—Miriam Tendler
has not moved her lab in more than 20 years.
Her offi ce is cramped and fi lled with stacks
of paper, and the hallways are lined with
big fi ling cabinets. Yet Tendler has stayed
in this old, low building on the campus of
the Oswaldo Cruz Foundation, she explains,
because she is afraid of doing anything that
could disturb the life cycle of the micro-
scopic worm that she has carefully nur-
tured in her lab all these years. Tendler has
devoted her career to developing a vaccine
against this worm, a pernicious parasite
that is a scourge of people in eastern Brazil:
Schistosoma mansoni.
Her target is one of at least six fl atworms
that cause a debilitating human disease
called schistosomiasis. The worms can live
for decades in blood vessels, shedding eggs
that cause pain, severe blood loss, and mal-
nutrition and that can damage the liver, kid-
neys, and spleen. Half of their unusual life
cycle takes place in freshwater snails, which
is why one room in Tendler’s lab houses doz-
ens of aquariums.
According to the World Health Organi-
zation (WHO), schistosomiasis, also known
as bilharzia, is the second most devastating
parasitic disease in the world, after malaria.
Some 200 million people are estimated to be
infected, most of them children, and another
600 million are at risk. Mortality estimates
vary widely, but Lester Chitsulo, who heads
WHO’s Schistosomiasis Control Programme
in Geneva, Switzerland, says that there are
probably almost 300,000 deaths a year in
sub-Saharan Africa alone.
Vaccines could be powerful weapons
against schistosomiasis, but a lack of inter-
est and money, combined with the fact that
a cheap, effective drug is available, has ham-
pered research. “We have limped along with
small amounts of money,” says Alex Loukas
of James Cook University, Cairns, in Aus-
tralia. That could change if, as researchers
hope, the Bill & Melinda Gates Foundation
joins the fi ght. Next month, the foundation
will bring experts to Seattle for a 2-day meet-
ing to discuss schistosomiasis vaccines. If
it decides to fund the research, everything
could change, Loukas says.
There has been some progress; two vac-
cines are now in clinical trials. But there are
questions about both. Bilhvax, developed
at the Pasteur Institute in Lille, France, tar-
gets S. haematobium, a species that causes
urogenital schistosomiasis and is common
in Africa and the Middle East. But despite
extensive trials, very little has been pub-
lished so far, leading other scientists to won-
der what’s going on.
The other is Tendler’s candidate against
S. mansoni, backed by the Brazilian govern-
ment through a public-private partnership.
The vaccine, the only one from a country
where Schistosoma is endemic, may enter
phase II trials this year. (It’s based on a pro-
tein called Sm14, which a worm uses to ferry
a host’s fatty acids into its own cells.) But
some groups have been unable to replicate
the high level of protection that Tendler has
shown in mouse studies.
What’s more, vaccines are needed for
other Schistosoma species as well, as there
is no one-size-fi ts-all vaccine. “We need to
develop a pipeline,” says Peter Hotez, dean
of Baylor College of Medicine’s National
School of Tropical Medicine in Houston,
Texas. Hotez is working on a vaccine candi-
date named Sm-TSP-2 that has yet to reach
the clinic; another candidate, Sm-p80, is also
being developed in the United States.
Into the groove
Different Schistosoma species cause differ-
ent patterns of symptoms, but the parasites
essentially follow the same lifecycle. They
reproduce in freshwater snails that release
large numbers of free-swimming larvae,
called cercariae, into the water. When these
fi nd a human, for instance a child playing
in the water, they burrow through that per-
son’s skin with their head. The larvae then
lose their tail and migrate through the blood
vessels and the lung into the liver, where
they mature into adult worms and mate. The
larger male worm forms a groove, which the
thinner female slips into.
Together, the couple moves into veins
The long struggle to develop a
schistosomiasis vaccine badly
needs new money
A Worm Vaccine, Coming at A Snail’s Pace
NEWSFOCUS
Published by AAAS
on
Janu
ary
31, 2
013
ww
w.s
cien
cem
ag.o
rgD
ownl
oade
d fr
om

www.sciencemag.org SCIENCE VOL 339 1 FEBRUARY 2013 503
NEWSFOCUS
in different parts of the body, depending on
the species: S. mansoni and S. japonicum
reside in the bowel and rectum, for instance,
whereas S. haematobium migrates to the
bladder. The females start producing hun-
dreds of eggs daily, sometimes for many
years. Most of them are shed in urine and
feces, and they can infect new snails if
they end up in lakes or rivers. But some get
trapped in the liver or other organs, causing
an immune response that leads to the typical
symptoms and sometimes death.
Public health offi cials tried for decades
to get rid of schistosomiasis by targeting
the snails. Despite sporadic successes, that
strategy has proved too daunting in rivers
like the Nile and the big lakes in
Africa. Since the 1980s, a drug
called praziquantel, which kills the
worms in a person’s body, has been
the weapon of choice. In many
endemic areas, all schoolchildren
get the drug annually; Merck has
provided praziquantel to WHO
for free since 2007 and recently
pledged to increase its annual
donation to 250 million tablets.
But scientists worry that such
widespread use will fuel resis-
tance against praziquantel, the only
drug available. Moreover, people
in endemic areas usually get rein-
fected within months of treatment,
so there is little long-term progress.
“I think people are fi nally realizing
that drugs alone are unlikely to con-
trol schistosomiasis,” Loukas says.
Vaccines would probably not
prevent human infections, but they
could reduce the number of eggs
that female worms produce, which
in turn would reduce symptoms
and slow transmission, says Maria
Yazdanbakhsh of Leiden Univer-
sity Medical Center in the Nether-
lands, who heads a European project to fi nd
a vaccine against S. mansoni. “If the worms
produce fewer eggs, the water will be less
infested, and that will slowly reduce trans-
mission.” Studies suggest this is possible.
Adults in endemic areas have been found to
be partially immune to reinfection, and in
animals, vaccines were shown to reduce the
number of eggs by about half.
Hotez thinks support for a vaccine is now
growing, in part because of schistosomiasis’s
role in the HIV epidemic: Female genital
schistosomiasis increases the risk of con-
tracting HIV three- or fourfold. If the Gates
Foundation steps in, it would raise the dis-
ease’s profi le, Yazdanbakhsh says, and that
could encourage national governments to
donate as well. So far, the foundation has
made no commitment, and it would not com-
ment to Science.
Painful rashes
Even if more money becomes available,
there are obstacles to a successful vaccine.
One of them emerged in 2007 during a trial
of a vaccine against a different group of par-
asites called hookworms. Healthy U.S. vol-
unteers tolerated the shots well, but a study
conducted in an area of Brazil where hook-
worm infection is common had to be sus-
pended when three of the fi rst seven volun-
teers developed painful rashes on their head,
neck, and shoulders. The rash was caused by
a class of antibodies called IgE, which the
volunteers had developed during prior hook-
worm infections, says Loukas, who was
involved in the trial.
To prevent such nasty surprises with
Schistosoma, Loukas says, any new vac-
cine candidate needs to be screened to see
whether people in endemic areas might
have IgE in their blood that reacts with it.
“If they do, we immediately throw the can-
didate out,” he says. For some of the can-
didates already in development—including
the two in clinical trials—such data have yet
to be presented.
Another difficulty is that the results
of several promising studies in mice—
including Tendler’s Sm14 vaccine—have not
been replicated by researchers in other labs,
for reasons that aren’t clear. “This is a prob-
lem that has plagued the schistosomiasis
fi eld for many years and it has done the fi eld
an enormous amount of harm,” Loukas says.
How well results in mice translate to humans
is also unclear. Although S. mansoni infects
mice readily, the rodent is not a natural
host; in terms of sheer size, one pair of
worms in a mouse is equivalent to a very
heavy infection in humans. Some research-
ers have switched to other animal models,
such as baboons, which require special facil-
ities and are more expensive.
The French vaccine, mean-
while, is a bit of a dark horse. A
phase I trial, done in 1998 and
1999 in France, was not published
until July 2012; phase II and phase
III studies, both completed, have
yet to appear. The team’s origi-
nal strategy was to go through all
the phases before publishing any-
thing, Gilles Riveau of the Pasteur
Institute writes in an e-mail to
Science. “I think today that we
were wrong,” he adds, saying that
results on phase II may be out soon.
Others are betting on new tar-
gets, and the genomes of S. man-
soni and S. haematobium, both
now sequenced, have given them
a wealth of choices. Yazdanbakhsh
and colleagues are aiming at the
earliest form of the worm that the
immune system encounters: the
larvae passing through the skin.
Scientists in the consortium have
identified genes that are turned
on only in this stage; by targeting
these proteins, they hope to catch
the worm before it has its defenses
up. Such a vaccine, they hope,
might prevent infection altogether.
Loukas’s group, meanwhile, has devel-
oped an array of Schistosoma’s surface pro-
teins, which they have screened against the
blood of resistant individuals to see which
antigens are recognized by their immune
system. A new vaccine candidate will be
published soon, he says.
With so much new technology available,
developing a vaccine is now primarily a ques-
tion of political will, Tendler argues. “This is
not a bet, this is not a game, this is not magic.
It is just work.” –KAI KUPFERSCHMIDT
Eyes on the target. Miriam Tendler’s vaccine candi-
date is based on Sm14, a crucial Schistosoma protein.
Larvae mature inthe liver
Larvae migrate firstto the lungs throughvenous circulation
Worms matureand pair off
Worms migrate to vesselsof bowel or bladder,
depending on the species
Eggs excreted infeces or urine
Eggs retainedin tissue
Eggs
Larvae hatch and penetrate intermediate host (snail)
Parasite producescercariae(another
larval form), which are
released intothe water
Cercariaepenetrate
skin
Chronic
schistosomiasis
Fresh
water
Circle of life. Schistosoma’s life cycle takes it from freshwater snails to
human blood vessels and back.
Published by AAAS
on
Janu
ary
31, 2
013
ww
w.s
cien
cem
ag.o
rgD
ownl
oade
d fr
om

1 FEBRUARY 2013 VOL 339 SCIENCE www.sciencemag.org 504
NEWSFOCUS
On the face of it, the European Space
Agency’s (ESA’s) Earth-observation program
came out of last November’s budget-setting
council meeting pretty well: With €1.9 bil-
lion over the next 5 years (20% of ESA’s total
budget), it is the agency’s biggest program.
But to make room in the budget for new
launchers and the International Space Sta-
tion, member states have put the squeeze on
Earth-observing science missions (Science,
30 November 2012, p. 1135). And, with the
funding of the European Union still in doubt,
questions hang over the future of a ground-
breaking environmental monitoring system,
an ESA-E.U. collaboration called Global
Monitoring for Environment and Security
(GMES, recently renamed Copernicus by the
European Union). “This is far too important
for Europe not to get its act together,” says
Alan O’Neill, director of the United King-
dom’s National Centre for Earth Observation.
GMES is an unprecedented attempt to
create an operational environmental moni-
toring system akin to the meteorological
systems that have been in place for decades.
GMES involves a whole fl eet of spacecraft
with different sensors—built and paid for
by ESA—along with duplicate backup craft
and operations and user facilities provided
by the European Union. The aim is to pro-
vide steady, reliable data of use to European
governments, industry, emergency services,
and citizens. “There is no program like
GMES. It’s an Earth management system,”
O’Neill says.
European researchers got a taste for long-
term, high quality data from Envisat, ESA’s
bus-sized satellite that operated for 10 years
until ended by an unidentifi ed failure in April
2012. The idea of GMES “emerged out of
the Envisat decade. People could see what
you can do with long-term data,” says John
Remedios, head of Earth observation science
at the University of Leicester in the United
Kingdom. Envisat carried nine instruments
that gathered data about land, water, ice, and
the atmosphere. Most will be replicated or
upgraded in GMES.
ESA is close to completing the fi rst three
GMES spacecraft, known as Sentinels,
which are due to launch this year. But the
European Union’s funding beyond the end
of this year is not yet secure as the Euro-
pean Commission (the European Union’s
executive arm), the 27 member states,
and the European Parliament debate the
union’s budget for the next 7 years (Science,
16 November 2012, p. 872).
The next round of the E.U. budget nego-
tiations will take place on 7 to 8 February.
Because of the faltering economies across
Europe, the commission is under enormous
pressure to curb its ambitions; some states
even want to cut E.U. funding below current
levels. In 2011, the commission proposed
€5.8 billion for GMES over 7 years. The
member states countered with a suggestion
of €3.8 billion, a fi gure that alarmed ESA,
researchers, and other potential users.
At that level of funding, “there will be
cuts,” says ESA’s head of Earth observa-
tion, Volker Liebig. “If they can’t fi nance the
recurrent [duplicate] satellites, there is a dan-
ger that we might have data gaps,” he says.
If the European Union has not confi rmed the
budget for the operations infrastructure by
the time of the Sentinel-1 launch in August,
Liebig says, the ESA member states could
decide it is too risky to launch the satellite.
“We have delivered; I hope the commission
can also deliver,” Liebig says.
Because of the continuing uncertainty over
the E.U. contribution to GMES, at the ESA
council meeting in November some ESA
member states were reluctant to commit the
full amount for the next round of GMES sat-
ellite building. ESA secured only 80% of the
required funds at the meeting.
Much of ESA’s Earth observation budget
goes toward meteorological satellites. But
another area also came up short on funding:
a series of science missions known as Earth
Explorers, which seek to observe Earth and
its atmosphere in new ways using innova-
tive technology. Three have been launched
so far—looking at soil moisture and ocean
salinity, ice cover, and ocean circulation—
and another three are under construction. A
further three proposals are vying to start con-
struction as Earth Explorer 7. A choice will be
made sometime in the next few months.
The future of Earth Explorer 8, however,
looks less certain after November’s council
meeting awarded the program only 80% of
its expected €1.25 billion budget. “A vari-
ety of solutions are now being considered,”
says O’Neill, who is the chair of ESA’s Earth
Science Advisory Committee. Heinrich
Bovensmann of the University of Bremen
in Germany, who heads one of the teams
competing to build Earth Explorer 8, says
he expects ESA to adopt “the classical way
space agencies deal with budget problems:
delay things.”
If selected, Bovensmann’s CarbonSat
will use absorption spectroscopy to image
sources of carbon dioxide and methane—the
main greenhouse gases—in high resolution.
“It’s the fi rst time we’ll be able to make a dis-
tinction between natural and anthropogenic
sources,” he says. The other contender for
the mission, the Fluorescence Explorer or
FLEX, aims to measure the carbon balance
of plant life by detecting chlorophyll fl uores-
cence, a sensitive marker for photosynthetic
efficiency. “The signal is very small, and
this is the fi rst time it will be measured from
space,” says José Moreno of the University
of Valencia in Spain.
There is now no guarantee that either
mission will get off the ground any time
soon. Moreno says: “The situation is rather
diffi cult at the moment, and no one knows
how well it will evolve in the future.”
–DANIEL CLERY
Tight Budgets Squeeze European Earth ObservationThe Europe-wide fi nancial crisis and uncertainty over the European Union’s future funding are casting shadows over Earth monitoring and science missions
S PAC E
Sentinel-3. Monitoring
topography, temperature,
and color of land
and sea.
CR
ED
IT: E
SA
/J. H
UA
RT
20
08
Published by AAAS
on
Janu
ary
31, 2
013
ww
w.s
cien
cem
ag.o
rgD
ownl
oade
d fr
om

www.sciencemag.org SCIENCE VOL 339 1 FEBRUARY 2013 505
NEWSFOCUS
SHENZHEN, CHINA—In most Chinese hos-pitals, teeming waiting rooms and forlorn patients wheeling intravenous drips through dingy, ill-lit halls are troubling but typical sights. University of Hong Kong (HKU)-Shenzhen Hospital, however, is anything but typical. Its gleaming wards and labs, opened to outpatients last July, are at the vanguard of China’s health care reforms.
The hospital here in Shenzhen, the cru-cible of China’s economic rebirth, is the brainchild of China’s health ministry, which convinced the local government to put up $56.2 million for the 350,000-square-meter complex across the border from Hong Kong. HKU’s stewardship is meant to sepa-rate the venture from the rest of the pack for more than its looks. “They don’t need us to teach them how to stitch up wounds,” says Sum-ping Lee, dean of HKU’s medi-cal school. The health ministry envisions the institution as “an important model in the process of reforming public hospitals,” says a spokesperson. One prong of that strategy is to boost medical research: HKU profes-sors will apply their expertise to a planned research arm of the hospital that will focus
on oncology, orthopedics, liver disease, and infectious diseases.
HKU-Shenzhen Hospital is part of a Chi-nese spending spree on health care, with total outlays predicted to triple from $357 billion in 2011 to $1 trillion in 2020, when the gov-ernment hopes to have implemented univer-sal coverage. (Only 15% of the population was insured in 2000, according to the health ministry.) The investment is largely directed at improving basic health care. In 2000, the World Health Organi-zation (WHO) ranked China 144th out of 191 national health systems. Although some scholars dispute WHO’s methodology, which is no longer used, few deny that China’s health care sys-tem is ailing. Gaps in hospital capacity and quality of care have fueled rising discontent, culminating in a recent spate of murders of doctors and nurses. According to China
Daily, Chinese hospitals reported more than 17,000 violent incidents in 2010—mostly involving disgruntled patients.
A white paper released by Chi-na’s State Council last Decem-ber outlines the basic tenets of the reforms, which include expanding insurance coverage, reconfi guring drug pricing, and promoting primary care. The reform drive also includes money for research into traditional Chi-nese medicines and an overhaul of the drug pricing system—a move that could affect pharma-ceutical research. The health ministry, meanwhile, is push-ing the training of more medical professionals, updating China’s mental health infrastructure (see sidebar, p. 506), and backing the development of hospitals like HKU-Shenzhen.
Health care in China today bears little resemblance to the system in place during its social-ist heyday. In the 1970s, agricul-
tural communes featured rural health care centers staffed by about 1.8 million “barefoot doctors”: health workers with basic training who provided primary care. Among them was Chen Zhu, China’s current health minis-ter. As the Chinese government began insti-tuting market reforms in the 1980s, it pulled funding from hospitals and clinics. The bare-foot doctor system disintegrated. By the 1990s, the government was contributing less than 20% of total health care costs—the low end of developing countries, says Gordon Liu, an economist at Peking University in Beijing who served on a health care reform taskforce under China’s State Council.
To recoup lost funds, hospitals charged a 15% markup on prescription drugs. Doc-tors began prescribing antibiotics indiscrim-inately, sparking an uptick in drug-resistant bacterial strains (Science, 18 May 2012, p. 795). As China’s health infrastructure
frayed, diseases like syphilis, once on the ropes, reemerged with a vengeance (Science, 27 January 2012, p. 390). Then came the debili-tating SARS outbreak in late 2002: “It was a
wake-up call for the Chinese government,” says Yanzhong Huang, a global health fel-low at the Council on Foreign Relations in New York City.
A more enduring problem is that eco-nomic development and an aging population have driven a shift in the disease burden from infectious to chronic diseases, which today
World’s Biggest Health Care System Goes Under the KnifeAmbitious reforms of the Chinese medical system aim to expand infrastructure, cover
the poor, and combat chronic diseases
C H I N A
“ Families are suffering from
a huge economic burden.”—YAO HONG,
MINISTRY OF HUMAN RESOURCES
AND SOCIAL SECURITY
Hard to bear. High out-of-pocket
costs have plunged many Chinese,
including the family of this badly
burned boy in Hefei, deep into debt.
CR
ED
IT: S
TR
/AF
P/G
ET
TY
IM
AG
ES
Published by AAAS
on
Janu
ary
31, 2
013
ww
w.s
cien
cem
ag.o
rgD
ownl
oade
d fr
om

1 FEBRUARY 2013 VOL 339 SCIENCE www.sciencemag.org 506
CR
ED
IT: M
. H
VIS
TE
ND
AH
L
account for roughly 85% of deaths in China,
up from 53% in the 1970s. “That pushed the
demand for health care a lot,” Liu says. As
the transition took hold, the health care sys-
tem remained woefully unprepared to handle
the surge of patients, with too few doctors
and medical facilities. Inadequate insur-
ance, meanwhile, meant that many Chinese
could not afford care in catastrophic cases.
“Families are suffering
from a huge economic
burden,” said Yao Hong,
director of the Ministry
of Human Resources and
Social Security’s health
insurance department, at
a conference in Beijing
in July.
To address these
issues, in 2009 China
unveiled a blueprint for
providing basic insur-
ance for 90% of Chinese
by 2011, implement-
ing more standardized
training for doctors,
constructing thousands
of new county hospi-
tals, and putting a clinic
in every village. The
plan also emphasized
chronic diseases, which
the health ministry says
accounted for 69% of costs associated with
China’s disease burden in 2009. Community
health centers must now provide free check-
ups for hypertension and diabetes patients
four times a year, says Wu Yangfeng, director
of The George Institute, China, and a cardio-
vascular specialist at Peking University Clin-
ical Research Institute in Beijing. The health
care reforms are “not just of political signifi -
cance,” he says. “The basic health services
will really help to cover a broad range of
the population affected by chronic disease.”
A new requirement to check every patient’s
blood pressure will help catch the esti-
mated 70% of Chinese with hypertension
who are not aware they have it, Wu says.
The increased focus on chronic diseases
may benefi t research. “Our whole concep-
tualization of noncommunicable diseases
is based on data from what is a minority of
the global population today,” says Gabriel
Leung, a public health researcher at HKU.
“None of it came from China.” Research-
ers may now start to identify population-
specific risk factors in China and other
developing countries, he says.
One potential downside is the effect of
reforms on drug development. Until recently,
up to 50% of China’s total health care spend-
ing went toward drugs, Liu says—a sum that
“might be the highest drug-to-total-health-
care-expenditure ratio in the world.” (The
Organisation for Economic Co-operation
and Development states that the ratio aver-
aged 18% in 2003.) China aims to bring
expenditures down, Liu says, by restricting
hospitals to lists of government-approved
drugs and by outlawing profi teering on pre-
scriptions. The selection process for the lists
has set off bidding wars, with companies
rushing to underbid each other. The drop in
revenue will shave profi t margins—a change
A New Dawn for Mental Health
SHANGHAI, CHINA—Graduates of Chinese medical schools once steered clear of mental health work. In the 1980s, recalls Michael Phillips, a psychia-trist at Shanghai Mental Health Center and Emory University School of Medi-cine in Atlanta, “they would do anything to get out of it.” The fi eld then was reeling from decades of suppression. After the 1949 revolution, it had been branded a bourgeois science, with drug treatment in many psychiatric hos-pitals replaced by readings of Mao Zedong’s Little Red Book. Today, psychia-try has gained legitimacy, but psychiatrists still complain of a poor mental health infrastructure and measly salaries. Thus, many cheered when China’s health ministry announced in 2009 that it was making mental health a key focus area of its sweeping health care reforms (see p. 505).
That newfound attention culminated last October in the adoption of a mental health law that had been under discussion for 27 years. The law is “a major event for Chinese psychiatry,” Phillips says. It emphasizes the expan-sion of community mental health services, delineates professional duties in psychiatry and psychology, and introduces a more humane protocol for com-mitment to psychiatric hospitals. (An English translation of the law has been posted to the Web site of the Shanghai Archives of Psychiatry.)
China has an estimated 173 million people with mental disorders of whom the vast majority—some 158 million—have never received treatment. Psychi-atrists have been trying for decades to change that. In 1985, Liu Xiehe, a psy-chiatrist at Sichuan University’s West China Hospital in Chengdu, wrote the fi rst draft of China’s mental health law. But bureaucratic intransigence, concerns about the cost of mental health services, and resistance from some psychiatrists
stalled the process. By 2005, the draft had been revised 15 times to no avail.In the end, studies on the heavy socioeconomic toll of mental illness
prodded Chinese offi cials to act. In 1996, the Global Burden of Disease Study found that mental illness, neuropsychological conditions, and suicide together accounted for 20% of China’s illness burden, using a metric called disability-adjusted life years (Science, 1 November 1996, p. 740). The fi g-
ure remained relatively stable until 2004, the last year for which data is available, Phillips says. In 2010, China committed to remodeling and expanding 550 psychiatric hospitals and wards within 2 years. Another area to benefi t was community-based mental health, which has received
more than $35.3 million from the central government since 2004. Health care reforms and the new law should bump up funding even further.
The law divides China’s mental health professionals into psychiatrists, psychological counselors, and psychotherapy practitioners, or what observ-ers understand as clinical psychologists. The distinctions are intended to strengthen professionalism. Of China’s estimated 20,000 psychiatrists, only about 20% hold a degree in the fi eld, according to a study published in Asia-Pacifi c Psychiatry in October 2009. Clinical psychology and counseling is even more of a mixed bag. “Some people have psychology degrees, some have education degrees, and some have a background that has nothing to do with psychology,” says Xiang Yutao, a psychiatrist at Beijing Anding Hospital and the Chinese University of Hong Kong. A key provision of the new law,
Dreaming big. Sum-ping Lee envisions the University of Hong Kong-
Shenzhen Hospital as a trailblazer in research and care.
NEWSFOCUS
The mental health law
is “a major event for
Chinese psychiatry.”—MICHAEL PHILLIPS, SHANGHAI
MENTAL HEALTH CENTER
Published by AAAS
on
Janu
ary
31, 2
013
ww
w.s
cien
cem
ag.o
rgD
ownl
oade
d fr
om

www.sciencemag.org SCIENCE VOL 339 1 FEBRUARY 2013 507
CR
ED
ITS
(T
OP
TO
BO
TT
OM
): A
SS
OC
IAT
ED
PR
ES
S/C
HIN
AT
OP
IX; A
ND
Y W
ON
G/A
SSO
CIA
TE
D P
RE
SS
designed to limit the reach of unqualifi ed practitioners, states that psychologi-cal counselors cannot diagnose or treat mental disorders.
Patients stand to gain leverage: Under the new law, they can no longer be hospitalized against their will, unless deemed a danger to themselves or others. Previously China had a looser policy for committing patients to
institutions involuntarily—a loophole exploited in the past to lock up unruly relatives after domestic disputes and, allegedly, political dissidents. “The most important aspect of the law is that it empha-sizes the protection of patients’ rights,” Xiang says. Not all psychiatrists are keen on the volun-tary commitment clause, fearing that it will compli-cate their work and reduce demand for psychiatric beds. Indeed, patients deemed a danger to others now have the right to request a reevaluation by two additional psychiatrists.
The mental health community has its work cut out for it. A national epidemiological survey on mental health now under way—China’s fi rst in 20 years—should help elucidate what services are needed and where. But as needs in rural areas are clarifi ed, convincing psychiatrists to leave cities will be diffi cult. “The idea is you’re going to get all these psychiatrists out in the community. I don’t see it,” Phillips says. Another stumbling block may be convincing Chinese to seek help. Psychological
counseling remains unaffordable for many, and medical insurance in China only partially covers mental health care, says Zhang Jianxin, deputy director of the Chinese Academy of Sciences’ Institute of Psychology in Beijing. But, he adds, the law sets an important precedent. “We have a saying in China: It’s better to have something than not to have it.” –M. H.
Bold lead. Caption goes here caption goes here caption goes here caption goes here caption goes here
No more winging it. A new law governing psy-
chiatric hospitals aims to strengthen profession-
alism and curtail involuntary admissions.
that could squeeze research. “Drug compa-
nies are of course nervous about the future
source of income for their R&D,” Liu says.
But, he adds, because total health care spend-
ing in China is increasing by more than 15%
each year, the country will continue to be a
profi table market: Even as drug companies’
share of the pie decreases, Liu says, “The
total pie will increase.” The health ministry
contends that strong government support of
pharmaceutical research will help compen-
sate for any losses.
A larger economic challenge will be con-
taining costs for patients. Today, 95% of Chi-
nese have basic insurance covering some
medical costs, accord-
ing to the health minis-
try, which has gradually
deepened the coverage to
include some catastrophic
medical expenses and out-
patient treatment as well
as routine checkups and
tests. But broader coverage has not stemmed
soaring costs. A preliminary study from the
Institute for the Study of Labor in Bonn,
Germany, shows that Urban Resident Basic
Medical Insurance, which was launched in
2007, has increased hospital visits without
reducing out-of-pocket expenses. “If health
expenditure growth is not controlled, then
the fi nancial protections on the population
are still going to be limited,” says Winnie Yip,
a health policy expert at the University of
Oxford in the United Kingdom. Huang points
out that China’s roughly 200 million internal
migrants—a “bridging” group that spreads
HIV and other infectious diseases from high-
risk groups like urban sex workers to low-risk
groups like rural heterosexual women—are
largely insured in their home towns, mean-
ing far less than 95% of the population takes
advantage of the new national program.
The central government has tried to
better cover migrant workers by allowing
them to enroll in insurance at their urban
workplaces. But combating chronic dis-
eases will ultimately require much more
than free checkups and
treatments. “The most
effective control is really
prevention,” Yip says. At
the top of the list, Huang
says, should be enforc-
ing the WHO Framework
Convention on Tobacco
Control—a tough task in a country with
an entrenched tobacco lobby (Science,
13 January 2012, p. 153). “We haven’t seen
any government leaders publicly speak out
against smoking,” he says.
“Clearly there is still a long way to go,”
Wu says. But the emphasis on chronic dis-
ease is an important fi rst step, he says: “That
is the right direction for China.”
–MARA HVISTENDAHL
Life insurance. Hospitals have hired guards follow-
ing a wave of violence against doctors and nurses.
The emphasis on chronic
disease “is the right
direction for China.”—WU YANGFENG,
THE GEORGE INSTITUTE, CHINA
NEWSFOCUS
Published by AAAS
on
Janu
ary
31, 2
013
ww
w.s
cien
cem
ag.o
rgD
ownl
oade
d fr
om

www.sciencemag.org SCIENCE VOL 339 1 FEBRUARY 2013 509
en years ago, Science and the National Science Foundation (NSF) launched a unique experiment: an international competition to recognize the best examples of projects that bring scientifi c information to life. The goal was to encourage new ways
to visualize data—efforts that are increasingly important for conveying scientifi c principles and ideas across disciplines and to the general public, and for revealing the hidden beautyof structures on scales from nanometers to the cosmos. The following pages showcase the winners of the 10th in what has become the annual International Science and Engineering Visualization Challenge.
The 10th anniversary winners merge biology and physical science in interesting ways. They include a “wiring diagram” of the macaque brain (featured on the cover of this issue), which inspired a new type of computer chip; a scanning electron micrograph that reveals the crystal structure of a sea urchin’s tooth; a poster showing how the owl manages to swivel its head without shutting off blood to its brain; and a video of a computer model of the heart that marries imaging techniques with high-powered computing.
We received 215 entries from 18 countries. A committee of staff members from Science
and NSF screened the entries. Those selected as fi nalists were posted on NSF’s Web site, and visitors were invited to vote for their top choice in each category. A total of 3155 votes came in; entries that received the most votes were named the “People’s Choice.” Independently, an outside panel of experts in scientifi c visualization reviewed the fi nalists and selected the win-ners. The winning entries are featured on the following pages, in a slideshow and podcast at www.sciencemag.org/special/vis2012, and at www.nsf.gov/news/scivis. Some entries were put together by large teams, not all of whose members could be listed in print; the online pre-sentations provide more details. Tarri Joyner of NSF organized this year’s challenge.
We encourage you to submit applications for next year’s challenge, details of which will be available on NSF’s Web site, and to join us in celebrating this year’s winners.
JUDITH GAN, DIRECTOR, OFFICE OF LEGISLATIVE AND PUBLIC AFFAIRS, NSF
COLIN NORMAN, NEWS EDITOR, SCIENCE
JUDGES
Michael K. ReddyNational Institutes of
General Medical Sciences
Bethesda, Maryland
Corinne SandoneJohns Hopkins University School of
Medicine
Baltimore, Maryland
Tierney ThysNational Geographic Explorer
Carmel, California
Thomas WagnerNASA
Washington, D.C.
Text by Emily Underwood
Design by Kay Engman
V isualization
Challenge
T
2012
Published by AAAS
on
Janu
ary
31, 2
013
ww
w.s
cien
cem
ag.o
rgD
ownl
oade
d fr
om

FIRST PLACE WINNER
AND PEOPLE’S CHOICE
Biomineral Single Crystals
Pupa U. P. A. Gilbert and Christopher E. Killian; University of Wisconsin, Madison
hese fantastical structures could be a creation of Antoni Gaudí, the surreal-
ist architect. In reality, they are the micro-scopic crystals that make up a sea urchin’s tooth. Each shade of blue, aqua, green, and purple—superimposed with Photoshop on a scanning electron micrograph (SEM)—highlights an individual crystal of calcite, the abundant carbonate mineral found in lime-
510 1 FEBRUARY 2013 VOL 339 SCIENCE www.sciencemag.org
stone, marble, and shells. The curved surfaces of the crystals look
nothing like normal calcite crystal faces, however, says biophysicist Pupa U. P. A. Gilbert of the University of Wisconsin, Madi-son. Gilbert studies biomineralization: the process by which living organisms produce mineral structures such as bones and teeth. Sea urchin teeth in particular are “fantas-tic,” she says, because they defy our expec-tations of what a crystal should look like in nature. Instead of fl at sides and sharp edges, the sea urchin produces “incred-ibly complex, intertwined” curved plates and fi bers that interlock and fi ll space in the tooth as they grow. Though made of a sub-stance normally as soft as chalk, the teeth are hard enough to grind rock, gnawing
holes where the sea urchins take shelter from rough seas and predators. Layers of continuously regenerating crystals slough off and reveal new crystals as the teeth wear down, self-sharpening with use.
On fi rst seeing the SEM image of the tooth in black and white, Gilbert and staff scientist Christopher E. Killian were dumb-struck: “I had never seen anything that beautiful,” she says. However, the black-and-white image made it diffi cult to distin-guish the individual crystals, so she applied the colors to highlight how the crystals inter-twine and connect. The resulting image is a “virtuosic combination of chemistry, biology, and art,” says judge Michael Reddy. The fact that sea urchins have evolved to produce self-sharpening teeth is “just wild,” he says.
T
hotography
Published by AAAS
on
Janu
ary
31, 2
013
ww
w.s
cien
cem
ag.o
rgD
ownl
oade
d fr
om

SPECIALSECTION
HONORABLE MENTION
Self Defense
Kai-hung Fung, Pamela Youde Nethersole Eastern Hospital in Hong Kong
his is no shell game, but a matter of life or death. The clam (left) can snap its bivalve shell shut at
the fi rst sign of a threat. The whelk (right) has evolved another strategy: The spiral shell provides a series of barricades to potential invaders. It also has a trick up its shell to foil the clam’s defense. After softening the clam’s single-layered shell with secretions, it can drill a hole right through and eat the clam for lunch. This dramatic example of two different evolutionary strategies for self-defense caught the eye of radiologist Kai-hung Fung at Pamela Youde Nethersole Eastern Hospital in Hong Kong, who has won numerous awards for his creative use of CT scanning to make art. To create this image—which he says was commissioned as a backdrop for a marine-themed musical—Fung used a CT scanner to image thin slices of the whelk and clam, then rendered their contours in rainbow colors to highlight their com-plex structures. Creating such images involves balanc-ing “two sides of a coin,” he says. “One side is factual information, while the other side is artistic.”
HONORABLE MENTION
X-ray micro-radiography and microscopy of seeds
Viktor Sykora, Charles University; Jan Zemlicka, Frantisek Krejci, and Jan Jakubek, Czech Technical University
urred, fringed, and barbed, these fruits with tiny seeds—each seed no bigger than 3 mm across—look almost guaran-
teed to get stuck in your socks. However, biologist Viktor Sykora of Charles University and his colleagues at Czech Technical University in Prague saw the seeds not as common stickers but as works of art. To image the seeds’ fi ne details, the team used high-resolution, high-contrast x-rays (left) along with traditional microscopy (right). The most challenging part of the 20-hour process, Sykora says, was to fi nd a way to fi x the seeds in place using a material that would be invisible in the fi nal image. Although high-resolution x-rays are com-monly used to visualize the internal structures of small objects with-out destroying them, according to the authors it has never before been applied to the visualization of seeds. “The number of details that could be seen in the fi nal image delighted us,” Sykora says. He hopes that the images will motivate more scientists to use the tech-nique in plant biology, as well as inspire painters, designers, and architects. “We should realize how much beauty, elegance, and wit can be found in nature and in seemingly ordinary things,” he says.
511www.sciencemag.org SCIENCE VOL 339 1 FEBRUARY 2013
2012 International Science & Engineering Visualization Challenge
F
T
Published by AAAS
on
Janu
ary
31, 2
013
ww
w.s
cien
cem
ag.o
rgD
ownl
oade
d fr
om

512 1 FEBRUARY 2013 VOL 339 SCIENCE www.sciencemag.org
Illustration
Published by AAAS
on
Janu
ary
31, 2
013
ww
w.s
cien
cem
ag.o
rgD
ownl
oade
d fr
om

www.sciencemag.org SCIENCE VOL 339 1 FEBRUARY 2013 513
FIRST PLACE WINNER
Connectivity of a Cognitive Computer Based on the Macaque Brain
Emmett McQuinn, Pallab Datta, Myron D. Flickner, William P. Risk, and Dharmendra S. Modha, IBM Research - Almaden
he ghostly neon swirl nearly stumped the judges when they fi rst looked at
this illustration. Biologist and judge Michael Reddy says that a cognitive computer is “the last thing on Earth” he would have guessed that the image represented at fi rst glance. Inspired by the neural architecture of a macaque, it is the wiring diagram for a new kind of computer that, by some defi nitions, may soon be able to think.
Over the past 2 years, IBM’s cognitive computing group in San Jose, California, has made great strides toward designing a computer that can detect patterns, plan responses, and learn from its mistakes, says Emmett McQuinn, a hardware engineer at IBM who designed the image. In 2011, the company demonstrated a new kind of com-puter chip, based on neural circuitry, that combines memory and computational pro-cessing for nimbler problem-solving in areas where traditional computers fall short, such as pattern recognition. Then, the company used data from studies of macaque brains to see how those “neurons” should link up, and simulated neural networks with billions of neurons and trillions of axons and synapses.
The fi rst step in creating an illustration to communicate the new wiring system was to reduce trillions and billions of data points to less overwhelming numbers. Even roughly 4000 nodes and 300,000 connections was challenging to get on a single page, McQuinn says. “Fortunately, nature has already thought of this.” First, he clustered and colored the nodes based on the 77 dif-ferent functional regions that neuroscientists have identifi ed in the macaque brain. Then, after many draft layouts, he found a circular arrangement that pleased him.
“They took something that we know works fantastically effi ciently in nature—the circuitry of the brain—and applied that geometry to computing. Then, they found an elegant and beautiful way to display it.,” judge Thomas Wagner says.
HONORABLE MENTION AND PEOPLE’S CHOICE
Cerebral Infi ltration
Maxime Chamberland, David Fortin, and Maxime Descoteaux, Sherbrooke Connectivity Imaging Lab
malignant brain tumor (red mass, left) in this person’s brain is wreathed by fi ne tracts of white matter. The red fi bers signal danger: If severed by the neurosurgeon’s
scalpel, their loss could affect the patient’s vision, perception, and motor function. Blue fi bers show functional connections far from the tumor that are unlikely to be affected during surgery. Together, the red and blue fi bers provide a road map for neurosurgeonsas they plan their operations.
Computer science graduate student Maxime Chamberland of the Sherbrooke Con-nectivity Imaging Lab in Canada produces images like these on a weekly basis, he says. Using an MRI technique that detects the direction in which water molecules move along the white matter fi bers, he generates a three-dimensional image of functional connections in the brain. In addition to the image’s haunting beauty, people respond to the frightening immediacy of the tumor, he says: “They want to know if the patient is ok.” Fortunately, this story has a happy ending: The tumor was removed with no functional damage.
2012 International Science & Engineering Visualization Challenge
T
A
Published by AAAS
on
Janu
ary
31, 2
013
ww
w.s
cien
cem
ag.o
rgD
ownl
oade
d fr
om

FIRST PLACE WINNER
Adaptations of the Owl’s Cervical & Cephalic Arteries in Relation to Extreme Neck Rotation
Fabian de Kok-Mercado, Michael Habib, Tim Phelps, Lydia Gregg, and Philippe Gailloud, Johns Hopkins University School of Medicine
ost animals would suffer a stroke or worse if they tried the owl’s most
famous party trick. Instead of moving their large, tubular eyes in their sockets, owls swivel their heads 270°. This poster explains the likely mechanism for the eerie ability.
Owls were a “no-brainer” when Fabian de Kok-Mercado was searching for a new
and unusual topic for his master’s thesis in medical illustration at Johns Hopkins Univer-sity in Baltimore, Maryland, in 2012, he says. After noticing a gap in the literature on owls’ carotid and vertebral arteries, he and several colleagues obtained 12 dead birds from edu-cational centers in Michigan and Missouri. Then they created three-dimensional images of the owls’ blood vessels and bones with a CT scanner and injected the birds with radio-opaque dye and liquefi ed red plastic to pre-serve their arteries before dissecting them.
On close examination, the owls revealed surprising secrets, de Kok-Mercado says. For example, the owls’ transverse foramina—holes in the vertebrae that the vertebral arter-ies thread through on their way up the spine to the brain—are much bigger than the arter-
ies themselves, allowing room for movement as the birds’ heads twist. In contrast, human vertebral arteries sit snugly inside their foramina, he says. The researchers found swellings in the birds’ arteries that likely act as reservoirs for pooling blood when the head is turned, he says, as well as “back-up” arteries that could help supply the brain when other arteries are pinched.
The poster is primarily intended to help veterinarians care for injured birds, but the judges felt it will reward anyone who looks closely. “On the fi rst pass, someone might wonder what the big deal is. But on a second pass, you’ll get pulled in,” says judge Thomas Wagner. Owls can rotate their heads to a freakish degree; “this illustration answers the question ‘How does that really work?’ ”
514 1 FEBRUARY 2013 VOL 339 SCIENCE www.sciencemag.org
M
osters & Graphics
Published by AAAS
on
Janu
ary
31, 2
013
ww
w.s
cien
cem
ag.o
rgD
ownl
oade
d fr
om

SPECIALSECTION2012 International Science & Engineering Visualization Challenge
PEOPLE’S CHOICE
The Pharma Transport Town: Understanding the Routes to Sustainable Pharmaceutical Use
Will Stahl-Timmins, Mathew White, Michael Depledge, and Lora Fleming, University of Exeter Medical School; Clare Redshaw, Plymouth University
hat started as a series of linked text boxes grew into a town. While sketching ideas for this poster,
which shows the fate of drugs after people consume them or throw them away, information designer Will Stahl-Timmins of the European Centre for Environment and Human Health found his drawings “spiraling out of control.”
By his second attempt, he says, “I realized that it was starting to look like a city.” Stahl-Timmins decided to make the focal point of the graphic a river, and build a town around it. Working with an environmental chemist and an environmental psychologist, he added content on social factors, such as education, that affect drug usage and disposal, and showed gaps in knowledge such as how active pharmaceuticals may be when con-sumed unknowingly in food or water.
HONORABLE MENTION
Earth Evolution: The Intersection of Geology and Biology
Mark Nielsen, Satoshi Amagai, HHMI; Bill Pietsch, Davey Thomas, Astronaut 3 Media Group; and Andy Knoll, Harvard University
f you think Pangaea was a supercontinent a long time ago and dinosaurs are ancient history, prepare for a dose of deep
time. All 4.6 billion years of Earth’s history are squeezed onto this poster. The whole history of land vertebrates from dinosaurs to humans is barely visible in the top right corner. Because of its rela-tively young age and minor role in planetary evolution, Pangaea didn’t even make the cut. Far more prominent is the evolution of photosynthetic bacteria, which enabled the evolution of many new types of metabolism, including our own by generating oxygen.
The poster draws connections between biological and geo-logical processes in Earth’s history, such as mass extinctions, plate tectonics, and the greenhouse effect, says Mark Nielsen, a scientifi c education fellow at the Howard Hughes Medical Insti-tute in Chevy Chase, Maryland, who helped design the graphic.
“A lot of things happened” in the wide swath of Earth’s history that isn’t included on traditional posters, he says. For example, whereas many classic visualizations of life on Earth begin just 540 million years ago, when large animals became abundant, Earth Evolution tells a much longer story, stretching back 3.8 billion years to the earliest evidence of life.
515www.sciencemag.org SCIENCE VOL 339 1 FEBRUARY 2013
One goal of the poster is to create a tool for policy-makers, he says. So far, so good—at a recent meeting with scientists and legislators discussing the issue, he says the poster ended up covered in sticky notes.
I
W
Published by AAAS
on
Janu
ary
31, 2
013
ww
w.s
cien
cem
ag.o
rgD
ownl
oade
d fr
om

HONORABLE MENTION
CyGaMEs Selene II: A Lunar
Construction GaME
Debbie Denise Reese, Robert E. Kosko, Charles A. Wood, and Cassie Lightfritz, Wheeling Jesuit University; Barbara G. Tabachnick, California State University, Northridge
hat better way to learn how the moon was made than to
build one? In this online game geared to grade 5–12 students, players cre-ate their own moon with raw space materials, then pummel it with aster-oids and fl ood it with lava. As they adjust the rates of accretion—new materials glomming onto the moon—and differentiation—materials of varying densities settling into a core, mantle, and crust—students cre-ate different kinds of moons and gain an intuitive grasp of the physics of collisions, says game theorist and principal investigator Debbie Denise Reese at Wheeling Jesuit University in Wheeling, West Virginia. Intro-ductory scientifi c concepts such as impact cratering and volcanism can be “gatekeepers” for students, she says. “Year after year, decade after decade, they block students from certain areas of study.” The goals of a CyGaMEs game like Selene are “to turn those concepts into something that the students can do with their bodies” and “measure learning while it occurs.” In CyGaMEs Selene II, she says, “getting the best score is fi gur-ing out the science.”
1 FEBRUARY 2013 VOL 339 SCIENCE www.sciencemag.org 516
No First Place was awardedNo First Place was awarded
Games & Apps
W
Published by AAAS
on
Janu
ary
31, 2
013
ww
w.s
cien
cem
ag.o
rgD
ownl
oade
d fr
om

SPECIALSECTION2012 International Science & Engineering Visualization Challenge
PEOPLE’S CHOICE
UNTANGLED
Gayatri Mehta, University of North Texas
hen faced with the problem of how to wire a more effi cient computer chip, engineer Gayatri Mehta of
the University of North Texas in Denton turned to crowd-sourcing. Inspired by a game that recruits online players to discover novel ways to fold proteins, Mehta designed UNTANGLED, a game in which users compete to make the most compact circuit layout on a grid. The real chal-lenge of designing the game was “how to hide all the tech-nical details so that people don’t get scared of it’s being an engineering problem,” she says. To entice math and science phobes, she used bold color blocks and left out the underlying algorithms. The game allows her to record millions of new moves and discover human strategies for circuit design that could be employed to develop smaller, more powerful, and longer-lasting electronic devices. “I’ve learned a lot,” she says. “People have amazing skills.”
HONORABLE MENTION
Velocity Raptor
Andy Hall, TestTubeGames
his dapper green dinosaur wear-ing a bright blue cape is in a hurry
to save the world—in fact, she moves at nearly the speed of light. At such breakneck speeds, the world behaves
according to Albert Einstein’s theory of special relativity.
This poses practical problems for players who must guide the creature through a world that morphs accord-ing to her velocity, incorporating con-cepts such as Doppler shift and length contraction. As she changes speeds, for example, a slow stream of easily dodged bullets becomes a rapid-fi re assault, and the surfaces she must tra-
verse stretch, shrink, and bend. While Newtonian physics are fairly
easy to grasp by “walking around and throwing rocks,” says game designer and physicist Andy Hall, special relativ-ity is much more diffi cult to understand because we don’t directly experience it. Velocity Raptor is an attempt to “give people some intuition” about the physics of special relativity by letting them play with it themselves, Hall says.
517www.sciencemag.org SCIENCE VOL 339 1 FEBRUARY 2013
T
W
Published by AAAS
on
Janu
ary
31, 2
013
ww
w.s
cien
cem
ag.o
rgD
ownl
oade
d fr
om

FIRST PLACE WINNER
AND PEOPLE’S CHOICE
Alya Red: A Computational Heart
Guillermo Marin, Fernando M. Cucchietti, Mariano Vázquez, and Carlos Tripiana, Barcelona Supercomputing Center
rom this tangled swirl of fi bers, scientists hope to divine the deep-est secrets of the human heart. Based on MRI data, each colored
strand represents linked cardiac muscle cells that transmit electrical current and trigger a model human heartbeat. The image is an artistic rendering of Alya Red, a new computer model of the heart at the Barce-lona Supercomputing Center that marries modern medical imaging tech-niques with high-powered computing.
Despite centuries of study, scientists are still largely baffl ed by the heart’s complex electrical choreography, says physicist Fernando Cucchietti, who helped produce the video. When faced with the chal-lenge of presenting Alya Red to a general audience through video, he says, “It took a lot of work to get a script that was engaging, but still scientifi cally deep enough for an expert eye to see interesting details.” The most challenging part was to get the heart fi bers in the image above to move in a realistic way, Cucchietti says. At one point, he says, the animation showed the electrical currents moving backwards. “We had to keep going back to the scientists—did we mess something up?”
“We wanted to create a sense of wonder at the complexity” of the heart itself, he says. The awe wasn’t lost on the judges. “I was literally blown away,” says Michael Reddy. “After the fi rst time I watched the video, I thought, “I’ve just changed the way I thought about a heart.”
HONORABLE MENTION
Observing the Coral Symbiome Using Laser Scanning Confocal Microscopy
Christine E. Farrar, Zac H. Forsman, Ruth D. Gates , Jo-Ann C. Leong, and Robert J. Toonen, University of Hawai`i, Manoa
o dyes or digital software produced the bril-liant color of these corals—the glory is all their
own. Fluorescent molecules, innate to the corals and to the red algae that live inside and nourish them, shine like Christmas lights under different wave-lengths of light emitted by a confocal microscope.
When she saw the corals under the lens for the fi rst time, “my jaw just dropped,” says Ruth Gates, a coral biologist at the University of Hawai`i, Manoa, and the narrator of the video. “Most people think corals are inanimate rocks,” she says. “We show-case how beautiful and dynamic they are as ani-mals.” In the video, which compiles the images into three-dimensional, time-lapse animations, corals extend and retract their glowing tentacles. Tiny crea-tures crawl over the corals, all part of a complex and threatened ecosystem. In the future, Gates says, it might be possible to use confocal microscopy to clas-sify different coral species or diagnose coral disease by their fl uorescent patterns. Prior to applying this technique, she says, “that was not even a facet in our thinking about coral biology.”
1 FEBRUARY 2013 VOL 339 SCIENCE www.sciencemag.org 518
V ideo
NF
Published by AAAS
on
Janu
ary
31, 2
013
ww
w.s
cien
cem
ag.o
rgD
ownl
oade
d fr
om

SPECIALSECTION2012 International Science & Engineering Visualization Challenge
HONORABLE MENTION
Revealing Invisible Changes in the World
Michael Rubinstein, Neal Wadhwa, Frédo Durand, William T. Freeman, and Hao-Yu Wu, MIT
sleeping infant appears still, but its chest subtly rises and falls with steady breathing. A tower-
ing crane looks stable, but rocks imperceptibly in the breeze. In this video, a team of computer scientists at the Massachusetts Institute of Technology in Cam-bridge demonstrates a new method of magnifying subtle changes normally invisible to the eye. “What the micro-scope did for visualizing minute objects, we hope to do for minute motions and changes,” says Ph.D. student Michael Rubinstein. Using video as input, the team ana-lyzes each pixel for slight variations in color over time—for example, rhythmic reddening in a man’s face as blood pulses through his veins. Then they apply an algo-rithm that magnifi es the variation, and extract the infor-mation they need. By amplifying the man’s slight blush, for example, they were able to obtain his heartbeat. Among other applications, they say, the technique could help doctors take their patients’ vital signs remotely.
519www.sciencemag.org SCIENCE VOL 339 1 FEBRUARY 2013
HONORABLE MENTION
Fertilization
Thomas Brown, Nucleus Medical Media
ew narratives in biology are so iconic—or so frequently portrayed—as the epic voyage of
the beleaguered sperm to the defensive egg. In most videos about human fertilization, however, “you see little parts of the journey, and then suddenly you see the sperm entering the egg,” says Thomas Brown, chief creative offi cer of Nucleus Medical Media in Kennesaw, Georgia. “It’s beautiful and iconic, but you don’t really know how you got there.” Given new developments in the science of conception, as well as advancements in digital media, his team decided it was time for a remake. “Fertilization” starts with 300 million sperm, following their perilous journey up the cervix and into the fallopian tube with unprecedented detail and continuity, Brown says. By the time the last few dozen surviving sperm reach the egg, he says, “you’re famished, troubled, and hopeful.” In a new twist based on recent science, he says, the fi rst sperm to reach the egg is rewarded with an embrace, as the egg’s inner membrane encloses and absorbs it.
F
A
Published by AAAS
on
Janu
ary
31, 2
013
ww
w.s
cien
cem
ag.o
rgD
ownl
oade
d fr
om

1 FEBRUARY 2013 VOL 339 SCIENCE www.sciencemag.org 520
LETTERSedited by Jennifer Sills
LETTERS I BOOKS I POLICY FORUM I EDUCATION FORUM I PERSPECTIVES
523
Putting images to our uncertainties
Heterogeneity within tumors
528
COMMENTARY
CR
ED
IT: C
DC
/ C
OU
RT
ESY
OF
CY
NT
HIA
GO
LD
SM
ITH
, JA
CQ
UE
LIN
E K
AT
Z, SH
ER
IF R
. Z
AK
I
Transmission Studies Resume
For Avian Flu
IN JANUARY 2012, INFLUENZA VIRUS RESEARCHERS FROM AROUND the world announced a voluntary pause of 60 days on any research
involving highly pathogenic avian infl uenza H5N1 viruses leading
to the generation of viruses that are more transmissible in mammals
(1). We declared a pause to this important research to provide time to
explain the public health benefi ts of this work, to describe the mea-
sures in place to minimize possible risks, and to enable organiza-
tions and governments around the world to review their policies (for
example, on biosafety, biosecurity, oversight, and communication)
regarding these experiments.
During the past year, the benefi ts of this important research have
been explained clearly in publications (2–7) and meetings (8–10). Mea-
sures to mitigate possible risks
of the work have been detailed
(11–13). The World Health
Organization has released rec-
ommendations on laboratory
biosafety for those conducting
this research (14), and relevant
authorities in several countries
have reviewed the biosafety,
biosecurity, and funding con-
ditions under which further
research would be conducted
on the laboratory-modified
H5N1 viruses (10, 15–17).
Thus, acknowledging that the
aims of the voluntary morato-
rium have been met in some
countries and are close to
being met in others, we declare
an end to the voluntary moratorium on avian fl u transmission studies.
The controversy surrounding H5N1 virus transmission research
has highlighted the need for a global approach to dealing with dual-
use research of concern. Developing comprehensive solutions to
resolve all the issues will take time. Meanwhile, H5N1 viruses con-
tinue to evolve in nature. Because H5N1 virus transmission stud-
ies are essential for pandemic preparedness and understanding the
adaptation of infl uenza viruses to mammals, researchers who have
approval from their governments and institutions to conduct this
research safely, under appropriate biosafety and biosecurity condi-
tions, have a public health responsibility to resume this important
work. Scientists should not restart their work in countries where, as
yet, no decision has been reached on the conditions for H5N1 virus
transmission research. At this time, this includes the United States
and U.S.-funded research conducted in other countries. Scientists
should never conduct this type of research without the appropri-
ate facilities, oversight, and all the necessary approvals. We con-
sider biosafety level 3 conditions with the considerable enhance-ments (BSL-3+) outlined in the referenced publications (11–13) as
appropriate for this type of work, but recognize that some countries
may require BSL-4 conditions in accordance with applicable stan-
dards (such as Canada). We fully acknowledge that this research—
as with any work on infectious agents—is not without risks. How-
ever, because the risk exists in nature that an H5N1 virus capable
of transmission in mammals may emerge, the benefi ts of this work
outweigh the risks.
RON A. M. FOUCHIER,1 ADOLFO GARCÍA-SASTRE,2 YOSHIHIRO KAWAOKA,3,4*
WENDY S. BARCLAY,5 NICOLE M. BOUVIER,6,2 IAN H. BROWN,7 ILARIA CAPUA,8
HUALAN CHEN,9 RICHARD W. COMPANS,10 ROBERT B. COUCH,11
NANCY J. COX,12 PETER C. DOHERTY,13 RUBEN O. DONIS,12 HEINZ FELDMANN,14
YI GUAN,15 JACQUELINE M. KATZ,12 OLEG I. KISELEV,16 H. D. KLENK,17
GARY KOBINGER,18 JINHUA LIU,19 XIUFAN LIU, 20 ANICE LOWEN,21
THOMAS C. METTENLEITER,22 ALBERT D. M. E. OSTERHAUS,1 PETER PALESE,2
J. S. MALIK PEIRIS,23 DANIEL R. PEREZ,24 JÜRGEN A. RICHT,25
STACEY SCHULTZ-CHERRY,26 JOHN STEEL,21 KANTA SUBBARAO,27
DAVID E. SWAYNE,28 TORU TAKIMOTO,29 MASATO TASHIRO,30
JEFFERY K. TAUBENBERGER,31 PAUL G. THOMAS,13 RALPH A. TRIPP,32
TERRENCE M. TUMPEY,12 RICHARD J. WEBBY,26 ROBERT G. WEBSTER 26
1Department of Virology, Erasmus Medical Center, 3015GE Rotterdam, Netherlands. 2Department of Microbiology, Icahn School of Medicine at Mount Sinai, New York, NY 10029, USA. 3Department of Pathobiological Sciences, School of Veterinary Medicine, University of Wisconsin–Madison, Madison, WI 53711, USA. 4Division of Virology, Department of Micro-biology and Immunology, The Institute of Medical Science, University Of Tokyo, Minato-ku, Tokyo 108-8639, Japan. 5Department of Medicine, Imperial College, London, W2 1PG, UK. 6Division of Infectious Diseases, Icahn School of Medicine at Mount Sinai, New York, NY 10029, USA. 7Virology Department, Animal Health and Veterinary Laboratories Agency, Addlestone, KT15, UK. 8Istituto Zooprofi lattico Sperimentale delle Venezie, 35020, Padova, Italy. 9Harbin Veterinary Research Institute, CAAS, Harbin 150001, China. 10Infl uenza Patho-genesis and Immunology Research Center, Emory University, School of Medicine, Atlanta, GA 30322, USA. 11Department of Molecular Virology and Microbiology, Baylor College of Medi-cine, Houston, TX 77030, USA. 12Infl uenza Division, Centers for Disease Control and Preven-tion, Atlanta, GA 30333, USA. 13Department of Immunology, St. Jude Children’s Research Hospital, Memphis, TN 38105, USA. 14Laboratory of Virology, National Institute of Allergy and Infectious Diseases, National Institutes of Health, Rocky Mountain Laboratories, Ham-ilton, MT 59840, USA. 15State Key Laboratory of Emerging Infectious Diseases, School of Public Health, The University of Hong Kong, Hong Kong SAR. 16D.I. Ivanovsky Institute of Virology, Ministry of Public Health, Moscow, Russia. 17Institut für Virologie, 35043 Marburg, Germany. 18National Microbiology Laboratory, Public Health Agency of Canada, Winnipeg, MB R3E 3R2, Canada. 19Department of Preventative Veterinary Medicine, China Agricultural University, Beijing, 100193, China. 20Animal Infectious Disease Laboratory, School of Vet-erinary Medicine, Yangzhou University, Yangzhou, Jiangsu 225009, China. 21Department of Microbiology and Immunology, Emory University School of Medicine, Atlanta, GA 30322, USA. 22Friedrich-Loeffl er-Institut, D-17493 Greifswald–Insel Riems, Germany. 23Centre of Infl uenza Research, School of Public Health, The University of Hong Kong, Hong Kong SAR. 24Department of Veterinary Medicine, University of Maryland, College Park, College Park,
H5N1 virus.
Published by AAAS
on
Janu
ary
31, 2
013
ww
w.s
cien
cem
ag.o
rgD
ownl
oade
d fr
om

www.sciencemag.org SCIENCE VOL 339 1 FEBRUARY 2013 521
530
Undernutrition and gut microbiota
532
Timely measurement of mass
CR
ED
IT: C
ON
SE
RV
AT
ION
IN
TE
RN
AT
ION
AL/C
HA
NG
QIN
G N
AT
ION
AL N
AT
UR
E R
ES
ER
VE
MD 20742, USA. 25College of Veterinary Medicine, Kansas State University, Manhattan, KS 66506, USA. 26Department of Infectious Diseases, St. Jude Children’s Research Hospital, Memphis, TN 38105, USA. 27Emerging Respiratory Viruses Section, Laboratory of Infectious Diseases, National Insti-tute of Allergy and Infectious Diseases, National Institutes of Health, Bethesda, MD 20892–3203, USA. 28Southeast Poultry Research Laboratory, USDA/Agricultural Research Service, Athens, GA 30605, USA. 29Department of Microbiol-ogy and Immunology, University of Rochester Medical Cen-ter, Rochester, NY 14642, USA. 30Infl uenza Virus Research Center, National Institute of Infectious Diseases, Tokyo, 208-0011, Japan. 31Viral Pathogenesis and Evolution Sec-tion, Laboratory of Infectious Diseases, National Institute of Allergy and Infectious Diseases, National Institutes of Health, Bethesda, MD 20892–3203 USA. 32Department of Infectious Diseases, College of Veterinary Medicine, Univer-sity of Georgia, Athens, GA 30602, USA.
*To whom correspondence should be addressed. E-mail: [email protected]
References 1. R. A. M. Fouchier et al., Science 335, 400 (2012). 2. R. A. M. Fouchier, S. Herfst, A. D. M. E. Osterhaus, Sci-
ence 335, 662 (2012). 3. S. Herfst, A. D. Osterhaus, R. A. Fouchier, J. Infect. Dis.
205, 1628 (2012). 4. Y. Kawaoka, Nature 482, 155 (2012). 5. H. L. Yen, J. S. Peiris, Nature 486, 332 (2012). 6. D. M. Morens, K. Subbarao, J. K. Taubenberger, Nature
486, 335 (2012). 7. A. S. Fauci, F. S. Collins, Science 336, 1522 (2012). 8. World Health Organization (WHO), “Report on technical
consultation on H5N1 research issues” (WHO, Geneva, 2012); www.who.int/infl uenza/human_animal_interface/mtg_report_h5n1.pdf.
9. National Science Advisory Board for Biosecurity, “March 29–30, 2012 Meeting of the National Science Advisory Board for Biosecurity to review revised manuscripts on transmissibility of A/H5N1 infl uenza virus: Statement of the NSABB” (2012); http://oba.od.nih.gov/oba/biosecurity/PDF/NSABB_Statement_March_2012_Meeting.pdf.
10. Gain-of-Function Research on Highly Pathogenic Avian Infl uenza H5N1 Viruses: An International Con-sultative Workshop, Bethesda, MD, 17–18 December 2012; http://oba.od.nih.gov/oba/biosecurity/meetings/Dec2012/Agenda-Dec-17-18-2012-HHS-Meeting-GOF%20Research-on-HPAI-H5N1.pdf
11. A. Garcia-Sastre, MBio 3, e00049 (2012). 12. M. Imai et al., Nature 486, 420 (2012). 13. S. Herfst et al., Science 336, 1534 (2012). 14. WHO, Infl uenza, Guidance for adoption of appropriate
risk control measures to conduct safe research on H5N1 transmission (2012); www.who.int/infl uenza/human_animal_interface/biosafety_summary/en/index.html.
15. Public Health Agency of Canada, Biosafety Advisory: Effi ciently Transmissible Engineered Infl uenza A H5N1 Viruses (2012); www.phac-aspc.gc.ca/lab-bio/res/advi-avis/sbn-asb-2012-01-31-eng.php.
16. Commissie Genetische Modifi catie, Publications, 21 March 2012 Letter in response to infl uenza research Erasmus MC (CGM/111125-04) (2012); www.cogem.net/index.cfm/nl/publicaties/publicatie/brief-nav-infl uenza-onderzoek-erasmus-mc [in Dutch].
17. United States Government Policy for Oversight of Life Sciences Dual Use Research of Concern (2012); http://oba.od.nih.gov/oba/biosecurity/PDF/United_States_Government_Policy_for_Oversight_of_DURC_FINAL_version_032812.pdf.
Published online 23 January 2013; 10.1126/science.1235140
Normal University, Beijing 100875, China. 4Sichuan Wild-life Resource Survey and Conservation Management Sta-tion, Chengdu 610081, China. 5Sichuan Provincial Institute of Forestry Survey and Planning, Chengdu 610081, China. 6Conservation International, Beijing 100027, China.
*To whom correspondence should be addressed. E-mail: [email protected]
References
1. State Forestry Administration, The 3rd National Survey
Report on Giant Panda in China (Science Press, Beijing,
2006).
2. Q. Ping, F. Carlsson, J. Xu, Land Econ. 87, 473 (2011).
3. “A road leads to richness: A case study of collective forest
tenure reform in Longtan township, Shizhu County of
Chongqing,” Chongqing Forestry Bureau (2010); www.
forestry.gov.cn/portal/main/s/102/content-452659.html
[in Chinese].
4. G. Liu, J. Wan, H. Zhang, L. Cai, Rev. Eur. Community Int.
Environ. Law 17, 234 (2008).
5. “The Lease embodiment of collective forest in Gutian-
shan National Nature Reserve,” Gutianshan National
Nature Reserve (2012); http://xxgk.kaihua.gov.cn/gzxx/
qtxx/201203/t20120329_257377.htm [in Chinese].
6. IUCN Red List Categories and Criteria, version 3.1
(2001); www.iucnredlist.org/apps/redlist/static/
categories_criteria_3_1#critical.
Eco-Compensation
For Giant Panda Habitat
CHINA’S ACHIEVEMENTS IN GIANT PANDA CON-servation (1) are now jeopardized by recent tenure reform of its 167 million hectares of collective forest (2). The reform enables individual farming households to transfer or lease operation rights to outside enterprises. By allowing commercial logging, increased collection of fi rewood and nontimber forest products, unmanaged tourism, and certain types of industrial development in collective forests where these activities were previously restrained, the reform threatens to deforest, degrade, or disturb up to 3457 km2 of giant panda habitat, or 15% of what remains. In one recent transaction, a timber company purchased 150 km2 of collective forest in Shizhu County, Chongqing Province at a reported price of $2.3 million USD ($153 USD/ha) (3).
China spent more than $100 billion USD on eco-compensation to buy back develop-ment rights from local communities to secure the continued provision of ecosystem services (4). Extending the eco-compensation program to giant panda habitats could reduce the threat that tenure reform poses to the giant panda while fulfi lling the intention of the reform to increase local economic benefi ts. Communi-ties would sign long-term binding preserva-tion agreements for forest habitats outside of existing reserves in exchange for monetary compensation from county departments. A reasonable price for eco-compensation pay-ments might be $70 USD per hectare per year for 48 years, following the successful experi-ence of the People’s Government of Kaihua County leasing 63 km2 of collective forest in Gutianshan National Nature Reserve of Zhe-jiang (5). $240 million USD in effective eco-compensation payments could prevent a decline in the wild giant panda population. An additional $2.25 billion USD for effec-tive eco-compensation and habitat restora-tion could increase the population to sub-stantially more than the threshold of 1000 individuals below which a stable population is classifi ed as vulnerable (6).
BIAO YANG,1 JONAH BUSCH,2 LI ZHANG,3*
JIANGHONG RAN,1 XIAODONG GU,4 WEN ZHANG,5
BEIBEI DU,6 RUSSELL A. MITTERMEIER2
1Key Laboratory of Bio-Resources and Eco-Environment of Ministry Education, College of Life Science, Sichuan Univer-sity, Chengdu 610064, China. 2Conservation International, Arlington, VA 22202, USA. 3College of Life Sciences, Beijing
Letters to the Editor
Letters (~300 words) discuss material published
in Science in the past 3 months or matters of
general interest. Letters are not acknowledged
upon receipt. Whether published in full or in part,
Letters are subject to editing for clarity and space.
Letters submitted, published, or posted elsewhere,
in print or online, will be disqualifi ed. To submit a
Letter, go to www.submit2science.org.
Published by AAAS
on
Janu
ary
31, 2
013
ww
w.s
cien
cem
ag.o
rgD
ownl
oade
d fr
om
522
LETTERS
1 FEBRUARY 2013 VOL 339 SCIENCE www.sciencemag.org
Get 10,000 bonus points if you sign up for a card and spend
$3,000 within 90 days of account opening.
Learn more at nasafcu.com/AAASpromo.
Support the sciences.Get rewarded.Show your AAAS pride and reward yourself with the newAAAS Platinum Advantage Rewards Card from NASA FederalCredit Union.
Apply now and get 10,000 bonus points!
Go to nasafcu.com/AAASpromo
Subject to credit approval. Membership in AAAS and NASA FCU is required.
NASA FCU is federally insured by NCUA.17050Montebello Rd, Cupertino, CA 95014Email:[email protected]
www.betchartexpeditions.com
For a detailed brochure,please call (800) 252-4910All prices are per person twin share + air
Join us in the “Astronomy Capital ofthe World” as we learn about newdiscoveries on Mars and the Moonand see the natural wonders ofthis desert paradise. Visit Kitt Peak,Arizona-Sonora Desert Museum,Biosphere 2, and see the PhoenixBotanic Garden, Sedona, SunsetCrater, andWupati near Flagstaff,as well as visit Lowell Observatorywhere dark skies make the MilkyWay a wonder to see! $2,995 + air.
BETCHART EXPEDITIONS Inc.
AAAAAAAAAAAAAArrrrrrrrrriiiiiiizzzzzzzzzzzzzzzzzzooooooooooooonnnnnaaaaa SSSSSSSSSSSSSSSSSSSkkkkkkkkkkkkkkkkkiiiieeeeeeeeeeeeeesssssss
NewDiscoveriesApril 21-28, 2013
Environmental Health
Crucial to Food Safety
IN ITS FIRST DECADE, THE EUROPEAN FOOD
Safety Authority (EFSA) has made huge
advances in addressing the risks posed by
pathogens, contaminants, and additives
along the whole food chain, from primary
production to final consumption (“Amid
Europe’s food f ights, EFSA keeps its
eyes on the evidence,” K. Kupferschmidt,
News Focus, 30 November 2012, p. 1146).
Consistent with its role in protecting food
security, EFSA also has a mandate to assess
risks to plant health from introduced pests
and diseases (1). Yet, measures to secure
the integrity of the food chain increasingly
require assessments of risks, not to humans,
crops, or livestock, but to the environment.
EFSA is charged with assessing the envi-
ronmental risks of biocides used in food
decontamination, additives in animal feeds,
pesticides, genetically modifi ed organisms,
and alien pests and weeds (2). The interrela-
tionship between food safety and the environ-
ment can only be expected to strengthen as
the environmental impacts of new food tech-
nologies, such as artifi cial sweeteners (3) and
antimicrobial nanoparticles in food packag-
ing (4), become more clearly understood.
However, approaches to environmental
risk assessment differ considerably among
EFSA’s panels, ranging from species-
specif ic ecotoxicology to measures of
impacts at the level of entire ecosystems
(5–7). A major future challenge will be the
harmonization of environmental risk assess-
ments. Harmonization has the potential to
herald a new era of comparative risk assess-
ments in which, for example, the environ-
mental impact of pest-resistant genetically
modifi ed crops could be directly compared
with the alternative pesticide regime. Unfor-
tunately, despite its best efforts, the Euro-
pean Commission has struggled to achieve
such harmonization across risk sectors (8).
EFSA might also run into conflict
regarding jurisdiction with national environ-
ment protection agencies and the European
Environment Agency (EEA). The future will
call for both EFSA and EEA to operate more
closely together, much as the U.S. Food and
Drug Administration and Environment Pro-
tection Agency work to eliminate duplica-
tive jurisdiction (9, 10). Given the pressing
global challenge of food security (11), the
next decade will require a more integrated
approach to European food safety that
weighs the risks to human, animal, and envi-
ronmental health in a coordinated, objective,
and transparent manner.PHILIP E. HULME
Bio-Protection Research Centre, Lincoln University, Lincoln 7647, Canterbury, New Zealand. E-mail: [email protected]
References
1. P. E. Hulme, P. Pyšek, W. Nentwig, M. Vilà, Science 324, 40 (2009).
2. V. Silano, A. Knaap, D. Lovell, D. Liem, EFSA J. 10, s1001 (2012).
3. M. G. Kokotou, A. G. Asimakopoulos, N. S. Thomaidis, Anal. Methods 4, 3057 (2012).
4. J. H. Priester et al., Proc. Natl. Acad. Sci. U.S.A. 109, E2451 (2012).
5. EFSA, EFSA J. 8, 1821 (2010). 6. EFSA, EFSA J. 8, 1877 (2010). 7. EFSA, EFSA J. 9, 2460 (2011). 8. European Commission, “The future of risk assessment in
the European Union: The second report on the harmonisa-tion of risk assessment procedure” (European Commission, Brussels, 2003).
9. S. Reardon, Science 332, 652 (2011). 10. M. A. Hamburg, Science 336, 299 (2012). 11. H. C. J. Godfray et al., Science 327, 812 (2010).
Published by AAAS
on
Janu
ary
31, 2
013
ww
w.s
cien
cem
ag.o
rgD
ownl
oade
d fr
om

BOOKS ET AL.
www.sciencemag.org SCIENCE VOL 339 1 FEBRUARY 2013 523
CR
ED
IT: JO
HN
HE
ND
RIX
/WW
W.J
OH
NH
EN
DR
IX.C
OM
/CO
UR
TE
SY
CH
RO
NIC
LE
BO
OK
S
When in an interview, Richard
Feynman lauded “the pleasure of
fi nding things out” ( 1), he echoed
the driving motivations of many other sci-
entists: not just the satisfac-
tion of achieving answers,
but the enjoyment of their
pursuit—of crafting ques-
tions to be both testable and
answerable and designing
ways to investigate them.
We often blame the popular
image of science as one of
objective, predetermined
truth on the way educa-
tion and the media reduce
such narratives ( 2). But we might also blame
the changing tools used to access scien-
tifi c knowledge, as these also affect how we
engage with its questions.
Designers Jenny Volvovski, Julia Roth-
man, and Matt Lamothe lament the loss of
taking pleasure in the “sense of the unknown.”
Topics that once would have engaged
extended debate are now settled at the touch
of a mobile device, where the
Google search box stands poised
to deliver its archive of human
knowledge at our command. With
information now so accessible, we
demand immediate answers, but
we lose the “most fun, the period of
wonder and funny guesses.” “For-
tunately, there are still mysteries
that can’t be entirely explained in a
few mouse clicks.”
In The Where, the Why, and
the How, the trio behind the Chi-
cago- and New York–based design
company Also pays homage to
scientific uncertainty. After com-
missioning more than 50 contrib-
utors—researchers, academics,
teachers, and librarians from mostly
North American institutes—to pen
summaries of current thinking on
unanswered questions in science,
they invited 75 prominent and
emerging international artists and
illustrators to respond with origi-
nal visual interpretations. The resulting hard-
cover features lavish two-page spreads, in
which full-color illustrations face brief essays
on an array of topics, including the physics
of the universe, the social
organization of primates,
the intricacies of the human
mind, and ecological rela-
tionships between plants
and animals. The table of
contents reads as a litany of
our curiosities and fears and
is a measure of the scope
of our worries (“Are nano-
materials dangerous?”) and
existential concerns (“What
existed before the Big Bang?”). Many entries
overlap with the big unanswered questions
identifi ed in Science’s special 125th anniver-
sary issue from 2005 ( 3). But whereas some
touch on socially relevant issues (“Is sexual
orientation innate?”) and globally important
ones (“Where will the next pandemic come
from?”), others entertain more idle curiosities
that widen the book’s appeal to a general audi-
ence (“Why do we hiccup?”).
This highly browsable volume puts a new
lens to the long-time relationship between art
and science. As the editors explain, its very
concept was inspired by historical medical
illustrations: depictions of the structure of red
blood cells from classroom diagrams of the
1950s and charmingly inaccurate renderings
of human anatomy from Japan’s Edo period.
Today, such snapshots of our understanding at
earlier times are records of the human pursuit
of knowledge. At the same time, they exude a
quaint air of naiveté. Developed from tradi-
tions in editorial illustration, comics, graphic
design, and the fi ne arts, the illustrations in
The Where, the Why, and the How refl ect on
many levels a consciousness of their place
in history. Whimsically modern-retro with
a pop aesthetic, they appear to comment on
the very practice of scientific illustration,
putting images to our uncertainty that are
less explanatory than they are metaphorical,
allegorical, and symbolic. For example, in
“Can anything escape a black hole?” Romeo
and Juliet reach toward one another across a
black hole to exchange the two particles cre-
ated through Hawking radiation. For “Why
do placebos work?” a blue elephant clutches
a feather in its trunk and leaps into the air. In
“Why do pigeons bob their heads when they
walk?” we see a Muybridge-style cartoon of
a bird’s locomotion. And for “Why do we fall
for optical illusions?” clever repro-
ductions of canonical illusions fool
us into anticipating the tricks our
eyes would play (e.g., “These cows
are the same size. It’s true.”). Even
the book trailer ( 4) is an artwork in
its own right.
Because the book shines in so
many respects, it may leave read-
ers wanting more in others. I would
have appreciated references to
theories cited, pointers to seminal
studies, and short biographies if
not links to the profi les of the sci-
ence contributors to match the web-
sites already printed beneath each
artist’s name. And whereas variety
adds to the book’s visual appeal, it
may weaken the collective impact
of the written contributions. Admit-
tedly, each entry admirably articu-
lates a complex topic in concise
and engaging ways. The most
effective essays convey the impor-
tance of the question, the logic
behind the competing hypotheses,
and the methods pursued for fi nd-
ing the answers. The less effective
ones meanwhile point unceremoni-
The Pleasure of Not Knowing
ART AND SCIENCE
Camillia Matuk
The reviewer is at the Graduate School of Edu-cation, University of California, Berkeley, CA 94720, USA. E-mail: [email protected]
The Where, the Why,
and the How
75 Artists Illustrate Wondrous
Mysteries of Science
Jenny Volvovski, Julia Rothman,
and Matt Lamothe, Eds.
Chronicle, San Francisco, 2012.
167 pp. $24.95, £15.99.
ISBN 9781452108223.
John Hendrix’s Do rogue waves exist?
Published by AAAS
on
Janu
ary
31, 2
013
ww
w.s
cien
cem
ag.o
rgD
ownl
oade
d fr
om

BOOKS ET AL.
1 FEBRUARY 2013 VOL 339 SCIENCE www.sciencemag.org 524
ously to answers and thus defeat the very fea-
ture that otherwise sets this book apart from a
conventional encyclopedia.
The Where, the Why, and the How serves
as a lovely time capsule of our contempo-
rary concerns, curiosities, ignorance, and
future ambitions. It repositions science as
a fi eld that poses and investigates questions
and will surely be as engaging a read in the
not-too-distant future (already, the entry for
“What is the ‘god particle’?” is outdated).
Volvovski, Rothman, and Lamothe offer a
stunning collection that reimagines scientifi c
wonder and that is an eloquent argument for
slow living in an age of immediate access.
Drawing on Feynman’s wisdom, the authors
invite readers to savor the visceral pleasure
of not knowing—taking delight in allowing
thoughts to unravel and meander through
alternative possibilities.
References 1. “The pleasure of fi nding things out,” Horizon, BBC (23
November 1981). 2. S. D. Kolstø, Sci. Educ. 85, 291 (2001). 3. What We Don’t Know, Science 309, 75–102 (2005). 4. http://vimeo.com/50786051#.
10.1126/science.1232334
The Unfeathered Bird. Katrina van Grouw. Princeton University Press, Princeton, NJ. 2013. 301 pp. $49.95, £34.95. ISBN 9780691151342. Although her detailed drawings of bones, skeletons, muscles, and other internal tissues would not be out of place in a treatise on avian anatomy, van Grouw intends them to reveal how birds’ “appearance, posture, and behavior infl uence, and are infl uenced by, their internal structure.” To this end, many of the birds are shown in lifelike poses or engaged in typical activities (e.g., a Eurasian sparrowhawk plucking its prey, a red-throated loon swimming underwater, and a Wilson’s storm petrel patting the water’s surface with its feet). All 385 illustrations are from actual specimens—wherever possible, ones that the artist prepared at home. The 200 species depicted span most of the anatomical diversity of birds. Refl ecting the book’s concerns with outward appearances and the effects of convergent adaptive evolution, the chapters are ordered on the basis of Linnaeus’s Systema Naturae. But the author includes discussions of the actual relationships in her informative text.
Extinct Boids. Ralph Steadman and Ceri Levy. Bloomsbury, London. 2012. 244 pp. £35. ISBN 9781408178621. Bloomsbury, New York, $50. ISBN 9781620401064.In early 2011, Levy invited Steadman to paint an extinct bird for an art project, Ghosts of Gone Birds, that was organized to raise awareness of endangered birds. The cartoonist’s enthusiasm for the project eventually led him to produce 110 paintings. This portfolio comprises iconic vanished species (such as great auk, passenger pigeon, and dodo), less-known taxa (e.g., robust white-eye and Colombian grebe), extant birds (some critically endangered; a few rather widespread), and numerous fantastic boids Steadman discovered in his imagination (including wizened twit and splattered shag). Levy’s commentary describes the genesis of these vibrantly colored, often humorous creations.
Red-and-green macaw (Ara chloropterus) with skin removed.
Cuban macaw (Ara tricolor). Driven extinct by hunting, this island endemic was last reported in 1885. C
RE
DIT
S: (L
EF
T) K
AT
RIN
A V
AN
GR
OU
W/C
OU
RT
ESY
PR
INC
ET
ON
UN
IVE
RSIT
Y P
RE
SS; (R
IGH
T) R
ALP
H S
TE
AD
MA
N/C
OU
RT
ESY
BLO
OM
SB
UR
Y P
UB
LIS
HIN
G
Published by AAAS
on
Janu
ary
31, 2
013
ww
w.s
cien
cem
ag.o
rgD
ownl
oade
d fr
om

BOOKS ET AL.
www.sciencemag.org SCIENCE VOL 339 1 FEBRUARY 2013 525
A World in One Cubic Foot: Portraits of Biodiversity.
David Liittschwager. University of Chicago Press, Chicago. 2012. 204 pp. $45, £29. ISBN 9780226481234. Photographer Liittschwager focuses on six cubic feet, each carefully chosen to characterize a particular rich habitat. He examines saltwater bay (beneath San Francisco’s Golden Gate Bridge), cloudforest canopy (Monteverde, Costa Rica), coral reef (Moorea, Polynesia), deciduous forest fl oor (Central Park, New York), freshwater river (Duck River, Tennessee), and mountain fynbos shrubland (Table Mountain, South Africa). Deploying a metal cube to frame his samples, he recorded all the organisms visible to the naked eye that could be found in the cube over a typical 24 hours. The book presents selected individual portraits of these animals and plants, along with synoptic collages (and accompanying keys) that highlight the abundance of life at each site. Short essays by researchers and writers introduce the six settings.
Duck River collage. These 107 animals include 81 species of fi sh, turtles, and invertebrates.
Survey spot with sampling cube. The Duck River at Lillard’s Mill, Tennessee.
Filter feeder. Pistolgrip (Quadrula verrucosa) (6.2 cm), a unionid bivalve. Grazing gastropod. Pleurocerids such as panel elimia (Elimia laqueata) (2 cm) feed on the periphyton attached to submerged surfaces.C
RE
DIT
: D
AV
ID L
IIT
TSC
HW
AG
ER
/NA
TIO
NA
L G
EO
GR
AP
HIC
IM
AG
E C
OLLE
CT
ION
Published by AAAS
on
Janu
ary
31, 2
013
ww
w.s
cien
cem
ag.o
rgD
ownl
oade
d fr
om

1 FEBRUARY 2013 VOL 339 SCIENCE www.sciencemag.org 526
POLICYFORUM
A priority outcome from the 2012 United Nations Rio+20 Conference on Sustainable Development ( 1) was
the target to restore, by 2020, 150 million ha of disturbed and degraded land globally ( 2). An initiative of this scale is estimated to cost U.S. $18 billion per year and to provide U.S. $84 billion per year to the global economy ( 2). Although such initiatives have transfor-mative potential because of their scope and backing, they require technology and knowl-edge capacity to deliver proven, scalable restoration ( 3). Restoration processes must achieve the greatest value for money, as far as socioeconomic and biodiversity conser-vation outcomes, while avoiding costly and simplistic plantings ( 4).
Although we recognize that preventing loss and damage in the fi rst place is a far bet-ter investment than restoration after damage has occurred, we propose a four-point plan to ensure that restoration sustains and enhances ecological values: (i) identify focal regions with high restoration demands, (ii) iden-tify knowledge gaps and prioritize research needs to focus resources on building capac-ity, (iii) create restoration knowledge hubs to aggregate and disseminate knowledge at the science-practice interface, and (iv) ensure political viability by establishing economic and social values of functioning restored ecosystems. These points are interrelated and may occur in parallel.
Ecological restoration, not just a matter of planting trees ( 5), involves assisting the recov-ery of a damaged or destroyed ecosystem ( 6). Landscape-scale restoration includes large, contiguous, or fragmented areas (equal to or greater than several km2). Restoration often takes place in an unpredictable socio-ecolog-ical context, involving multiple stakeholders and interests, where local actions aggregate into a broader context that considers land-scape fl ows and connectivity (see the fi gure). A realistic assessment of prior knowledge, technological capacity, fi nancial viability, and
social license is needed for understanding sci-entifi c and practical constraints to achieving global restoration targets. Recent examples, such as China’s Great Green Wall and Grain for Green programs, although politically viable, could threaten ecosystem services through ill-placed restoration ( 7). In such situ-ations, the scientifi c support behind less-pop-ular options may have been ignored or simply may not be available. A key limitation is the lack of information on successes and failures in landscape-scale restoration projects ( 8) to guide more effective practice. Early engage-ment with science will be critical, such as Future Earth: Research for Sustainability, launched at Rio+20, which proposes coordi-nation and facilitation of global science ( 9).
Identifi cation of Focal Regions
Success of landscape-scale restoration proj-ects will be more likely in some ecosystems and regions than others ( 10). We should set
realistic goals ( 11– 13) and identify ecosys-tems where resources are best positioned to achieve the most cost-effective results to maximize ecosystem services and bio-diversity gains. Professional societies, gov-ernments, the private sector, and nongov-ernmental organizations must collaborate through umbrella organizations such as the International Union for Conservation of Nature (IUCN) to set standards and pri-oritize ecosystems and regions for resource allocation. Such an approach has identifi ed 2 billion ha globally that provide forest res-toration opportunities ( 14) where ecosystem services could be delivered through cost-effective natural and assisted regeneration.
Drylands also provide landscape-scale restoration opportunities. Drylands, exten-sive in many parts of the world, have been identified as ecosystems that will suffer greatly from climate change, with deserti-fi cation likely to affect 30% of the world’s population ( 15). Many drylands are major resource hubs that provide fi nancial capac-ity to fund and implement research and res-toration ( 15).
Prioritization of Research Needs
Once areas have been prioritized and fund-ing has been secured, key knowledge gaps for achieving landscape-scale restoration should be identifi ed. There are few ecosys-tems for which we have suffi cient knowl-edge to achieve restoration success beyond the local scale. A range of scalable, proven, and cost-effective capacities will be needed, e.g., the scaling-up of resources such as seed banks, to facilitate landscape-scale restora-tion ( 3). Approaches are being developed to prioritize actions depending on landscape conditions and likely effectiveness ( 16, 17).
Although long-term cost-effectiveness of most interventions remains unclear and may be potentially costly, some regional-scale projects may be relatively inexpen-sive. Linking restoration initiatives with evolving knowledge will allow for targeted, cost-effective interventions ( 12), while avoiding actions that may make things worse in the longer term [e.g., ( 18)]. For example, wetland systems where altered water fl ows have caused system decline can
Hurdles and Opportunities for Landscape-Scale Restoration
ECOLOGY
Myles H. M. Menz, 1 , 2 * Kingsley W. Dixon, 1, 2 Richard J. Hobbs 2
Gaps in knowledge must be identifi ed,
capacities developed, and research translated
into policy and practice.
*Author for correspondence. E-mail: [email protected]
1Kings Park and Botanic Garden, Perth 6005, Australia. 2Plant Biology, University of Western Australia, Perth 6009, Australia.
Plus additional costs
Plus additional costs
Multiplicative
costs
Multiplicative
costs
Landscape/regional
Global
Local/patch
Scaling up restoration. Costs multiply as local patches are added, each requiring site treatment, seed or plant input, management, and so on. Addi-tional costs and knowledge are necessitated by land-scape and regional structures and processes (e.g., hydrological management or transaction costs among different land uses). Economies of scale may be possible. Scaling up to the global level requires multiplicative and additional costs relating to social and political requirements.
Published by AAAS
on
Janu
ary
31, 2
013
ww
w.s
cien
cem
ag.o
rgD
ownl
oade
d fr
om

www.sciencemag.org SCIENCE VOL 339 1 FEBRUARY 2013 527
POLICYFORUM
be restarted by reinstating prior conditions, such as in the Mesopotamian Marshes ( 19). Dryland restoration can be kick-started by providing simple physical barriers to water movement ( 20).
There is growing awareness of the inter-disciplinary science packages required for restoration ( 16) [e.g., microbiology ( 21), seed science ( 3), and pollination ecology ( 22, 23)], integrated with socioeconomic expertise ( 24). There needs to be a balance between generally applicable approaches and solutions tailored to region- or ecosys-tem-specifi c requirements. Interdisciplin-ary actions—facilitated by umbrella orga-nizations such as the Society for Ecologi-cal Restoration, IUCN, and Conservation International—would provide project car-riage beyond the typical 3- to 5-year funding cycles. Although funding agencies and uni-versities need to play a key role in support-ing these programs, lobbying by umbrella organizations would be an important step in establishing the process. Successful collab-orative initiatives [e.g., ( 25)] provide solid footing for future programs.
Restoration Knowledge Hubs
Effective information transfer is paramount to the success of landscape-scale restoration projects and to avoid repeating costly mis-takes while closing the science-practice gap ( 13). Attempts to bridge this gap are often local in focus. Restoration ecologists need to take responsibility for translating their science into on-the-ground actions ( 13, 26). Successful science-practice communication must be two-way to achieve the greatest ben-efi t, as practitioners are valuable for identi-fying knowledge gaps and guiding research. Evidence-based literature and information repositories should be developed for the res-toration sciences ( 27).
Few restoration initiatives provide for dialogue with the restoration sciences. The Australian government is spending A$1billion (U.S. $1 billion) to restore 18 million ha of degraded land, yet, is silent on links to science or provision of investment in research ( 28). This is despite the acknowl-edgment of the southwest Australian biodi-versity hot spot as a region where restoration need far outstrips scientifi c knowledge ( 3).
Professional scientific associations can compile scientific knowledge and restora-tion practice and act as information clearing-houses ( 13). The Global Restoration Network (29) provides a Web-based hub for informa-tion on restoration projects. Initiatives such as Future Earth provide hope for linking tech-nology, innovation, and science ( 30). Gov-
ernments and funders of ecological restora-tion must develop practice-based templates for global capacity-building and measures for streamlining knowledge dissemination.
Political Viability of Restoration
Landscape-scale restoration projects are likely to work best when initiators are moti-vated by both environmental and social issues or either one [e.g., ( 31)]. Good sci-ence is required to ensure that the programs are a success, although achieving long-term, dual ecological and social goals remains challenging [e.g., ( 32, 33)]. Restoration will provide economic benefi ts worldwide ( 34), particularly if ecosystem services are matched with biodiversity conservation, including nonmarket services ( 35, 36). Cre-ating rigorous economic valuation and effi -cient markets for the wide range of ecosys-tem services is a critical step, with much still to be done.
Net benefi ts of sustainable, ecologically resilient restoration ( 13, 37) must be com-municated in a compelling way to policy-makers and practitioners if longer-term funding opportunities are to be realized, particularly support for science programs to fi ll knowledge gaps. Scientists need to shift from a focus on journal writing and professional conferences to reach a broader community and political audience who will make the call on restoration funding. Such a dialogue must remain science-based. For example, evaluation of cost-effectiveness based on ecosystem service return showed that many dry forest restoration approaches may be economic failures ( 38). Robust anal-yses like this are important for identifying false, politically damaging assumptions of restoration programs, e.g., China’s Great Green Wall ( 7).
However, in some cases, given the social and ecological values of restoration, costs need not be considered a hurdle, but a chal-lenge to improve our technology in develop-ing more cost-effective techniques.
Not a Magic Bullet
Restoration is often viewed simplistically, as if science and practice were well estab-lished. Restoration ecology is not a magic bullet that provides instant ecosystems of the desired type, but an emerging science less than four decades old. In many cases, restoration projects fall short of reinstating functional ecosystems akin to their natu-ral reference sites ( 10). For example, res-toration projects developed in exchange for habitat destruction elsewhere are becoming more prevalent, resulting in losses of high-
quality ecosystems that we are not yet able to restore ( 10). Deciding on useful targets in a period of rapid environmental change is another area of discussion in restoration ecology ( 11, 13).
Restoration knowledge hubs are most often associated with developed, boreal economies. For landscape-scale restoration to be effective, science funding and technol-ogy development need to realize targets that go beyond such local scales. Restoration is but one tool; with effective management and prevention of further damage to natural areas, restoration would become less urgent.
References and Notes 1. Rio+20 Dialogues, http://vote.riodialogues.org/.
2. IUCN, restoring lost forest; www.iucn.
org/?uNewsID=8147.
3. D. J. Merritt, K. W. Dixon, Science 332, 424 (2011).
4. R. J. Hobbs, Aust. J. Bot. 55, 371 (2007).
5. J. Tollefson, Nature 486, 13 (2012).
6. Society for Ecological Restoration, www.ser.org.
7. J. Xu, Nature 477, 371 (2011).
8. L. A. Brudvig, Am. J. Bot. 98, 549 (2011).
9. International Council for Science, www.icsu.org/
future-earth/.
10. M. Maron et al., Biol. Conserv. 155, 141 (2012).
11. R. Hobbs, Restor. Ecol. 15, 354 (2007).
12. R. J. Hobbs et al., Bioscience 61, 442 (2011).
13. K. N. Suding, Annu. Rev. Ecol. Evol. Syst. 42, 465
(2011).
14. World Resources Institute, www.wri.org/project/
forest-landscape-restoration/.
15. J. F. Reynolds et al., Science 316, 847 (2007).
16. K. A. Wilson et al., J. Appl. Ecol. 48, 715 (2011).
17. K. A. Wilson et al., PLoS Biol. 5, e223 (2007).
18. M. L. Martínez et al., Front. Ecol. Environ 10, 44 (2012).
19. C. J. Richardson et al., Science 307, 1307 (2005).
20. D. J. Tongway, J. A. Ludwig, Restor. Ecol. 4, 338 (1996).
21. J. Harris, Science 325, 573 (2009).
22. K. W. Dixon, Science 325, 571 (2009).
23. M. H. M. Menz et al., Trends Plant Sci. 16, 4 (2011).
24. J. Aronson, Landscape Ecol. 26, 457 (2011).
25. K. A. Keenleyside et al., Ecological Restoration for Pro-
tected Areas: Principles, Guidelines and Best Practices
(IUCN, Gland, Switzerland, 2012).
26. R. Arlettaz et al., Bioscience 60, 835 (2010).
27. W. J. Sutherland et al., Trends Ecol. Evol. 19, 305 (2004).
28. Biodiversity Fund, www.cleanenergyfuture.gov.au/
biodiversity-fund/.
29. Global Restoration Network, www.globalrestorationnetwork.
org/.
30. A. Abreu, Science 336, 1397 (2012).
31. W. Maathai, The Green Belt Movement: Sharing the
Approach and the Experience (Lantern Books, New York,
2006).
32. A. Buch, A. B. Dixon, Sustain. Dev. 17, 129 (2009).
33. B. W. van Wilgen et al., Biol. Conserv. 148, 28 (2012).
34. S. Cunningham, ReWealth! (McGraw-Hill, New York,
2008).
35. J. M. Bullock et al., Trends Ecol. Evol. 26, 541 (2011).
36. B. J. Cardinale et al., Nature 486, 59 (2012).
37. R. Biggs et al., Annu. Rev. Environ. Resour. 37, 421
(2012).
38. J. C. Birch et al., Proc. Natl. Acad. Sci. U.S.A. 107, 21925
(2010).
Acknowledgments: K.W.D. is supported by Australian Research Council (ARC) DP0985685 and DP1096717. R.J.H. is funded via an ARC Australian Laureate Fellowship and the ARC Centre of Excellence for Environmental Decisions.
10.1126/science.1228334
Published by AAAS
on
Janu
ary
31, 2
013
ww
w.s
cien
cem
ag.o
rgD
ownl
oade
d fr
om

1 FEBRUARY 2013 VOL 339 SCIENCE www.sciencemag.org 528
PERSPECTIVES
Intratumor heterogeneity refers to biologi-
cal differences between malignant cells
originated within the same tumor. Pos-
sible explanations for this include genetic
heterogeneity (resulting from the inherent
genetic instability of cancer combined with
evolutionary dynamics) and cell differen-
tiation hierarchies in tumor cell populations
( 1– 3). However, the results of Kreso et al. ( 4)
on page 543 of this issue strongly suggest that
biological differences between tumor cells
can be due to additional mechanisms.
To explore functional heterogeneity
within tumors, Kreso et al. traced the fates of
single cell–derived clones from 10 different
human primary colorectal tumors over mul-
tiple serial transplantations in mouse xeno-
grafts. Analysis of copy number alterations
and deep sequencing for mutational hotspots
in 42 cancer genes revealed that a number of
xenografts retained the genomic profi le of
the primary tumor, whereas in some cases
the first transplant and the parental tumor
displayed substantial genetic differences
indicative of clonal selection during xeno-
graft growth, but in subsequent transplants
the tumors remained genetically fairly stable.
Deep sequencing of the mutational hotspots
in distinct single cell–derived clones also
showed high concurrence, implying relative
genetic homogeneity within xenografts.
Despite this genetic homogeneity, the dif-
ferent cancer clones that Kreso et al. observed
in a tumor—made distinguishable through
unique genomic integration sites of a lentivi-
ral vector as a marker—displayed notable dif-
ferences in behavior during serial transplan-
tation. In addition to persistent clones that
were observed through multiple passages
and clones that became extinct with serial
passages, the authors identifi ed clones with
rather unexpected behaviors. Some of these
unusual clones remained below the detec-
tion threshold during the initial passages
but reemerged with later transplantations;
another pattern was the disappearance below
threshold in mid-passages and reappearance
in subsequent transplants. Although these
observations did not necessarily mean that
all distinct clonal behavior patterns refl ect
meaningful biological diversity, mathemati-
cal modeling and statistical analyses sug-
gested clonal differences in proliferative out-
puts. Notably, treatment of xenograft-bearing
mice with oxaliplatin—a chemotherapeutic
agent commonly used in colorectal cancer
patients—preferentially eliminated persistent
clones and increased the proportion of clones
that were initially below the detection thresh-
old (see the fi gure).
What mechanism could explain these dif-
ferences in clonal behavior? Although it is
formally possible that the different clones
were genetically distinct, the stability of copy
number alteration profi les and concordance
for mutational hot spots renders this possibil-
ity unlikely, at least for the nuclear genome.
Nor can the differences in proliferative out-
puts between the clones be explained on the
basis of “traditional” distinctions between
stem cells and non–stem cells, because tumor
engraftment and maintenance over multi-
ple passages fulfi ll the defi nition of cancer
stem cells. Cell differentiation hierarchy is
not the only type of nongenetic heterogene-
ity, as genetically identical cells can display
phenotypic variability due to stochasticity in
gene expression and signaling pathways—a
phenomenon known as cellular heterogeneity
( 5). However, phenotypic differences associ-
ated with cellular heterogeneity are relatively
transient, and it is not clear whether they
could account for the apparently stable differ-
ences in clonal behavior.
Cancer Cell Phenotypes, in Fifty Shades of Grey
CANCER
Andriy Marusyk and Kornelia Polyak
Intratumor heterogeneity is a major obstacle
in successfully eradicating tumors.
Changes in clonal dynamics during tumor growth
Changes in clonal dynamics due to therapeutic interventions
Tumor
High
proliferation
Low proliferation
(reduced sensitivity to
chemotherapy)
Increased proportion
of population
High
proliferation High
proliferation
Reduced tumor growth
Distinct clonal
populations
Chemotherapy
Differences in clonal behavior. (Top) A tumor that has not been exposed to therapies consists of clones that display distinct behaviors (shown by different colors). The tumor is generally dominated by clones with high proliferative output that can be detected through serial xenograft transplantations into immunodefi -cient mice. In the absence of therapy, the proportion of different types of clones can change randomly. (Bot-tom) By contrast, chemotherapy increases the proportion of clones with lower proliferative output, which in turn translates into reduced overall tumor growth even after the treatment is stopped. This change in clonal landscape likely refl ects the reduced sensitivity of slower-proliferating clones to chemotherapy. The differ-ences in proliferative output among clones are unlikely to be linked to genetic differences or position in differentiation hierarchies.
CR
ED
IT: Y. H
AM
MO
ND
/SC
IEN
CE
Department of Medical Oncology and Center for Func-tional Cancer Epigenetics, Dana-Farber Cancer Institute and Department of Medicine, Harvard Medical School, Boston, MA 02215, USA. E-mail: [email protected]
Published by AAAS
on
Janu
ary
31, 2
013
ww
w.s
cien
cem
ag.o
rgD
ownl
oade
d fr
om

www.sciencemag.org SCIENCE VOL 339 1 FEBRUARY 2013 529
PERSPECTIVES
A more likely explanation is the involve-
ment of one or more distinct semistable epi-
genetic states that cannot be directly mapped
to a differentiation hierarchy. In bacte-
rial cell populations, a fraction of cells ran-
domly assumes a distinct phenotype that is
characterized by resistance to stress, includ-
ing antibiotic treatment, at the expense of
reduced proliferation rates ( 6). The reemer-
gence of previously minor clones after oxali-
platin treatment and their ability to initiate
new tumors (although at smaller size) sug-
gest the presence of such slow-growing dor-
mant clones. Similarly, a distinct phenotypic
transition characterized by altered chromatin
organization has been described recently as
a mechanism of resistance to anti–epidermal
growth factor receptor therapy in human lung
cancer ( 7). Although the cells are locked in
this epigenetic state for multiple population
doublings, they can eventually revert back to
their original drug-sensitive state.
Kreso et al. do not reveal mechanisms
responsible for the variability in clonal
behavior. Still, the study has several impor-
tant implications. It highlights the need to
adequately understand epigenetic mecha-
nisms that underlie cancer cell phenotypes,
including studies of cellular heterogeneity
and more stable distinct epigenetic states
(stochastic and deterministic heterogeneity).
That therapeutic resistance can be caused by
distinct epigenetic states ( 7), which can be
prevented by targeting epigenetic regulators,
opens up new opportunities for improved
cancer treatment. The conclusions of Kreso
et al. also warrant more careful assessments
of studies interpreted through the cancer stem
cell paradigm. Quantitative analysis of such
studies frequently reveals numerical incon-
sistencies that can invalidate the conclusions
( 8). Refraining from mapping the differences
in cancer cell phenotypes into differentia-
tion hierarchies would lead to more accurate
scientifi c interpretation of the data, which is
critical for clinical translation. For example,
despite relatively limited experimental evi-
dence, it is widely assumed that therapeutic
resistance is fueled by the preferential sur-
vival of cancer stem cells, whereas the results
of Kreso et al. suggest that a therapy-resistant
state might be unrelated to “stemness” per
se. Cancer cell phenotypes are not black and
white but rather display a continuum of many
different colors and shades.
Kreso et al. analyzed colorectal cancers
that are fairly homogeneous for tumor-driv-
ing genetic alterations (i.e., mutations in the
APC-Wnt–β-catenin signaling pathway are
observed in nearly all human colorectal can-
cer) and these tumors were further genetically
“homogenized” by passing through a selec-
tion bottleneck created by xenotransplanta-
tion. However, phenotypic heterogeneity in
the majority of human cancers is likely to be
more complex, as it represents the integration
of both genetic and nongenetic inputs. There-
fore, adequate understanding and eradication
of cancers requires a comprehensive picture
that accounts for all major inputs that dictate
tumor cell behaviors, including their response
to current and future therapies. Technological
advances that enable the complete molecular
and functional profi ling of individual cancer
cells, as well as improved mathematical mod-
els built on actual clinical and experimental
observations, will likely allow us to construct
these pictures in the not-so-distant future.
References and Notes 1. L. L. Campbell, K. Polyak, Cell Cycle 6, 2332 (2007).
2. M. Shackleton, E. Quintana, E. R. Fearon, S. J. Morrison,
Cell 138, 822 (2009).
3. A. Marusyk, V. Almendro, K. Polyak, Nat. Rev. Cancer 12,
323 (2012).
4. A. Kreso et al., Science 339, 543 (2013); 10.1126/
science.1226670.
5. S. J. Altschuler, L. F. Wu, Cell 141, 559 (2010).
6. N. Q. Balaban, J. Merrin, R. Chait, L. Kowalik, S. Leibler,
Science 305, 1622 (2004).
7. S. V. Sharma et al., Cell 141, 69 (2010).
8. S. E. Kern, D. Shibata, Cancer Res. 67, 8985 (2007).
Acknowledgments: Supported by the Breast Cancer
Research Foundation.
10.1126/science.1234415
Toward Molecular-Scale MRI
CHEMISTRY
Philip Hemmer
Use of a diamond-based nanomagnetometer
reduces the detection volume of MRI to the
level of individual protein molecules.
Magnetic resonance imaging (MRI)
is a mainstay of medical diag-
nostics, allowing nondestructive
imaging inside opaque objects with high
resolution. There have been many attempts
to use MRI to image small objects such as
living cells, because the resolution can be
well below the optical diffraction limit.
However, the detection sensitivity of con-
ventional MRI falls rapidly for smaller fea-
ture sizes, making it impossible to resolve
features smaller than a few micrometers
with this method. Two reports in this issue,
by Mamin et al. on page 557 ( 1) and Stau-
dacher et al. on page 561 ( 2), demonstrate
the ability to detect volumes of a few cubic
nanometers, comparable to the size of large
protein molecules. These independent stud-
ies are a crucial step toward molecular-scale
magnetic resonance imaging.
In conventional MRI and the related
chemical diagnostic nuclear magnetic reso-
nance (NMR), magnetic nuclei such as pro-
tons are excited by a radiofrequency fi eld,
plus a large magnetic fi eld gradient in the
case of MRI. The resulting magnetic signal
emitted by the excited nuclei is collected
by a magnetic induction coil, much like the
antenna loop used in ultrahigh-frequency
TV reception, and digitally processed to
produce a spectrum or three-dimensional
image. However, as the image voxel size
is shrunk to allow imaging of ever smaller
objects, the magnetic signal becomes too
weak to be extracted from the background
magnetic noise in the environment. To mit-
igate this noise, the antenna loop can be
shrunk, but so far this approach has not
allowed MRI to achieve a resolution beyond
a few micrometers.
To circumvent this problem, nonconven-
tional detection techniques are needed. The
fi rst of these was magnetic resonance force
microscopy (MRFM), developed by Rugar et
al. nearly two decades ago ( 3). This approach
takes advantage of the force between two
magnets: the nuclear or electron spins being
imaged on the one hand and a powerful
nanomagnet attached to the tip of a scanning
probe on the other. This approach allowed
detection and imaging of single electrons ( 4)
and imaging of ensembles of nuclei in a virus
particle ( 5). However, it required ultralow
temperatures and could therefore not be used
to image dynamic samples in ambient envi-
ronments, like living cells.
Another approach uses a diamond-
based nanomagnetometer to sense the mag-
netic fi elds generated by small ensembles of
Texas A&M University, Electrical and Computer Engineer-ing Department, College Station, TX 77843, USA. E-mail: [email protected]
Published by AAAS
on
Janu
ary
31, 2
013
ww
w.s
cien
cem
ag.o
rgD
ownl
oade
d fr
om

1 FEBRUARY 2013 VOL 339 SCIENCE www.sciencemag.org 530
PERSPECTIVES
Undernutrition—Looking Within for Answers
MICROBIOLOGY
David A. Relman 1, 2
A link between the gut microbiota and conditions of undernutrition point to possible therapeutic
interventions.
nuclear spins. The magnetometer consists of a
single nitrogen-vacancy (NV) color center in
diamond; it can operate at room temperature
in almost any environment ( 6, 7). Previously,
NVs implanted just below the surface of a
bulk diamond have been used to demonstrate
near-single-electron spin detection and crude
one-dimensional imaging for electron spins
outside of the diamond crystal ( 8). However,
imaging of nuclei will be required to observe
the structure and conformations of individual
molecules under ambient conditions.
By implementing different advanced
noise suppression techniques, Mamin et al.
and Staudacher et al. have succeeded in using
near-surface NVs to detect small volumes of
proton spins outside of the diamond crystal.
Both authors conclude that their observed
signals are consistent with a detection volume
on the order of (5 nm)3 or less. This sensitivity
is comparable to that of the cryogenic MRFM
technique and should be adequate for detect-
ing large individual protein molecules. Both
groups also project much smaller detection
volumes in the future by using NVs closer to
the diamond surface. Staudacher et al. expect
to improve sensitivity by using the NV to
spin-polarize the nuclei. Mamin et al. project
that sensitivity may eventually approach the
level of single protons, provided that the NV
coherence time can be kept long enough.
To confi rm that the observed signals indeed
arose from spins outside of the diamond, both
groups cleaned the surface to verify that the
magnetic proton signals disappeared. This
was necessary as single nuclear spins were
already detected up to a few nanometers dis-
tance inside the diamond lattice ( 9), but most
of the envisioned applications require probing
spins in the external environment.
Mamin et al. also observed the temporal
evolution of the probed nuclear spins. This
is only one small step from a fully functional
nano-MRI, because in
conventional MRI, images
are acquired by recording
the time evolution in the
presence of applied mag-
netic fi eld gradients.
The two approaches
have different strengths.
Mamin et al. manipulate
the sample spins with an
additional radiofrequency
fi eld; this approach allows
complex protocols of classic NMR to be
implemented easily. In contrast, Staudacher et
al. use passive spectroscopy, which does not
require an additional radiofrequency fi eld.
If magnetic impurities on the diamond
surface can be sufficiently controlled, it
should be possible to image subnanometer
volumes of nuclear spins. In this case, single-
molecule dynamics like protein folding or
the action of catalysts in chemical reactions
might be observable in real time. Further-
more, if these techniques can be extended to
NVs in nanodiamonds, such processes might
be observable in more interesting ambient
environments like living cells (see the fi g-
ure). In contrast to competing techniques like
fl uorescence resonance energy transfer, the
NV could accomplish this task with a larger
dynamic range and without the need for sepa-
rate labels at each site to be monitored. Such
capability would substantially enhance our
understanding of structural biology and bio-
molecular processes, as well as numerous
additional applications.
References 1. H. J. Mamin et al., Science 339, 557 (2013).
2. T. Staudacher et al., Science 339, 561 (2013).
3. D. Rugar et al., Science 264, 1560 (1994).
4. D. Rugar, R. Budakian, H. J. Mamin, B. W. Chui, Nature
430, 329 (2004).
5. C. L. Degen, M. Poggio, H. J. Mamin, C. T. Rettner, D.
Rugar, Proc. Natl. Acad. Sci. U.S.A. 106, 1313 (2009).
6. G. Balasubramanian et al., Nature 455, 648 (2008).
7. J. R. Maze et al., Nature 455, 644 (2008).
8. B. Grotz et al., New J. Phys. 13, 055004 (2011).
9. P. C. Maurer et al., Science 336, 1283 (2012).
The future of live-cell imaging. In this cartoon of a possible future application of a diamond-based nanoscale MRI-machine, a single NV inside a diamond nanocrystal is used to image a ribosome in the act of transcription inside a live cell. Mamin et al. and Staudacher et al. report a fi rst step toward such a machine by demonstrating detection of protein-sized volumes of nuclear spins under ambient conditions.
10.1126/science.1233222
Undernutrition—a condition resulting
from inadequate intake or assimila-
tion of nutrients—underlies more
than one-third of all deaths worldwide in chil-
dren younger than 5 years of age ( 1). Enteric
infectious disease and undernutrition exac-
erbate and perpetuate each other by means
of impaired innate and adaptive immune
responses. Together they produce an insidi-
ous condition called environmental enteropa-
thy in which damaged gut mucosal architec-
ture and function are associated with malab-
sorption, dysregulation of mucosal perme-
ability, and infl ammation. This vicious cycle
leaves approximately one-fi fth of children in
the world stunted, and leads to a wide range
of continuing health and developmental prob-
lems, possibly including cognitive impair-
ment and metabolic syndrome in adulthood
( 2). Maternal malnutrition brings about mal-
nutrition in their children [shockingly, nearly
one-third of women in Bangladesh ( 3), as
well as in other countries with similar levels
of poverty, suffer from this condition]. These
multiple, interwoven, and mutually reinforc-
ing factors pose major challenges for efforts
to address this situation. On page 548 of this
issue, Smith et al. ( 4) show, with the use of
an animal model, that the gut microbiota is
involved in propagating a form of severe
1Departments of Medicine and of Microbiology and Immu-nology, Stanford University School of Medicine, Stanford, CA 94305, USA. 2Veterans Affairs Palo Alto Health Care System, Palo Alto, CA 94304, USA. E-mail: [email protected]
Published by AAAS
on
Janu
ary
31, 2
013
ww
w.s
cien
cem
ag.o
rgD
ownl
oade
d fr
om

www.sciencemag.org SCIENCE VOL 339 1 FEBRUARY 2013 531
PERSPECTIVES
acute undernutrition called kwashiorkor
(see the fi gure). Like previous data linking
the microbiota with obesity ( 5), these fi nd-
ings are remarkable. They also provide hope,
in that by understanding the role of the gut
microbiota in undernutrition, we can devise
new ecologically inspired strategies for cor-
recting this problem.
Smith et al. recruited 317 twin pairs in
rural southern Malawi and followed them
with periodic fecal sampling until they
were 3 years of age. They selected 13 same-
gender twin pairs that were discordant for
kwashiorkor and 9 twin pairs that were
well-nourished, and then characterized their
fecal microbiomes. Twin pairs with kwashi-
orkor were treated with ready-to-use “thera-
peutic food” for a mean duration of 9 weeks.
By relying on the same-gender mono- and
dizygotic twin pairs (genetically identical
twins and fraternal twins, respectively),
they could isolate the impact of genetics
and household environment.
A key fi nding of Smith et al. is that the
overall gene content (which generally pre-
dicts functions) of the fecal microbiota in the
kwashiorkor-affl icted children, in contrast to
that of the well-nourished children, fails to
develop with increasing age, even with the
use of therapeutic food. Although there was
an initial change in the gene content of the
microbiota with initiation of therapeutic food,
it was not sustained. The latter fi nding is dis-
appointing but not surprising, given the many
other determinants (besides diet) of the “fi t-
ness landscape” of the gut (that is, the like-
lihood of community stability under a vari-
ety of ecosystem conditions). To clarify the
role of the gut microbiota in determining host
nutritional state, as well as to tease apart the
contributions of diet and microbiota, Smith
et al. collected fecal microbial communities
from three discordant twin pairs at the time of
kwashiorkor diagnosis and transferred them
into germ-free mice. The mice were fed a diet
based on the typical foods of these human
donors in Malawi. Two of the three groups of
mice that received microbiota from a kwash-
iorkor-affected twin lost weight, but only if
they were fed a diet based on the typical foods
of these Malawian donors. Mice that received
microbiota from a healthy sibling, or fed stan-
dard mouse chow, did not lose weight. A sub-
sequent 2 weeks of treatment with therapeu-
tic food produced weight gain in all groups
of mice, and a return to the Malawian diet
again led to weight loss in the recipients of
the kwashiorkor microbiota. Meaningful
changes in fecal taxonomic, gene, and metab-
olite content accompanied these transplanta-
tions and dietary shifts in the recipient mice.
Abundance of bifi dobacteria and lactobacilli,
as well as amounts of essential and nonessen-
tial amino acids in fecal samples, increased
in mice that received kwashiorkor microbiota
during administration of therapeutic food,
albeit temporarily. Notably, in mice harbor-
ing a kwashiorkor microbiota that were fed
a Malawian diet, analysis of urinary metabo-
lite abundance and microbiome composition
revealed inhibition of the tricarboxylic acid
cycle (indicative of impaired cellular metab-
olism and energy production of the host).
In general, the data reinforce the concept of
host-microbiota cometabolism; however,
additional human subjects with kwashiorkor
and other forms of undernutrition should be
studied to confi rm these fi ndings.
The fi ndings of Smith et al. are a reminder
that isolated factors, such as individual
microbes or even entire microbial commu-
nities, alone cannot explain complex pheno-
types such as undernutrition, and that correc-
tion of these phenotypes will require a coor-
dinated system-wide approach. Modifica-
tion of the gut microbiota may improve the
nutritional state of individuals with kwashi-
orkor, but accomplishing this will not be
easy. Genetic determinants of the host that
impact microbiota composition and function
are just beginning to be identifi ed ( 6, 7). For
example, murine angiotensin I converting
enzyme 2 (ACE2), a key regulatory enzyme
of the renin-angiotensin system (which con-
trols blood pressure and fl uid balance), was
unexpectedly linked with tryptophan absorp-
tion in the small intestine and activation of the
signaling protein mammalian target of rapa-
mycin (mTOR), which in turn triggered the
expression of small antimicrobial peptides in
the gut ( 8). Further, tryptophan defi ciency led
to diminished antimicrobial peptide expres-
sion, altered microbiota taxonomic composi-
Malabsorption
Wellnourished
Enteric infections
Impaired immuneresponses
Alteredmicrobiota
Dysregulated gutpermeability
Inadequatedietary intake
Vicious cycle of undernutrition
Therapeuticfood alone Under-
nourished
CR
ED
IT: (D
RA
WIN
G) K
. S
UT
LIF
F/S
CIE
NC
E; (P
HO
TO
) L
YLE
CO
NR
AD
Nutritional state. A child suffering from undernutrition (the condition kwashiorkor) is shown. The dia-gram (lower right) shows the interplay between factors that sustain a state of undernutrition. An ecologi-cal fi tness landscape of the human-microbial ecosystem (upper right) illustrates how there are deep stabil-ity “domains”(or “basins of attraction”) associated with undernutrition and overnutrition; other stability domains are associated with more healthy nutritional states. Therapeutic food alone is insuffi cient to induce a sustained shift in the gut ecosystem state (solid red arrow) that would cause an undernourished individual to achieve a more healthy nutritional state (dashed red arrow). Correction of this self-propagating condition will require multiple, concurrent measures to remold the environmental landscape of the host gut, thereby inducing a shift toward a gut microbiome with more effi cient nutrient utilization (energy harvest) and fewer intrinsic proinfl ammatory properties.
Published by AAAS
on
Janu
ary
31, 2
013
ww
w.s
cien
cem
ag.o
rgD
ownl
oade
d fr
om

1 FEBRUARY 2013 VOL 339 SCIENCE www.sciencemag.org 532
PERSPECTIVES
Measuring Mass in Seconds
PHYSICS
John E. Debs, Nicholas P. Robins, John D. Close
An atom interferometer and an optical frequency comb measure the Compton frequency of a cesium atom, creating a “clock” that weighs atoms.
For centuries, humans have measured
time by counting oscillations of
highly regular periodic motion—the
Sun, a pendulum, or a quartz crystal, for
example. During the past 50 years, we have
chosen to use the electromagnetic oscilla-
tions, which drive absorption in an atom—a
highly stable and universal frequency refer-
ence. Such atomic clocks defi ne the SI sec-
ond via an atomic resonance in cesium ( 1).
The second is the most precisely defi ned
physical unit. Although it may seem obvi-
ous now, making the leap from performing
precise spectroscopy on the atomic structure
of cesium to using its atomic structure as
a precise reference to stabilize other oscil-
lators was profound. On page 554 of this
issue, Lan et al. ( 2) make an analogous dis-
tinction between performing momentum-
spectroscopy on a recoiling atom, and using
that spectroscopy to stabilize an oscillator,
effectively locking a clock to the mass of a
particle. This result has important implica-
tions for fundamental physics and precision
measurement, and could play a role in a new
defi nition of the kilogram.
Einstein’s theory of relativity gives us the
equivalence of energy and mass, while quan-
tum mechanics links energy and frequency.
Thus, there is, at least theoretically, a direct
link between a particle’s rest mass and time,
expressed by the Compton frequency ωc =
mc2/ħ. Here, m is the rest mass of the par-
ticle, c is the speed of light, and ħ is Planck’s
constant h divided by 2π. For an atom such
as cesium, ωc is on the order of 1025 Hz—
an extremely high frequency to attempt to
access experimentally. Strictly speaking,
because a quantum state evolves at a rate
directly proportional to its energy, ωc will
contribute to its evolution.
A frequently appearing quantity in quan-
Department of Quantum Science, Research School of Phys-ics and Engineering, The Australian National University, Canberra, ACT 0200, Australia. E-mail: [email protected]; [email protected]; [email protected]
tion, and an enhanced propensity for infl am-
mation in the colon. It could be that human
genetic variation in ACE2 function or expres-
sion is associated with distinct physiological
states of the gut epithelium as well as with
distinct microbiota compositions in the gut;
these variable factors may affect the absorp-
tive function of the epithelium, with implica-
tions for the host nutritional state.
The history of environmental exposures
and health status of a woman before and dur-
ing pregnancy affect the intrauterine develop-
ment of her child, as well as her own micro-
biota—which in turn is transmitted to her
child at birth. In the setting of this inherited
history, early postnatal exposures to enteric
pathogens with subsequent inflammatory
responses in the gut, altered immune system
development, and damaged intestinal barrier
function, as well as antibiotic use, insuffi -
cient food intake, and macro- and micronu-
trient defi ciencies, all conspire to produce an
ecological fi tness landscape in the host with
strong undernutrition-associated stability
domains, and high barriers preventing shifts
to health-associated states. Signaling within
the microbiota, and between it and the host,
can perpetuate this pathologic state.
Thus, the challenge in ecological terms
is to devise a strategy for altering the fi tness
landscape in such a manner as to favor tran-
sitions to health-associated stable states ( 9).
Indeed, there are multiple possible points
of attack. Possible therapeutic approaches
include delivery of def ined microbial
strains—either alone or as collectives—
key nutrients for host and microbiota, mol-
ecules that exploit microbiota-host signaling
or trigger self-regenerative responses in the
gut mucosa and epithelia, and modulators
of mucosal immune function. The degree
to which these approaches should be indi-
vidualized for different subjects and clinical
settings is not yet clear, nor are the means
by which the resulting benefi cial effects can
be made to persist. But we are well on our
way toward the kind of detailed understand-
ing of the human microbial ecosystem and
its molecular and physiological features that
will be necessary to enable the design and
testing of these approaches.
References and Notes 1. United Nations Children’s Fund, “Tracking Progress on Child
and Maternal Nutrition” (UNICEF, New York, 2009). 2. R. L. Guerrant, M. D. Deboer, S. R. Moore, R. J. Scharf,
A. A. Lima, Nat. Rev. Gastroenterol. Hepatol. 10.1038/nrgastro.2012.239 (2012).
3. T. Ahmed et al., J. Health Popul. Nutr. 30, 1 (2012). 4. M. I. Smith et al., Science 339, 548 (2013). 5. P. J. Turnbaugh et al., Nature 444, 1027 (2006). 6. T. Ahmed, R. Haque, A. M. Shamsir Ahmed, W. A. Petri Jr.,
A. Cravioto, Nutr. Rev. 67 (suppl. 2), S201 (2009). 7. B. W. Parks et al., Cell Metab. 17, 141 (2013). 8. T. Hashimoto et al., Nature 487, 477 (2012). 9. E. K. Costello et al., Science 336, 1255 (2012).
Acknowledgments: D.A.R. is supported by NIH Pioneer Award DP1OD000964, NIH–National Institute of General Medi-cal Sciences 1R01GM099534-01, and by the Thomas C. and Joan M. Merigan Endowment at Stanford University. There are no confl icts of interest.
10.1126/science.1234723
Reference oscillator
Frequency comb
133Cs
hk hk
Locking a “Compton clock.” A schematic representation of the experiment of Lan et al., in which an atom interferometer measures the recoil frequency of a cesium-133 atom with lasers locked to a known frequency-comb line. This method ensures that the recoil frequency is a defi ned fraction of the Compton frequency of the atom. This signal stabilizes a reference oscillator, which is the reference for all frequencies in the system, including the frequency comb itself. In this way, a clock is locked to the mass of an atom.
Published by AAAS
on
Janu
ary
31, 2
013
ww
w.s
cien
cem
ag.o
rgD
ownl
oade
d fr
om
www.sciencemag.org SCIENCE VOL 339 1 FEBRUARY 2013 533
PERSPECTIVES
tum theory is the ratio h/m, measurement
of which can be thought of as a determi-
nation of ωc (scaled by c2). In recent years,
h/m experiments have become an important
independent measurement of the fi ne struc-
ture constant α because h/m is the least well-
known quantity in its defi nition: α = (2R∞/c)
(h/m)(m/me), where me is the electron mass
and R∞ is the Rydberg constant. Indepen-
dent measurements of α are tests of quantum
electrodynamics, and there has been substan-
tial work on measuring α with atom interfer-
ometers ( 3– 5).
In an atom interferometer, matter waves
are split and recombined by using pulses of
light. Counterpropagating laser beams stim-
ulate the absorption and emission of a pho-
ton, transferring a well-defi ned momentum
to the atom. For two laser beams with the
same frequency, the momentum transferred
is 2ħk, where k is the wave number of the
light (the reciprocal of its wavelength times
2π) ( 6). Thus, the recoil energy of the atom is
given by E = 4ħ2k2/2m = 4ħωr, where ωr is the
photon recoil frequency. Because the phase
of the matter wave evolves according to this
energy, the interferometer phase is propor-
tional to ωr ( 5, 7, 8), and such a device can
be thought of as a momentum spectrometer,
provided the particle’s mass is known. This
simplifi ed description of an atom-interfero-
metric measurement of the recoil frequency
is nonrelativistic. More importantly, knowl-
edge of the laser wave number allows the
value for h/m to be extracted from the mea-
sured recoil frequency.
Alternatively, in a relativistic descrip-
tion, the phase evolution of a matter wave
is proportional to the mass-energy, and the
phase shift of the interferometer is given
by ∆φ = 2ωcT(γ−1 − 1). Here, T is the time
it takes for the matter wave pulse to move
between the beamsplitter and mirror pulses
of the interferometer, and γ−1 = (1 − v2/c2)1/2
is the inverse Lorentz factor from special
relativity. The recoil velocity imparted to the
atoms, v, is determined by the photon wave
number, k. Although atomic recoil veloci-
ties in experimentally realizable regimes
are on the order of centimeters per second,
well below the speed of light, the relativis-
tic effect of time dilation can be viewed as
the source of the interferometer phase shift.
In the extreme relativistic limit where v →
c, the interferometer phase develops at the
full Compton frequency, and the relativistic
description elucidates how a measurement
of h/m can be interpreted as a measurement
of ωc. However, such a measurement still
requires an independent determination of
the laser wave number.
Lan et al. run an experiment confi gured
similarly to an h/m measurement, the differ-
ence being that they have eliminated the laser
frequency as a free variable in their system by
using a frequency comb. A frequency comb
is an optical “ruler” in frequency space that
enables an absolute measurement of opti-
cal frequencies ( 9). The laser that drives the
recoiling atoms is locked to a chosen comb
line, and the interferometer signal becomes
directly proportional to a defi ned fraction of
the Compton frequency. A common oscilla-
tor, used to derive all frequencies for the sys-
tem, is then stabilized directly to the interfer-
ometer signal (see the fi gure).
By defining the ratio of the laser fre-
quency to ωr via the comb, all quantities in
the interferometer signal are now defined
except for mass. Thus, the system locks the
common oscillator—a clock—to the mass
of an atom. An h/m experiment measures
the energy of a recoiling atom as a function
of its momentum, a quantity that depends
on its mass. This experiment is subtly dif-
ferent from that of Lan et al., which uses
this measurement to stabilize an oscillator.
This method is a direct analogy to stabiliz-
ing an oscillator by using the spectroscopy
of cesium, in contrast to measuring the spec-
troscopy of cesium. By linking time to the
mass of an atom, the “Compton clock” has
intriguing prospects for the measurement of
time and defi nition of the kilogram.
References
1. T. P. Heavner, S. R. Jefferts, E. A. Donley, J. H. Shirley,
T. E. Parker, Metrologia 42, 411 (2005).
2. S.-Y. Lan et al., Science 339, 554 (2013); 10.1126/
science.1230767.
3. D. S. Weiss, B. C. Young, S. Chu, Appl. Phys. B 59, 217
(1994).
4. H. Müller, S. W. Chiow, Q. Long, C. Vo, S. Chu, Appl.
Phys. B 84, 633 (2006).
5. R. Bouchendira, P. Cladé, S. Guellati-Khélifa, F. Nez,
F. Biraben, Phys. Rev. Lett. 106, 080801 (2011).
6. M. A. Kasevich, S. Chu, Phys. Rev. Lett. 67, 181 (1991).
7. Ch. J. Bordé, Phys. Lett. A 140, 10 (1989).
8. H. Müller, S. W. Chiow, Q. Long, S. Herrmann, S. Chu,
Phys. Rev. Lett. 100, 180405 (2008).
9. J. L. Hall, T. W. Hänsch, Femtosecond Optical Frequency
Comb Technology: Principle, Operation and Application
(Springer Science Business Media, Dordrecht, Nether-
lands, 2005).
10.1126/science.1232923
Carbon Cycle Makeover
GEOCHEMISTRY
Donald E. Canfi eld 1 and Lee R. Kump 2
Enhanced levels of anaerobic respiration processes may explain oscillations in Earth’s carbon cycle.
In 1845, the French chemist and mining
engineer Jacques-Joseph Ebelman fig-
ured out why Earth’s atmosphere contains
oxygen ( 1). Oxygen is produced by plants
during photosynthesis, but almost all of this
oxygen is used again in respiration. Ebelman
reasoned that small amounts of organic mat-
ter remaining in sediments after respiration
leave a residual of oxygen in the atmosphere.
The source of oxygen to the atmosphere
represented by organic matter burial is bal-
anced by oxygen sinks associated with rock
weathering and chemical reaction with vol-
canic gases. This is the long-term carbon and
oxygen geochemical cycle. But Earth is an
old planet, and oxygen levels have changed
through time ( 2). On page 540 of this issue,
Schrag et al. ( 3) challenge the most com-
monly used geochemical approach to assess
long-term changes in the coupled oxygen and
carbon cycles.
High on the list of factors controlling
oxygen levels is the burial rate of organic
carbon into sediments through time.
Decades ago, geochemists began to mea-
sure the carbon isotope distributions in plant
organic matter and in carbonate minerals in
modern and ancient marine sediments ( 4).
They found that the carbon isotope ratios
differed between organic and inorganic car-
bon. To a fi rst approximation, these differ-
ences could be explained by a preferential
incorporation of 12C atoms over 13C atoms
into organic matter during photosynthe-
sis. Patterns in the isotopic compositions of
both inorganic and organic carbon species
through geologic time provide clues to the
burial history of organic carbon.
These patterns are normally interpreted
through a very simple mass balance (see the
fi gure, panel A). Rock-weathering–derived
carbon enters the ocean from rivers in inor-
ganic form, with a δ13C usually taken as the
average for Earth crust. Carbon exits into
sediments in inorganic form as carbonate
minerals and also as organic carbon. The
1Nordic Center for Earth Evolution, University of Southern Denmark, Odense, 5230 Denmark. 2Department of Geosci-ences, Penn State University, University Park, PA 16802, USA. E-mail: [email protected], [email protected]
Published by AAAS
on
Janu
ary
31, 2
013
ww
w.s
cien
cem
ag.o
rgD
ownl
oade
d fr
om

1 FEBRUARY 2013 VOL 339 SCIENCE www.sciencemag.org 534
PERSPECTIVES
organic carbon has a lower δ13C than
the inorganic carbon by an amount
depending on the fractionation of
isotopes during photosynthesis.
However, the combined isotopic
composition of the inorganic and
organic carbon leaving the oceans
must equal the isotopic composition
of the inorganic carbon entering it.
Thus, if a large amount of organic
carbon is buried, removing a lot of
carbon with low δ13C, the δ13C of
the inorganic carbon removed must
be high. In contrast, if little organic
carbon is buried, the δ13C in the inor-
ganic carbon should approach that
of the carbon entering the oceans.
Using this approach, rates of organic
carbon burial, and thus oxygen lib-
eration to the atmosphere, have been
inferred through geologic time.
As Schrag et al. highlight, how-
ever, the carbon isotope record is
not always so easy to explain. This
is particularly true in Precambrian
rocks that show large and long-term
enrichments in the δ13C of carbon-
ate minerals. With the traditional
model, these events require massive
amounts of organic carbon burial,
liberating huge amounts of oxygen
to the atmosphere. But what trig-
gered these extreme carbon cycling
events, how were they sustained, and
where is the independent geochemi-
cal evidence that they occurred?
Equally troubling are very
strong depletions in the δ13C of carbonate
minerals ( 5, 6). These depletions can extend
to values less than the weathering input and
are thus impossible to explain within the tra-
ditional carbon mass-balance model. Expla-
nations for these isotope deviations have
therefore focused on short-term events, such
as the massive oxidation of 13C-depleted
dissolved organic matter or methane, or
the preferential weathering of 13C-depleted
organic material from land. In another set of
explanations, the carbon isotopes could have
been affected by late-stage processes within
Earth with no relation to ocean chemistry.
None of these explanations have gained uni-
versal acceptance ( 6).
Schrag et al. provide a clever explanation
for both the positive and the negative carbon
isotope excursions. They argue that on an
Earth with much less oxygen than today—
as was likely during the Precambrian—the
decomposition of organic matter in sedi-
ments by anaerobic respiration processes
like sulfate and iron reduction would boost
carbonate alkalinity to the point where car-
bonate minerals (known as authigenic car-
bonates) would readily form. Because this
alkalinity was generated from oxidation of 13C-depleted organic matter or methane, the
carbonate formed would also be 13C-depleted
and very different in isotopic composition
than carbonates formed in surface seawa-
ter, from which the carbon isotope record is
mostly constructed.
In this scenario, large increases in the δ13C
of inorganic carbon, as revealed from surface
seawater carbonates, resulted not from high
organic carbon burial rates but rather from
enhanced burial of 13C-depleted authigenic
carbonates (see the fi gure, panel B). Like-
wise, highly 13C-depleted inorganic carbon
values were either caused by a reduced depo-
sition rate of authigenic carbonates or are a
direct record of the 13C-depleted authigenic
carbonates themselves.
With this view of the carbon cycle,
the carbon isotope record loses its link to
organic carbon burial and oxygen liberation
to the atmosphere. The implications
are huge.
There are, however, some impor-
tant issues to consider. First, sulfate
reduction and iron reduction domi-
nate organic carbon mineralization
in modern sediments where organic
carbon burial is rapid ( 7). These sed-
iments generate considerable car-
bonate alkalinity ( 8), but only small
amounts of authigenic carbonate are
formed on a global scale ( 3). It is
not clear how these processes would
have produced much more authi-
genic carbonate in the past, par-
ticularly because modern systems
exposed to little oxygen produce
only small amounts of authigenic
carbonate minerals ( 8).
Second, if the model proposed
by Schrag et al. is correct, authi-
genic carbonate production dur-
ing the large positive δ13C excur-
sions should be widely preserved
in organic-rich sediments. We
should actively search for these. The
large negative δ13C excursions, if
they record authigenic carbonates,
require that enormous amounts of
organic matter have been converted
to inorganic carbon. However, many
rocks housing these excursions con-
tain very little organic matter ( 9), not
obviously consistent with the large
amounts of organic matter diagene-
sis required by Schrag et al.’s model.
Finally, the large negative δ13C excursions
of the late Precambrian provide well-defi ned
and globally coherent isotope events ( 6),
yet sediment diagenetic reactions are highly
variable in space and time. It remains to be
shown how a globally coherent pattern can
result from these processes. Nonetheless,
new ideas take time to mature, and Schrag
et al. have brought a fresh new approach to
solving some puzzling problems with our
understanding of the carbon cycle.
References
1. J. J. Ebelman, Ann. des Mines 7, 3 (1845). 2. L. R. Kump, Nature 451, 277 (2008). 3. D. P. Schrag et al., Science 339, 540 (2013). 4. H. Craig, Geochim. Cosmochim. Acta 3, 53 (1953). 5. L. R. Kump et al., Science 334, 1694 (2011). 6. J. P. Grotzinger, D. A. Fike, W. W. Fischer, Nat. Geosci. 4,
285 (2011). 7. D. E. Canfi eld, E. Kristensen, B. Thamdrup, Aquatic
Geomicrobiology (Academic Press, New York, 2005). 8. C. E. Reimers, K. C. Ruttenberg, D. E. Canfi eld, M. B.
Christiansen, J. B. Martin, Geochim. Cosmochim. Acta 60, 4037 (1996).
9. D. T. Johnston, F. A. Macdonald, B. C. Gill, P. F. Hoffman, D. P. Schrag, Nature 483, 320 (2012).
Organic
carbon
Inorganic carbon in oceans and atmosphere
Conventional modelA
δ13C
Carbonate
sediments
Weathering
input
–25 –5 0
Organic
carbon
Inorganic carbon in oceans and atmosphere
Schrag et al. modelB
δ13C
Carbonate
sediments
Weathering
input
Authigenic
carbonate
–20 –5 50
Carbon burial reconsidered. In the traditional model (A), carbon loss through organic carbon and carbonate burial balances carbon input from continental weathering. Arrow sizes approximate the relative sizes of the input and output fl uxes. The more carbon is lost through organic matter burial, the greater the δ13C of the carbonate output. Schrag et al. now propose a third output fl ux through authigenic carbonate formation (B). This removal pathway is δ13C-depleted compared to the weathering input, and changes in its fl ux can change the δ13C of carbonate sediments with no change in the organic carbon burial fl ux.
10.1126/science.1231981
Published by AAAS
on
Janu
ary
31, 2
013
ww
w.s
cien
cem
ag.o
rgD
ownl
oade
d fr
om

Carbon Nanotubes: Present and FutureCommercial ApplicationsMichael F. L. De Volder,1,2,3* Sameh H. Tawfick,4,5 Ray H. Baughman,6 A. John Hart4,5*
Worldwide commercial interest in carbon nanotubes (CNTs) is reflected in a production capacity that presentlyexceeds several thousand tons per year. Currently, bulk CNT powders are incorporated in diverse commercialproducts ranging from rechargeable batteries, automotive parts, and sporting goods to boat hulls and waterfilters. Advances in CNT synthesis, purification, and chemical modification are enabling integration of CNTsin thin-film electronics and large-area coatings. Although not yet providing compelling mechanical strength orelectrical or thermal conductivities for many applications, CNT yarns and sheets already have promisingperformance for applications including supercapacitors, actuators, and lightweight electromagnetic shields.
Carbon nanotubes (CNTs) are seamless cyl-inders of one or more layers of graphene(denoted single-wall, SWNT, ormultiwall,
MWNT), with open or closed ends (1, 2). PerfectCNTs have all carbons bonded in a hexagonal lat-tice except at their ends, whereas defects in mass-produced CNTs introduce pentagons, heptagons,and other imperfections in the sidewalls that gen-erally degrade desired properties. Diameters ofSWNTs and MWNTs are typically 0.8 to 2 nmand 5 to 20 nm, respectively, although MWNT di-ameters can exceed 100 nm. CNT lengths rangefrom less than 100 nm to several centimeters, there-by bridging molecular and macroscopic scales.
When considering the cross-sectional area of theCNT walls only, an elastic modulus approaching1 TPa and a tensile strength of 100 GPa has beenmeasured for individualMWNTs (3). This strength isover 10-foldhigher than any industrial fiber.MWNTsare typically metallic and can carry currents of upto 109 A cm–2 (4). Individual CNTwalls can be me-tallic or semiconductingdependingon theorientationof the graphene lattice with respect to the tube axis,which is called the chirality. Individual SWNTs canhave a thermal conductivity of 3500 W m−1 K−1 atroom temperature, based on the wall area (5); thisexceeds the thermal conductivity of diamond.
The beginning of widespread CNT researchin the early 1990s was preceded in the 1980s bythe first industrial synthesis of what are now knownas MWNTs and documented observations of hol-low carbon nanofibers as early as the 1950s. How-ever, CNT-related commercial activity has grownmost substantially during the past decade. Since2006, worldwide CNT production capacity hasincreased at least 10-fold, and the annual numberof CNT-related journal publications and issuedpatents continues to grow (Fig. 1).
Most CNT production today is used in bulkcomposite materials and thin films, which rely onunorganizedCNTarchitectures having limited prop-erties. Organized CNTarchitectures (fig. S1) suchas vertically aligned forests, yarns, and sheets showpromise to scale up the properties of individualCNTs and realize new functionalities, includingshape recovery (6), dry adhesion (7), high damp-ing (8, 9), terahertz polarization (10), large-strokeactuation (11, 12), near-ideal black-body ab-sorption (13), and thermoacoustic sound emis-sion (14).
However, presently realizedmechanical, ther-mal, and electrical properties of CNT macrostruc-tures such as yarns and sheets remain significantlylower than those of individual CNTs.
Meanwhile, buoyed by large-volume bulk pro-duction, CNT powders have already been incorpo-rated inmany commercial applications and are nowentering the growth phase of their product life cy-cle. In view of these trends, this review focuses onthe most promising present and future commercialapplications of CNTs, alongwith related challengesthat will drive continued research and development.Lists of known industrial activity and commercialproducts are given in tables S1 through S3.
CNT Synthesis and ProcessingChemical vapor deposition (CVD) is the domi-nant mode of high-volume CNT production andtypically uses fluidized bed reactors that enableuniform gas diffusion and heat transfer to metalcatalyst nanoparticles (15). Scale-up, use of low-cost feedstocks, yield increases, and reductionof energy consumption and waste production (16)have substantially decreasedMWNT prices. How-ever, large-scale CVDmethods yield contaminantsthat can influence CNT properties and often re-quire costly thermal annealing and/or chemicaltreatment for their removal. These steps can in-troduce defects in CNT sidewalls and shortenCNT length. Currently, bulk purified MWNTs aresold for less than $100 per kg,which is 1- to 10-foldgreater than commercially available carbon fiber.
The understanding of CVD process conditionshas enabled preferential synthesis of metallic (17)or semiconducting SWNTs (18) with selectivity of90 to 95%, doping of CNTs with boron or nitrogen
REVIEW
1imec, 3001 Heverlee, Belgium. 2Department of Mechanical En-gineering, KULeuven, 3000 Leuven, Belgium. 3School of En-gineering and Applied Sciences, Harvard University, Cambridge,MA 02138, USA. 4Department of Mechanical Engineering,University of Michigan, Ann Arbor, MI 48109, USA. 5Depart-ment of Mechanical Engineering, Massachusetts Institute ofTechnology, Cambridge, MA 02139, USA. 6The Alan G.MacDiarmid NanoTech Institute and Department of Chemistry,University of Texas at Dallas, Richardson, TX 75083, USA.
*To whom correspondence should be addressed. E-mail: [email protected] (M.F.L.D.V.); [email protected] (A.J.H.)
Issued patents
CNT productioncapacity
24 5
4
3
2
1
0
20
16
12
8
4
02004 2005 2006 2007 2008 2009 2010 2011
An
nu
al p
ub
licat
ion
s o
r p
aten
ts (
÷100
0) Pro
du
ction
capacity (kilo
ton
/year)
CNTGraphene
Publications
CNT Graphene
Estimated Confirmed
Winning Tour de Francebicycle uses CNT
composite
Ship hull coated withantifouling CNT paint
Printed CNT transistorson polymer film
Juno spacecraft usesCNT ESD shield
B C D E
A
Fig. 1. Trends in CNT research and commercialization. (A) Journal publications and issued worldwide patentsper year, along with estimated annual production capacity (see supplementarymaterials). (B to E) Selected CNT-related products: composite bicycle frame [Photo courtesy of BMC Switzerland AG], antifouling coatings[Courtesy of NanoCyl], printed electronics [Photo courtesy of NEC Corporation; unauthorized use not permitted];and electrostatic discharge shielding [Photo courtesy of NanoComp Technologies, Incorporated].
www.sciencemag.org SCIENCE VOL 339 1 FEBRUARY 2013 535
on
Janu
ary
31, 2
013
ww
w.s
cien
cem
ag.o
rgD
ownl
oade
d fr
om

(19, 20), and flow-directed growth of isolatedSWNTs up to 18.5 cm long (21). However, im-proved knowledge is urgently needed of howCNTchirality, diameter, length, and purity relate to cat-alyst composition and process conditions. In situobservation of CNTnucleation (22) andmolecularmodeling of the CNT-catalyst interface (23) will becritical to advances in chirality-selective synthesis.
Alternatively, high-purity SWNT powders canbe separated according to chirality by density-gradient centrifugation in combinationwith selectivesurfactant wrapping (24) or by gel chromatog-raphy (25). Althoughmany CNT powders and sus-pensions are available commercially, the productionof stableCNTsuspensions requires chemicalmod-ification of the CNT surface or addition of surfac-tants. Washing or thermal treatment is typicallyneeded to remove surfactants after deposition ofthe solution, such as by spin-coating or printing.
Moreover, because SWNTsynthesis by CVDrequiresmuch tighter process control thanMWNTsynthesis and because of legacy costs of researchand process development, bulk SWNT prices arestill orders of magnitude higher than for MWNTs.Use of MWNTs is therefore favored for applica-tions where CNT diameter or bandgap is not crit-ical, but most emerging applications that requirechirality-specific SWNTs need further price re-duction for commercial viability.
Alternatively, synthesis of long, aligned CNTsthat can be processedwithout the need for dispersionin a liquidoffers promise for cost-effective realizationof compelling bulk properties. These methods in-clude self-aligned growth of horizontal (26) and ver-tical (27) CNTs on substrates coated with catalystparticles and production of CNT sheets and yarnsdirectly from floating-catalyst CVD systems (28).CNTforests canbemanipulated intodense solids (29),aligned thin films (30), and intricate three-dimensional(3D) microarchitectures (31) and can be directlyspun or drawn into long yarns and sheets (32, 33).
Composite MaterialsMWNTs were first used as electrically conduc-tive fillers in plastics, taking advantage of theirhigh aspect ratio to form a percolation networkat concentrations as low as 0.01 weight percent(wt %). Disordered MWNT-polymer compositesreach conductivities as high as 10,000 S m–1 at10 wt % loading (34). In the automotive in-dustry, conductive CNT plastics have enabledelectrostatic-assisted painting of mirror housings,as well as fuel lines and filters that dissipate elec-trostatic charge. Other products include electro-magnetic interference (EMI)–shielding packagesand wafer carriers for the microelectronics industry.
For load-bearing applications, CNT powdersmixed with polymers or precursor resins can in-crease stiffness, strength, and toughness (35). Add-ing ~1 wt % MWNT to epoxy resin enhancesstiffness and fracture toughness by 6 and 23%, re-spectively, without compromising other mechan-ical properties (36). These enhancements dependon CNT diameter, aspect ratio, alignment, disper-sion, and interfacial interaction with the matrix.
Many CNT manufacturers sell premixed resinsand master batches with CNT loadings from 0.1to 20 wt %. Additionally, engineering nanoscalestick-slip among CNTs and CNT-polymer contactscan increase material damping (37), which is usedto enhance sporting goods, including tennis rac-quets, baseball bats, and bicycle frames (Fig. 1C).
CNT resins are also used to enhance fibercomposites (35, 38). Recent examples includestrong, lightweight wind turbine blades and hullsfor maritime security boats that are made by usingcarbon fiber composite with CNT-enhanced resin(Fig. 2A) and composite wind turbine blades. CNTscan also be deployed as additives in the organicprecursors used to form carbon fibers. The CNTsinfluence the arrangement of carbon in the py-rolyzed fiber, enabling fabrication of 1-mm diam-eter carbon fibers with over 35% increase in strength(4.5 GPa) and stiffness (463 GPa) compared withcontrol samples without CNTs (39).
Toward the challenge of organizing CNTs atlarger scales, hierarchical fiber composites havebeen created by growing aligned CNTs forests ontoglass, SiC, alumina, and carbon fibers (35, 40, 41),creating so-called “fuzzy” fibers. Fuzzy CNT-SiCfabric impregnated with epoxy showed crack-opening (mode I) and in-plane shear interlaminar(mode II) toughnesses that are enhanced by 348and 54%, respectively, comparedwith control spec-imens (40), and CNT-alumina fabric showed 69%improvedmode II toughness (41).Multifunctionalapplications under investigation include lightning-strike protection, deicing, and structural health mon-itoring for aircraft (35, 40).
In the long run, CNTyarns and laminated sheetsmade by direct CVDor forest spinning or drawingmethodsmay competewith carbon fiber for high-enduses, especially in weight-sensitive applications re-quiring combined electrical and mechanical func-tionality (Figs. 1E and 2B). In scientific reports, yarnsmade fromhigh-quality few-walledCNTshave reacheda stiffness of 357 GPa and a strength of 8.8 GPa butonly for a gauge length that is comparable to themillimeter-longCNTswithin theyarn (28).Centimeter-scale gauge lengths showed 2-GPa strength, corre-sponding to a gravimetric strength equaling thatof commercially available Kevlar (DuPont).
Because the probability of a critical flaw in-creases with volume, macroscale CNTyarns maynever achieve the strength of the constituent CNTs.However, the high surface area of CNTs may pro-vide interfacial coupling that mitigates these defi-ciencies, and, unlike carbon fibers, CNTyarns canbe knotted without degrading their strength (32).Further, coating forest-drawnCNTsheetswith func-tional powder before inserting twist has providedweavable, braidable, and sewable yarns containingup to 95 wt % powder, which have been demon-strated as superconducting wires, battery and fuelcell electrodes, and self-cleaning textiles (42).
High-performance fibers of aligned SWNTs canbemade by coagulation-based spinning of CNTsus-pensions (43). This is attractive for scale-up if thecost of high-quality SWNTs decreases substantiallyor if spinning can be extended to low-costMWNTs.Thousands of spinnerets could operate in parallel,and CNT orientation can be achieved via liquidcrystal formation, like for the spinning of Kevlar.
Material design Example application
Boat hull
Coax cable
EM shieldSheet Yarn
CN
T-fi
ber
lam
inat
eC
NT
yar
ns
and
sh
eets
A
B
Fig. 2. EmergingCNT composites andmacrostructures. (A)Micrograph showing the cross section of a carbon fiberlaminate with CNTs dispersed in the epoxy resin and a lightweight CNT-fiber composite boat hull for maritimesecurity boats. [Images courtesy of Zyvex Technologies] (B) CNT sheets and yarns used as lightweight data cablesand electromagnetic (EM) shielding material. [Images courtesy of Nanocomp Technologies, Incorporated]
1 FEBRUARY 2013 VOL 339 SCIENCE www.sciencemag.org536
REVIEW
on
Janu
ary
31, 2
013
ww
w.s
cien
cem
ag.o
rgD
ownl
oade
d fr
om

Besides polymer composites, the addition ofsmall amounts of CNTs to metals has providedincreased tensile strength and modulus (44) thatmay find applications in aerospace and automotivestructures. Commercial Al-MWNTcomposites havestrengths comparable to stainless steel (0.7 to 1GPa)at one-third the density (2.6 g cm–3). This strength isalso comparable toAl-Li alloys, yet theAl-MWNTcomposites are reportedly less expensive.
Last, MWNTs can also be used as a flame-retardant additive to plastics; this effect is mainlyattributed to changes in rheology by nanotube load-ing (45). These nanotube additives are commer-cially attractive as a replacement for halogenatedflame retardants, which have restricted use becauseof environmental regulations.
Coatings and FilmsLeveraging CNT dispersion, functionalization,and large-area deposition techniques, CNTs areemerging as a multifunctional coating material.For example, MWNT-containing paints reducebiofouling of ship hulls (Fig. 1C) by discour-aging attachment of algae and barnacles (46).They are a possible alternative to environmen-tally hazardous biocide-containing paints. Incor-poration of CNTs in anticorrosion coatings formetals can enhance coating stiffness and strength
while providing an electric pathway for cathodicprotection.
Widespread development continues on CNT-based transparent conducting films (47) as an alter-native to indium tin oxide (ITO). A concern is thatITO is becoming more expensive because of thescarcity of indium, compounded by growing demandfor displays, touch-screen devices, and photovol-taics. Besides cost, the flexibility ofCNT transparentconductors is a major advantage over brittle ITOcoatings for flexible displays. Further, transparentCNTconductors canbedeposited from solution (e.g.,slot-die coating, ultrasonic spraying) and patternedbycost-effectivenonlithographicmethods (e.g., screenprinting, microplotting). Recent commercial develop-ment effort has resulted in SWNT films with 90%transparency and a sheet resistivity of 100 ohm persquare. This surface resistivity is adequate for someapplications but still substantially higher than forequally transparent, optimally doped ITO coatings(48). Related applications that have less stringentrequirements include CNT thin-film heaters, such asfor defrostingwindows or sidewalks. All of the abovecoatings are being pursued industrially (see table S3).
MicroelectronicsHigh-quality SWNTs are attractive for transistorsbecause of their low electron scattering and their
bandgap, which depends on diameter and chiralangle. Further, SWNTs are compatible with field-effect transistor (FET) architectures and high-kdielectrics (26, 49). After the first CNT transistorin 1998 (50), milestones include the first SWNT-tunneling FET with a subthreshold swing of<60mVdecade–1 in 2004 (49, 51) and CNT-basedradios in 2007 (52). In 2012, SWNT FETs withsub-10-nm channel lengths showed a normalizedcurrent density (2.41 mA mm–1 at 0.5 V), which isgreater than those obtained for silicon devices (53).
Despite the promising performance of indi-vidual SWNT devices, control of CNT diameter,chirality, density, and placement remains insuffi-cient for microelectronics production, especiallyover large areas. Therefore, devices such as transistorscomprising patterned films of tens to thousands ofSWNTs are more immediately practical. The useof CNT arrays increases output current and com-pensates for defects and chirality differences, improv-ing device uniformity and reproducibility (26). Forexample, transistors using horizontally alignedCNTarrays achieved mobilities of 80 cm2 V−1 s−1, sub-threshold slopes of 140 mV decade–1, and on/offratios as high as 105 (54). These developments aresupported by recent methods for precise high-density CNT film deposition methods, enablingconventional semiconductor fabrication of morethan 10,000 CNT devices in a single chip (55).
CNT thin-film transistors (TFTs) are particu-larly attractive for driving organic light-emittingdiode (OLED) displays, because they have shownhigher mobility than amorphous silicon (~1 cm2
V−1 s−1) (56) and can be deposited by low-temperature, nonvacuum methods. Recently, flex-ible CNT TFTs with a mobility of 35 cm2 V–1 s–1
and an on/off ratio of 6 × 10⁶ were demonstrated(Fig. 3A) (56). A vertical CNT FET showed suffi-cient current output to drive OLEDs at low voltage(57), enabling red-green-blue emissionby theOLEDthrough a transparent CNT network. Promising com-mercial development of CNTelectronics includeslow-cost printing of TFTs (58), as well as radio-frequency identification tags (59). Improved under-standing of CNT surface chemistry is essential forcommercialization ofCNT thin-film electronics; recentdevelopments enable, for example, selective reten-tion of semiconductingSWNTsduring spin-coating(60) and reduction of sensitivity to adsorbates (61).
The International Technology Roadmap forSemiconductors suggests that CNTs could replaceCu in microelectronic interconnects, owing to theirlow scattering, high current-carrying capacity, andresistance to electromigration. For this, vias com-prising tightly packed (>1013 per cm2) metallicCNTs with low defect density and low contactresistance are needed. Recently, complementarymetal oxide semiconductor (CMOS)–compatible150-nm-diameter interconnects (Fig. 3C) with asingle CNT–contact hole resistance of 2.8 kohmwere demonstrated on full 200-mm-diameter wa-fers (62). Also, as a replacement for solder bumps,CNTs can function both as electrical leads andheat dissipaters for use in high-power amplifiers(Fig. 3D).
A B
C D
Flexible TFT Memory
Electronic interconnect Thermal interface
S DG
CNT network
Ti/Au(10/100 nm)
Al2/O3(40 nm)
Ti/Au(10/150 nm)
PEN (125 µm)
NRAM cell
Word line
Bit lineCNTs
Source line
5 µm10 mm
CNT network
D S
Cross section
TaN
CNT
High-power amplifier
Electrode
Au-coatedCNT connection
TiN
Cu
150 nm
CN
T f
ilm
CN
T f
ore
st
Fig. 3. Selected CNT applications in microelectronics. (A) Flexible TFTs using CNT networks deposited byaerosol CVD. [Schematic and photograph reprinted by permission fromMacmillan Publishers Limited; scanningelectronmicroscopy image courtesy of Y. Ohno] (B) CNT-based nonvolatile randomaccessmemory (NRAM) cellfabricated by using spin-coating and patterning of a CMOS-compatible CNT solution. [Images courtesy ofNantero, Incorporated] (C) CMOS-compatible 150-nm vertical interconnects developed by imec and TokyoElectron Limited. [Image courtesy of imec] (D) CNT bumps used for enhanced thermal dissipation in high poweramplifiers. [Image courtesy of Fujitsu Limited]
www.sciencemag.org SCIENCE VOL 339 1 FEBRUARY 2013 537
REVIEW
on
Janu
ary
31, 2
013
ww
w.s
cien
cem
ag.o
rgD
ownl
oade
d fr
om

Last, a concept for a nonvolatile memory basedon individual CNT crossbar electromechanicalswitches (63) has been adapted for commer-cialization (Fig. 3B) by patterning tangled CNTthin films as the functional elements. This requireddevelopment of ultrapure CNT suspensions thatcan be spin-coated and processed in industrialclean room environments and are therefore com-patible with CMOS processing standards.
Energy Storage and EnvironmentMWNTs are widely used in lithium ion batteriesfor notebook computers and mobile phones, mark-ing a major commercial success (64, 65). In these bat-teries, small amounts ofMWNTpowder are blendedwith active materials and a polymer binder, suchas 1 wt % CNT loading in LiCoO2 cathodes andgraphite anodes. CNTs provide increased electricalconnectivity and mechanical integrity, which en-hances rate capability and cycle life (64, 66, 67).
Many publications report gravimetric energystorage and power densities for unpackaged bat-teries and supercapacitors, where normalizationis with respect to the weight of active electrodematerials. The frequent use of low areal densitiesfor active materials makes it difficult to assesshow such gravimetric performance metrics relateto those for packaged cells (68, 69), where highareal energy storage and power densities are neededfor realizing high performance based on total cellweight or volume. In one of the few recent studiesfor packaged cells, remarkable performance hasbeen obtained for supercapacitors deployingforest-grown SWNTs (62) that are binder andadditive free; an energy density of 16Whkg–1 anda power density of 10 kW kg–1 was obtained for a40-F supercapacitor with a maximum voltage of3.5 V. On the basis of accelerated tests at up to105°C, a 16-year lifetimewas forecast.Despite theseimpressive metrics, the present cost of SWNTsis a major roadblock to commercialization.
For fuel cells, the use of CNTs as a catalyst sup-port can potentially reduce Pt usage by 60% com-paredwith carbon black (70), and dopedCNTsmayenable fuel cells that do not require Pt (19, 71). Fororganic solar cells, ongoing efforts are leveragingthe properties of CNTs to reduce undesired carrierrecombination and enhance resistance to photooxi-dation (20). In the long run, photovoltaic technol-ogies may incorporate CNT-Si heterojunctions andleverage efficient multiple-exciton generation atp-n junctions formed within individual CNTs (72).In the nearer term, commercial photovoltaics mayincorporate transparent SWNTelectrodes (Fig. 4C).
An upcoming application domain of CNTs iswater purification. Here, tangled CNT sheets canprovide mechanically and electrochemically robustnetworkswith controlled nanoscale porosity. Thesehave been used to electrochemically oxidize organiccontaminants (73), bacteria, and viruses (74). Porta-ble filters containingCNTmeshes havebeen commer-cialized for purification of contaminated drinkingwater (Fig. 4D).Moreover,membranes using alignedencapsulated CNTs with open ends permit flowthrough the interior of the CNTs, enabling unprece-
dented low flow resistance for both gases and liq-uids (75). This enhanced permeability may enablelower energy cost for water desalination by reverseosmosis in comparison to commercial polycar-bonate membranes. However, very-small-diameterSWNTs are needed to reject salt at seawater con-centrations (76).
BiotechnologyOngoing interest in CNTs as components of bio-sensors and medical devices is motivated by thedimensional and chemical compatibility of CNTswith biomolecules, such as DNA and proteins. Atthe same time, CNTs enable fluorescent (77) andphotoacoustic imaging (78), as well as localizedheating using near-infrared radiation (79).
SWNT biosensors can exhibit large changesin electrical impedance (80) and optical properties(81) in response to the surrounding environment,which is typically modulated by adsorption of atarget on theCNTsurface. Low detection limits andhigh selectivity require engineering the CNT sur-face (e.g., functional groups and coatings) (80) andappropriate sensor design (e.g., field effects, capac-itance, Raman spectral shifts, and photoluminescence)(82, 83). Products under development include ink-jet–printed test strips for estrogen and progester-one detection, microarrays for DNA and proteindetection, and sensors forNO2 and cardiac troponin(84). Similar CNTsensors have been used for gasand toxin detection in the food industry, military,and environmental applications (82, 85).
For in vivo applications, CNTs can be inter-nalized by cells, first by binding of their tips toreceptors on the cell membrane (86). This enablestransfection of molecular cargo attached to theCNTwalls or encapsulated inside the CNTs (87).For example, the cancer drug doxorubicin wasloaded at up to 60 wt % on CNTs compared with8 to 10 wt % on liposomes (88). Cargo release canbe triggered by using near-infrared radiation. How-ever, for use of free-floating CNTs it will be criticalto control the retention of CNTs within the bodyand prevent undesirable accumulation, which mayresult from changing CNTsurface chemistry (89).
Potential CNT toxicity remains a concern, al-though it is emerging that CNT geometry andsurface chemistry strongly influence biocompat-ibility, and therefore CNT biocompatibility maybe engineerable (89). Early on, it was reportedthat injection of large quantities of MWNTs intothe lungs of mice could cause asbestos-like path-ogenicity (90). However, a later study reportedthat lung inflammation caused by injection ofwell-dispersed SWNTswas insignificant both com-pared with asbestos and with particulate matter inair collected inWashington, DC (91). Future med-ical acceptance of CNTs requires deeper under-standing of immune response, alongwith definitionof exposure standards for different use cases includ-ing inhalation, injection, ingestion, and skin contact.Toward use in implants, CNT forests immobi-lized in a polymer were studied by implantationinto rats and did not show elevated inflammatory
A B
C D
Battery Supercapacitor
Solar cell Water filter
500 nm
2 µm
1 µm
LiCoO2particles
MWNT
Lpppppppp
MWNWW T
CNT electrode
CNT TC film
Electrolyteand ions
CN
T p
ow
der
Tan
gle
d C
NT
fil
m
CN
T f
ore
stTa
ng
led
CN
T m
esh
Fig. 4. Energy-related applications of CNTs. (A) Mixture of MWNTs and active powder for battery electrode.[Images reprinted by permission from John Wiley and Sons (67)] (B) Concept for supercapacitors based onCNT forests. [Images courtesy of FastCap Systems Corporation] (C) Solar cell using a SWNT-based transparentconductor. [Images courtesy of Eikos Incorporated] (D) Prototype portable water filter using a functionalizedtangled CNT mesh in the latest stage of development. [Images courtesy of Seldon Technologies]
1 FEBRUARY 2013 VOL 339 SCIENCE www.sciencemag.org538
REVIEW
on
Janu
ary
31, 2
013
ww
w.s
cien
cem
ag.o
rgD
ownl
oade
d fr
om

response relative to controls (92). This is encour-aging for possible use of CNTs as low-impedanceneural interface electrodes (93) and for coating ofcatheters to reduce thrombosis (94).
OutlookMost products using CNTs today incorporate CNTpowders dispersed in polymermatrices or depositedas thin films; for commercialization of these products,it was essential to integrate CNT processing withexisting manufacturing methods. Organized CNTmaterials such as forests and yarns are beginningto bridge the gap between the nanoscale propertiesof CNTs and the length scales of bulk engineeringmaterials. However, understanding is needed ofwhy the properties of CNT yarns and sheets, likethermal conductivity andmechanical strength, remainfar lower than the properties of individual CNTs. Atan opposite limit, placement of individual CNTshaving desired structure with lithographic preci-sion over large substrateswould be a breakthroughfor electronic devices and scanning probe tips.
According to press reports, many companies areinvesting in diverse applications of CNTs, such astransparent conductors, thermal interfaces, anti-ballistic vests, andwind turbine blades. However,often few technical details are released, and com-panies are likely to keep technical details hiddenfor a very long time after commercialization,whichmakes it challenging to predict market success.Hence, the increases in nanotube production capac-ity and sales are an especially important metricfor emerging CNT applications (see Fig. 1).
Further industrial development demands healthand safety standards for CNT manufacturing anduse, along with improved quantitative charac-terization methods that can be implemented inproduction processes. For example, the NationalInstitute of Standards and Technology developeda SWNT reference material in 2011; IEEE is de-veloping standards for CNT processing in cleanrooms; and in 2010 the Chinese governmentpublished standards for MWNT characterizationand handling (16). Proactively, Bayer establishedan occupational exposure limit of 0.05 mg m–3
for their CNTs (95). These efforts encourage con-tinued progress with caution, especially for CNTmanufacturing operations that can potentially gen-erate airborne particulate matter.
As larger quantities of CNT materials reachthe consumer market, it will also be necessary toestablish disposal and/or reuse procedures. CNTsmay enter municipal waste streams, where, unlessthey are incinerated, cross-contamination duringrecycling is possible (65). Broader partnershipsamong industry, academia, and government areneeded to investigate the environmental and so-cietal impact of CNTs throughout their life cycle.
Lastly, continued CNT research and develop-mentwill be complementary to the rise of graphene.Rapid innovations in graphene synthesis andcharacterization—such asCVDmethods andRamanspectroscopy techniques—have leveraged findingsfromCNTresearch. Promisingmaterials combin-ing carbon allotropes include 3D CNT-graphene
networks for thermal interfaces (96) and fatigue-resistant graphene-coated CNTaerogels (97). Thescience and applications of CNTs, ranging fromsurface chemistry to large-scale manufacturing,will contribute to the frontier of nanotechnologyand related commercial products for many yearsto come.
References and Notes1. S. Iijima, Nature 354, 56 (1991).2. P. J. F. Harris, Carbon Nanotube Science - Synthesis, Properties,
and Applications (Cambridge Univ. Press, Cambridge, 2009).3. B. Peng et al., Nat. Nanotechnol. 3, 626 (2008).4. B. Q. Wei, R. Vajtai, P. M. Ajayan, Appl. Phys. Lett. 79,
1172 (2001).5. E. Pop, D. Mann, Q. Wang, K. Goodson, H. J. Dai, Nano
Lett. 6, 96 (2006).6. A. Y. Cao, P. L. Dickrell, W. G. Sawyer, M. N. Ghasemi-Nejhad,
P. M. Ajayan, Science 310, 1307 (2005).7. L. Qu, L. Dai, M. Stone, Z. Xia, Z. L. Wang, Science 322,
238 (2008).8. M. Xu, D. N. Futaba, T. Yamada, M. Yumura, K. Hata,
Science 330, 1364 (2010).9. M. F. L. De Volder, J. De Coster, D. Reynaerts, C. Van Hoof,
S.-G. Kim, Small 8, 2006 (2012).10. L. Ren et al., Nano Lett. 9, 2610 (2009).11. A. E. Aliev et al., Science 323, 1575 (2009).12. M. Lima et al., Science 338, 928 (2012).13. K. Mizuno et al., Proc. Natl. Acad. Sci. U.S.A.106, 6044 (2009).14. L. Xiao et al., Nano Lett. 8, 4539 (2008).15. M. Endo, T. Hayashi, Y.-A. Kim, Pure Appl. Chem. 78,
1703 (2006).16. Q. Zhang, J.-Q. Huang, M.-Q. Zhao, W.-Z. Qian, F. Wei,
ChemSusChem 4, 864 (2011).17. A. R. Harutyunyan et al., Science 326, 116 (2009).18. L. Ding et al., Nano Lett. 9, 800 (2009).19. K. Gong, F. Du, Z. Xia, M. Durstock, L. Dai, Science 323,
760 (2009).20. J. M. Lee et al., Adv. Mater. 23, 629 (2011).21. X. Wang et al., Nano Lett. 9, 3137 (2009).22. S. Hofmann et al., Nano Lett. 7, 602 (2007).23. E. C. Neyts, A. C. T. van Duin, A. Bogaerts, J. Am. Chem.
Soc. 133, 17225 (2011).24. M. S. Arnold, A. A. Green, J. F. Hulvat, S. I. Stupp,
M. C. Hersam, Nat. Nanotechnol. 1, 60 (2006).25. H. Liu, D. Nishide, T. Tanaka, H. Kataura, Nat. Commun.
2, 309 (2011).26. Q. Cao, J. A. Rogers, Adv. Mater. 21, 29 (2009).27. K. Hata et al., Science 306, 1362 (2004).28. K. Koziol et al., Science 318, 1892 (2007); 10.1126/
science.1147635.29. D. N. Futaba et al., Nat. Mater. 5, 987 (2006).30. Y. Hayamizu et al., Nat. Nanotechnol. 3, 289 (2008).31. M. De Volder et al., Adv. Mater. 22, 4384 (2010).32. M. Zhang, K. R. Atkinson, R. H. Baughman, Science 306,
1358 (2004).33. K. L. Jiang, Q. Q. Li, S. S. Fan, Nature 419, 801 (2002).34. W. Bauhofer, J. Z. Kovacs,Compos. Sci. Technol.69, 1486 (2009).35. T.-W. Chou, L. Gao, E. T. Thostenson, Z. Zhang,
J.-H. Byun, Compos. Sci. Technol. 70, 1 (2010).36. F. H. Gojny, M. H. G. Wichmann, U. Kopke, B. Fiedler,
K. Schulte, Compos. Sci. Technol. 64, 2363 (2004).37. J. Suhr, N. Koratkar, P. Keblinski, P. Ajayan, Nat. Mater.
4, 134 (2005).38. J. N. Coleman, U. Khan, W. J. Blau, Y. K. Gun'ko, Carbon
44, 1624 (2006).39. H. G. Chae, Y. H. Choi, M. L. Minus, S. Kumar, Compos.
Sci. Technol. 69, 406 (2009).40. V. P. Veedu et al., Nat. Mater. 5, 457 (2006).41. E. J. Garcia, B. L. Wardle, A. J. Hart, N. Yamamoto,
Compos. Sci. Technol. 68, 2034 (2008).42. M. D. Lima et al., Science 331, 51 (2011).43. N. Behabtu et al., Science 339, 182 (2013).44. S. R. Bakshi, A. Agarwal, Carbon 49, 533 (2011).45. T. Kashiwagi et al., Nat. Mater. 4, 928 (2005).46. A. Beigbeder et al., Biofouling 24, 291 (2008).47. Z. Wu et al., Science 305, 1273 (2004).48. S. De, J. N. Coleman, MRS Bull. 36, 774 (2011).49. A. M. Ionescu, H. Riel, Nature 479, 329 (2011).
50. S. J. Tans, A. R. M. Verschueren, C. Dekker, Nature 393,49 (1998).
51. J. Appenzeller, Y. M. Lin, J. Knoch, P. Avouris, Phys. Rev.Lett. 93, 196805 (2004).
52. K. Jensen, J.Weldon, H. Garcia, A. Zettl,Nano Lett.7, 3508 (2007).53. A. D. Franklin et al., Nano Lett. 12, 758 (2012).54. Q. Cao et al., Nature 454, 495 (2008).55. H. Park et al., Nat. Nanotechnol. 7, 787 (2012).56. D. M. Sun et al., Nat. Nanotechnol. 6, 156 (2011).57. M. A. McCarthy et al., Science 332, 570 (2011).58. P. Chen et al., Nano Lett. 11, 5301 (2011).59. M. Jung et al., IEEE Trans. Electron. Dev. 57, 571 (2010).60. M. C. LeMieux et al., Science 321, 101 (2008).61. A. D. Franklin et al., ACS Nano 6, 1109 (2012).62. M. H. van der Veen et al., paper presented at the 2012
IEEE International Interconnect Technology Conference,San Jose, CA, 4 to 6 June 2012.
63. T. Rueckes et al., Science 289, 94 (2000).64. L. Dai, D. W. Chang, J.-B. Baek, W. Lu, Small 8, 1130 (2012).65. A. R. Köhler, C. Som, A. Helland, F. Gottschalk, J. Clean.
Prod. 16, 927 (2008).66. K. Evanoff et al., Adv. Mater. 24, 533 (2012).67. C. Sotowa et al., ChemSusChem 1, 911 (2008).68. Y. Gogotsi, P. Simon, Science 334, 917 (2011).69. A. Izadi-Najafabadi et al., Adv. Mater. 22, E235 (2010).70. T. Matsumoto et al., Chem. Commun. 2004, 840 (2004).71. A. Le Goff et al., Science 326, 1384 (2009).72. N. M. Gabor, Z. Zhong, K. Bosnick, J. Park, P. L. McEuen,
Science 325, 1367 (2009).73. G. Gao, C. D. Vecitis, Environ. Sci. Technol. 45, 9726 (2011).74. M. S. Rahaman, C. D. Vecitis, M. Elimelech, Environ. Sci.
Technol. 46, 1556 (2012).75. J. K. Holt et al., Science 312, 1034 (2006).76. B. Corry, J. Phys. Chem. B 112, 1427 (2008).77. D. A. Heller, S. Baik, T. E. Eurell, M. S. Strano,
Adv. Mater. 17, 2793 (2005).78. A. De La Zerda et al., Nat. Nanotechnol. 3, 557 (2008).79. N. W. S. Kam, M. O’Connell, J. A. Wisdom, H. J. Dai, Proc.
Natl. Acad. Sci. U.S.A. 102, 11600 (2005).80. T. Kurkina, A. Vlandas, A. Ahmad, K. Kern,
K. Balasubramanian, Angew. Chem. Int. Ed. 50, 3710 (2011).81. D. A. Heller et al., Nat. Nanotechnol. 4, 114 (2009).82. E. S. Snow, F. K. Perkins, E. J. Houser, S. C. Badescu,
T. L. Reinecke, Science 307, 1942 (2005).83. Z. Chen et al., Nat. Biotechnol. 26, 1285 (2008).84. A. Star et al., Proc. Natl. Acad. Sci. U.S.A. 103, 921 (2006).85. B. Esser, J. M. Schnorr, T. M. Swager, Angew. Chem. Int.
Ed. 51, 5752 (2012).86. X. Shi, A. von dem Bussche, R. H. Hurt, A. B. Kane,
H. Gao, Nat. Nanotechnol. 6, 714 (2011).87. S. Y. Hong et al., Nat. Mater. 9, 485 (2010).88. Z. Liu, X. Sun, N. Nakayama-Ratchford, H. Dai, ACS Nano
1, 50 (2007).89. A. Bianco, K. Kostarelos, M. Prato, Chem. Commun. 47,
10182 (2011).90. C. A. Poland et al., Nat. Nanotechnol. 3, 423 (2008).91. G. M. Mutlu et al., Nano Lett. 10, 1664 (2010).92. D. A. X. Nayagam et al., Small 7, 1035 (2011).93. E. W. Keefer, B. R. Botterman, M. I. Romero, A. F. Rossi,
G. W. Gross, Nat. Nanotechnol. 3, 434 (2008).94. M. Endo, S. Koyama, Y. Matsuda, T. Hayashi, Y. A. Kim,
Nano Lett. 5, 101 (2005).95. J. Pauluhn, Regul. Toxicol. Pharmacol. 57, 78 (2010).96. S. W. Hong et al., Adv. Mater. 23, 3821 (2011).97. K. H. Kim, Y. Oh, M. F. Islam,Nat. Nanotechnol. 7, 562 (2012).
Acknowledgments: M.F.L.D.V. was supported by the Fundfor Scientific Research–Flanders, Belgium. S.H.T. andA.J.H. were supported by the Office of Naval Research(N00014101055 and N000141210815). R.H.B. was supportedby the Air Force Office of Scientific Research MURI grant R17535and Robert A. Welch grant AT-0029. The authors thank M. Endo,Y. Gogotsi, K. Hata, S. Joshi, Y. A. Kim, E. Meshot, M. Roberts,S. Suematsu, K. Tamamitsu, J. R. Von Ehr, B. Wardle, G. Yushin,and many companies for valuable input.
Supplementary Materialswww.sciencemag.org/cgi/content/full/339/6119/535/DC1Materials and MethodsTables S1 to S3
10.1126/science.1222453
www.sciencemag.org SCIENCE VOL 339 1 FEBRUARY 2013 539
REVIEW
on
Janu
ary
31, 2
013
ww
w.s
cien
cem
ag.o
rgD
ownl
oade
d fr
om

Authigenic Carbonate and the Historyof the Global Carbon CycleDaniel P. Schrag,1*† John. A. Higgins,2* Francis A. Macdonald,1 David T. Johnston1
We present a framework for interpreting the carbon isotopic composition of sedimentaryrocks, which in turn requires a fundamental reinterpretation of the carbon cycle and redoxbudgets over Earth’s history. We propose that authigenic carbonate, produced in sedimentpore fluids during early diagenesis, has played a major role in the carbon cycle in the past.This sink constitutes a minor component of the carbon isotope mass balance under the modern,high levels of atmospheric oxygen but was much larger in times of low atmospheric O2 orwidespread marine anoxia. Waxing and waning of a global authigenic carbonate sink helps toexplain extreme carbon isotope variations in the Proterozoic, Paleozoic, and Triassic.
Since the observation of isotopic fractiona-tion of carbon during photosynthesis morethan 60 years ago (1), the contrast in the
isotopic composition of organic carbon and cal-cium carbonate has been used to reconstruct thehistory of the global carbon cycle and its con-nection to the oxidation state of the planet, includ-ing the rise of atmospheric oxygen (2). The inputof carbon to Earth’s surface reservoirs (d13Cin) (3)is balanced by the burial of carbon either as or-ganic carbon (d13Corg), which is depleted in 13Crelative to dissolved inorganic carbon in seawater(DIC), or as calcium carbonate (d13Ccarb), whichhas a similar isotopic composition toDIC.Changesin the isotopic composition of marine carbonatein the geologic record have thus been interpretedas changes in the fractional burial of organic car-bon relative to carbonate carbon ( forg), as describedby the simple equation (4)
d13Cin ¼ d13Corg forg þ d13Ccarbð1 − forgÞ ð1Þ
For much of Earth history, d13Ccarb has fluctuatedaround a value of 0 per mil (‰), with d13Corg andd13Cin values at roughly –25 and –5‰ respec-tively, implying that 20% of total carbon burialhas been as organic matter (5).
The isotopic mass balance requires a funda-mental linkage between the carbon cycle and theoxidation state of Earth’s surface as manifest bythe amount of oxygen in the atmosphere. An in-crease in d13Ccarb implies the burial of a higherfraction of organic carbon, or alternatively a de-crease in the oxidation of organic matter relativeto the weathering of carbonate rocks. In either case,this would increase the amount of oxygen in theatmosphere unless other redox-sensitive elementssuch as sulfur or iron serve as alternative electrondonors.
This basic framework has been used to inter-pret d13Ccarb variations throughout Earth histo-ry. For example, observations of d13Ccarb above+5‰ for more than 10 million years during theNeoproterozoic have been explained in terms ofsustained periods of high fractional organic car-bon burial (5). Similarly, high d13Ccarb values inthe late Paleozoic have been attributed to highorganic carbon burial after the proliferation of landplants (2). These interpretations directly informmodels of atmospheric oxygen levels over thePhanerozoic (6), leading to suggestions of pulsesof oxygen production and consumption through-out the geologic record (7, 8). Thus, a correct read-ing of carbon isotope mass balance is critical toour understanding of the accumulation of oxidiz-ing capacity (atmospheric O2 and seawater sul-fate) at the Earth’s surface through geologic time.
Certain aspects of the d13Ccarb record arechallenging to explain in the simple frameworkdescribed above. First, sustained high d13Ccarb
values (>+5‰), such as what is observed through-out the Neoproterozoic (9, 10) and in the earlyPaleoproterozoic (7), imply very high rates of or-ganic burial and hence accumulation of atmo-spheric oxygen to levels tens to hundreds timesthat of the present (4, 7). This is inconsistentwith geological evidence for lower oxygen levelsduring these times (11). Second, large negativeisotopic excursions of –10 to –15‰ in the Neo-proterozoic are very difficult to explain either byoxidation of large amounts of organicmatter (7, 12)or methane (13, 14) because both require a verylarge change in atmospheric oxygen as well as avery large increase in atmospheric carbon dioxide,neither of which is supported by independent geo-logical evidence. Surveying the d13Ccarb record inits entirety, one is forced to conclude that our basicframework is lacking some fundamental pro-cess and that it provides a misleading basis forunderstanding Earth history. We suggest that au-thigenic carbonate, produced in sediments duringearly diagenetic reactions primarily associated withsulfate and iron reduction, has played a major rolein the carbon isotope mass balance over Earth
history, although it represents a minor componentof the modern isotope mass balance because ofhigh levels of atmospheric oxygen in the modernworld. If correct, this requires a reinterpretation ofthe d13Ccarb record.
Authigenic carbonate refers to any carbonatemineral precipitated inorganically in situ, wheth-er at the sediment-water interface or within sed-iment pore waters. In the modern ocean, mostauthigenic carbonate is formed in sediments whenalkalinity is produced from diagenetic reactions—usually those that reduce sulfate or ferric iron—resulting in supersaturation of carbonate minerals,including calcite, dolomite, or siderite. Precipita-tion of pyrite can also be an important source ofalkalinity that enhances the precipitation of au-thigenic carbonate phases. Because most reduc-tion of iron and sulfate occurs through oxidation ofmethane (anaerobic methane oxidation) or organiccarbon, the DIC from which authigenic carbonateforms is generally depleted in 13C, although en-richment is possible if carbonate precipitationoccurs deeper in the sediment column, wheremethanogenesis drives the d13C of DIC to highervalues. Authigenic carbonates composed of cal-cite, aragonite, and dolomite occur in continentalmargin sediments in North and South Americaand Eurasia; they are characterized by d13Ccarb
values ranging from –60 to +26‰, with most val-ues <<0‰ (15). Authigenic carbonates (d13Ccarb =–18 to –55‰) are found over the entire depth rangeof the Gulf of Mexico slope (16); in Peru Marginsediments, the d13C of dolomite varies between–36.1 and +11.5‰, although the majority of mea-surements lie between –9 and –12‰ (17). Thiscarbonate sink is also common in sediments inanoxic basins and fjords (18, 19), as well as del-taic environments. In the mobile mudbelts of theAmazon shelf, for example, authigenic carbonateforms primarily as siderite and mixed Ca-, Mg-,Fe-, and Mn-carbonates associated with iron re-duction and pyrite burial, rather than with sulfatereduction through anaerobic methane oxidation,with mass-weighted d13Ccarb between –15 and–19‰ (20). Approximately 30% of the totalcarbon burial in the Amazon fan occurs as au-thigenic carbonate (21). This phenomenon is notlimited to modern examples; similar d13Ccarb val-ues have been observed in Cenozoic sedimentsfrom the Arctic Ocean and the Norwegian-Greenland Sea (22).
Despite its widespread occurrence, authigeniccarbonate does not appear to represent a substan-tial component (by mass) in the modern globalcarbon cycle. One reason is that the formation ofauthigenic carbonate is inhibited by the amountof O2 in seawater because both oxic respirationand oxidation of reduced compounds [such asFe(II) and H2S] lowers the saturation of carbo-nate phases. A recent study explored a model forthe global alkalinity and carbonate cycles, pro-posing that changes in organic carbon cycling,electron acceptor [Fe(III), SO4
2–, and O2] con-centrations, and the concentration of DIC would
RESEARCHARTICLES
1Department of Earth and Planetary Sciences, Harvard Univer-sity, Cambridge, MA 02138, USA. 2Department of Geosciences,Princeton University, Princeton, NJ 08544, USA.
*These authors contributed equally to this work.†To whom correspondence should be addressed. E-mail:[email protected]
1 FEBRUARY 2013 VOL 339 SCIENCE www.sciencemag.org540
on
Janu
ary
31, 2
013
ww
w.s
cien
cem
ag.o
rgD
ownl
oade
d fr
om
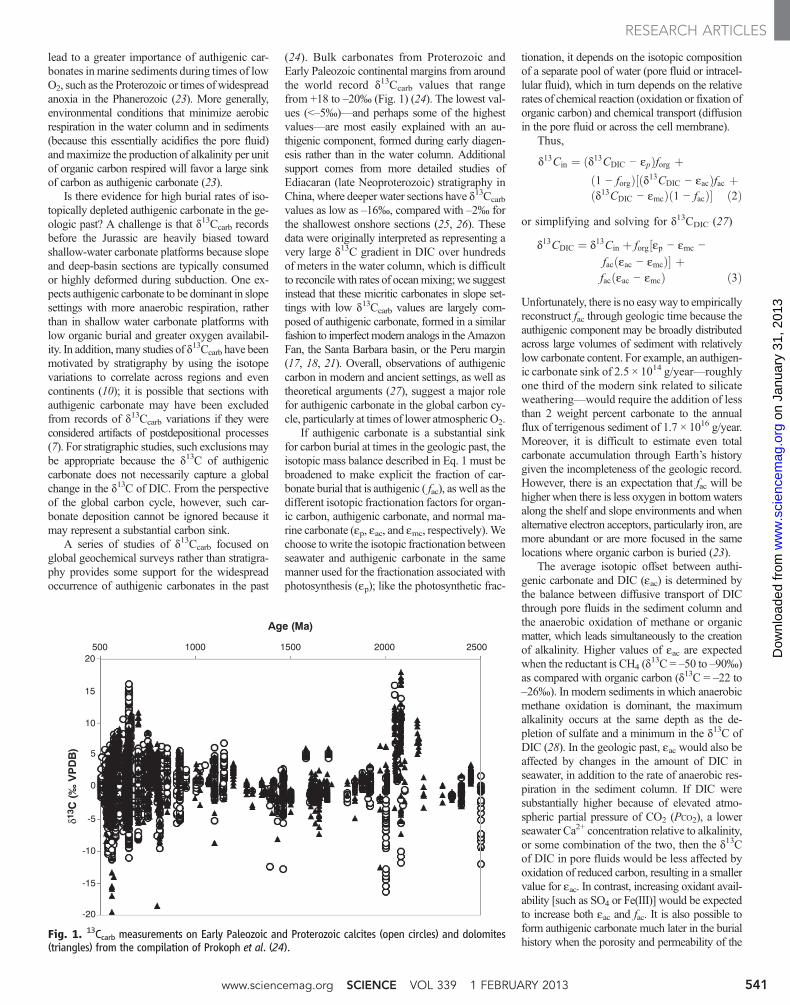
lead to a greater importance of authigenic car-bonates in marine sediments during times of lowO2, such as the Proterozoic or times of widespreadanoxia in the Phanerozoic (23). More generally,environmental conditions that minimize aerobicrespiration in the water column and in sediments(because this essentially acidifies the pore fluid)andmaximize the production of alkalinity per unitof organic carbon respired will favor a large sinkof carbon as authigenic carbonate (23).
Is there evidence for high burial rates of iso-topically depleted authigenic carbonate in the ge-ologic past? A challenge is that d13Ccarb recordsbefore the Jurassic are heavily biased towardshallow-water carbonate platforms because slopeand deep-basin sections are typically consumedor highly deformed during subduction. One ex-pects authigenic carbonate to be dominant in slopesettings with more anaerobic respiration, ratherthan in shallow water carbonate platforms withlow organic burial and greater oxygen availabil-ity. In addition,many studies of d13Ccarb have beenmotivated by stratigraphy by using the isotopevariations to correlate across regions and evencontinents (10); it is possible that sections withauthigenic carbonate may have been excludedfrom records of d13Ccarb variations if they wereconsidered artifacts of postdepositional processes(7). For stratigraphic studies, such exclusions maybe appropriate because the d13C of authigeniccarbonate does not necessarily capture a globalchange in the d13C of DIC. From the perspectiveof the global carbon cycle, however, such car-bonate deposition cannot be ignored because itmay represent a substantial carbon sink.
A series of studies of d13Ccarb focused onglobal geochemical surveys rather than stratigra-phy provides some support for the widespreadoccurrence of authigenic carbonates in the past
(24). Bulk carbonates from Proterozoic andEarly Paleozoic continental margins from aroundthe world record d13Ccarb values that rangefrom +18 to –20‰ (Fig. 1) (24). The lowest val-ues (<–5‰)—and perhaps some of the highestvalues—are most easily explained with an au-thigenic component, formed during early diagen-esis rather than in the water column. Additionalsupport comes from more detailed studies ofEdiacaran (late Neoproterozoic) stratigraphy inChina, where deeper water sections have d13Ccarb
values as low as –16‰, compared with –2‰ forthe shallowest onshore sections (25, 26). Thesedata were originally interpreted as representing avery large d13C gradient in DIC over hundredsof meters in the water column, which is difficultto reconcile with rates of oceanmixing; we suggestinstead that these micritic carbonates in slope set-tings with low d13Ccarb values are largely com-posed of authigenic carbonate, formed in a similarfashion to imperfectmodern analogs in theAmazonFan, the Santa Barbara basin, or the Peru margin(17, 18, 21). Overall, observations of authigeniccarbon in modern and ancient settings, as well astheoretical arguments (27), suggest a major rolefor authigenic carbonate in the global carbon cy-cle, particularly at times of lower atmospheric O2.
If authigenic carbonate is a substantial sinkfor carbon burial at times in the geologic past, theisotopic mass balance described in Eq. 1 must bebroadened to make explicit the fraction of car-bonate burial that is authigenic ( fac), as well as thedifferent isotopic fractionation factors for organ-ic carbon, authigenic carbonate, and normal ma-rine carbonate (ep, eac, and emc, respectively).Wechoose towrite the isotopic fractionation betweenseawater and authigenic carbonate in the samemanner used for the fractionation associated withphotosynthesis (ep); like the photosynthetic frac-
tionation, it depends on the isotopic compositionof a separate pool of water (pore fluid or intracel-lular fluid), which in turn depends on the relativerates of chemical reaction (oxidation or fixation oforganic carbon) and chemical transport (diffusionin the pore fluid or across the cell membrane).
Thus,
d13Cin ¼ ðd13CDIC − epÞforg þð1 − forgÞ½ðd13CDIC − eacÞfac þðd13CDIC − emcÞð1 − facÞ� ð2Þ
or simplifying and solving for d13CDIC (27)
d13CDIC ¼ d13Cin þ forg½ep − emc −facðeac − emcÞ� þfacðeac − emcÞ ð3Þ
Unfortunately, there is no easyway to empiricallyreconstruct fac through geologic time because theauthigenic component may be broadly distributedacross large volumes of sediment with relativelylow carbonate content. For example, an authigen-ic carbonate sink of 2.5 × 10¹⁴ g/year—roughlyone third of the modern sink related to silicateweathering—would require the addition of lessthan 2 weight percent carbonate to the annualflux of terrigenous sediment of 1.7 × 10¹⁶ g/year.Moreover, it is difficult to estimate even totalcarbonate accumulation through Earth’s historygiven the incompleteness of the geologic record.However, there is an expectation that fac will behigher when there is less oxygen in bottomwatersalong the shelf and slope environments and whenalternative electron acceptors, particularly iron, aremore abundant or are more focused in the samelocations where organic carbon is buried (23).
The average isotopic offset between authi-genic carbonate and DIC (eac) is determined bythe balance between diffusive transport of DICthrough pore fluids in the sediment column andthe anaerobic oxidation of methane or organicmatter, which leads simultaneously to the creationof alkalinity. Higher values of eac are expectedwhen the reductant is CH4 (d
13C = –50 to –90‰)as compared with organic carbon (d13C = –22 to–26‰). In modern sediments in which anaerobicmethane oxidation is dominant, the maximumalkalinity occurs at the same depth as the de-pletion of sulfate and a minimum in the d13C ofDIC (28). In the geologic past, eac would also beaffected by changes in the amount of DIC inseawater, in addition to the rate of anaerobic res-piration in the sediment column. If DIC weresubstantially higher because of elevated atmo-spheric partial pressure of CO2 (PCO2), a lowerseawater Ca2+ concentration relative to alkalinity,or some combination of the two, then the d13Cof DIC in pore fluids would be less affected byoxidation of reduced carbon, resulting in a smallervalue for eac. In contrast, increasing oxidant avail-ability [such as SO4 or Fe(III)] would be expectedto increase both eac and fac. It is also possible toform authigenic carbonate much later in the burialhistory when the porosity and permeability of the
20500 1000 1500
Age (Ma)
δ13 C
(�
VP
DB
)
2000 2500
15
10
5
0
-5
-10
-15
-20
Fig. 1. 13Ccarb measurements on Early Paleozoic and Proterozoic calcites (open circles) and dolomites(triangles) from the compilation of Prokoph et al. (24).
www.sciencemag.org SCIENCE VOL 339 1 FEBRUARY 2013 541
RESEARCH ARTICLES
on
Janu
ary
31, 2
013
ww
w.s
cien
cem
ag.o
rgD
ownl
oade
d fr
om

sediments are lower and the distance from thesediment-water interface is large; in this case, dif-fusive exchange with seawater is less important indetermining eac.
The inclusion of authigenic carbonate in theglobal carbon isotope mass balance adds an ad-ditional degree of freedom in explaining d13Cvariations in the geologic record and complicatesthe connection between carbon isotopes and theredox budget of the Earth’s surface. In Fig. 2, thed13C of DIC is shown as a function of forg andfac for global average values of eac of 15 and20‰, assuming that the carbon cycle is in steadystate and neglecting imbalances in other inputs(such as weathering of organic carbon and car-bonate). Prolonged periods of high d13Ccarb in theNeoproterozoic can now be explained without in-voking sustained high organic carbon burial orlow organic carbon weathering fluxes (which im-plies the accumulation of massive amounts of at-mospheric oxygen), but simply from the persistentburial of larger amounts of isotopically depletedauthigenic carbonate. As an end member exam-ple, to maintain d13Ccarb at +5‰ without a shiftfrom modern forg values ( forg = 0.2) requires thatauthigenic carbonate make up 29 to 37% of theglobal carbonate sink for global average eac val-ues of 20 and 15‰, respectively (Fig. 2). eac is notentirely independent of ep because the averagephotosynthetic fractionation is ultimately the rea-son for a fractionation between authigenic car-bonate formed in sediments and DIC.
Applying this new framework to large, neg-ative isotopic excursions, such as those observedin the Neoproterozoic, is more complicated be-cause the carbon cycle during such events neednot be at steady state, especially when the ex-cursion lasts less than a few hundred thousandyears. We describe two major categories of neg-ative isotopic excursions that have fundamentallydifferent explanations. First, some excursions canbe explained through a decline in the global fluxof authigenic carbonate that is due to a variety ofpossible factors, including the location or focus-ing of organic carbon burial, the carbonate sat-uration state of seawater, or an increase in theoxygen content of the ocean (and atmosphere). Arapid decline in authigenic carbonate depositionwould drop the steady-state d13C value of DICand could be amplified by additional carbon feed-backs, including oxidative weathering of organiccarbon. Although we expect somemodest connec-tion between d13Ccarb variations and the oxidationstate of the Earth surface (through iron reduction,pyrite burial, or intermediate water oxygen con-tent), d13Ccarb excursions created in this way neednot be accompanied by a large rise in PCO2 nor alarge drop in PO2. Because such excursions resultfrom changes in the d13C of DIC, one would ex-pect to see the excursion in marine organic matteras well as in marine carbonate. Moreover, onewould not expect to see the d13C values drop be-low the global average d13C of the inputs (–5‰)unless there is additional carbon added from oxi-dation of organic carbon or methane.
A second category of negative isotope excur-sions results from the addition of authigenic car-bonate into primary marine carbonate in slope orshelf sediments. In this case, the change in d13Ccarb
does not represent a change in seawater DIC butrather is a local feature—although it may have aregional or global extent if it is driven, for exam-ple, by amarine transgression or changes to globalredox budgets (O2, SO4, or Fe); thus, the d
13Corg
would not track the bulk rock d13Ccarb throughthe excursion. One might expect the magnitudeof the apparent excursion to vary across sedimen-tary environments, such as from shelf to slope[as is present in Ediacaran successions in China(25, 26)] or even laterally across a sedimentarybasin, depending on the distribution of authigeniccarbonate production and the degree of depletionof d13C in the pore fluid. The extent of the iso-topic excursion could theoretically extend far be-low the d13C of carbon inputs, limited only by theisotopic composition and mass contribution oflocal authigenic carbonate. This mechanism pro-vides an explanation for large negative-isotopeexcursions in the carbonate record that are notobserved in d13C of organic carbon, which is ascenario that has invoked much attention andspeculation (29). This scenario does not requirelarge changes in atmospheric O2 and CO2.
An example of the first type of excursion ispossibly captured by the Tayshir anomaly fromNeoproterozoic sections inMongolia (30), whichdocuments a covariation between the d13C oforganic carbon and carbonate carbon throughan isotopic anomaly of ~15‰. With minimumd13Ccarb values during the excursion between –5and –7‰, one can explain this excursion withnearly a complete shut-off of authigenic carbonateproduction ( fac → 0), perhaps with some addi-tional contribution from net oxidation of reducedcarbon. The shutdown of authigenesis could bedriven by a small change in the oxidation state ofintermediate waters on the continental slope, per-haps related to higher atmospheric PO2, establish-ing a stronger lysocline and a carbonate saturationgradient in the sediment column.
The Ediacaran Shuram anomaly is a possibleexample of the second category of isotope ex-cursion. The Shuram anomaly occurs in Ediacaransections around the world, including Namibia,China, and Oman (29). The magnitude of the iso-topic excursion is variable across different loca-tions and even within a single basin (25, 26).Important features include d13Ccarb values as lowas –12‰ during the peak of the excursion and noparallel variations in d13Corg across the excursion(31). We suggest the isotopic anomaly in thiscase could be explained in part by the expansionof the zone of authigenesis onto carbonate plat-forms during a marine transgression, effectivelyadding authigenic carbonate to marine carbonateprecipitated from the water column.
Previous studies have attributed the large neg-ative excursions in the Neoproterozoic—and theShuram anomaly, in particular—to diageneticprocesses (32, 33), specifically basin-scale alter-ation of carbonate rocks with fluids with lowd13C from oxidation of hydrocarbons, or frommeteoric alteration (33). On the other hand, it hasbeen argued that the low d13Ccarb values throughthe Shuram anomaly cannot be explained bydiagenesis because they are expressed in ooliticand stromatolitic facies without evidence for sec-ondary cements (29). Moreover, such a diagenet-ic explanation is difficult to reconcile with theobservation of these negative excursions at pre-cise stratigraphic intervals in geologic sectionsacross multiple continents (10, 29). Our explana-tionmay reconcile these views because onewouldexpect isotopic excursions produced by mixing ofmarine carbonate with a depleted authigenic com-ponent to occur at broadly the same stratigraphicinterval if they were produced by migration of thezone of authigenesis because of a marine trans-gression or drop in near-surface O2 concentration.Textures such as ooids could be preserved if au-thigenesis occurs on both microscales, consumingorganic matter along individual laminations (34),and on mesoscales filling pore spaces with micriteon 10-m scales in mixed-carbonate siliciclasticsequences.
Fig. 2. Contours of 13C of DIC as a func-tion of forg and fac for global average valuesof eac of 15 and 20‰, assuming that thecarbon cycle is in steady state, and neglect-ing imbalances in other inputs, based onEq. 2.
1 FEBRUARY 2013 VOL 339 SCIENCE www.sciencemag.org542
RESEARCH ARTICLES
on
Janu
ary
31, 2
013
ww
w.s
cien
cem
ag.o
rgD
ownl
oade
d fr
om

Aprominent but transient authigenic carbonatesink may also help explain carbon isotope varia-tions in the Paleozoic (8, 35) and Early Triassic(36). In the Triassic, for example, there is evidencefor widespread anoxia in intermediate waters (37),fluctuating d13Ccarb values (–2 to +8‰), and gra-dients in the d13Ccarb values with depth, often withd13C values on the slope 2 to 3‰ lighter thanthose on the shelf (38). We view the Early Triassicas a candidate for a period of sustained, high au-thigenic carbonate formation, like much of theNeoproterozoic (23). The fluctuations could beproduced either from a change in the globalamount of authigenic carbonate (category 1) orby migration in the zone of authigenic carbon-ate (category 2). In the Early Cambrian, similarfluctuations in the authigenic carbonate sinkmighthave resulted from more modest variations in sur-face redox or evolutionary leaps such as the bio-logical irrigation of sediments.
The recognition of authigenic carbonate in thesedimentary record presents a challenge for car-bon isotope stratigraphy because it allows forlocal variations in d13Ccarb produced by the ad-dition of a substantial authigenic component afterburial. Until there is a clear way to quantify theamount of marine carbonate precipitated in thewater column relative to authigenic carbonate pre-cipitated in sediments, questions about the fidelityof chronostratigraphic correlations will remain.Authigenic events are likely to be broadly cor-relative owing to global changes in surface redoxconditions, surface saturation state, and/or eustaticsea level, all of which might drive a migration ofthe zone of authigenesis or a change in the amountof authigenic precipitation, but detailed correla-tions at finer scales may prove less reliable.
Including a third major sink for carbon in sed-imentary reservoirs does not sever the connectionbetween d13Ccarb and the redox evolution of theEarth surface, but it does imply a more complexrelationship. Rather than massive changes in at-mospheric O2 and CO2, our framework explainsthe large variations in d13Ccarb in terms of changesin the amount of authigenic carbonate driven per-haps by small changes in atmospheric O2 but po-tentially also by changes in the other redox budgets(SO4 and Fe), in the strength or even existence ofa lysocline, or in the focusing of organic carbonburial in different sedimentary environments.Withthis new framework, the challenge remains to usethe geologic record to understand the driving forcesand events that have shaped Earth’s surface.
References and Notes1. H. C. Urey, Science 108, 489 (1948).2. W. S. Broecker, J. Geophys. Res. 75, 3553 (1970).3. The inputs of carbon to Earth’s surface carbon reservoirs
include the return flux of CO2 from subduction ormetamorphic release of carbon from carbonate andorganic matter, the outgassing of mantle carbon, and theweathering of carbonate and organic matter. For a morecomplete discussion, see (39).
4. A. H. Knoll, J. M. Hayes, A. J. Kaufman, K. Swett,I. B. Lambert, Nature 321, 832 (1986).
5. J. M. Hayes, H. Strauss, A. J. Kaufman, Chem. Geol. 161,103 (1999).
6. R. A. Berner, Am. J. Sci. 309, 603 (2009).
7. L. R. Kump et al., Science 334, 1694 (2011).8. M. R. Saltzman et al., Proc. Natl. Acad. Sci. U.S.A. 108,
3876 (2011).9. F. A. Macdonald et al., Science 327, 1241 (2010).10. G. P. Halverson, P. F. Hoffman, D. P. Schrag, A. C. Maloof,
A. H. N. Rice, Geol. Soc. Am. Bull. 117, 1181 (2005).11. D. C. Catling, M. W. Claire, Earth Planet. Sci. Lett. 237,
1 (2005).12. T. F. Bristow, M. J. Kennedy, Geology 36, 863 (2008).13. D. P. Schrag, R. A. Berner, P. F. Hoffman,
G. P. Halverson, Geochem. Geophys. Geosyst. 3,1036 (2002).
14. C. J. Bjerrum, D. E. Canfield, Proc. Natl. Acad. Sci. U.S.A.108, 5542 (2011).
15. T. H. Naehr et al., Deep Sea Res. Part II Top. Stud.Oceanogr. 54, 1268 (2007).
16. H. H. Roberts, P. Aharon, Geo-Mar. Lett. 14, 135 (1994).17. P. Meister et al., Sedimentology 54, 1007 (2007).18. C. E. Reimers, K. C. Ruttenberg, D. E. Canfield,
M. B. Christiansen, J. B. Martin, Geochim. Cosmochim.Acta 60, 4037 (1996).
19. L. G. Anderson, D. Dyrssen, J. Skei,Mar. Chem. 20, 361 (1987).20. Z. Zhu, R. C. Aller, J. Mak, Cont. Shelf Res. 22, 2065 (2002).21. R. C. Aller, N. E. Blair, Q. Xia, P. D. Rude, Cont. Shelf Res.
16, 753 (1996).22. N. Chow, S. Morad, I. S. Al-Aasm, J. Sediment. Res. 70,
682 (2000).23. J. A. Higgins, W. W. Fischer, D. P. Schrag, Earth Planet.
Sci. Lett. 284, 25 (2009).24. A. Prokoph, G. A. Shields, J. Veizer, Earth Sci. Rev. 87,
113 (2008).25. G. Jiang, A. J. Kaufman, N. Christie-Blick, S. Zhang,
H. Wu, Earth Planet. Sci. Lett. 261, 303 (2007).26. B. Shen et al., Geochim. Cosmochim. Acta 75, 1357 (2011).27. Bjerrum and Canfield (40) derived a similar expression
for the addition of carbonate derived from carbonatizationreactions in seafloor basalt. The mathematical expressionis identical, but the isotopic fractionation for carbonatizationis much smaller and hence provides a much smaller
lever to affect the global carbon isotope mass balance.A more complete expression would include separateterms for carbonate in carbonatized basalts as well,provided that they represent removal of carbon fromseawater rather than carbon from volcanic outgassingthat was never counted in the surface budget.
28. O. Sivan, D. P. Schrag, R. W. Murray, Geobiology 5, 141 (2007).29. J. P. Grotzinger, D. A. Fike, W. W. Fischer, Nat. Geosci. 4,
285 (2011).30. D. T. Johnston, F. A. Macdonald, B. C. Gill, P. F. Hoffman,
D. P. Schrag, Nature 483, 320 (2012).31. The absence of covariation of the d13C of organic carbon
may also be explained by contamination with a secondarycomponent, such as detrital organic carbon (30).
32. L. A. Derry, Earth Planet. Sci. Lett. 294, 152 (2010).33. L. P. Knauth, M. J. Kennedy, Nature 460, 728 (2009).34. S. M. A. Duguid, T. K. Kyser, N. P. James, E. C. Rankey,
J. Sediment. Res. 80, 236 (2010).35. A. C. Maloof et al., Geol. Soc. Am. Bull. 122, 1731 (2010).36. J. L. Payne et al., Science 305, 506 (2004).37. A. H. Knoll, J. A. Babcock, J. L. Payne, S. B. Pruss,
W. W. Fischer, Earth Planet. Sci. Lett. 256, 295 (2007).38. K. M. Meyer, M. Yu, A. B. Jost, B. M. Kelley, J. L. Payne,
Earth Planet. Sci. Lett. 302, 378 (2011).39. J. M. Hayes, J. R. Waldbauer, Phil. Trans. R. Soc. B 361,
931 (2006).40. C. J. Bjerrum, D. E. Canfield, Geochem. Geophys. Geosys.
5, Q08001 (2004).
Acknowledgments: The paper benefited from reviewsfrom J. Hayes, R. Aller, and an anonymous reviewer. Theauthors acknowledge P. Hoffman for his helpful comments.This work was supported by NSF grant OCE-0961372 to D.P.S.and a Canadian Institute for Advanced Research JuniorFellowship to J.A.H. D.P.S. also thanks the Henry and WendyBreck Foundation for support.
31 August 2012; accepted 12 December 201210.1126/science.1229578
Variable Clonal RepopulationDynamics Influence ChemotherapyResponse in Colorectal CancerAntonija Kreso,1,2* Catherine A. O’Brien,1,3* Peter van Galen,1 Olga I. Gan,1 Faiyaz Notta,1,2Andrew M. K. Brown,4 Karen Ng,4 Jing Ma,5 Erno Wienholds,1 Cyrille Dunant,6 Aaron Pollett,7Steven Gallinger,8 John McPherson,4 Charles G. Mullighan,5 Darryl Shibata,9 John E. Dick1,2†
Intratumoral heterogeneity arises through the evolution of genetically diverse subclones during tumorprogression. However, it remains unknown whether cells within single genetic clones are functionallyequivalent. By combining DNA copy number alteration (CNA) profiling, sequencing, and lentiviral lineagetracking, we followed the repopulation dynamics of 150 single lentivirus-marked lineages from 10 humancolorectal cancers through serial xenograft passages in mice. CNA and mutational analysis distinguishedindividual clones and showed that clones remained stable upon serial transplantation. Despite thisstability, the proliferation, persistence, and chemotherapy tolerance of lentivirally marked lineages werevariable within each clone. Chemotherapy promoted the dominance of previously minor or dormantlineages. Thus, apart from genetic diversity, tumor cells display inherent functional variability in tumorpropagation potential, which contributes to both cancer growth and therapy tolerance.
Cancer is sustained by production of aberrantcells that vary in manymorphological andphysiological properties. This cellular diver-
sity remains amajor challenge to our understandingof the neoplastic process and therapeutic resistance.Genetic and nongenetic processes can generate het-erogeneity; however, the degree of coordinationbetween these mechanisms and their relative con-tribution to tumor propagation remains unresolved.
Tumor cell diversity can arise through accruedgenetic changes (1) that result in single tumorscomposed of many subclones that develop throughcomplex evolutionary trajectories (2, 3). As well,tumors contain genetic subclones that vary withrespect to differential growth in xenograft assays(4–6), recurrence (7), and metastatic potential(8, 9). Likewise, resistance to cancer therapiescan arise through genetic mutations (10, 11).
www.sciencemag.org SCIENCE VOL 339 1 FEBRUARY 2013 543
RESEARCH ARTICLES
on
Janu
ary
31, 2
013
ww
w.s
cien
cem
ag.o
rgD
ownl
oade
d fr
om

These and other studies substantiate the widelyaccepted view that tumors comprise geneticallydiverse subclones, some of which survive therapyand contribute to disease recurrence.
In the absence of differences at the level ofgeneticmutation, heterogeneitywithin a populationof tumor cells can still exist, but the mechanismsremain incompletely understood. For example,the bidirectional interaction between tumor cellsand the microenvironment can influence tumorphenotype (12). Other processes have also beenproposed, including interconvertible activationof Rac and Rho guanosine triphosphatases (13),metastable configurations of intracellular net-works (14, 15), and altered epigenetic states (16).These studies collectively indicate that in appar-ently homogeneous in vitro environments, cellsof the same genotype can exist in different statesthat influence their behavior (17). The detectionof in vitro cellular diversity, which is not coupledto genetic diversity, underscores the need to inves-tigate the extent of intraclonal functional hetero-geneity in vivo and in primary human cancers.
Arguably the most important function of anycancer clone is tomaintain long-term tumor propa-gation. For many tumors, only a minority of cellsare able to sustain tumor growth, although suchcells can constitute the majority of tumor cells forsome cancer types (18, 19).Whether these cells arepart of one genetic clone or are derived from dis-tinct genetic subclones remains to be determined.Moreover, whether tumor-propagating cells of asingle genetic clone are all equivalent or whetherthere is functional variability among individual tu-mor cells is uncertain. Addressing these questionsrequires genetic analyses combinedwith functionalassays that measure tumor propagation at the resolu-tion of individual clones derived from single cells.
Clonal stability is maintained through serialtumor transplantation. To explore the relativecontribution of genetic and nongenetic mecha-nisms to the functional heterogeneity of singlehuman cancer cells that are capable of long-termclonal propagation, we used an in vivo xeno-transplantation assay. The fates of single cell–derived lineages were tracked from 10 primaryhuman colorectal cancers (CRCs; table S1). Tofacilitate clonal tracking, we transduced patient-
derived CRC cells with a green fluorescent pro-tein (GFP)–expressing lentivirus and injectedthe cells into the renal capsule of immunode-ficient mice (supplementary text and tables S2and S3). Transduced cells efficiently generatedxenografts, and GFP expression in the xeno-grafts remained stable over serial transplantation(figs. S1 and S2). The average time to palpabletumor formation (99 T 18 days) was stable overserial transplants (Fig. 1A), and xenografts main-tained patient tumor characteristics (figs. S3to S5). Genomic profiling of three patient tumorsand corresponding xenografts using copy num-ber alteration (CNA) analysis (Fig. 1B, figs. S6and S7, and table S4) and targeted deep sequenc-ing of 660 mutational hotspots in 42 genes (Fig.1C and tables S5 to S7) established that xeno-grafts largely retained the genomic profile of theprimary tumor sample. Several CNAs and single-nucleotide variants (SNVs) were enriched in pri-mary 1° xenografts from some samples, consistentwith selection of a subclone from the patient tu-mor. Genomic analysis of subsequent xenografttransplants, encompassing 393 days (patient sam-ple CT38), 341 days (CT54), and 261 days (CT59)of total tumor growth, demonstrated that the ma-jority of genomic lesions detected in 1° xenograftswere recapitulated upon serial passage (supple-mentary text). Exome sequencing of CT38 andits corresponding 1°, 2°, and 4° xenografts sup-ported these findings (supplementary text, figs.S8 and S9, and tables S8 to S11). Finally, anal-ysis of methylation pattern diversity of patienttumors and their corresponding xenografts indi-cated that population diversity was maintainedover serial passage (supplementary text and fig.S10). Collectively, these data indicate that the CRCclones that are selected in the xenograft remainstable over sequential transplantation.
Variation in clonal dynamics of CRC cells. Toevaluate the repopulation kinetics ofmultiple singlecell–derived clones within a primary human tu-mor, we used lentiviral marking to track the prog-eny of single CRC cells (henceforth termed “LVclones” to distinguish them from genetic clones)over serial xenografts. To facilitate qualitative andquantitative characterization, we developed a sys-tem for establishing clonal identity and then clas-sifying clonal behavior according to persistence,absence, or emergence across multiple recipients(see supplementary text). Rather than relying onthe polymerase chain reaction, our detection strat-egy focused on the identification of LV clonesthat possessed robust clonal expansion capacity.
We observed five distinct behaviors. LV clonesthat were present in all serial transplants weretermed type I or persistent clones (Fig. 2A, purplearrowhead). LV clones that did not persist butexhausted before reaching the final passage hadless potent tumor-propagating ability relative totype I clones; these were termed type II or short-term clones (Fig. 2A, blue arrowhead). Finally, weobserved LV clones that lacked tumor-propagatingability because they were only detected in the 1°recipient and were not detected in 2° and subse-
quent recipients (Fig. 2A, green arrowhead); thesewere termed type III or transient clones. In 10patient samples, out of a total of 150marked clones,we tracked 34 type I, 33 type II, and 31 type IIIclones (Fig. 2B), which suggests that there issubstantial functional diversity with respect toclonal longevity in successive tumor transplants.
In addition to heterogeneity in longevity, wealso observed dynamic behaviors in 34 of the 150marked clones. These LV clones were initiallybelow detection limits (approximately 104 cells/tumor) in the 1° recipients but could be identifiedat later transplants (Fig. 2A, red arrowhead). Be-cause the xenograft assay monitors the output of“active” CRC cells, these type IV or resting LVclones were likely produced by CRC cells thatinitially were dormant or slowly proliferated butbecame activated in later transplants, resulting inthe generation of a measurable clone. Finally, LVcloneswhose progeny appeared early, then becameundetectable in a subsequent transplant, only toreappear at a later time point (Fig. 2A, orange ar-rowhead) were termed typeVor fluctuating clones.Such LV clones displayed extensive but intermit-tent proliferation distinct from the continuousrapid proliferation of type I clones; we observed 18examples of typeV clones (Fig. 2B). Overall, theseresults show that not all CRC cells with the po-tential for tumor propagation actually function andcontribute to tumor growth at any given time. Suchcells can become activated at later time points.
It is noteworthy that LV clones can remainundetected for 2 to 4 months while being dilutedby a factor of >100 during consecutive trans-plants and then recur to dominate tumor growth(supplementary text and fig. S11). Whereasrandom growth dynamics would predict dilutionof minor LV clones over multiple transplants, thefrequent detection of type IV and V clones in-dicates that the behaviors we observe cannot besolely attributed to dilution over time or sto-chasticity in LV clonal behaviors. Further, math-ematical modeling also predicted that LV clonalemergence correlates with changes in tumor struc-ture and that newly appearing clones are function-ally distinct from active clones, although it didraise uncertainty as to whether types I, II, and IIIare distinct or whether stochastic processes relatedto the transplantation method may contribute toclonal loss (supplementary text and fig. S12). Thedistinct proliferative kinetics of the five LV clonalbehaviors we observed underscore the functionalvariability of individual cells (Fig. 2C). Each LVclone type was identified in four or more patientsamples (Fig. 2D and fig. S13), establishing thatthe varied clonal behaviors are reproducibly foundin primary CRC from a spectrum of patients.Given the absence of accompanying changes inCNAs and SNVs with serial transplantation, ourdata provide evidence for functional heterogeneitybetween individual tumor-propagating cells thatshare a common genetic lineage.
The genetic analysis across xenografts wascarried out on bulk tumor cell populations, whereclonal marking tracked the functional behavior
1Campbell Family Institute, Ontario Cancer Institute, PrincessMargaret Cancer Centre, University Health Network, Toronto,Ontario M5G 1L7, Canada. 2Department of Molecular Genetics,University of Toronto, Toronto, Ontario M5G 1L7, Canada.3Department of Laboratory Medicine and Pathobiology andDepartment of Surgery, University of Toronto, Toronto, OntarioM5L 1F4, Canada. 4Ontario Institute for Cancer Research,Toronto, Ontario M5G 1L7, Canada. 5St. Jude Children’s Hos-pital, Memphis, TN 38105, USA. 6Department of Civil Engi-neering,University of Toronto, Toronto,OntarioM5S1A4,Canada.7Deparment of Pathology, Mount Sinai Hospital, Toronto, OntarioM5G 1X5, Canada. 8Fred Litwin Centre for Cancer Genetics,Samuel Lunenfeld Research Institute, Mount Sinai Hospital,Toronto, Ontario M7H 2B9, Canada. 9University of SouthernCalifornia Keck School of Medicine, Los Angeles, CA 90089,USA.
*These authors contributed equally to this work.†To whom correspondence should be addressed. E-mail:[email protected]
1 FEBRUARY 2013 VOL 339 SCIENCE www.sciencemag.org544
RESEARCH ARTICLES
on
Janu
ary
31, 2
013
ww
w.s
cien
cem
ag.o
rgD
ownl
oade
d fr
om

of single cells. The experimental design of ge-nomically analyzing bulk tumor does not directlyevaluate the genomic properties of each indi-vidual functionally distinct LV clone type thatis present. To directly compare the genomes ofdistinct LV clone types from an individual tumor,we used a limiting dilution approach to isolatedifferent LV clones and used deep sequencing ofmutational hotspots to compare their mutationalload. We compared the mutational hotspots be-tween tumors generated by a type I and type Vclone from CT38 and a type I and type II clonefrom CT59. For CT38, a linear correlation be-tween the SNV frequencies of the type I– andtype V–derived tumors was seen (fig. S14A andtable S12). Likewise, for CT59, type I– and type
II–derived tumors also demonstrated similar SNVfrequencies in all analyzed SNVs, including thenine somatically acquired SNVs (fig. S14B andtable S13). Thus, for both CT38 and CT59, thefrequency of analyzed hotspot mutations was con-gruent between tumors generated by single LVclones, which were derived from distinct clonetypes (type I and V for CT38; type I and II forCT59). Analyzing tumors generated from singlecells enabled us to determine that distinct clone typeswithin a tumor sample share similar mutationalpatterns as assessed by targeted sequencing. Thesedata, together with the CNA and targeted sequenc-ing analysis of the bulk tumor, provide furtherevidence for the existence of functionally dis-tinct LV clones within a genetic lineage in CRC.
Variable response of LV clones to oxaliplatin.The existence of functionally heterogeneous CRCcells prompted us to investigate whether thesecells might also intrinsically differ in response totherapy. We examined the effect of a commonlyused chemotherapy drug, oxaliplatin, on the dy-namics of LV clones. We used established xeno-grafts of five patient samples for which the LVclone types had already been curated. In parallelwith the serial transplantation of untreated recip-ient mice described above, three to five addi-tional mice were transplanted with tumor cellsand systemically treated with oxaliplatin once tu-mors were established, allowing assessment ofthe effects of drug treatment on steady-state clo-nal distribution (fig. S15A). Although oxaliplatin
KRTAP19-6 G20G
TP53 R196X
CT54: 1°
0.00 0.25 0.50 0.75 1.000.00
0.25
0.50
0.75
1.00CT54: 5°
0.00 0.25 0.50 0.75 1.000.00
0.25
0.50
0.75
1.00
TP53 R283H
CT59: 2°
0.00 0.25 0.50 0.75 1.000.00
0.25
0.50
0.75
1.00APC G487R
CDH1
MSH2 V695L
TP53 N156H
BRAF V600EFBXW7 R104XFBXW7 W408CFLT3 C452X
PDGFRA P567L
KIT C902C
CT38: 1°
0.00 0.25 0.50 0.75 1.000.00
0.25
0.50
0.75
1.00
CT59: 1°
0.00 0.25 0.50 0.75 1.000.00
0.25
0.50
0.75
1.00
CT38: 2°
0.00 0.25 0.50 0.75 1.000.00
0.25
0.50
0.75
1.00CT38: 4°
0.00 0.25 0.50 0.75 1.000.00
0.25
0.50
0.75
1.00
HRAS A18V
Var
iant
alle
le fr
eque
ncy:
xen
ogra
fts
Variant allele frequency: patient tumor
CT54: 2°
0.00 0.25 0.50 0.75 1.000.00
0.25
0.50
0.75
1.00
STK11
MSH2 K675XMSH2 V695G
FGFR1
APC R213X
RET
CT59
tm2
A B
C
tm2
tm3
tm2
tm3
tm3
Pat
ient
tum
or
1° 2°
CT38
Pat
ient
tum
or
1° 2°
Pat
ient
tum
or
1° 2°
CT54
tm1
tm2
tm3
tm1
tm2
tm3
tm1
tm4
tm1
tm2
tm3
tm1
tm2
tm3
tm4
1
2
3
4
5
6
7
8
9
11
10
12
13
14
15
16
17
18
19
20
21 22
X
Y
4°
tm1
tm3
5°
tm1
Chr
. num
ber
log2 ratio
Fig. 1. Xenograft characterization. (A) Diagnostic tumor samples were transduced with a lentiviralvector encoding GFP, and 5 × 10⁴ to 2 × 10⁵ viable cells were transplanted into immunodeficientmice. Once tumors formed (1°), an equal number of cells was transplanted into the next passage.Time to tumor formation from previous injection for each transplant is shown. Each point is themean of all recipients at the indicated passage. (B) DNA from diagnostic and matching 1°, 2°, 4°,and 5° tumor transplants was profiled using Affymetrix SNP 6.0 arrays. Raw log2 ratios are shown(median smoothing format; blue, deletion; white, normal; red, gain). (C) DNA from diagnostic andxenograft derived tumors was sequenced using the RainDance platform. Frequency of both germ-line (gray circles) and somatic variants (colored circles) is shown. Each circle represents data of onexenograft-derived tumor as compared to the patient tumor sample; there are three or four xeno-grafts per passage. Data are not normalized for copy number changes and tumor cellularity, althoughgenerally >80% of cells are estimated to be tumor cells.
www.sciencemag.org SCIENCE VOL 339 1 FEBRUARY 2013 545
RESEARCH ARTICLES
on
Janu
ary
31, 2
013
ww
w.s
cien
cem
ag.o
rgD
ownl
oade
d fr
om

treatment reduced tumor burden (figs. S15B andS16A), there was no apparent change in the ab-solute number of marked clones (fig. S15C), norwere the proportions of clone types significantlyaltered (figs. S15D and S17).
To determine whether treatment with oxali-platin affected CRC cells with tumor propagationcapability, we serially transplanted equal num-bers of viable cells from both the control andtreatment groups into secondary mice that wereleft untreated. Across five patient samples, a totalof 60 secondary recipients were transplanted withtumor cells from oxaliplatin-treated xenografts(31 control and 29 oxaliplatin-treated). We ob-served a reduction in tumor weight (Fig. 3A andfig. S16B), as well as a trend toward a decrease inthe absolute number of clones (Fig. 3B), in un-
treated secondary recipients transplantedwith cellsfrom oxaliplatin-treated xenografts versus sham-treated control cells; these results suggested thatdrug treatment altered the growth properties of theregrown tumor. For two samples (CT33 andCT57),GFP-expressing tumor tissue was not detected inthe secondary recipients that were transplantedwith oxaliplatin-treated cells, which precludedlentiviral insertion site analysis. For the remain-ing three patient samples (CT17, CT38, andCT54),major changes in the proportion of LV clone typesoccurred in xenografts derived from the oxaliplatin-treated group relative to control xenografts (Fig.3C). The proportion of type I persistent clones wasreduced, whereas LV clones that were below thedetection limit in primary recipients appeared insecondary recipients transplanted with oxaliplatin-
treated tumors (Fig. 3D; Fig. 3E, arrowheads tothe right). These newLV clones were classified astype IV because they were not consistently de-tected in control or oxaliplatin-treated tumors inpreceding mice. When considering the absolutenumbers of different LV clone types over thecomplete set of secondary mice, 84 type I cloneswere observed inmice transplantedwith untreatedcontrol cells and 27 type I clones in mice trans-planted with oxaliplatin-treated cells (Fig. 3D).By contrast, 12 type IV clones were detected inthe control group versus 40 type IV clones in theoxaliplatin-treated group. These data indicatethat the response of individual CRC cells to stan-dard chemotherapy is markedly variable. Despiteeradication of some persistent LV clones, rest-ing or slowly proliferating CRC cells can endure
CT19
258 5460
20406080
100120
1° 2°n=1 n=1
CT33
111 194 294 4140
20406080
100120
1° 2° 3° 4°n=1 n=2 n=3 n=2
112 238 313 3930
20406080
100120
1° 2° 3° 4°n=1 n=3 n=5n=2
CT17CT15
74 161 2570
20406080
100120
1° 2° 3°n=1 n=4 n=1
CT51
67 168 2520
20406080
100120
1° 3°n=1 n=2n=3
2°
020406080
100120
150 236 308 393 515
CT38 in NOD/SCID1° 2° 3° 5°
n=1 n=3 n=4 n=3n=34°
CT59
147 261 341 4240
20406080
100120
1° 2° 3° 4°n=1 n=3 n=4 n=1
CT54 in NOD/SCID
70 123 182 260 341 4200
20406080
100120
1° 2° 3° 4° 5° 6°n=1 n=4 n=4 n=4 n=3 n=3
CT57
13971 215 3280
20406080
100120
1° 2° 3° 4°n=1 n=3 n=3n=2
CT64
146 3170
20406080
100120
1° 2°n=1 n=2
CT38 in NSG
150 236 308 393 5150
20406080
100120
1° 2° 3° 4° 5°n=1 n=3 n=3 n=3 n=1
CT54 in NSG
70 123 182 260 341 4200
20406080
100120
1° 2° 3° 4° 5° 6°n=1 n=3 n=3 n=4 n=3 n=3
Days since original injection (n = number of tumors analyzed)
Clo
ne d
istr
ibut
ion
(ave
rage
per
cent
age
of to
tal)
not detected
not detected
Time/passage
2° 1° 3° 4° 5° 2° 1° 3° 4° 2° 1° 3°
CT38 CT59 CT15
A B
C
D
Fig. 2. Variation in repopulation potential of individual lentivirally-markedCRC cells. (A) DNA from xenografts (one tumor per lane) of various transplants(denoted by 1°, 2°,…, 5°) was analyzed using Southern blotting with a GFPprobe. Arrows above certain lanes indicate the tumor that was retransplantedinto the next set of mice. Colored arrowheads indicate representative exam-ples of different lentivirally marked (LV) clone types. (B) Pie chart showing thesum of each of the five LV clone types observed over all experiments. (C)Schematic illustrating the different types of LV clonal behaviors. LV cloneswere classified on the basis of detection in serial transplants; for example, atype IV clone would be below the detection limit initially and come up in later
transplants. (D) Charts showing the proportion of LV clone types for eachpatient sample, displayed as the averages of all mice per transplant. Theproportion of each LV clone type was determined in every recipient mouse bydividing the number of times a particular LV clone type was observed by thetotal number of LV clones detected in that mouse, thereby normalizing fordifferential marking of samples. Next, the proportion of each LV clone type forall recipients per transplant was averaged, including recipients for which LVclones were not detected. Each bar is representative of the averaged data at atransplant, and error bars indicate SEM between the tumors; n denotes thenumber of tumors or recipients analyzed.
1 FEBRUARY 2013 VOL 339 SCIENCE www.sciencemag.org546
RESEARCH ARTICLES
on
Janu
ary
31, 2
013
ww
w.s
cien
cem
ag.o
rgD
ownl
oade
d fr
om
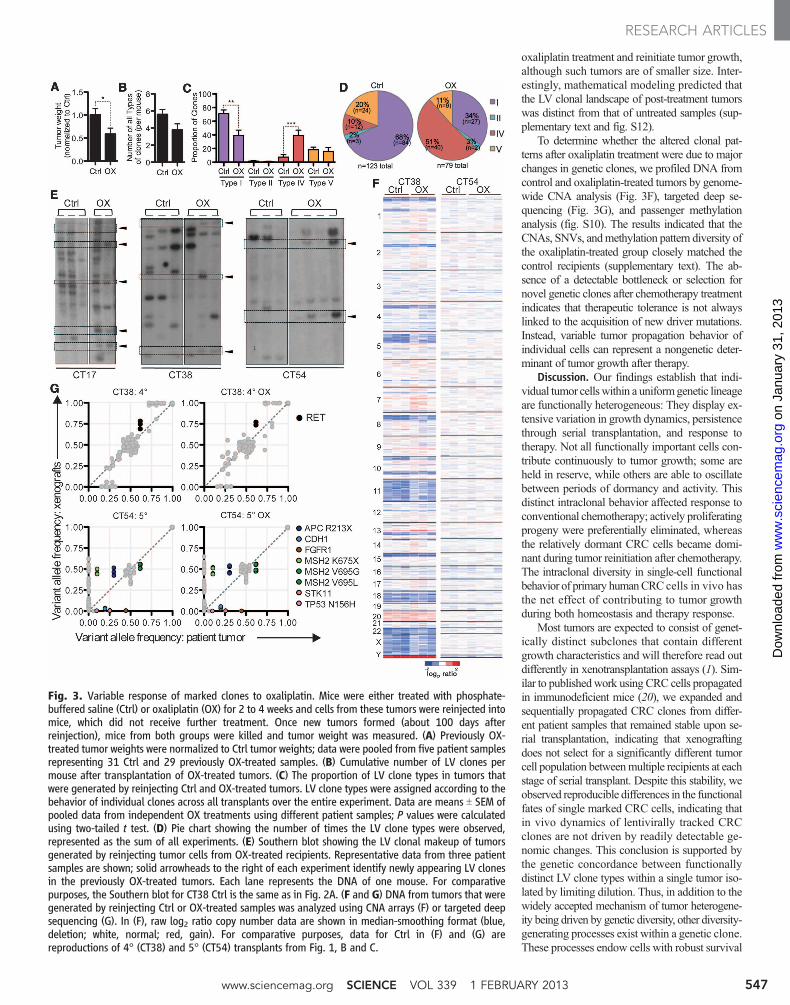
oxaliplatin treatment and reinitiate tumor growth,although such tumors are of smaller size. Inter-estingly, mathematical modeling predicted thatthe LV clonal landscape of post-treatment tumorswas distinct from that of untreated samples (sup-plementary text and fig. S12).
To determine whether the altered clonal pat-terns after oxaliplatin treatment were due to majorchanges in genetic clones, we profiled DNA fromcontrol and oxaliplatin-treated tumors by genome-wide CNA analysis (Fig. 3F), targeted deep se-quencing (Fig. 3G), and passenger methylationanalysis (fig. S10). The results indicated that theCNAs, SNVs, andmethylation pattern diversity ofthe oxaliplatin-treated group closely matched thecontrol recipients (supplementary text). The ab-sence of a detectable bottleneck or selection fornovel genetic clones after chemotherapy treatmentindicates that therapeutic tolerance is not alwayslinked to the acquisition of new driver mutations.Instead, variable tumor propagation behavior ofindividual cells can represent a nongenetic deter-minant of tumor growth after therapy.
Discussion. Our findings establish that indi-vidual tumor cellswithin a uniformgenetic lineageare functionally heterogeneous: They display ex-tensive variation in growth dynamics, persistencethrough serial transplantation, and response totherapy. Not all functionally important cells con-tribute continuously to tumor growth; some areheld in reserve, while others are able to oscillatebetween periods of dormancy and activity. Thisdistinct intraclonal behavior affected response toconventional chemotherapy; actively proliferatingprogeny were preferentially eliminated, whereasthe relatively dormant CRC cells became domi-nant during tumor reinitiation after chemotherapy.The intraclonal diversity in single-cell functionalbehavior of primary humanCRCcells in vivo hasthe net effect of contributing to tumor growthduring both homeostasis and therapy response.
Most tumors are expected to consist of genet-ically distinct subclones that contain differentgrowth characteristics and will therefore read outdifferently in xenotransplantation assays (1). Sim-ilar to publishedwork using CRC cells propagatedin immunodeficient mice (20), we expanded andsequentially propagated CRC clones from differ-ent patient samples that remained stable upon se-rial transplantation, indicating that xenograftingdoes not select for a significantly different tumorcell population betweenmultiple recipients at eachstage of serial transplant. Despite this stability, weobserved reproducible differences in the functionalfates of single marked CRC cells, indicating thatin vivo dynamics of lentivirally tracked CRCclones are not driven by readily detectable ge-nomic changes. This conclusion is supported bythe genetic concordance between functionallydistinct LV clone types within a single tumor iso-lated by limiting dilution. Thus, in addition to thewidely accepted mechanism of tumor heterogene-ity being driven by genetic diversity, other diversity-generating processes exist within a genetic clone.These processes endow cells with robust survival
Fig. 3. Variable response of marked clones to oxaliplatin. Mice were either treated with phosphate-buffered saline (Ctrl) or oxaliplatin (OX) for 2 to 4 weeks and cells from these tumors were reinjected intomice, which did not receive further treatment. Once new tumors formed (about 100 days afterreinjection), mice from both groups were killed and tumor weight was measured. (A) Previously OX-treated tumor weights were normalized to Ctrl tumor weights; data were pooled from five patient samplesrepresenting 31 Ctrl and 29 previously OX-treated samples. (B) Cumulative number of LV clones permouse after transplantation of OX-treated tumors. (C) The proportion of LV clone types in tumors thatwere generated by reinjecting Ctrl and OX-treated tumors. LV clone types were assigned according to thebehavior of individual clones across all transplants over the entire experiment. Data are means T SEM ofpooled data from independent OX treatments using different patient samples; P values were calculatedusing two-tailed t test. (D) Pie chart showing the number of times the LV clone types were observed,represented as the sum of all experiments. (E) Southern blot showing the LV clonal makeup of tumorsgenerated by reinjecting tumor cells from OX-treated recipients. Representative data from three patientsamples are shown; solid arrowheads to the right of each experiment identify newly appearing LV clonesin the previously OX-treated tumors. Each lane represents the DNA of one mouse. For comparativepurposes, the Southern blot for CT38 Ctrl is the same as in Fig. 2A. (F and G) DNA from tumors that weregenerated by reinjecting Ctrl or OX-treated samples was analyzed using CNA arrays (F) or targeted deepsequencing (G). In (F), raw log2 ratio copy number data are shown in median-smoothing format (blue,deletion; white, normal; red, gain). For comparative purposes, data for Ctrl in (F) and (G) arereproductions of 4° (CT38) and 5° (CT54) transplants from Fig. 1, B and C.
www.sciencemag.org SCIENCE VOL 339 1 FEBRUARY 2013 547
RESEARCH ARTICLES
on
Janu
ary
31, 2
013
ww
w.s
cien
cem
ag.o
rgD
ownl
oade
d fr
om

potential, especially during stress. The contribu-tion of diversity-generating mechanisms suchas epigenetic regulation, noise in gene expression,or variability in the microenvironment (21, 22)may offer insight into CRC cell heterogeneity.
There is growing evidence of evolutionaryselection for diversity-generating mechanisms inother disciplines, such as ecology (23, 24) andmicrobiology (25–27). For example, geneticallyhomogeneous pools of single-cell prokaryotesdisplay heterogeneity, where a small portion ofcells naturally display drug resistance that isnot caused by genetic mutation or acquisitionof plasmids encoding antibiotic resistance genes.Rather, this phenomenon is due to mechanismsthat reduce cell proliferation and induce a dor-mant nondividing state (28). We consistently ob-served a relatively dormant cell population inCRC, which suggests that cancer cells may takeadvantage of this “ancient” mechanism and usedormancy as an adaptive strategy during times ofstress. We provide evidence for a relatively dor-mant or slowly proliferating cell population inprimary human CRC cells that still retains potenttumor propagation potential, thereby preferentiallydriving tumor growth after chemotherapy. Thesefindings may provide a biological basis for re-current and metastatic disease following standard-of-care treatment (29). Our findings should focusefforts to uncover the molecular mechanisms driv-ing chemotherapeutic tolerance in CRC cells.
The often unstated assumption in consideringcellular response to stress is that cells react in auniform manner to the inducing signal, becausethe classical techniques used bulk populations.However, averaging data across millions of cellshas the effect of masking any heterogeneity thatmight exist at the single-cell level. Such con-
ventions are changing asmethodological advances(30) are fueling a surge of interest in the processesgoverning cell-to-cell variability (14). By couplinggenetic analysis to functional tumor growth as-says, we find that when cells are tracked at single-cell resolutionwhile still being part of a populationof cancer cells, variable cellular behaviors can bedetected. These observations set a precedent forfuture studies examining the basis of intraclonalbehavior of single cells, especially with respect totumor propagation and other functional properties.In a broader sense, our findings reveal another layerof complexity, beyond genetic diversity, that drivesthe intratumoral heterogeneity of CRC. The pros-pect of understanding how genetic and non-genetic determinants interact to influence thefunctional diversity and therapy response for oth-er cancers should drive future cancer research.
References and Notes1. M. Greaves, C. C. Maley, Nature 481, 306 (2012).2. S. Nik-Zainal et al.; Breast Cancer Working Group of the
International Cancer Genome Consortium, Cell 149, 994 (2012).3. M. Gerlinger et al., N. Engl. J. Med. 366, 883 (2012).4. K. Anderson et al., Nature 469, 356 (2011).5. F. Notta et al., Nature 469, 362 (2011).6. E. Clappier et al., J. Exp. Med. 208, 653 (2011).7. C. G. Mullighan et al., Science 322, 1377 (2008).8. X. Wu et al., Nature 482, 529 (2012).9. W. Liu et al., Nat. Med. 15, 559 (2009).10. M. E. Gorre et al., Science 293, 876 (2001).11. C. Roche-Lestienne, J. L. Laï, S. Darré, T. Facon,
C. Preudhomme, N. Engl. J. Med. 348, 2265 (2003).12. M. J. Bissell, M. A. Labarge, Cancer Cell 7, 17 (2005).13. V. Sanz-Moreno et al., Cell 135, 510 (2008).14. S. L. Spencer, S. Gaudet, J. G. Albeck, J. M. Burke,
P. K. Sorger, Nature 459, 428 (2009).15. A. Roesch et al., Cell 141, 583 (2010).16. S. V. Sharma et al., Cell 141, 69 (2010).17. P. B. Gupta et al., Cell 146, 633 (2011).18. K. Ishizawa et al., Cell Stem Cell 7, 279 (2010).19. P. N. Kelly, A. Dakic, J. M. Adams, S. L. Nutt, A. Strasser,
Science 317, 337 (2007).
20. S. Jones et al., Proc. Natl. Acad. Sci. U.S.A. 105, 4283(2008).
21. A. Marusyk, V. Almendro, K. Polyak, Nat. Rev. Cancer 12,323 (2012).
22. M. Kærn, T. C. Elston, W. J. Blake, J. J. Collins, Nat. Rev.Genet. 6, 451 (2005).
23. M. Loreau et al., Science 294, 804 (2001).24. D. F. Flynn, N. Mirotchnick, M. Jain, M. I. Palmer,
S. Naeem, Ecology 92, 1573 (2011).25. H. B. Fraser, A. E. Hirsh, G. Giaever, J. Kumm,
M. B. Eisen, PLoS Biol. 2, e137 (2004).26. H. L. True, S. L. Lindquist, Nature 407, 477 (2000).27. J. M. Raser, E. K. O’Shea, Science 304, 1811 (2004).28. K. Lewis, Nat. Rev. Microbiol. 5, 48 (2007).29. A. M. Abulafi, N. S. Williams, Br. J. Surg. 81, 7 (1994).30. J. M. Raser, E. K. O’Shea, Science 309, 2010 (2005).
Acknowledgments: We thank L. Gibson, A. Khandani, andP. Penttila for experimental support and members of the Dicklab, especially M. Doedens, J. Wang, M. Milyavsky, andE. Laurenti for technical support and critical assessment of thiswork, as well as UHN biobank for specimens, the ClinicalApplications of Core Technology (Affymetrix) Laboratory of theHartwell Center for Bioinformatics and Biotechnology of St.Jude Children’s Research Hospital, and the American LebaneseSyrian Associated Charities of St. Jude Children’s ResearchHospital. Supported by Genome Canada through the OntarioGenomics Institute, Ontario Institute for Cancer Research and aSummit Award with funds from the province of Ontario, theCanadian Institutes for Health Research, the NetherlandsOrganisation for Scientific Research, NIH grant R21CA149990-01, a Canada Research Chair, the PrincessMargaret Hospital Foundation, and the Ontario Ministry ofHealth and Long Term Care (OMOHLTC). The views expresseddo not necessarily reflect those of the OMOHLTC.
Supplementary Materialswww.sciencemag.org/cgi/content/full/science.1227670/DC1Materials and MethodsSupplementary TextFigs. S1 to S17Tables S1 to S13References (31–56)
19 July 2012; accepted 26 November 2012Published online 13 December 2012;10.1126/science.1227670
Gut Microbiomes of Malawian TwinPairs Discordant for KwashiorkorMichelle I. Smith,1* Tanya Yatsunenko,1* Mark J. Manary,2,3,4 Indi Trehan,2,3 Rajhab Mkakosya,5Jiye Cheng,1 Andrew L. Kau,1 Stephen S. Rich,6 Patrick Concannon,6 Josyf C. Mychaleckyj,6Jie Liu,7 Eric Houpt,7 Jia V. Li,8 Elaine Holmes,8 Jeremy Nicholson,8 Dan Knights,9,10†Luke K. Ursell,11 Rob Knight,9,10,11,12 Jeffrey I. Gordon1‡Kwashiorkor, an enigmatic form of severe acute malnutrition, is the consequence of inadequatenutrient intake plus additional environmental insults. To investigate the role of the gut microbiome,we studied 317 Malawian twin pairs during the first 3 years of life. During this time, half of the twin pairsremained well nourished, whereas 43% became discordant, and 7% manifested concordance for acutemalnutrition. Both children in twin pairs discordant for kwashiorkor were treated with a peanut-based,ready-to-use therapeutic food (RUTF). Time-series metagenomic studies revealed that RUTF produced atransient maturation of metabolic functions in kwashiorkor gut microbiomes that regressed whenadministration of RUTF was stopped. Previously frozen fecal communities from several discordant pairswere each transplanted into gnotobiotic mice. The combination of Malawian diet and kwashiorkormicrobiome produced marked weight loss in recipient mice, accompanied by perturbations in amino acid,carbohydrate, and intermediary metabolism that were only transiently ameliorated with RUTF. Thesefindings implicate the gut microbiome as a causal factor in kwashiorkor.
Malnutrition is the leading cause of childmortality worldwide (1). Moderate acutemalnutrition (MAM) refers to simple
wasting with a weight-for-height z (WHZ) scorebetween two and three standard deviations belowthe median defined by World Health Organiza-
tion (WHO) Child Growth Standards (2, 3). Se-vere acute malnutrition (SAM) refers to eithermarasmus, which is extreme wasting with WHZscores less than –3, or kwashiorkor, a virulentform of SAMcharacterized by generalized edema,hepatic steatosis, skin rashes and ulcerations, andanorexia (4, 5). The cause of kwashiorkor remainsobscure. Speculation regarding its pathogenesishas focused on inadequate protein intake and/orexcessive oxidative stress, but substantial evidenceto refute these hypotheses has come from epi-demiologic surveys and clinical trials (6–9). Ourcomparative metagenomic study of the gut micro-biomes of 531 healthy infants, children, and adultsliving in theUnited States, Venezuela, andMalawirevealed a maturational program in which theproportional representation of genes encodingfunctions related to micro- and macronutrient bio-synthesis and metabolism changes during postnataldevelopment (10). Together, these observationsgive rise to the following testable hypotheses: (i)The gut microbiome provides essential functionsneeded for healthy postnatal growth and devel-opment; (ii) disturbances in microbiome assem-bly and function (for instance, those prompted by
1 FEBRUARY 2013 VOL 339 SCIENCE www.sciencemag.org548
RESEARCH ARTICLES
on
Janu
ary
31, 2
013
ww
w.s
cien
cem
ag.o
rgD
ownl
oade
d fr
om

enteropathogen infection) affect the risk forkwashiorkor; and (iii) in a self-reinforcingpathogeniccascade, malnutrition affects the gut microbiomefunctions involved in determining nutritional status,thus furtherworsening health status. To complicatematters, several gut microbiome configurationsmay be associated with kwashiorkor amongdifferent hosts and even within a given host overtime. Moreover, microbiome configurations asso-ciated with kwashiorkor may be differentially af-fected by therapeutic food interventions, and featuresthat are reconfigured during treatment may notpersist after withdrawal of treatment.
To address some of these hypotheses, we per-formed a longitudinal comparative study of thefecal microbiomes of monozygotic (MZ) anddizygotic (DZ) twin pairs born in Malawi whobecame discordant for kwashiorkor. Malawi hasone of the highest infant mortality rates in theworld (1, 11). We reasoned that a healthy (well-nourished) co-twin in a discordant twin pair rep-resented a very desirable control, given his or hergenetic relatedness to the affected co-twin and thetwins’ similar exposures to diet and microbial re-servoirs in their shared early environment. Ready-to-use therapeutic food (RUTF) composed ofpeanut paste, sugar, vegetable oil, and milk for-tified with vitamins and minerals has becomethe international standard of treatment for SAMin community-based treatment programs (12). InMalawi, the standard of care for twins discordantfor kwashiorkor is to treat both co-twins withRUTF to limit food sharing; this practice allowedus to compare and contrast their microbiomes be-fore, during, and after treatment. Following eachchild in a twin pair prospectively permitted eachindividual to serve as his or her own control. More-over, if there are many different routes to disruptedmicrobiome structure and/or function, then eachdiscordant twin pair could provide an illustration ofunderlying pathology. As an additional set of con-trols, we defined temporal variation of the fecal
microbiomes in twin pairs who remained wellnourished, lived in the same geographic locationsas discordant pairs, and never received RUTF.
Regardless of their health status, a total of 317twin pairs younger than 3 years old, from five vill-ages in the southern region of Malawi, were en-rolled in our study. We followed these childrenuntil they reached 36 months of age. Zygosity test-ing (13) revealed that 46 (15%) twin pairswereMZ.We usedWHO criteria (3) to diagnose kwashiorkorbased on the presence of bilateral pitting pedaledema, marasmus when a child had aWHZ scoreless than –3, andMAMwhen theWHZ score wasbetween –2 and –3 and bilateral pitting pedal edemawas absent (2, 3). We treated SAMwith RUTF andMAM with a soy-peanut ready-to-use supplemen-tary food (14). After diagnosis with SAM, we as-sessed anthropometry and collected a fecal sampleevery 2weeks until the child recovered (defined asWHZ score greater than –2 and no edema).
Fifty percent of twin pairs remained well nour-ished throughout the study, whereas 43% becamediscordant, and 7% manifested concordance foracute malnutrition. The prevalence of discor-dant compared with concordant phenotypes wassignificantly different (P < 10−15, binomial andc2 tests). MAM was significantly more frequentthan SAM, affecting 81 (60%) of the 135 dis-cordant twin pairs (P = 0.02, c2 test) (table S1A).Of the 634 children in the study, 7.4% developedkwashiorkor, 2.5% had marasmus, and 13.9%were diagnosed with MAM; 10.7% had multipleepisodes of malnutrition, with the most frequentcombination being marasmus and MAM (5.5%of the children) (table S1B). There was no sig-nificant relationship between concordance foracute malnutrition and zygosity, nor did we findsignificant differences in the number of MZ ver-sus DZ twin pairs affected with kwashiorkor,marasmus, orMAM in our cohort (c2and Fisher’sexact tests). Taking all 135 discordant pairs intoaccount, there was no statistically significantdifference in the incidence of discordance forkwashiorkor, marasmus, or MAM in MZ versusDZ twin pairs (table S1A). In addition, we did notfind any association between gender or geograph-ic location and the type or incidence of malnutri-tion or in the discordance rate for MAM or SAMamong twin pairs (table S1, B and C). For thecurrent study, we chose to focus on children withkwashiorkor because: (i) survival of both membersof a twin pair with kwashiorkor was significantlyhigher than with marasmus; (ii) onset occurred ata later age, allowing us to better assess the state offunctional development of the gut microbiome;(iii) the duration of RUTF treatment was moreuniform than in cases of marasmus; and (iv) therewas a lower incidence of relapse to SAM (seesupplementary text for additional details).
Microbiomes of healthy twins and pairs dis-cordant for kwashiorkor. We selected nine same-gender twin pairs who remained well nourishedin our study cohort and 13 of 19 same-gender twinpairs who became discordant for kwashiorkorfor metagenomic analyses of their microbiomes
[n = 5 MZ and 4 DZ healthy pairs and 7 MZand 6 DZ pairs discordant for kwashiorkor; for12 of the 13 discordant pairs, there was a singleepisode of kwashiorkor during the study pe-riod] (see supplementary text for the criteria usedfor participant selection and table S2A for ad-ditional information about participants and theirsamples). DNA prepared from fecal samples wassubjected to multiplex shotgun pyrosequenc-ing, and the resulting reads were annotated bycomparison to the Kyoto Encyclopedia of GenesandGenomes (KEGG) database and to a databaseof 462 sequenced human gutmicrobes (table S3).To visualize the variation in this data set, weused principal coordinates analysis of Hellingerdistances computed from the KEGG enzymecommission number (EC) content of fecal micro-biomes (Fig. 1A and fig. S1). Principal coordinate1 (PC1), which explained the largest amount ofvariation, was strongly associated with age andfamilymembership (Fig. 1A). Because age encom-passes a variety of metabolic and dietary changes,we used the positions of microbiomes along PC1to assess functional development of the micro-biomes of twin pairs who remained healthy andtwin pairswho became discordant for kwashiorkor.When microbiomes from three consecutive timepoints from twins who remained healthy wereplotted along PC1, there was a steady progressiontoward a configuration found in older children(Fig. 1B). We observed a similar result in healthyco-twins from discordant twin pairs. This was notthe case for their siblings with kwashiorkor: Theirfecal microbiomes, sampled at the time of diagno-sis, as well as during and following administrationof RUTF, did not show significant differences intheir positions in the ordination plot (Fig. 1C). Weobtained the same results for KEGG orthologygroups. We used Fisher’s exact test to compare therepresentation of KEGG ECs between a healthyand amalnourished co-twinwithin each family, andwe identified ECs that were significantly differentin as few as one and as many as six of the twinpairs (table S5).
These associations between the configura-tions of gut microbial communities and health sta-tus do not establish whether the microbiome is acausal factor in the pathogenesis of kwashiorkor.We reasoned that transplanting previously frozenfecal microbial communities, obtained from dis-cordant twin pairs at the time one of the co-twinspresented with kwashiorkor, into gnotobiotic micewould allow us to assess the degree to which do-nor phenotypes could be transmitted via their gutmicrobiomes and to identify features of micro-bial community structure, metabolism, and host-microbial cometabolism associated with donorhealth status and diet. In the absence of a distinctand consistent taxonomic signature of kwashiorkor(supplementary text), we selected pretreatmentfecal samples from three discordant twins basedon the following criteria: All twin pairs were ofsimilar age, and neither co-twin in any pair haddiarrhea or vomiting or was consuming antibiot-ics at the time that fecal samples were collected.
1Center for Genome Sciences and Systems Biology,WashingtonUniversity in St. Louis, St. Louis, MO 63110, USA. 2Departmentof Pediatrics, Washington University in St. Louis, St. Louis, MO63110, USA. 3Department of Community Health and Depart-ment of Pediatrics and Child Health, University of MalawiCollege of Medicine, Blantyre, Malawi. 4U.S. Department of Ag-riculture Children’s Nutrition Research Center, Baylor College ofMedicine, Houston, TX 77030, USA. 5Department of Microbiol-ogy, College of Medicine, University of Malawi, P/B 360, Chichiri,Blantyre 3,Malawi. 6Center for Public Health Genomics, Universityof Virginia, Charlottesville, VA 22904, USA. 7Division of InfectiousDiseases and International Health, University of Virginia,Charlottesville, VA 22908, USA. 8Biomolecular Medicine, De-partment of Surgery and Cancer, Faculty of Medicine, ImperialCollege London, London SW7 2AZ, UK. 9Department of Com-puter Science, University of Colorado, Boulder, CO 80309, USA.10Biofrontiers Institute, University of Colorado, Boulder, CO80309, USA. 11Department of Chemistry and Biochemistry,University of Colorado, Boulder, CO 80309, USA. 12HowardHughes Medical Institute, University of Colorado, Boulder, CO80309, USA.
*These authors contributed equally to this work.†Present address: Department of Computer Science and En-gineering and BioTechnology Institute, University of Minnesota,Saint Paul, MN 55108, USA.‡To whom correspondence should be addressed. E-mail:[email protected]
www.sciencemag.org SCIENCE VOL 339 1 FEBRUARY 2013 549
RESEARCH ARTICLES
on
Janu
ary
31, 2
013
ww
w.s
cien
cem
ag.o
rgD
ownl
oade
d fr
om
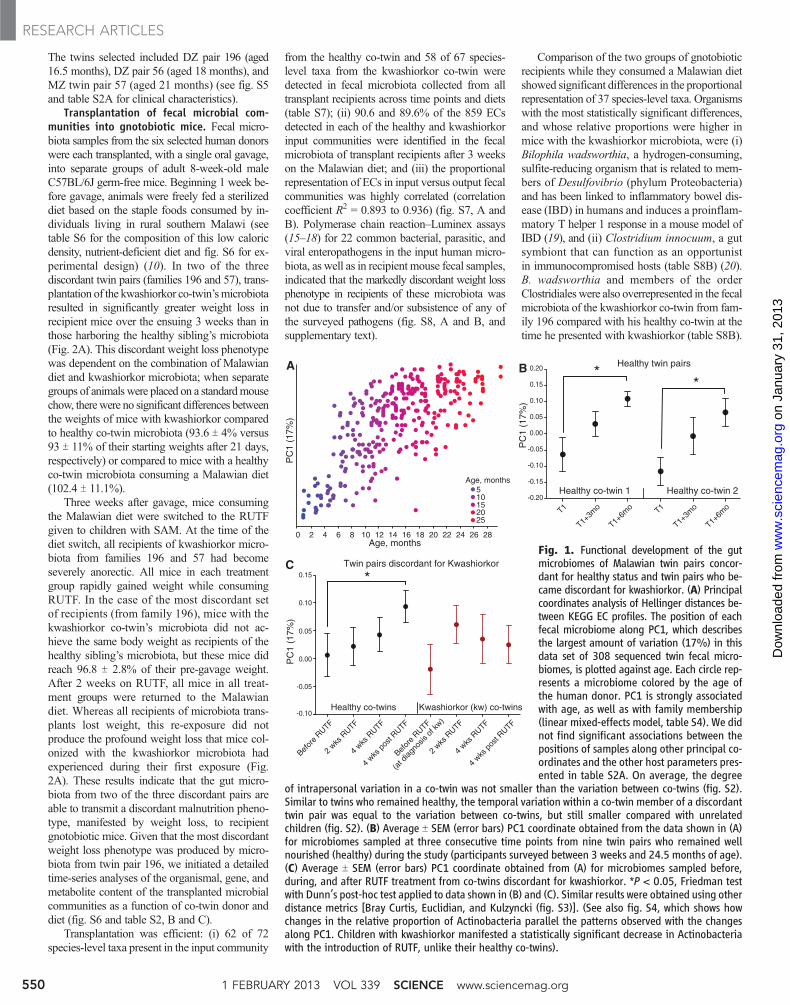
The twins selected included DZ pair 196 (aged16.5 months), DZ pair 56 (aged 18 months), andMZ twin pair 57 (aged 21 months) (see fig. S5and table S2A for clinical characteristics).
Transplantation of fecal microbial com-munities into gnotobiotic mice. Fecal micro-biota samples from the six selected human donorswere each transplanted, with a single oral gavage,into separate groups of adult 8-week-old maleC57BL/6J germ-free mice. Beginning 1 week be-fore gavage, animals were freely fed a sterilizeddiet based on the staple foods consumed by in-dividuals living in rural southern Malawi (seetable S6 for the composition of this low caloricdensity, nutrient-deficient diet and fig. S6 for ex-perimental design) (10). In two of the threediscordant twin pairs (families 196 and 57), trans-plantation of the kwashiorkor co-twin’smicrobiotaresulted in significantly greater weight loss inrecipient mice over the ensuing 3 weeks than inthose harboring the healthy sibling’s microbiota(Fig. 2A). This discordant weight loss phenotypewas dependent on the combination of Malawiandiet and kwashiorkor microbiota; when separategroups of animalswere placed on a standardmousechow, therewere no significant differences betweenthe weights of mice with kwashiorkor comparedto healthy co-twin microbiota (93.6 T 4% versus93 T 11% of their starting weights after 21 days,respectively) or compared to mice with a healthyco-twin microbiota consuming a Malawian diet(102.4 T 11.1%).
Three weeks after gavage, mice consumingthe Malawian diet were switched to the RUTFgiven to children with SAM. At the time of thediet switch, all recipients of kwashiorkor micro-biota from families 196 and 57 had becomeseverely anorectic. All mice in each treatmentgroup rapidly gained weight while consumingRUTF. In the case of the most discordant setof recipients (from family 196), mice with thekwashiorkor co-twin’s microbiota did not ac-hieve the same body weight as recipients of thehealthy sibling’s microbiota, but these mice didreach 96.8 T 2.8% of their pre-gavage weight.After 2 weeks on RUTF, all mice in all treat-ment groups were returned to the Malawiandiet. Whereas all recipients of microbiota trans-plants lost weight, this re-exposure did notproduce the profound weight loss that mice col-onized with the kwashiorkor microbiota hadexperienced during their first exposure (Fig.2A). These results indicate that the gut micro-biota from two of the three discordant pairs areable to transmit a discordant malnutrition pheno-type, manifested by weight loss, to recipientgnotobiotic mice. Given that the most discordantweight loss phenotype was produced by micro-biota from twin pair 196, we initiated a detailedtime-series analyses of the organismal, gene, andmetabolite content of the transplanted microbialcommunities as a function of co-twin donor anddiet (fig. S6 and table S2, B and C).
Transplantation was efficient: (i) 62 of 72species-level taxa present in the input community
from the healthy co-twin and 58 of 67 species-level taxa from the kwashiorkor co-twin weredetected in fecal microbiota collected from alltransplant recipients across time points and diets(table S7); (ii) 90.6 and 89.6% of the 859 ECsdetected in each of the healthy and kwashiorkorinput communities were identified in the fecalmicrobiota of transplant recipients after 3 weekson the Malawian diet; and (iii) the proportionalrepresentation of ECs in input versus output fecalcommunities was highly correlated (correlationcoefficient R2 = 0.893 to 0.936) (fig. S7, A andB). Polymerase chain reaction–Luminex assays(15–18) for 22 common bacterial, parasitic, andviral enteropathogens in the input human micro-biota, as well as in recipient mouse fecal samples,indicated that the markedly discordant weight lossphenotype in recipients of these microbiota wasnot due to transfer and/or subsistence of any ofthe surveyed pathogens (fig. S8, A and B, andsupplementary text).
Comparison of the two groups of gnotobioticrecipients while they consumed a Malawian dietshowed significant differences in the proportionalrepresentation of 37 species-level taxa. Organismswith the most statistically significant differences,and whose relative proportions were higher inmice with the kwashiorkor microbiota, were (i)Bilophila wadsworthia, a hydrogen-consuming,sulfite-reducing organism that is related to mem-bers of Desulfovibrio (phylum Proteobacteria)and has been linked to inflammatory bowel dis-ease (IBD) in humans and induces a proinflam-matory T helper 1 response in a mouse model ofIBD (19), and (ii) Clostridium innocuum, a gutsymbiont that can function as an opportunistin immunocompromised hosts (table S8B) (20).B. wadsworthia and members of the orderClostridialeswere also overrepresented in the fecalmicrobiota of the kwashiorkor co-twin from fam-ily 196 compared with his healthy co-twin at thetime he presented with kwashiorkor (table S8B).
T1
T1+3m
o
T1+6m
o T1
T1+3m
o
T1+6m
o
Healthy twin pairs
Healthy co-twin 1 Healthy co-twin 2
Healthy co-twins Kwashiorkor (kw) co-twins
**A B
C
Befor
e RUTF
2 wks
RUTF
4 wks
pos
t RUTF
4 wks
RUTF
Befor
e RUTF
(at d
iagno
sis o
f kw)
2 wks
RUTF
4 wks
pos
t RUTF
4 wks
RUTF
Twin pairs discordant for Kwashiorkor
-0.20
-0.15
-0.10
-0.05
0.00
0.05
0.10
0.15
0.20
*
2 4 6 8 10 12 14 16 18 20 22 24 26 280
510152025
Age, months
Age, months
PC
1 (1
7%)
PC
1 (1
7%)
PC
1 (1
7%)
-0.10
-0.05
0.00
0.05
0.10
0.15
Fig. 1. Functional development of the gutmicrobiomes of Malawian twin pairs concor-dant for healthy status and twin pairs who be-came discordant for kwashiorkor. (A) Principalcoordinates analysis of Hellinger distances be-tween KEGG EC profiles. The position of eachfecal microbiome along PC1, which describesthe largest amount of variation (17%) in thisdata set of 308 sequenced twin fecal micro-biomes, is plotted against age. Each circle rep-resents a microbiome colored by the age ofthe human donor. PC1 is strongly associatedwith age, as well as with family membership(linear mixed-effects model, table S4). We didnot find significant associations between thepositions of samples along other principal co-ordinates and the other host parameters pres-ented in table S2A. On average, the degree
of intrapersonal variation in a co-twin was not smaller than the variation between co-twins (fig. S2).Similar to twins who remained healthy, the temporal variation within a co-twin member of a discordanttwin pair was equal to the variation between co-twins, but still smaller compared with unrelatedchildren (fig. S2). (B) Average T SEM (error bars) PC1 coordinate obtained from the data shown in (A)for microbiomes sampled at three consecutive time points from nine twin pairs who remained wellnourished (healthy) during the study (participants surveyed between 3 weeks and 24.5 months of age).(C) Average T SEM (error bars) PC1 coordinate obtained from (A) for microbiomes sampled before,during, and after RUTF treatment from co-twins discordant for kwashiorkor. *P < 0.05, Friedman testwith Dunn’s post-hoc test applied to data shown in (B) and (C). Similar results were obtained using otherdistance metrics [Bray Curtis, Euclidian, and Kulzyncki (fig. S3)]. (See also fig. S4, which shows howchanges in the relative proportion of Actinobacteria parallel the patterns observed with the changesalong PC1. Children with kwashiorkor manifested a statistically significant decrease in Actinobacteriawith the introduction of RUTF, unlike their healthy co-twins).
1 FEBRUARY 2013 VOL 339 SCIENCE www.sciencemag.org550
RESEARCH ARTICLES
on
Janu
ary
31, 2
013
ww
w.s
cien
cem
ag.o
rgD
ownl
oade
d fr
om

Switching from a Malawian diet to RUTFproduced a rapid change in configuration of thefecal microbiota that was most pronounced inrecipients of the kwashiorkor co-twin’s com-munity (Fig. 2B and fig. S9, A and B). Thirtyspecies-level taxa exhibited statistically signifi-cant changes in their representation in kwashior-kor microbiota transplant recipients (Fig. 2C andtables S7B and S8A), with prominent increasesin Bifidobacteria (B. longum, B. bifidum, plusanother unclassified taxon), two Lactobacilli[L. reuteri and L. gasseri, which can produce bac-
teriocins and stimulate the innate immune sys-tem to inhibit the growth and eliminate variousenteropathogens (21–23)], and two members ofRuminococcus [R. torques, a mucus degrader (24),and Faecalibacterium prausnitzii, a member of theorder Clostridiales that exhibits anti-inflammatoryactivity in a mouse model of colitis and whosedecreased representation is associated with in-creased risk of ileal Crohn’s disease (25)]. Weobserved statistically significant decreases in therepresentation of members of the Bacteroidales(B. uniformis, Parabacteroides distasonis, plus
an unclassified Parabacteroides taxon) (see Fig.2C and legend for time courses). Twenty-eightbacterial species-level taxa also exhibited signif-icant changes in their representation in gnotobioticmice harboring the healthy co-twin’smicrobiota inresponse to RUTF. The pattern of change of 13different taxa—including the two Ruminococcusspp., B. uniformis, P. distasonis, B. longum, and anunclassified Bifidobacterium taxon—was sharedby both recipient groups (healthy and kwashi-orkor), although the Bifidobacterium responsewas less pronounced in the healthy microbiota
Fig. 2. Transplantation of fecal microbiota fromkwashiorkor and healthy co-twins from family 196 intognotobiotic mice fed Malawian and RUTF diets. (A)Discordant weight loss in recipient mice (n = 10 miceper group, *P < 0.05, Student’s t test). Data points arecolored by recipient group: blue, kwashiorkor co-twinfecal microbiota recipients; red, healthy co-twin fecalmicrobiota recipients. Error bars indicate SEM. (B)Average T SEM (error bars) PC1 coordinate obtainedfrom the weighted UniFrac distances shown in fig. S9,A and B, for fecal microbiota sampled from mice overtime. Same color key as in (A). (C) Heatmap of phy-lotypes assigned to species-level taxa whose repre-sentation in the fecal microbiota of gnotobiotic micechanged significantly (P < 0.05, Student’s t test withBonferroni correction) as a function of donor micro-biota and Malawian versus RUTF diets. Asterisks in-dicate taxa that changed significantly in both healthyand kwashiorkor microbiota transplant recipients. Spe-cies level taxa are colored by phylum: red, Firmicutes;blue, Actinobacteria; black, Bacteroidetes; and green,Proteobacteria. Switching from a Malawian diet toRUTF produces a rapid change in the configurationof the transplanted kwashiorkor microbiota. A bloomin Lactobacilli occurs early during treatment withRUTF but regresses by the end of this diet periodand remains unchanged when animals are returnedto the Malawian diet. Bifidobacterium spp. alsobloom early during administration of RUTF. Unlikethe Lactobacilli, the increase of Bifidobacterium issustained into the early phases of M2, after whichthey diminish. Like the members of Bifidobacterium,R. torques increases its representation during RUTFand then rapidly diminishes when mice returned toa Malawian diet. The increase in F. prausnitzii is sus-tained into and through M2. The responses of theBacteroidales were opposite to that of the otherthree groups: Bacteroidales decrease with the ad-ministration of RUTF and re-emerge with M2. The re-sponse of the Lactobacilli observed in the kwashiorkortransplant recipients is not seen in gnotobiotic micecontaining the healthy co-twin’s microbiota. Thepattern of change of the two Ruminococcus spp.,B. uniformis, P. distasonis, B. longum, and an un-classified Bifidobacterium taxon is shared by bothrecipient groups (healthy and kwashiorkor), althoughthe Bifidobacterium response is more diminutivein the healthy microbiota treatment group. Para-bacteroides merdae, an unclassified taxon from thegenus Faecalibacterium, as well as a member ofthe Coriobacteriaceae, are specifically elevated inthe healthy co-twin’s microbiota when mice switchto a RUTF diet. Of these, only P. merdae does notpersist when animals are returned to the Malawian diet (also see tables S7A and S8A).
www.sciencemag.org SCIENCE VOL 339 1 FEBRUARY 2013 551
RESEARCH ARTICLES
on
Janu
ary
31, 2
013
ww
w.s
cien
cem
ag.o
rgD
ownl
oade
d fr
om

treatment group (Fig. 2C and tables S7A, S7B,and S8A). These changes were representative ofthose that occurred in the human donors; thechange in Bifidobacterium was unique to thekwashiorkor co-twin (table S9).
Metabolic profiles associatedwith kwashiorkor.Gas chromatography–mass spectrometry analy-ses of short-chain fatty acids and 69 other productsof carbohydrate, amino acid, nucleotide, andlipid (fatty acid) metabolism in cecal and fecalsamples collected during the different diet pe-riods (n = 4 to 5 mice per family-196 micro-biota donor) showed that levels of the majorityof these metabolites increased when mice wereswitched to RUTF. In contrast, levels of severaldi- and monosaccharides (maltose, gentibiose,and tagatose) decreased (fig. S10). There were anumber of significant differences between thetwo groups of mice while they were consumingthe different diets (Fig. 3). Although switchingto RUTF produced a significant increase in fecallevels of six essential amino acids (valine, leucine,isoleucine, methionine, phenylalanine, and threo-nine) and three nonessential amino acids (alanine,tyrosine, and serine) in both groups, the responsewas initially greater in the kwashiorkor group.Four weeks after returning to a Malawian diet,levels of six of these amino acids remainedhigher in the healthy microbiota recipient groupthan before consumption of RUTF, but in thekwashiorkor group, these values fell to pre-RUTF–treatment levels (fig. S11, A and B). Weobserved the same pattern of transient responsewith urea cycle intermediates in the kwashiorkorgroup (fig. S11C). RUTF-associated increases inlevels of propionate, butyrate, lactate, and suc-cinate were generally greater in mice harboringthe healthy co-twin’s microbiota (fig. S12A). Sim-ilarly, acetate levels were elevated early on duringRUTF in the healthy but not the kwashiorkormicrobiota (fig. S12A). Increases in these endproducts of fermentation were accompanied byreductions in the levels of a number of mono-and disaccharides (fig. S12B). The observeddifferences in metabolic profiles were not at-tributable to differences in microbial communitybiomass: There were no statistically significantdifferences in fecal DNA content between recip-ients of the healthy and kwashiorkor co-twinmicrobiota when assayed at the midpoint ofRUTF treatment [986.5 T 108.3 (mean T SEM)versus 903.2 T 97.7 ng DNA/mg feces, respec-tively; P = 0.22, Student’s t test] or 4 weeksafter cessation of treatment (559.7 T 62.2 ver-sus 651.6 T 98.9 ng DNA/mg feces, respectively;P = 0.44). (For characterization of gnotobioticrecipients of family-57 transplants, includingtaxonomic and metabolic responses to the dif-ferent diets that they share with family-196 recip-ients, see supplementary text; fig. S7, C and D;and tables S7C, S7D, S8C, S8D, S9, and S10.)
Microbial-host cometabolism as a function ofdonor microbiota and host diet. We used stan-dard 1H nuclear magnetic resonance (NMR)spectroscopy to generate urine metabolite pro-
files (Table 1, fig. S15, and supplementary text)(26). A pronounced metabolic shift seen in re-sponse to RUTF was not sustained on reintro-duction of the Malawian diet; urinary metabolicprofiles at the end of the second Malawian dietperiod (M2) resembled those from the first period(M1), with renewed differentiation between healthyand kwashiorkor microbiota transplant groups.The kwashiorkor microbiota–associated meta-bolic phenotype was not as distinctive in M2 asit was during M1. When we reanalyzed the dataafter excluding the RUTF samples, the metabolicdifferentiation was more apparent between thetwo Malawian dietary periods (fig. S15, A to C).
Among the notable results, we found thatlevels of urinary taurine were affected by bothdonor microbiota and diet. Mice colonized withmicrobiota from a healthy donor excreted moretaurine while consuming both the Malawian dietand RUTF compared with mice with a kwashi-orkor microbiota; in both recipient groups, urinarytaurine levels were higher when mice consumed a
Malawian diet (Table 1). B. wadsworthia growswell on bile acids and uses taurine from taurine-conjugated bile acids as a terminal electronacceptor, converting it to ammonia, acetate, andsulfide (27). In agreement with this property, fe-cal levels of B. wadsworthia showed an inverserelationship with urinary taurine levels. Levelswere higher in the kwashiorkor group; evenwhen the mice were consuming RUTF, recipi-ents of the kwashiorkor microbiota exhibitedsignificantly lower urinary taurine levels andsignificantly higher fecal levels of B. wadswor-thia (Table 1 and table S8, A and B). In additionto urinary taurine levels, fecal methionine andcysteine concentrations were significantly lowerin mice harboring kwashiorkor compared withthose carrying healthy co-twin microbiota whenconsuming a Malawian diet (Fig. 3). Dietary me-thionine and cysteine meet most of the humanbody’s needs for sulfur; these amino acids aremore abundant in animal and cereal proteinsthan in vegetable proteins. The Malawian diet is
-2.00 -1.33 -0.67 0.00 0.67 1.33 2.00
Cys
teine
Glyc
ine
Tyr
osine
Alan
ine
Vali
ne
Leu
cine
Phe
nylal
anine
Met
hionin
e
Isole
ucine
Hom
oser
ine
Cad
aver
ine
D-(-
)-Lyx
ose
Cell
obios
e
Gluc
ose
Fuc
ose
Lau
ric a
cid
Olei
c acid
Dihy
drou
racil
Ade
nine
Am
inom
alonic
acid
Oxa
lic a
cid
Thr
eonic
acid
Put
recin
e
Asp
artic
acid
Mala
te
Ste
aric
acid
Cho
leste
rol
Kw
ash
Hea
lthy
B
RU
TF,
Day
10
[RU
TF.
D10
]
Tyr
osine
Glyc
ine
Asp
arag
ine
Cys
teine
Phe
nylal
anine
Vali
ne
Met
hionin
e
Isole
ucine
Man
nose
Gen
tiobio
se
Fuc
ose
Malt
ose
D-(-
)-Lyx
ose
Ribi
tol
Thr
eonic
acid
Olei
c acid
Dihy
drou
racil
Myo
-Inos
itol
Orn
ithine
Put
recin
e
Gluc
uron
ic ac
id
Hist
idine
Glut
amat
e
Glut
amine
Ribo
se
Hyp
oxan
thine
Vale
ric a
cid C
Kw
ash
Hea
lthy
Mal
awi D
iet 2
, Day
26
[M2.
D26
]
A
Kw
ash
Hea
lthy
Mal
awi D
iet 1
, Day
16
[M1.
D16
]
Cys
teine
Thr
eonic
acid
Pyr
uvat
e
Ribi
tol
Chir
o-In
osito
l
Put
recin
e
Asp
artic
acid
Glut
amine
Glut
amat
e
Ribo
se
Cell
obios
e
D-(-
)-Lyx
ose
Hyp
oxan
thine
Ura
cil
Mala
te
Nico
tinic
acid
Vale
ric a
cid
Amino acids
Carbohydrates
Fatty acids
Nucleotides
TCA cycle
Urea cycle
Fig. 3. Metabolites with significant differences in their fecal levels in gnotobiotic mice colonized withmicrobiota from discordant twin pair 196 as a function of diet. Data are from fecal samples collected3 days before the end of (A) the first period of consumption of the Malawian diet (M1, day 16; abbreviatedM1.D16), (B) RUTF treatment (RUTF.D10), and (C) the second period of Malawian diet consumption (M2.D26). Significant differences are defined as P < 0.05, according to Student’s t test. Procrustes analysis ofdata obtained from the transplantedmicrobiota from discordant co-twins in family 196 (fig. S13) revealeda significant correlation between metabolic and taxonomical profiles on each diet with an overallgoodness of fit (M2 value) of 0.380 (P < 0.0001; 1000 Monte Carlo label permutations) for all diets andmicrobiota.
1 FEBRUARY 2013 VOL 339 SCIENCE www.sciencemag.org552
RESEARCH ARTICLES
on
Janu
ary
31, 2
013
ww
w.s
cien
cem
ag.o
rgD
ownl
oade
d fr
om

deficient in total protein and in animal protein.Studies have found a decrease of serum methio-nine levels and urinary sulfate excretion in patientswith kwashiorkor (28–33). Moreover, cysteine ormethionine deficiency in experimental animalscan produce weight loss (correctable by sulfatesupplementation) (34–36). Our findings suggestthat the combination of a kwashiorkor microbiotaand a Malawian diet may contribute to abnormalsulfur metabolism, thereby affecting the patho-genesis and manifestations of this form of SAM.
Formice containing the healthy co-twin’smicro-biota, urinary excretion of tricarboxylic acid (TCA)cycle intermediates 2-oxoglutarate, citrate, succi-nate, and fumarate were closely coupled together.These mitochondrial metabolites typically followsimilar reabsorption control mechanisms in therenal tubule that are closely linked to tubular pH.In mice containing kwashiorkor microbiota, uri-nary fumarate excretion was effectively decoupledfrom the other TCA intermediates (fig. S15, D toG). Differential excretion rates of TCA intermedi-ates can occur where there is selective enzymaticinhibition of the TCA cycle (37). The TCA cyclealso appears to be disrupted in the kwashiorkormicrobiota itself (threefold increase in cecal levelsof succinate; P < 0.05, unpaired Student’s t test),and an increased succinate-to-fumarate ratio (0.58versus 0.23, P < 0.05, unpaired Student’s t testwhile on the Malawian diet) suggests inhibitionof succinate dehydrogenase, the enzyme respon-sible for converting succinate to fumarate. Takentogether, these observations suggest that thekwashiorkor microbiota examined in these gno-tobiotic mice may generate chemical productsthat result in a selective inhibition of one or moreTCA cycle enzymes, making energy metabolisma bigger challenge for these childrenwhen they areexposed to a micro- and macronutrient-deficient,low-calorie diet.
Prospectus. The discordance rate for kwa-shiorkor is high for both MZ and DZ twins inour study population. Our results illustrate thevalue of using twins discordant for nutritionalphenotypes to characterize the interrelationshipbetween the functional development of the gutmicrobiome in children and their nutritional sta-tus. Linking metagenomic analyses with dietaryexperiments in gnotobiotic mice that have receivedgut microbiota transplants from twins discordantfor kwashiorkor allowed us to gain insights intopathogenesis by identifying transmissible featuresassociated with healthy versus diseased donors.By replicating a human donor’s gut communityin multiple recipient mice, we have been able tomimic a clinical intervention and identify com-munity characteristics, including differences intaxonomic composition and in taxonomic andmetabolic responses to RUTF. The resulting dataprovide biomarkers of community metabolismand of microbial-host cometabolism that delin-eate and discriminate diet and microbiota effects,including biomarkers indicative of the more la-bile, short-lived nature of the responses of mi-crobiota from kwashiorkor donors to RUTF. The
Table 1. Metabolite analysis of urine samples obtained from mice with transplanted healthy or kwashiorkorco-twin microbiota from family 196 at each diet phase. R2X represents the variation in 1H NMR spectral dataexplained by the O-PLS-DAmodel, where a value of 1 would indicate that 100%of the variation in the spectraldata set is explained by the model. Q2Y represents the predictive ability of the model and is calculated byleaving a percentage of the data out (15%) while calculating the ability of the model to discriminate betweenclasses in any pairwise comparison (e.g., kwashiorkor versus healthy). Additionally, Q2Y indicates the level ofrobustness or significance of the metabolic differences between two classes. The numbers in each column areobtained frommedian fold normalized O-PLS-DAmodels and represent the correlation between the NMR data(relative concentration of urinary metabolite) and a given class (e.g., healthy versus kwashiorkor co-twin mi-crobiota orMalawi diet 1 versus RUTF diet). The greater theQ2Y or predictive value for theO-PLS-DA comparisonof two classes, the stronger or more reliable the composite metabolic differences are between two classes (e.g.,dietary periods). The closer to 1.0 the correlation value is for any given metabolite, the more weight thatmetabolite has in discriminating between those two classes. Metabolites are colored according to their over-representation in a treatment group. (A) Urinarymetabolites with differences in their levels inmice transplantedwith the healthy co-twin versus the kwashiorkor co-twin microbiota within a given diet. Color code: blue, higherin kwashiorkor co-twin microbiota recipients; red, higher in healthy co-twin microbiota recipients; white, nosignificant difference between kwashiorkor and healthy. (B) Urinary metabolites with differences in their repre-sentation of mice transplanted with healthy or kwashiorkor co-twin microbiota between diets. Color code: red,higher during theM1diet phase relative to RUTF or relative toM2; orange, higher on RUTF relative toM1 orM2;blue, higher on M2 compared to RUTF or M1; white, no significant differences in the indicated diet comparison.
M1 vsRUTF
RUTFvs M2
M1 vsM2
M1 vsRUTF
RUTFvs M2
M1 vsM2
0.66 0.58 0.61 0.74 0.52 0.67
0.57 0.94 0.31 0.87 0.93 0.68
0.7448 0.8538 0.9062 0.8761
0.7065 0.7921 0.827 0.7137
0.6794 0.6841 0.8348 0.846
0.7439 0.7553
0.7
0.8382 0.6198
0.632 0.7469 0.5998
0.5558 0.4733
0.7432 0.9474 0.759 0.8781
0.8297 0.7051 0.6838
0.7562
0.7469
0.7149 0.6639 0.8534 0.878
0.7990.8447 0.5716 0.6616
0.8021 0.8699 0.9593
0.8602
0.8203 0.9133 0.93 0.769
0.7554
Recipients of healthyco-twin donor microbiota
Recipients of kwashiorkorco-twin donor microbiota
Higher metaboliteconcentrationduring Malawian dietphase 1
Higher metaboliteconcentrationduring RUTF
Higher metaboliteconcentrationduring Malawian dietphase 2
M1 RUTF M2
R2X 0.38 0.49 0.36
Q2Y 0.62 0.8 0.78
2-oxoadipate 0.8747 0.9069 0.6603taurine 0.8578 0.6236
lactate 0.4618creatine 0.9303
creatinine 0.7692methylamine 0.6755 0.8338 0.7646
dimethylamine 0.7732
trimethylamine 0.8469
trimethylamine N-oxidephenylacetylglycine 0.8522 0.8816
indoxyl sulfate 0.6591 0.8138hippurate 0.6301 0.9485 0.9786
allantoin 0.7662
Higher metaboliteconcentrationin recipientsof kwashiorkorco-twin microbiota
Higher metaboliteconcentrationin recipientsof healthy co-twindonor microbiota
R2X
Q2Y
2-oxoglutarate
citrate
succinate
fumarate
acetate
2-oxoadipate
taurine
lactate
creatine
creatinine
methylamine
dimethylamine
trimethylamine
trimethylamine N-oxide
phenylacetylglycine
indoxyl sulfate
hippurate
allantoin
1-methylnicotinamide
A
B
www.sciencemag.org SCIENCE VOL 339 1 FEBRUARY 2013 553
RESEARCH ARTICLES
on
Janu
ary
31, 2
013
ww
w.s
cien
cem
ag.o
rgD
ownl
oade
d fr
om

interrelationships between diet, microbiota, andmany facets of host physiology can be explored indetail in these “personalized” gnotobiotic mousemodels. These models may be useful for devel-oping new and more effective approaches fortreatment and/or prevention. In addition, studiesof other forms of malnutrition that take an ap-proach analogous to that described here couldalso provide insights about the contribution ofthe gut microbiome to this global health problem.
References and Notes1. United Nations (UN) Inter-Agency Group for Child
Mortality Estimation, Levels & Trends in Child MortalityReport (2011); www.childinfo.org/files/Child_Mortality_Report_2011.pdf.
2. WHO Multicentre Growth Reference Study Group, ActaPaediatr. Suppl. 450, 76 (2006).
3. WHO, UN Children’s Fund, WHO Child Growth Standardsand the Identification of Severe Acute Malnutrition in Infantsand Children (2009); www.who.int/nutrition/publications/severemalnutrition/9789241598163/en/index.html.
4. C. D. Williams, B. M. Oxon, H. Lond, Lancet 226, 1151 (1935).5. T. Ahmed, S. Rahman, A. Cravioto, Indian J. Med. Res.
130, 651 (2009).6. C. Gopalan, in Calorie Deficiencies and Protein
Deficiencies: Kwashiorkor and Marasmus: Evolution andDistinguishing Features, R. A. McCance, E. M. Widdowson,Eds. (Churchill, London, 1968), pp. 48–58.
7. M. H. Golden, Lancet 319, 1261 (1982).8. H. Ciliberto et al., BMJ 330, 1109 (2005).9. C. A. Lin et al., J. Pediatr. Gastroenterol. Nutr. 44, 487 (2007).
10. T. Yatsunenko et al., Nature 486, 222 (2012).11. R. E. Black et al., Lancet 371, 243 (2008).12. WHO, World Food Programme, UN System Standing
Committee on Nutrition, UN Children’s Fund,Community-Based Management of Severe AcuteMalnutrition (2007); www.who.int/nutrition/topics/statement_commbased_malnutrition/en/index.html.
13. Materials and methods are available as supplementarymaterials on Science Online.
14. L. Lagrone, S. Cole, A. Schondelmeyer, K. Maleta,M. J. Manary, Ann. Trop. Paediatr. 30, 103 (2010).
15. J. Liu et al., J. Clin. Microbiol. 50, 98 (2012).16. M. Taniuchi et al.,Diagn. Microbiol. Infect. Dis.71, 386 (2011).17. M. Taniuchi et al., Am. J. Trop. Med. Hyg. 84, 332 (2011).18. M. Taniuchi et al.,Diagn. Microbiol. Infect. Dis.73, 121 (2012).19. S. Devkota et al., Nature 487, 104 (2012).20. N. Crum-Cianflone, Am. J. Med. Sci. 337, 480 (2009).21. T. Itoh, Y. Fujimoto, Y. Kawai, T. Toba, T. Saito, Lett. Appl.
Microbiol. 21, 137 (1995).22. M. F. Fernández, S. Boris, C. Barbés, J. Appl. Microbiol.
94, 449 (2003).23. Y. Kato-Mori et al., J. Med. Food 13, 1460 (2010).24. A. A. Salyers, S. E. West, J. R. Vercellotti, T. D. Wilkins,
Appl. Environ. Microbiol. 34, 529 (1977).25. H. Sokol et al., Proc. Natl. Acad. Sci. U.S.A. 105, 16731
(2008).26. O. Beckonert et al., Nat. Protoc. 2, 2692 (2007).27. H. Laue, K. Denger, A. M. Cook, Appl. Environ. Microbiol.
63, 2016 (1997).28. J. C. Edozien, E. J. Phillips, W. R. F. Collis, Lancet 275,
615 (1960).29. R. G. Whitehead, R. F. Dean, Am. J. Clin. Nutr. 14, 313
(1964).30. S. Awwaad, E. A. Eisa, M. El-Essawy, J. Trop. Med. Hyg.
65, 179 (1962).31. G. Arroyave, D. Wilson, C. DeFunes, M. Béhar, Am. J. Clin.
Nutr. 11, 517 (1962).32. T. R. Ittyerah, S. M. Pereira, M. E. Dumm, Am. J. Clin.
Nutr. 17, 11 (1965).33. T. R. Ittyerah, Clin. Chim. Acta 25, 365 (1969).34. D. H. Baker, Prog. Food Nutr. Sci. 10, 133 (1986).35. N. Orentreich, J. R. Matias, A. DeFelice, J. A. Zimmerman,
J. Nutr. 123, 269 (1993).36. M. Mori, S. Manabe, K. Uenishi, S. Sakamoto, Tokushima
J. Exp. Med. 40, 35 (1993).37. J. K. Nicholson, J. A. Timbrell, P. J. Sadler, Mol. Pharmacol.
27, 644 (1985).
Acknowledgments: We thank S. Wagoner, J. Manchester,and M. Meier for superb technical assistance; J. Manchester,S. Deng, and J. Hoisington-López for assistance with DNAsequencing; M. Karlsson, D. O’Donnell, and S. Wagoner forhelp with gnotobiotic mouse husbandry; W. Van Treuren forwriting several scripts, B. Mickelson (Teklad Diets) andH. Sandige for assistance with the design of the mouse diets;and members of the Gordon lab for valuable suggestionsduring the course of this work. This work was supported by
grants from the Bill & Melinda Gates Foundation, andthe NIH (DK30292, DK078669, T32-HD049338).M.I.S was the recipient of a postdoctoral fellowship from theSt. Louis Children’s Discovery Institute (MD112009-201).J.V.L was the recipient of an Imperial College Junior ResearchFellowship. Illumina V4-16S rRNA and 454 shotgunpyrosequencing data sets have been deposited with theEuropean Bioinformatics Institute. Specifically, human: V4-16SrRNA data sets (ERP001928) and shotgun sequencing datasets (ERP001911). Mouse: gnotobiotic recipients of discordanttwin pair 196: V4-16S rRNA data sets (ERP001861);gnotobiotic recipients of discordant twin pair 196: shotgunsequencing data sets (ERP001819); gnotobiotic recipients ofdiscordant twin pair 57: V4-16S rRNA data sets (ERP001871);gnotobiotic recipients of discordant twin pair 57: shotgunsequencing data sets (ERP001909). Twin pairs were recruitedthrough health centers located in Makhwira, Mitondo,M’biza, Chamba, and Mayaka. Recruitment of participants forthe present study, clinical protocols, sample collectionprocedures, and informed consent documents were allreviewed and approved by the College of Medicine ResearchEthics Committee of the University of Malawi and by theHuman Research Protection Office of Washington University inSt. Louis. All experiments involving mice were performed usingprotocols approved by the Washington University AnimalStudies Committee. Author contributions: M.I.S., T.Y., andJ.I.G designed the experiments; M.J.M. designed and implementedthe clinical monitoring and sampling for the trial; R.M. and I.T.participated in patient recruitment, sample collection, samplepreservation, and clinical evaluations; M.I.S. performedexperiments involving gnotobiotic mice, whereas T.Y. characterizedmicrobiota obtained from twins; M.I.S., T.Y., J.C., A.L.K., S.S.R.,P.C., J.C.M., J.L., E. Houpt, J.V.L., E. Holmes, and J.N. generateddata; M.I.S., T.Y., E. Holmes, J.N., D.K, L.K.U, R.K., and J.I.G.analyzed the results; and M.I.S., T.Y., and J.I.G. wrote the paper.
Supplementary Materialswww.sciencemag.org/cgi/content/full/339/6119/548/DC1Materials and MethodsSupplementary TextFigs. S1 to S15Tables S1 to S10References (38–54)
17 August 2012; accepted 10 December 201210.1126/science.1229000
REPORTSA Clock Directly Linking Timeto a Particle’s MassShau-Yu Lan,1 Pei-Chen Kuan,1 Brian Estey,1 Damon English,1 Justin M. Brown,1Michael A. Hohensee,1 Holger Müller1,2*
Historically, time measurements have been based on oscillation frequencies in systems of particles,from the motion of celestial bodies to atomic transitions. Relativity and quantum mechanics show thateven a single particle of mass m determines a Compton frequency w0 = mc2/ħ, where c is the speed oflight and ħ is Planck’s constant h divided by 2p. A clock referenced to w0 would enable high-precisionmass measurements and a fundamental definition of the second. We demonstrate such a clock usingan optical frequency comb to self-reference a Ramsey-Bordé atom interferometer and synchronize anoscillator at a subharmonic of w0. This directly demonstrates the connection between time and mass.It allows measurement of microscopic masses with 4 × 10⁻⁹ accuracy in the proposed revision toSI units. Together with the Avogadro project, it yields calibrated kilograms.
Aparticle with mass-energy E = mc2 isrepresented by a wave oscillating at theCompton frequency w0 = mc2/ħ in the
particle’s rest frame, where c is the speed of light
and ħ is Planck’s constant h divided by 2p (1).This is the basis of de Broglie’s theory of matterwaves (2) and underpins modern quantum me-chanics and field theory: The time evolution of
states is given by wave equations whose plane-wave solutions are proportional to
e–if = exp(–ipmxm/ħ) = exp(–iw0t)
where pm = (–mg, mgv) and xm are the momen-tum and position four-vector, t = t/g is the propertime, g is the Lorentz factor, and v and t are thelaboratory-frame velocity and time. Much hasbeen theorized about the physical reality of quan-tum states as “oscillators” (3–7), but surprisinglyfew experiments have been proposed to addressthis topic (8). Here, we directly address a conse-quence of Eq. 1 that has deep physical and per-haps even cosmological implications: Becausethe oscillations of a wave packet accumulatephase w0t just like a clock following the same
1Department of Physics, 366 Le Conte Hall MS7300, Universityof California, Berkeley, CA 94720, USA. 2Lawrence BerkeleyNational Laboratory, One Cyclotron Road, Berkeley, CA 94720,USA.
*To whom correspondence should be addressed. E-mail:[email protected]
(1)
1 FEBRUARY 2013 VOL 339 SCIENCE www.sciencemag.org554
on
Janu
ary
31, 2
013
ww
w.s
cien
cem
ag.o
rgD
ownl
oade
d fr
om

trajectory, it has been suggested that the passageof time is observable as soon as the universecontains massive particles (1). It ought to be pos-sible to build a Compton clock: a clock refer-enced to the mass of a single particle.
Advances in timekeeping (9–12) have fol-lowed the use of references with higher frequency,increased quality factor Q, and lowered instabilityfrom systematic influences. The Compton fre-quency of a stable particle is high (w0/2p = 3 ×1025 Hz for a cesium atom), has virtually infinitequality factor Q = w0/G, where 1/G is the par-ticle’s 1/e lifetime, and is one of the most stablequantities in nature. In principle, a Compton-frequency clock could be built by annihilatinga particle-antiparticle pair and counting the fre-quencies of the generated photons. However,this frequency is far beyond modern countingtechniques; to access it, we require a method ofdividing it into a technically accessible range.
Here, we present a Compton clock by com-bining an atom interferometer with an opticalfrequency comb. In a Ramsey-Bordé atom inter-ferometer (Fig. 1) (7, 13), a quantum wave pack-et initially at rest interacts with a pulse of twocounterpropagating laser beams having laboratory-frame frequencies of wT and wavenumbers ofkT, respectively. The wave packet absorbs n pho-tons from the first beam while being stimulatedto emit n photons into the second beam, withoutmodifying its internal state through multiphotonBragg diffraction (14, 15). By appropriate choiceof the laser intensity and pulse duration, the pro-cess occurs with a probability of 50%, splittingthe wave packet. While the first partial wave pack-et remains at rest, the second moves away witha laboratory-frame momentum p = nħ(k+ + k–).It is convenient to introduce a rapidity parameterr so that p =mcsinh(r) and the Lorentz factor g =[1 – v2/c2]–1/2 = cosh(r). Energy-momentum con-servation (the Bragg condition) provides the relation
wT = wLeTr/2
where wL = w0sinh(r/2)/n. [In the nonrelativisticlimit, wL ≈ (w+ + w–)/2 ≡ kc and wT ≈ wL(1 T nħk/mc).] Interaction with four laser pulses (Fig. 1)brings the wave packets together for interference.
The probability of detecting the particle at theoutputs (Fig. 1) is given by cos2(Dϕ/2), whereDϕis the relative phase of the wave packets. In arelativistic, semiclassical treatment, Eq. 1 showsthat the wave packets acquire a relative phaseof Dϕfree = w0[t
(1) – t(2)] = 2w0T(g−1 – 1) (non-
relativistically, Dϕfree ≈ –4n2ħk2T/m) during theirfree evolution between the laser pulses (3), wheret(1,2) are the proper times on paths 1 and 2. Theirdifference t(1) – t(2) is related to the laboratory-frame time by a factor g−1 – 1, which is determinedby the laser frequencies by Eq. 2 and can be usedto divide the Compton frequency into a techni-cally accessible range. Synchronizing an oscillatorto the divided Compton frequency is accom-plished as follows: In the experiment, this oscil-lator sets the frequency difference wm ≡ w+ – w–
between the counterpropagating laser beams.Whenever the particle absorbs a photon, the phaseof the photon is added to the wave packet’s phaseand subtracted for stimulated emission. It can beshown (16) that the sum Dϕlaser of these phases(eq. S2) cancels the free evolution phase Dϕfree
exactly if, and only if, wT satisfy Eq. 2, so that
wm ¼ 2nw2L
w0ð3Þ
The phase cancellation Dϕ = Dϕlaser + Dϕfree = 0is verified by observing the interference fringes ofthe particle at the interferometer output and main-tained by feedback to the oscillator.
Ramsey-Bordé interferometers are routinelyused to measure ħ/m (17), but such measurementsof ħ/m are not themselves clocks because theyare reliant upon an external frequency referenceto measure wL.We use an optical frequency comb
to setwL=Nwm, eliminating the laser frequency asa free parameter. Combinedwith Eq. 3, we obtain
wm ¼ w0
ð2nN 2Þ ð4Þ
which is an exact result in this relativistic andsemiclassical picture, showing that wm is deter-mined solely by the Compton frequency. Correc-tions from nonclassical paths are negligible here.We are free to choose any value for n and N andlock the oscillator directly to the Compton fre-quency or a subharmonic without changing theunderlying physics. For example, n = 2 and N=1/2 yieldsw0 =wm = 2wL andwT =wL(1 +
ffiffiffi
2p
)T1.In practice, N is chosen so that wL and wm areaccessible to existing technologies. The experi-ment is a Compton clock by virtue of the fact thatit self-references the laser frequency through theoptical frequency comb, which ensures that theoutput frequency wm is fully determined bythe Compton frequency and known ratios. It isindependent of any external standards. The self-referenced atom interferometer serves as a clock-work that links the frequency of our masteroscillator to the Compton frequency of the mat-ter wave packets.
Our experiment uses cesium-133 atoms be-cause they are amenable to the techniques ofatom optics and are electrically neutral, whichreduces systematic effects. Because their inter-nal structure is not relevant to wm, the atoms ap-proximate noninteracting point masses. Our atominterferometer has been described in detail else-where (15). The clock’s operation is illustrated inFig. 2. Avoltage-controlled 10-MHz crystal oscilla-tor O1 [FTS 1050A (Symmetricom,Beverly,MA)]with frequencywcryst is themaster oscillator for all
Fig. 1. Paths of the matter waves in a Ramsey-Bordé interferometer versus time; red arrows de-note laser beams. Additional paths that do notinterfere are not shown. The diagram is drawn in afreely falling inertial frame, and does not show thefree fall of the atoms.
Fig. 2. Schematic. Oscillator O1 is the frequency reference for all signal generators and the opticalfrequency comb. The laser used to address the atom interferometer is phase-locked to the comb. Shownin the diagram is the freely falling atomic trajectories versus time for the simultaneous conjugateinterferometers (the lower of which being shown in Fig. 1) used to cancel the gravity-induced phase.The phase measurement from the atom interferometer provides an error signal to O1 in order to closethe feedback loop.
(2)
www.sciencemag.org SCIENCE VOL 339 1 FEBRUARY 2013 555
REPORTS
on
Janu
ary
31, 2
013
ww
w.s
cien
cem
ag.o
rgD
ownl
oade
d fr
om

frequency sources, pulse generators, and lasers in-volved in the experiment. The frequency comb sta-bilizes the laser frequency toNcwcryst, whereNc =35,173,594.165 (16). A direct digital synthesizer(DDS) generates wm/2 = NDDSwcryst at ~82 kHz,and acousto-optical modulators (AOMs) gener-ate wT by applying the relation wT = wL T wm/2(valid in the nonrelativistic limit), where NDDS =2,326,621,801,616/248. The factor N is thus N =Nc/NDDS = 4,255,305,521.31286. Another AOMshapes the time domain profile of the laser pulses.Our signal to noise is optimal for 5th-order Braggdiffraction (n = 5) with a pulse separation time(Fig. 1) T = 160 ms. The atomic population at theinterferometer output is determined by means offluorescence detection and then processed to yieldthe interferometer phase Dϕ = Dϕlaser + Dϕfree.
A feedback loop adjusts wcryst so as to main-tainDϕ =0. Its operation is demonstrated in Fig. 3:The first 10 data points are taken during normaloperation. At the 11th data point, we briefly dis-able the feedback, so that wcryst is free-running,and the experiment performs a Ramsey-Bordéphoton recoil measurement. The measured signalis then proportional to wL
2 = (Ncwcryst)2 (Eq. 3).
Increasing Nc by 100 parts per billion (ppb) in-creases wL and produces a 200-ppb increase inDϕfree (Fig. 3, shaded area). At the 13th data point,the feedback is restored. Because the feedbackstabilizes wcryst to a value inversely proportionalto Nc
2 (Eq. 4), the signal frequency decreases by400 ppb, equilibrating 200 ppb lower than thefirst 10 data points (Fig. 3), which is opposite tothe observed shift for a recoil measurement.
Quantitative agreement is demonstrated bycomparing the rest-mass stabilized frequencywcryst with a rubidium frequency standard [SRSFS725 (Stanford Research Systems, Sunnyvale,CA)] over 6 hours (Fig. 4A). It averages to9,999,998.127 Hz with a SD of the mean of0.015 Hz. A c2 test (Fig. 4B) yields a normalizedc2 = 1.4. Our statistical uncertainty is 0.015 Hz ×(c2)1/2 = 0.018 Hz, or 1.8 ppb. Using Eq. 4 andcorrecting for systematic effects (16), we obtainthe Compton frequency w0/2p = (2,993,486,252 T12) × 1016 Hz. The deviation from the expectedvalues (16, 18) is –5.2 T 4.0 ppb and is consist-ent with zero within 2s. The Allan variance(Fig. 4C) is below 10−8/[t/(1000 s)]1/2, where tis the integration time.
Although this accuracy is modest, similar tothe first cesium atomic clocks (9), the resolutionand accuracy of atom interferometry is advancingrapidly (19). Up to 100-fold improvement in res-olution could be obtained by approaching theshot noise limit of our interferometer. Use ofhigher laser frequencies (which is possible with-out changing the reference particle), lighter parti-cles, and/or longer interrogation times can possiblylead to a Compton clock that can serve as a pri-mary time standard. The intrinsic stability and Qfactor of a stable particle’s Compton frequencyis unmatched by any other frequency reference.Mass, frequency, time, and length could all bederived from one fundamental unit, defined bya specific particle.
The clock can also be used for the oppo-site purpose, measuring mass by measuring theCompton frequency. In 2011, the General Con-ference onWeights and Measures (CGPM-2011)considered a revision to the SI units that wouldassign an exact value to the Planck constant h(20). The kilogram would then be referenced tothe second through the defined values of thePlanck constant and the speed of light. Micro-scopic masses could be related to the fine struc-ture constant (21, 22) or h/M (17); macroscopicmasses could be measured by using the Wattbalance (23, 24). These methods, however, re-quire auxiliary measurements and/or intricatetheory (16). The Compton clock would providean absolute measurement of the cesium atom’smass to an accuracy of 4.0 ppb, which is com-petitive with other methods and greater than 10times more accurate than in the present SI (18).Other microscopic masses can be related to thecesium mass by means of mass spectroscopy.
The link to macroscopic masses can be madeby Avogadro spheres: silicon crystals of accu-rately measured volume V and lattice constant a(25). In theory, the number of atoms containedin such a crystal is Nat = 8V/a3, where 8 is thenumber of atoms in the unit cell. Because bindingenergies are negligible, the Compton frequencyof the sphere is wM = [m(Si)/m(133Cs)]Nat wCs,given by the measured Compton frequency of
Fig. 3. Measured frequency wm (lower trace; left axis) as well as wm(2nN2) (upper trace; right axis)
shows the action of the feedback loop. During the shaded interval, the feedback is disabled.
Fig. 4. Compton clock performance. (A) Frequency minus 10 MHz versus time plotted over ~6 hours. (B) Histogram of data (bin size = 0.025 Hz). (C) RootAllan variance (RAV) of the data in (A). It is <10−8/(t/1000 s)1/2 between integration times t of ~100 s and ~ 1 hour. The slope between t = 10 and 100 s isan artifact of the 80-s update cycle of the experiment.
1 FEBRUARY 2013 VOL 339 SCIENCE www.sciencemag.org556
REPORTS
on
Janu
ary
31, 2
013
ww
w.s
cien
cem
ag.o
rgD
ownl
oade
d fr
om

cesium atoms wCs. This yields its mass as M =wMħ/c2. The ratio m(Si)/m(133Cs) is betweenthe effective molar mass of the sphere’s mate-rial and cesium-133. According to (25), presentdata yields the spheres’ mass with an overall ac-curacy of 30 ppb so that theywould constitute themost accurately calibrated macroscopic massesunder the proposed CGPM-2011 redefinition—atestament to the precision achieved in construct-ing Avogadro spheres.
Although any method for measuring micro-scopic mass can be used, the Compton clockoffers a transparent connection between the sec-ond and a microscopic mass on the basis of sim-ple physical principles without requiring auxiliarymeasurements. It directly realizes a long-standingproposal tomeasuremass in terms of theComptonfrequency (6). The method outlined here offers adifferent set of systematic effects as comparedwith Watt balances (23, 24), thus serving as animportant test of the overall consistency of thelaws of physics and experimental methods. It isbased on a body’s inertial rather than gravitationalmass. In the context of the present SI, the com-bination of the Avogadro project and the Comptonclock serves as a measurement of the Planckconstant.
Looking forward, the rapidly developing fieldof optomechanics (26) might enable measure-ments of the single-photon recoil energy of ananomechanical mirror. This could result in aclock referenced to the mass of a mesoscopicobject, or a mesoscopic mass standard. BecauseBragg diffraction of electrons has already beendemonstrated (27), a clock using elementary par-
ticles or even antiparticles is possible. Such clockswould be useful for testing CPT symmetry or theEinstein Equivalence Principle for antimatter.
We have demonstrated a clock stabilized tothe rest mass of a particle. It highlights the inti-mate connection between frequency and mass. Itproves that massive particles can serve as a fre-quency reference without requiring their mass tobe converted to energy as an explicit illustrationof a key principle of quantum mechanics. Fur-thermore, we have shown that a single massiveparticle is sufficient to measure time.
References and Notes1. R. Penrose, Cycles of Time: An Extraordinary View of The
Universe (Knopf, New York, 2011), sec. 2.3.2. L. De Broglie, thesis, University of Paris, Paris, France (1924).3. H. Müller, A. Peters, S. Chu, Nature 463, 926 (2010).4. M. A. Hohensee, S. Chu, A. Peters, H. Müller, Phys. Rev.
Lett. 106, 151102 (2011).5. P. Wolf et al., Class. Quantum Gravity 28, 145017 (2011).6. J. W. G. Wignall, Phys. Rev. Lett. 68, 5 (1992).7. Ch. J. Bordé, Eur. Phys. J. Spec. Top. 163, 315 (2008).8. M. A. Hohensee, B. Estey, P. Hamilton, A. Zeilinger,
H. Müller, Phys. Rev. Lett. 108, 230404 (2012).9. L. Essen, J. V. L. Parry, Nature 176, 280 (1955).10. T. E. Parker, Metrologia 47, 1 (2010).11. A. D. Ludlow et al., Science 319, 1805 (2008).12. C. W. Chou, D. B. Hume, J. C. J. Koelemeij, D. J. Wineland,
T. Rosenband, Phys. Rev. Lett. 104, 070802 (2010).13. A. D. Cronin, J. Schmiedmayer, D. E. Pritchard, Rev. Mod.
Phys. 81, 1051 (2009).14. H. Müller, S.-W. Chiow, Q. Long, S. Herrmann, S. Chu,
Phys. Rev. Lett. 100, 180405 (2008).15. S.-Y. Lan, P.-C. Kuan, B. Estey, P. Haslinger, H. Müller,
Phys. Rev. Lett. 108, 090402 (2012).16. Materials and methods are available as supplementary
materials on Science Online.17. R. Bouchendira, P. Cladé, S. Guellati-Khélifa,
F. Nez, F. Biraben, Phys. Rev. Lett. 106, 080801 (2011).
18. P. J. Mohr, B. N. Taylor, D. B. Newell, The 2010CODATA Recommended Values of the FundamentalPhysical Constants (Web Version 6.0); http://physics.nist.gov/constants.
19. S. Dimopoulos, P. W. Graham, J. M. Hogan, M. A. Kasevich,Phys. Rev. Lett. 98, 111102 (2007).
20. “Resolution 1: On the possible future revision of theInternational System of Units, the SI,” GeneralConference on Weights and Measures, Sèvres, France,17 to 21 October 2011.
21. D. Hanneke, S. Fogwell, G. Gabrielse, Phys. Rev. Lett.100, 120801 (2008).
22. T. Aoyama, M. Hayakawa, T. Kinoshita, M. Nio, Phys. Rev.Lett. 109, 111807 (2012).
23. I. A. Robinson, B. P. Kibble, Metrologia 44, 427 (2007).24. R. L. Steiner, E. R. Williams, R. Liu, D. B. Newell,
IEEE Trans. Instrum. Meas. 56, 592 (2007).25. B. Andreas et al., Phys. Rev. Lett. 106, 030801 (2011).26. T. J. Kippenberg, K. J. Vahala, Science 321, 1172 (2008).27. D. L. Freimund, H. Batelaan, Phys. Rev. Lett. 89, 283602
(2002).
Acknowledgments: We thank S. Chu, P. Hamilton, andM. Kasevich for stimulating discussions; D. Budker,P. Kehaiyas, G. Kim, M. Xu, E. Ronayne Sohr, and D. Schlippertfor experimental assistance; and A. Brachmann, R. Falcone,and W. E. White for providing a laser. J.M.B. acknowledgessupport by the Miller Institute for Basic Research in Science.This work was supported by the Alfred P. Sloan Foundation, theDavid and Lucile Packard Foundation, the National Institute ofStandards and Technology, the National Science Foundation,and the National Aeronautics and Space Administration.
Supplementary Materialswww.sciencemag.org/cgi/content/full/science.1230767/DC1Materials and MethodsSupplementary TextFigs. S1 and S2Table S1References (28–32)
26 September 2012; accepted 20 November 2012Published online 10 January 2013;10.1126/science.1230767
Nanoscale Nuclear MagneticResonance with a Nitrogen-VacancySpin SensorH. J. Mamin,1 M. Kim,1,2 M. H. Sherwood,1 C. T. Rettner,1 K. Ohno,3 D. D. Awschalom,3 D. Rugar1*
Extension of nuclear magnetic resonance (NMR) to nanoscale samples has been a longstandingchallenge because of the insensitivity of conventional detection methods. We demonstrated the useof an individual, near-surface nitrogen-vacancy (NV) center in diamond as a sensor to detectproton NMR in an organic sample located external to the diamond. Using a combination ofelectron spin echoes and proton spin manipulation, we showed that the NV center senses thenanotesla field fluctuations from the protons, enabling both time-domain and spectroscopic NMRmeasurements on the nanometer scale.
Both nuclear magnetic resonance (NMR)spectroscopy andmagnetic resonance im-aging (MRI) have become indispensable
tools inmany diverse fields of research, includinganalytical chemistry, materials science, structuralbiology, neuroscience, and medicine (1). The onemajor deficiency of NMR is the low sensitivityof the conventional coil-based induction meth-od of detection, which prevents its applicationto samples at the nanometer scale (2). Much im-proved detection sensitivity has been achievedwith magnetic resonance force microscopy, whichis based on detecting weak magnetic forces in
the presence of a strong field gradient and hasdemonstrated nanometer-scale NMR imagingat cryogenic temperatures (3). Here, we presentan alternative nanoscale detection method thatworks in the absence of amagnetic field gradient,thus preserving spectroscopic information, andis operable over a wide range of temperatures,including room temperature. A single near-surfacenitrogen-vacancy (NV) center in diamond is usedas an atomic-size sensor to detect weak mag-netic fields originating from nuclear spins ex-ternal to the diamond. In an initial demonstration,we detected randomly polarized hydrogen nu-clei (protons) in an organic polymer. Both timedomain and spectroscopic information were ob-tained by appropriately manipulating the pro-tons so as to affect the precession phase of thehighly coherent NVelectron spin. The results sug-gest that NV-based NMR detection may provide apath toward three-dimensional nanoscale mag-netic resonance imaging (nanoMRI) under ambi-ent conditions (4, 5).
NV centers are proving to be particularly use-ful for both quantum information processing andnanoscale magnetic sensing (6–11). The negative-ly charged center has a spin state with a longcoherence time, especially in isotopically purifiedcrystals (12, 13), and an electronic-level structure
1IBM Research Division, Almaden Research Center, San Jose,CA 95120, USA. 2Center for Probing the Nanoscale, StanfordUniversity, Stanford, CA 94305, USA. 3Center for Spintronicsand Quantum Computation, University of California, SantaBarbara, CA 93106, USA.
*To whom correspondence should be addressed. E-mail:[email protected]
www.sciencemag.org SCIENCE VOL 339 1 FEBRUARY 2013 557
REPORTS
on
Janu
ary
31, 2
013
ww
w.s
cien
cem
ag.o
rgD
ownl
oade
d fr
om

that enables a convenient optical initialization andreadout of the spin state. Much previous workhas concentrated on the interactions of NV cen-ters with nuclear spins internal to the diamondlattice (14–17), but nanoMRI requires the detec-tion of external nuclear spins.
The key to effective external spin sensing is tohave the NV center positioned near the diamondsurface while maintaining a long spin coherencetime (18–20). The spin coherence in diamondcan be adversely affected by magnetic fluctua-tions from 13C nuclear spins and various para-magnetic centers, such as nitrogen P1 centers andsurface dangling bonds (21). In our experiments,the NV center was embedded in a layer of iso-topically pure 12C diamond grown epitaxiallyon top of an electronic grade (001)-oriented dia-mond substrate by plasma-enhanced chemicalvapor deposition (Fig. 1A). NV centers wereformed ~20 nm below the surface by briefly in-troducing 15N2 gas during the growth process,followed by electron irradiation to create va-cancies and annealing at 850°C to mobilize thevacancies and mitigate lattice damage (13, 22).Despite their proximity to the surface, the re-sulting NV centers (Fig. 1B) had long electronspin coherence times T2e, on the order of 600 msas determined byHahn spin echo measurements(Fig. 1D). This long spin coherence is criticalfor achieving the sensitivity required for theseexperiments.
The experimental apparatus consisted of ahome-built scanning confocal microscope thatuses 532-nm laser radiation to probe the NVcenter. Fluorescence from the NV center in thewavelength range of 600 to 800 nm was de-tected with an avalanche photodiode and gatedphoton counter. The fluorescence intensity isindicative of the NV spin state because thems = 0spin state fluoresces with ~30% greater bright-ness than the ms = T1 states. To manipulate thespins in both the diamond and the polymer, a3.6-mm-wide microwire was lithographicallyfabricated on the diamond surface and drivenby a programmable microwave (MW) synthesizerfor NV spin control and a radiofrequency (RF)function generator for proton spin control. Theproton-containing sample was a 60-nm-thicklayer of poly(methyl methacrylate) (PMMA)with proton density rN ≈ 57 nm–3 formed byspin casting on the diamond surface. A back-ground magnetic field B0 of 70 to 80 mT froma permanent magnet was accurately aligned tothe NV symmetry axis (along the diamond [111]axis).
Several different protocols are possible fordetecting weak magnetic signals from relativelydistant nuclear spins. For the detection of internal13C nuclear spins, multipulse sequences, such asthe Carr-Purcell-Meiboom-Gill (CPMG) sequence,have been used to selectively couple the NV cen-ter to the Larmor-frequency magnetic field ema-nating from freely precessing nuclei (15–17). Thisapproach is effective when the nuclear spin pre-cession has a T*2n correlation time comparable
to or exceeding the electron spin coherence timeT2e of the NV center. By contrast, for a typicalsolid-state organic sample, the nuclear spin cor-relation time is greatly reduced by strong dipolarinteractions among the densely packed protons.Conventional proton NMR measurements onour PMMA material found T2n and T*2n to be 18and 14 ms, respectively, much shorter than the600-ms coherence time of the NV center. Thus,there is a mismatch in the time scales, and thenuclear spin precession will not remain coher-ent for the full duration of a long multipulsesequence (20). Rather than sensing the Larmorprecession of the protons, we coupled the NVcenter to the longitudinal magnetization, whichhas a correlation time given by the spin-latticerelaxation time T1n, on the order of seconds atroom temperature.
As evident in Fig. 1C, the effective samplevolume probed by the NV center was small, onthe order of (24 nm)3. Because of the smallvolume and low polarizing magnetic field, theproton polarization was dominated by
ffiffiffiffi
Np
sta-tistical fluctuations, where the number of pro-tons Nwas of order 106 (23). Although the meanproton polarization was negligible, statistical fluc-
tuations of the longitudinal polarization were de-tected by their effect on the phase of the NV spinprecession (20, 24–27). We started by polarizingthe NV center to thems ¼ 0 spin state with a 4-mslaser pulse (Fig. 2A). The NV center was thendriven withMW pulses in a spin echo sequencewith total echo time t in the range of 300 to 440 ms.Synchronous with the spin echo sequence, weapplied two identical RF pulses separated in timeby t/2, with each pulse consisting of exactly 30 sinewave cycles (approximating NMR p pulses). Thefirst RF pulse set up an initial random longitu-dinal polarization for the first half of the echosequence. The second RF pulse inverted this po-larization for the second half. The inversion ofproton polarization reversed the proton dipolarmagnetic field BN(t) acting on the NV center andupset the equivalence of the NV spin precessionfor the two halves of the spin echo, thus reducingthe spin echo amplitude. The identical nature ofthe RF pulses minimized any spurious effectthey might have on the NV spin echo becauseidentical disturbances during the two halves ofthe echo sequence should cancel. The spin echosequence was typically repeated several milliontimes to accumulate sufficient photon counting
Fig. 1. Basic configuration of NV-NMR detection. (A) Sample geometry with [111]-oriented NV spinembedded 20-nm deep within 12C diamond layer. The NV center detects NMR of protons in the PMMApolymer layer. (B) Fluorescence image of sample surface showing microwire and NV center (circled). (C)Cross-section of the PMMA layer showing calculated spatial dependence of proton detection sensitivity.Half of the proton signal originates from a volume of (24 nm)3. The two lobes are a consequence of the54.7° tilt angle of the NV axis with respect to the surface normal. (D) Normalized spin echo response versustotal echo time. Solid curve is a fit of measured data points using the model x0(t)¼ exp[−(t/T2e)n]. Fitparameters give n ¼ 2:17 and T2e ¼ 606 ms.
1 FEBRUARY 2013 VOL 339 SCIENCE www.sciencemag.org558
REPORTS
on
Janu
ary
31, 2
013
ww
w.s
cien
cem
ag.o
rgD
ownl
oade
d fr
om

statistics and to ensure that many different ran-dom polarization states of the sample protonswere probed.
The spin echo response as a function of thefrequency of the RF pulses (Fig. 2B) displayeddistinct dips when the RF frequency matched
the proton NMR frequency. As expected, the RFfrequency for the dip depended on the magnitudeof the applied static field B0. The dip frequencyas a function of field was well fit by a line withslope 42.6 MHz·T–1 (Fig. 2C), which matches thegyromagnetic ratio for protons. When the PMMAlayer was removed from the diamond, the signaldisappeared, indicating that the proton signaldoes indeed originate from the polymer and notfrom hydrogen contamination within the dia-mond (bottom curve in Fig. 2B).
The amplitude of the proton magnetic fieldfluctuations can be estimated from the depth ofthe dips in Fig. 2. The precession phase imbalanceaccumulated during the spin echo is given bydf ¼ g∫t=20 BN ðtÞdt − g∫tt=2BN ðtÞdt, where g =2p × 28 GHz·T–1 is the NVelectron spin gyro-magnetic ratio. Assuming df is a normally distrib-uted random variable with zero mean, the resultingspin echo amplitude is xðtÞ ¼ x0ðtÞ⟨cosdf⟩ ¼x0ðtÞexpð−⟨ðdfÞ2⟩=2Þ. Here, x0(t) is the nor-malized spin echo amplitude in the absence ofproton reversals (Fig. 1D), ⟨⋯⟩ indicates meanvalue, and ⟨ðdfÞ2⟩ is the variance of the accumu-lated phase, which depends on both the magni-tude and correlation properties of the proton fieldfluctuations (20). For Tln >> t, where BN(t) isessentially static for the duration of an individualecho sequence (except for the RF-induced inver-sion), ⟨ðdfÞ2⟩ ¼ g2t2⟨B2
N ⟩. Combining this equa-tion with the expression for x(t), we find ⟨B2
N ⟩ ¼ð2=g2t2Þlogðx0ðtÞ=xðtÞÞ, which simplifies forsmall fields to ⟨B2
N ⟩ ¼ ð2=g2t2ÞDx=x0ðtÞ, whereDx=x0ðtÞ ¼ ½x0ðtÞ − xðtÞ�=x0ðtÞ is the fractionalchange in spin echo amplitude.
The dips in Fig. 2Bhad depths thatwere roughlyDx/x0(t) = 0.20, which from the above expressions
Fig. 2. Nanoscale NMR detection. (A) Pulsing scheme in which RF pulses serve to invert sample protonsduring the NV spin echo. Measurements are made with two different initial p/2 pulse phases. (B) Relative spinecho response as a function of RF frequency. With the PMMA sample present, clear dips are seen when the RFfrequency matches the proton Larmor frequency. No dip is evident after PMMA has been removed. Curves areoffset vertically for clarity. Total echo timewas 300ms. (C) Center frequency of dips versus external fieldB0. Lineshows expected dependence based on the proton gyromagnetic ratio.
Fig. 3. Time domain measurements and NMR spec-trum taken at B0 = 79.5 mT. (A) Spin echo sequencewith an RF pulsing scheme similar to a Ramseyfringe. The effectiveness of proton inversion dependson evolution time tn. RF pulses consist of 15 sinewave cycles and approximate NMR p/2 pulses. (B)Proton-induced oscillation of spin echo response x asa function of tn measured in steps of 32 ns. The os-cillation frequency matches the expected 3.38-MHzproton precession frequency. (C) Proton-inducedoscillation of spin echo signal for a longer recordwhere the sampling period is 336 ns. Undersamplingof the waveform causes the apparent frequency to beshifted to 396 kHz due to aliasing. Initial decayduring the first 15 ms is evident. (D) Solid curve: NV-based NMR spectrum obtained by cosine transformof data in (C). Frequencies have been shifted upwardby 2.976 MHz to compensate for the aliasing effect.Dashed curve: Conventional 500-MHz NMR protonspectrum of PMMA that has been plotted to overlaythe NV-based spectrum.
www.sciencemag.org SCIENCE VOL 339 1 FEBRUARY 2013 559
REPORTS
on
Janu
ary
31, 2
013
ww
w.s
cien
cem
ag.o
rgD
ownl
oade
d fr
om

gives the root-mean-square magnetic field Brms ≡⟨B2
N ⟩1=2 ¼ 12 nT‐rms, a value substantially less
than expected. For a thick polymer layer, the fieldwas expected to be Brms ≈ Cm0mpr
1=2N =d3=2,
where C ¼ 1=8ffiffiffiffiffi
2pp
≈ 0:050, m0 is the perme-ability of free space, mp is the proton magneticmoment, and d is the depth of the NV center(22, 24). Assuming a NV depth of 20 nm givesBrms = 75 nT-rms, substantially greater than theexperimental value. The cause of this discrepan-cy is not presently understood, but could be theresult of greater-than-expected NV depth or in-efficiency in the proton inversions by less-than-ideal RF field amplitude (estimated to be about1 mT).
The signal-versus-frequency curves in Fig.2B represent a crude form of NMR spectros-copy, but the dips are broadened by the am-plitude of the RF pulses. To obtain higher spectralresolution, we implemented a Fourier trans-form technique resembling that used in conven-tional high-resolution NMR spectroscopy, wherea time domain “free induction decay” (FID) isFourier transformed to obtain the NMR fre-quency spectrum (1). We modified our pulse se-quence by splitting each RF p pulse into a pair ofp /2 pulses (Fig. 3A). We then incremented thespacing tn of the p /2 pulses in amanner similar toa Ramsey fringe experiment while monitoring theeffect on the NV spin echo. This pulsing schemediffered from a conventional Ramsey experimentin that the frequency of the RF pulses was at theproton frequency and not at an offset frequency,and theRFpulseswere not gated froma continuous-wave oscillator, but were triggered waveforms con-sisting of exactly 15 sine wave cycles.
As the pulse spacing tn was scanned, the NVspin echo response oscillated with a period thatmatched the proton Larmor frequency (Fig. 3B).This time domain response is roughly equivalentto a conventional FID in NMR, but is based onthe correlation of the precession of the statisticalproton polarization. No oscillations were seen ifthe RF frequency was far off the NMR resonance(e.g., by 600 kHz) or if the PMMAwas removed(fig. S2).
To obtain a longer time record, we recordedthe spin echo response using coarser steps in tn(Fig. 3C). The coarser steps allowed faster ac-quisition of a long time record, but undersam-pled the Larmor frequency oscillation, resultingin an “aliasing” effect where the Larmor preces-sion frequency appeared to have shifted to a lowerfrequency. Despite the undersampling, the pre-cession oscillations were clearly seen and de-cayed substantially during the first 15 ms, similarto the T*2n time scale expected for PMMA. Afterthe initial decay, some oscillations persisted to theend of the 50-ms-long record, which was unex-pected for a solid-state polymer given the shortT*2n. This unexpected persistence of the appar-ent proton coherence is not understood, althoughit suggests that some component of the sam-ple, perhaps residual solvent, has a longer thanexpected T*2n.
By applying a cosine transform to the timedomain data, we obtained the frequency spectrumshown in Fig. 3D. The spectrum shows a singlenarrow peak at the proton Larmor frequency(after correcting for aliasing) with full width athalf-maximum of ~20 kHz. Some broadening atthe base of the peak is also evident. For compari-son, we overlay a conventional NMR spectrumtaken at 11.7 T, which also shows just a singlecentral peak with a width that closely matches thatof the NV-based spectrum.
The detection of external nuclear spins usinga single NV center represents an important firststep toward NV-based nanoMRI. Looking for-ward, it is instructive to evaluate current sensi-tivity levels and project possible improvementsin the context of future imaging experiments.For the detection of the random fields with ourprotocol, the minimum detectable mean-squaremagnetic field [i.e., with unity signal-to-noise ra-tio (SNR)] is given by B2
min ¼ A=g2t3=2T1=2a ,
where Ta is the total acquisition time (22). Theparameter A characterizes the photon-countingrate and spin-dependent contrast and is givenbyA ¼ 2
ffiffiffi
2p ða0 þ b0Þ1=2=ða0 − b0Þx0ðtÞ, where
a0 and b0 are the average number of photonsdetected per echo for the NV in the ms ¼ 0 andT1 states, respectively. Under the present condi-tions of a0 = 0.02, b0 = 0.014, t = 440 ms, andx0(t) = 0.60, and assuming the longest practicaldwell time for an imaging application to be Ta =60 s, we find that Bmin = 8 nT-rms.
Using the results of numerical calculations,we can interpret the minimum detectable field interms of the volume of protons needed to producesuch a field (22). Assuming a cubic volume ele-ment (voxel) located 20 nm above the NV cen-ter on the diamond surface, we find that the voxelsize producing 8 nT-rms is (4.3 nm)3. Here, wehave taken into account the 54.7° angle betweenthe [111]-oriented spins and the (001) surfacenormal and assumed optimal lateral placement ofthe voxel. If we require a signal-to-noise ratio of10, the corresponding volume element would be(12 nm)3. Many technical improvements inNV signal detection have been previously dem-onstrated that would enhance the spin sensi-tivity even further. For example, if we assume afivefold improvement of fluorescence detectionusing microfabricated photonic structures (18, 28)and a reduction of NV center depth to 5 nm withT2e = 200 ms (13), we find that Bmin = 15 nT-rmsfor a 60-s acquisition time. The reduced NVdepth would greatly improve the sensitivity to theprotons on the surface, yielding unity SNR for avolume element of only (0.2 nm)3, essentiallysingle-proton sensitivity, if a (111)-oriented dia-mond surface is assumed. If we demand a SNRof 10 and require the ability to image at least 5 nmdeep into the sample, the corresponding volumeelement is (1.8 nm)3. Although many technical is-sues still remain, the potential for three-dimensionalnanoscale imaging with room-temperature oper-ation, elemental selectivity, and no radiation dam-age suggests that NV-based nanoMRI could become
an important complement to current state-of-the-art molecular imaging techniques, such as cryo-electron tomography (29) and noncontact atomicforce microscopy (30).
References and Notes1. R. R. Ernst, G. Bodenhausen, A. Wokaun, Nuclear
Magnetic Resonance in One and Two Dimensions(Oxford Univ. Press, Oxford, 1987).
2. P. Glover, S. P. Mansfield, Rep. Prog. Phys. 65,1489 (2002).
3. C. L. Degen, M. Poggio, H. J. Mamin, C. T. Rettner,D. Rugar, Proc. Natl. Acad. Sci. U.S.A. 106, 1313(2009).
4. C. L. Degen, Appl. Phys. Lett. 92, 243111 (2008).5. B. M. Chernobrod, G. P. Berman, J. Appl. Phys. 97,
014903 (2005).6. A. Gruber et al., Science 276, 2012 (1997).7. R. J. Epstein, F. M. Mendoza, Y. K. Kato, D. D. Awschalom,
Nat. Phys. 1, 94 (2005).8. M. S. Grinolds et al., Nat. Phys. 7, 687 (2011).9. F. Jelezko et al., Phys. Rev. Lett. 93, 130501
(2004).10. J. R. Maze et al., Nature 455, 644 (2008).11. G. Balasubramanian et al., Nature 455, 648 (2008).12. G. Balasubramanian et al., Nat. Mater. 8, 383
(2009).13. K. Ohno et al., Appl. Phys. Lett. 101, 082413
(2012).14. P. Neumann et al., Science 329, 542 (2010).15. N. Zhao et al., Nat. Nanotechnol. 7, 657 (2012).16. T. H. Taminiau et al., Phys. Rev. Lett. 109, 137602
(2012).17. S. Kolkowitz, Q. P. Unterreithmeier, S. D. Bennett,
M. D. Lukin, Phys. Rev. Lett. 109, 137601 (2012).18. P. Maletinsky et al., Nat. Nanotechnol. 7, 320
(2012).19. B. Grotz et al., New J. Phys. 13, 055004 (2011).20. H. J. Mamin, M. H. Sherwood, D. Rugar, Phys. Rev. B
86, 195422 (2012).21. A. Laraoui, J. S. Hodges, C. A. Meriles, Nano Lett.
12, 3477 (2012).22. See supplementary materials on Science Online.23. C. L. Degen, M. Poggio, H. J. Mamin, D. Rugar,
Phys. Rev. Lett. 99, 250601 (2007).24. C. A. Meriles et al., J. Chem. Phys. 133, 124105
(2010).25. A. Laraoui, J. Hodges, C. Ryan, C. Meriles, Phys. Rev. B
84, 104301 (2011).26. J. M. Taylor et al., Nat. Phys. 4, 810 (2008).27. L. T. Hall, J. H. Cole, C. D. Hill, L. C. L. Hollenberg,
Phys. Rev. Lett. 103, 220802 (2009).28. J. P. Hadden et al., Appl. Phys. Lett. 97, 241901
(2010).29. E. I. Tocheva, Z. Li, G. J. Jensen, Cold Spring Harb.
Perspect. Biol. 2, a003442 (2010).30. L. Gross, F. Mohn, N. Moll, P. Liljeroth, G. Meyer,
Science 325, 1110 (2009).
Acknowledgments: We thank F. Reinhard, J. Wrachtrup,P. Hemmer, and A. Bleszynski Jayich for helpfuldiscussions. This work was supported by the DefenseAdvanced Research Projects Agency QuASAR program,the Air Force Office of Scientific Research, and theCenter for Probing the Nanoscale at Stanford University(NSF grant PHY-0830228).
Supplementary Materialswww.sciencemag.org/cgi/content/full/339/6119/557/DC1Materials and MethodsSupplementary TextFigs. S1 to S3
15 October 2012; accepted 3 December 201210.1126/science.1231540
1 FEBRUARY 2013 VOL 339 SCIENCE www.sciencemag.org560
REPORTS
on
Janu
ary
31, 2
013
ww
w.s
cien
cem
ag.o
rgD
ownl
oade
d fr
om

Nuclear Magnetic ResonanceSpectroscopy on a (5-Nanometer)3
Sample VolumeT. Staudacher,1,2 F. Shi,3 S. Pezzagna,4 J. Meijer,4 J. Du,3 C. A. Meriles,5F. Reinhard,1* J. Wrachtrup1
Application of nuclear magnetic resonance (NMR) spectroscopy to nanoscale samples has remainedan elusive goal, achieved only with great experimental effort at subkelvin temperatures. We demonstrateddetection of NMR signals from a (5-nanometer)3 voxel of various fluid and solid organic samplesunder ambient conditions. We used an atomic-size magnetic field sensor, a single nitrogen-vacancydefect center, embedded ~7 nanometers under the surface of a bulk diamond to record NMRspectra of various samples placed on the diamond surface. Its detection volume consisted of only104 nuclear spins with a net magnetization of only 102 statistically polarized spins.
Nuclear magnetic resonance (NMR) spec-troscopy (1, 2) provides a label-free meth-od for chemical analysis, provided that
there is sufficient sample for detection. Mucheffort has been directed to applying NMR tonanoscale samples. Indeed, NMR detection of a(4 nm)3 voxel of protons has been achieved withmagnetic resonance force microscopy, a challeng-ing experimental technique operating at ultralowtemperature in vacuum (3, 4). Under ambientconditions, microcoil detectors have enabled thedetection of liquid samples of (3000 nm)3 vol-ume, but further miniaturization of this tech-nique is not straightforward (5, 6).
Recently, single nitrogen-vacancy (NV) cen-ters in diamond (7, 8) have been proposed as anovel atomic-size magnetic field sensor for de-
tecting nanoscale nuclear spin ensembles or evensingle nuclear spins (9). This center is a jointdefect in the carbon lattice of diamond, consist-ing of a substitutional nitrogen atom and an ad-jacent vacancy. Its spin triplet (spin 1) groundstate can be polarized and read out optically, sothat electron spin resonance experiments can beperformed on a single spin. A single center can beused as a nanoscale magnetic field sensor, able todetect a magnetic field in the nanotesla range inan integration time of 1 s (10). This correspondsto the field of a single nuclear spin at a distanceof a few nanometers (9). Indeed, detection ofsingle 13C nuclear spins has recently been re-ported, located inside the diamond lattice a fewnanometers from the NV center (11–13).
Here we demonstrate detection of proton (1H)nuclear spins in various liquid and solid sam-ples placed on the diamond surface. This is a keymilestone toward achieving nanoscale magneticresonance imaging based on scanning NV cen-ters (14, 15). The technique additionally allowsone to perform NMR on an arbitrary sample inthe regime of ultralow and zero magnetic field,because it is based on statistical rather than thermalpolarization of the nuclei. Further, our results arean inital step toward efficient hyperpolarizationof any organic sample by the coherent transfer ofpolarization from the optically and fully polar-ized NV center.
We used the experimental setup sketched inFig. 1A. Single NV centers were created 2.5 to
13rd Physics Institute and Research Center SCoPE, Universityof Stuttgart, 70569 Stuttgart, Germany. 2Max Planck Institutefor Solid State Research, 70174 Stuttgart, Germany. 3HefeiNational Laboratory for Physics Sciences at Microscale andDepartment of Modern Physics, University of Science andTechnology of China, Hefei, 230026, China. 4RUBION, Ruhr-Universität Bochum, 44801 Bochum, Germany. 5Departmentof Physics, The City College of New York, CUNY New York, NY10031, USA.
*To whom correspondence should be addressed. E-mail:[email protected]
Fig. 1. (A) NV centers implanted near the diamond surface were used to detectproton spins within liquid and solid organic samples placed on the crystal sur-face. (B) Spin noise from a small ensemble of nuclear spins. Larmor precessioncreates an oscillating field of statistically fluctuating amplitude and phase. (C)XY8-N dynamical decoupling sequence used to detect this spin noise. Ramseyinterferometry by an initial and final p/2 pulse measures the magnetic field. A train of N p pulses acts as a filter to select a specific frequency componentof the noise. (D) Filter function of the pulse sequence, peaking at one specific frequency 1/2t. (E) Repeating the sequence for varying pulse spacing tyields a spectrum of the spin noise.
www.sciencemag.org SCIENCE VOL 339 1 FEBRUARY 2013 561
REPORTS
on
Janu
ary
31, 2
013
ww
w.s
cien
cem
ag.o
rgD
ownl
oade
d fr
om

10 nm below the surface of the diamond by ionimplantation (16) with a sample of organic ma-terial placed on the diamond surface [see sup-plementary material (17)].
Our technique for detecting the magnetic fieldof protons in the sample is based on measuringthe statistical polarization of the spin populationnear the NV center with a dynamical decouplingmethod (Fig. 1, B to E). The magnetic field at theNV center is dominated by a small number ofnearest protons (on the order of 104). The netmagnetization of this small set of randomlyoriented spins is zero but has a sizable standarddeviation equivalent to
ffiffiffiffi
Np ¼ 102 protons. Equiv-
alently, this excess amount of protons can be con-sidered to be statistically polarized along a randomdirection (18, 19). In particular, this statisticalpolarization will lead to a random magnetization⟨Mx⟩,⟨My⟩ in the transverse plane, which undergoesLarmor precession under the applied magneticfield and leads to an oscillating field componentBz ¼ Bð⟨Mx⟩, ⟨My⟩Þcosð2pt=tLarmor þ fÞ alongthe axis of the NV center.
We detected this oscillating component usingdynamical decoupling ac magnetometry basedon the XY8-N pulse sequence (20–26) (Fig.1C). Here, an initial p/2 microwave pulse placesthe NV center into a coherent superpositionðj0⟩þ eifj1⟩Þ= ffiffiffi
2p
of two spin states. Its phasef is sensitive to the fluctuating magnetic field andevolves from f = 0 at the beginning of the se-quence to a nonzero random phase f = Df, whichis converted into a population difference of thestates by a final p/2 pulse and subsequently readout. For a fluctuating magnetic field, this phase is arandom variable with variance ⟨Df2⟩, which, whenaveraged over many repetitions, reduces the read-out contrast obtained after the final p/2 pulse to
C ¼ 2j⟨1jy⟩j2−1 ¼ e−⟨Df2⟩=2
The phase ⟨Df2⟩ is made sensitive to spe-cific frequency components by periodically flip-ping the NV spin by a train of N equidistant ppulses between the initial and final p/2 pulse.
This “quantum lock-in detection” (23) enhancessensitivity to all fields oscillating synchronouslywith the pulse spacing t, while it suppresses theeffect of field fluctuations at every other fre-quency. More precisely
⟨Df2⟩ ¼ g2 ∑∞
n¼−∞SgðnnÞSBðnnÞ
where g ¼ gmB=ℏ is the NV spin’s gyromagneticratio, nn ¼ n=Nt; SBðnnÞ is the power spectraldensity of magnetic field fluctuations, and thefilter function SgðnnÞ is a function sharply peakedaround the frequency 1/2t encoding the effect ofthe p-pulse train (Fig. 1D). Repeating the ex-periment for varying pulse spacings t, we cansample the entire spectrum SBðnnÞ and hencerecord a NMR spectrum of statistically polarizednuclei in the vicinity of the center.
A typical spectrum obtained from such an ex-periment (Fig. 2A) is dominated by a strongpeak at the 13C Larmor frequency, correspondingto spin noise from intrinsic nuclei of the diamondlattice. Under high-order dynamical decoupling,sensitivity increased sufficiently to reveal an ad-ditional smaller peak (blue line in Fig. 2A) that weattribute to protons from the sample placed on thediamond surface. Its frequency scales linearly withmagnetic field (Fig. 2B) with a slope of 4.25 T0.04 kHz/G, the gyromagnetic ratio of 1H.
We could reversibly switch the signal seen bya given NV center by coating the surface withdifferent solid and liquid compounds (Fig. 3A).The signal was visible under a coating of immer-sion oil (yellow circles), but it completely van-ished under a coating of a deuterated polymer(2H-PMMA, blue triangles) and subsequentlyreappeared when the surface was coated with itsnatural-abundance equivalent (green squares).We also demonstrated basic spectroscopy byrecording several high-resolution spectra (Fig.3B). Under a PMMA coating, we measured abroadened linewidth of 46.3 T 1.5 kHz (ob-tained from a Lorentzian fit), which agrees wellwith reported data (27). Spectroscopy under a
liquid sample reveals a narrow line (oil, Fig. 3B),as expected from rotational narrowing. Its line-width of 14.4 T 0.4 kHz was still four orders ofmagnitude greater than typical values for bulkliquid NMR, which can be explained by two ef-fects. First, diffusion through the nanoscale sam-ple volume can randomize polarization on a fast
Fig. 2. (A) NMR spectrum of statistically polarized nuclei in the vicinity of ashallow implanted NV center. A strong contribution of 13C nuclei inside the dia-mond [yellow, acquired by a CPMG6 sequence (20)] was accompanied by a
weaker component of 1H nuclei of the sample (blue, acquired using a XY8-160sequence and a sample of microscopy immersion oil). (B) Both components shiftedwith the magnetic field at the gyromagnetic ratios of the respective species.
Fig. 3. (A) NMR spectra obtained successively onthe same center with an XY8-80 sequence undercoatings of a liquid sample (immersion oil, yellowpoints), a deuterated solid (2H PMMA, blue triangles),and a protonated solid sample (1H PMMA, greensquares). (B) High-resolution spectra (XY8-112).Green squares: Spectrum under a polymer coating(1H PMMA). Yellow circles: Spectrum under immer-sion oil, obtained on the same NV. Tilted red squares:Spectral resolution of our scheme, obtained on adifferent NV by applying externally generated mag-netic field noise of fixed frequency. Spectra are off-set along the y axis to enhance readability.
1 FEBRUARY 2013 VOL 339 SCIENCE www.sciencemag.org562
REPORTS
on
Janu
ary
31, 2
013
ww
w.s
cien
cem
ag.o
rgD
ownl
oade
d fr
om

time scale and broaden the line. Second, the linewas substantially broadened by our spectral res-olution (12.2 T 0.3 kHz, upper curve of Fig.3B). This experimental resolution could be im-proved by increasing N, the order of dynamicaldecoupling, which should allow for an ultimateresolution of Dn=n ≈ ðT1,NVWR,NV Þ−1 ≈ 1ppm,withT1,NVWR,NV denoting the relaxation time andRabi frequency of the NV, respectively (28, 29).
The integrated, background-corrected fieldstrength experienced under a coating of PMMAby a typical NV center is Brms = 390 T 60 nT (greenshaded area in Fig. 3A). According to an ana-lytical model of the proton magnetic field (30),assuming a homogeneous proton density of 5 ×1028 m–3, this field strength corresponds to an NVcenter located 6.4 T 0.7 nm below the surface.Numerical simulations of the ion implantationpredict a similar value (17). This suggests thatour result can yield a nondestructive method tomeasure the depth of an individual center withnanometer statistical uncertainty.
We confirmed the signal magnitude by a nu-merical simulation, which explicitly computesthe field of 4 × 10⁵ protons, placed at randomlocations in a cube of 20-nm width. We foundthat 70% of the signal was generated by the 104
closest protons, corresponding to a detection vol-ume of only (5 nm)3 (Fig. 4), which is comparableto that of a medium-size (100-kD) protein.
An important extension of our results willbe the combination with scanning NV centers(14, 15) to implement NMR imaging at the nano-scale. Being based on statistical rather thanthermal polarization, our approach enables theacquisition of NMR spectra of an arbitrary sub-stance at low magnetic fields, down to and includ-ing zero field, without the need for prepolarization(31). In this regime, magic angle spinning canbe realized by rotating the external field ratherthan the sample. This allows for higher rotationfrequencies than at high field, which is poten-tially of great benefit for solid-state NMR. Fi-nally, we anticipate that our technique can yielda new method of hyperpolarization for arbitrarysamples by coherently transferring the polariza-tion of the NV spin to the sample. We estimatethat full polarization of the detection volumemight be achievable. The transfer of one quan-
tum of angular momentum would occur on thetime scale of our detection (~20 ms), and hence104 transfers can be completed on a time scalefaster than the protons’ longitudinal relaxationtime T1 (typically on the order of seconds).
References and Notes1. F. Bloch, Phys. Rev. 70, 460 (1946).2. E. M. Purcell, H. C. Torrey, R. V. Pound, Phys. Rev. 69, 37
(1946).3. D. Rugar, R. Budakian, H. J. Mamin, B. W. Chui, Nature
430, 329 (2004).4. C. L. Degen, M. Poggio, H. J. Mamin, C. T. Rettner,
D. Rugar, Proc. Natl. Acad. Sci. U.S.A. 106, 1313 (2009).5. L. Ciobanu, D. A. Seeber, C. H. Pennington, J. Magn. Reson.
158, 178 (2002).6. A. Blank, J. H. Freed, Isr. J. Chem. 46, 423 (2007).7. A. Gruber et al., Science 276, 2012 (1997).8. F. Jelezko, T. Gaebel, I. Popa, A. Gruber, J. Wrachtrup,
Phys. Rev. Lett. 92, 076401 (2004).9. J. M. Taylor et al., Nat. Phys. 4, 810 (2008).10. G. Balasubramanian et al., Nat. Mater. 8, 383 (2009).11. T. H. Taminiau et al., Phys. Rev. Lett. 109, 137602 (2012).12. S. Kolkowitz, Q. P. Unterreithmeier, S. D. Bennett,
M. D. Lukin, Phys. Rev. Lett. 109, 137601 (2012).13. N. Zhao et al., Nat. Nanotechnol. 7, 657 (2012).14. G. Balasubramanian et al., Nature 455, 648 (2008).15. P. Maletinsky et al., Nat. Nanotechnol. 7, 320 (2012).16. J. Meijer et al., Appl. Phys. Lett. 87, 261909 (2005).
17. Supplementary materials are available on Science Online.18. C. L. Degen, M. Poggio, H. J. Mamin, D. Rugar,
Phys. Rev. Lett. 99, 250601 (2007).19. F. Reinhard et al., Phys. Rev. Lett. 108, 200402 (2012).20. L. Cywiński, R. M. Lutchyn, C. P. Nave, S. Das Sarma,
Phys. Rev. B 77, 174509 (2008).21. G. de Lange, D. Ristè, V. V. Dobrovitski, R. Hanson,
Phys. Rev. Lett. 106, 080802 (2011).22. A. Laraoui, J. S. Hodges, C. A. Meriles, Appl. Phys. Lett.
97, 143104 (2010).23. S. Kotler, N. Akerman, Y. Glickman, A. Keselman, R. Ozeri,
Nature 473, 61 (2011).24. J. Bylander et al., Nat. Phys. 7, 565 (2011).25. L. T. Hall, J. H. Cole, C. D. Hill, L. C. L. Hollenberg,
Phys. Rev. Lett. 103, 220802 (2009).26. N. Bar-Gill et al., Nat. Commun. 3, 858 (2012).27. K. M. Sinnott, J. Polym. Sci., Polym. Phys. Ed. 42, 3 (1960).28. E. C. Reynhardt, G. L. High, J. A. van Wyk, J. Chem. Phys.
109, 8471 (1998).29. G. D. Fuchs, V. V. Dobrovitski, D. M. Toyli, F. J. Heremans,
D. D. Awschalom, Science 326, 1520 (2009).30. C. A. Meriles et al., J. Chem. Phys. 133, 124105 (2010).31. M. P. Ledbetter et al., Proc. Natl. Acad. Sci. U.S.A. 105,
2286 (2008).
Acknowledgments: We thank L. Häussler, D. Antonov,A. Denisenko, and A. Aird for sharing cTRIM and moleculardynamics simulation data and G. Majer and T. Bräuningerfor bulk NMR measurements, as well as H. J. Mamin, D. Rugar,and P.-G. Reinhard for helpful discussions. This work wassupported by the European Union (SQUTEC, DIAMANT),the Max Planck Society, Deutsche Forschungsgemeinschaft(SFB/TR21, Research groups 1493 and 1482, SPP1601),Defense Advanced Research Projects Agency (QUASARprogram), Volkswagen Foundation, contract research ofthe Baden-Württemberg foundation (“Methoden für dieLebenswissenschaften”), the 973 Program (2013CB921800),NNSFC (11227901, 91021005, 10834005), and ChineseAcademy of Sciences. T.S. acknowledges financial supportfrom the IMPRS-AM and C.A.M. from the Humboldt Foundationand the NSF (NSF-1111410).
Supplementary Materialswww.sciencemag.org/cgi/content/full/339/6119/561/DC1Materials and MethodsSupplementary TextFigs. S1 to S7References (32, 33)17 October 2012; accepted 3 December 201210.1126/science.1231675
Detecting Ozone- and GreenhouseGas–Driven Wind Trends withObservational DataSukyoung Lee1* and Steven B. Feldstein1
Modeling studies suggest that Antarctic ozone depletion and, to a lesser degree, greenhouse gas(GHG) increase have caused the observed poleward shift in the westerly jet during the austral summer.Similar studies have not been performed previously with observational data because of difficultiesin separating the two contributions. By applying a cluster analysis to daily ERA-Interim data, we foundtwo 7- to 11-day wind clusters, one resembling the models’ responses to GHG forcing and theother resembling ozone depletion. The trends in the clusters’ frequency of occurrence indicate thatthe ozone contributed about 50% more than GHG toward the jet shift, supporting the modeling results.Moreover, tropical convection apparently plays an important role for the GHG-driven trend.
Throughout the late 20th century, the South-ern Hemisphere (SH) westerlies have un-dergone a poleward shift (1–3), especially
during the austral summer (December throughFebruary; DJF hereafter) (Fig. 1A). This change af-fects weather and climate not only by altering the
Fig. 4. Numerical simulationof the detection volume. (A)Three-dimensional visualiza-tion of the 104 closest pro-tons (spheres), generating70% of the signal. Protonsare color-coded by their con-tribution to the total signal.(B) Two-dimensional projec-tions of (A).
www.sciencemag.org SCIENCE VOL 339 1 FEBRUARY 2013 563
REPORTS
on
Janu
ary
31, 2
013
ww
w.s
cien
cem
ag.o
rgD
ownl
oade
d fr
om

location of storms but also by influencing the rate ofcarbon uptake in the Southern Ocean (4, 5) and bydecreasing Antarctic snow melt (6). This polewardjet shift is commonly described as a trend towardthe positive phase of the Southern Annular Mode(SAM), a pattern that is often defined as the firstempirical orthogonal function of the zonal-meanzonal wind (7). Modeling studies found that a pos-itive SAM trend can be simulated either by in-creasing the atmospheric greenhouse gas (GHG)concentration (8) or by decreasing stratosphericozone, with the ozone having a greater impact(9, 10). It is unclear to what extent the model-basedattributions are valid in nature; similar attributionstudies have not been performed with observa-tional data because of the perception that the cir-culation responses cannot be separated. However,the continuumperspective (11, 12) suggests that theresponses to the two forcings may be sufficientlydifferent from each other that a cluster analysiswould find them to be distinctive. Although thisapproach has its own uncertainties, if the responseto the forcings inferred from observational dataresemble those frommodel experiments, we can bereasonably confident that the impacts of the indi-vidual forcings are being accurately evaluated.
This possibility was explored by applying themethod of self-organizing maps (SOMs) (12, 13)to daily DJF zonal-mean zonal wind data from theEuropean Center forMedium-RangeWeather Fore-casts ERA-Interim reanalysis data set (14). Themethod partitions the data into a specified num-ber of patterns, referred to as SOM patterns, orga-nized on an (m × n) SOM grid. The SOM patternsare determined by minimizing the euclidean dis-tance (12) between the SOM patterns and the ob-served fields, yielding patterns that closely resemblethe observations. The number of SOM patternschosen has its basis in two criteria: the numbermustbe large enough to accurately capture the observeddaily fields but small enough to convenientlydescribe the zonal wind anomalies. We quantifiedthis accuracy by calculating pattern correlations be-tween the observed daily fields and the particularSOM pattern for each day that has the smallesteuclidean distance from the observed field. Fromthis calculation (summarized in Table 1), we con-clude that a (4 × 1) grid meets these two criteria.
The four SOM patterns (Fig. 2, left column)express various degrees of zonal wind variability:The first pattern (first row, referred to as SOM1)corresponds to an equatorward shift of the mid-latitude westerlies; the second pattern (secondrow, SOM2) also describes an equatorward shiftbut includes a strong tropical signal; the third pat-tern (third row, SOM3) coincides with a polewardshift of the westerlies with a weakening in themaximum strength of the jet; and the fourth pat-tern (fourth row, SOM4) corresponds to a smallerpoleward jet shift with a strong tropical component.
Three of the four SOM patterns (except SOM2)coincide with a large-amplitude composite (15)SAM signal (fig. S1). The frequency of occurrence(for brevity, “frequency”) of each SOMpatternwasmeasured by counting the number of days onwhich the euclidean distance between a particularSOMpattern and the observed pattern is smallest.This yielded a time series of the frequency (Fig. 2,right column). For SOM3, there is a statisticallysignificant (P < 0.05) positive linear trend (seethe red dashed line). The SOM1 frequency alsoshows a noticeable trend (the black dashed line),although it is not statistically significant.
The extent to which the trend of individualSOM patterns contributes to the actual observedlinear trend can be quantified by multiplying eachSOM pattern by the corresponding frequencytrend normalized by 90 (DJF) days (16). Theresult (Fig. 2, middle column) shows that thepoleward shift in the westerlies is dominated bycontributions from both SOM1 and SOM3, withthe latter being roughly 50% greater. The sumof all four SOM-derived trends (Fig. 1B) com-pares well with the actual trend (Fig. 1A) in most
regions. Because the composite (15) time scalesof SOM1 and SOM3 are 11 and 7 days (measuredas the average of the time scales over which thecomposite SOM1 and SOM3 amplitudes growand decay by a factor of e), respectively (fig. S2),our finding indicates that most of the observedpoleward jet shift can be explained by the deca-dal trends in the frequencies of SOM1 and SOM3.
The spatial structures suggest that SOM1maybe linked to GHG warming and SOM3 to strato-spheric ozone depletion. Figure 2 shows thatSOM1 has a node at the jet center, with one dom-inant extremum on the equatorward side of thejet that has virtually no vertical tilt. In contrast,SOM3 has a node located slightly poleward ofthe jet center and three extrema on the equator-ward side of the jet, with the two nodes on theequatorward side tilting poleward with height.These characteristics of SOM1 and SOM3 arepresent in the model responses to GHG forcing[e.g., figure 5b in (8), figure 4b in (10), and figure3a in (17)] and ozone forcing [figure 3a in (18),figure 4a in (10), and figure 4B in (19)], respec-tively [figure 4b in (10) is reproduced as fig. S3].
1Department of Meteorology, The Pennsylvania State Univer-sity, University Park, PA 16802, USA.∗To whom correspondence should be addressed. E-mail:[email protected]
Fig. 1. The 1979 to 2008DJF zonal-mean zonal windtrend: (A) total trend and(B) the sum of the four SOMtrends shown in Fig. 2. Thesolid contours show the cli-matological zonal-mean zon-al wind.
Table 1. Pattern correlations between the daily zonal-mean zonal wind and the corresponding SOMpattern for each day, weighted by the corresponding SOM frequency (second column). The third columnshows correlations (corr) for SOM1 for the (4 × 1) grid, and SOM1-like patterns for all other grids. Whenthere are more than one SOM1-like patterns, multiple correlations are shown. Similarly, the fourthcolumn shows correlations for SOM3 and SOM3-like patterns.
SOM grid Mean corr for all SOMs Corr for SOM1-like pattern Corr for SOM3-like pattern(4 × 1) 0.48 0.59 0.66(5 × 1) 0.51 0.61 0.67(6 × 1) 0.52 0.69 0.70(7 × 1) 0.54 0.68 0.73(8 × 1) 0.55 0.68 0.63/0.75(9 × 1) 0.58 0.73/0.63 0.75
1 FEBRUARY 2013 VOL 339 SCIENCE www.sciencemag.org564
REPORTS
on
Janu
ary
31, 2
013
ww
w.s
cien
cem
ag.o
rgD
ownl
oade
d fr
om
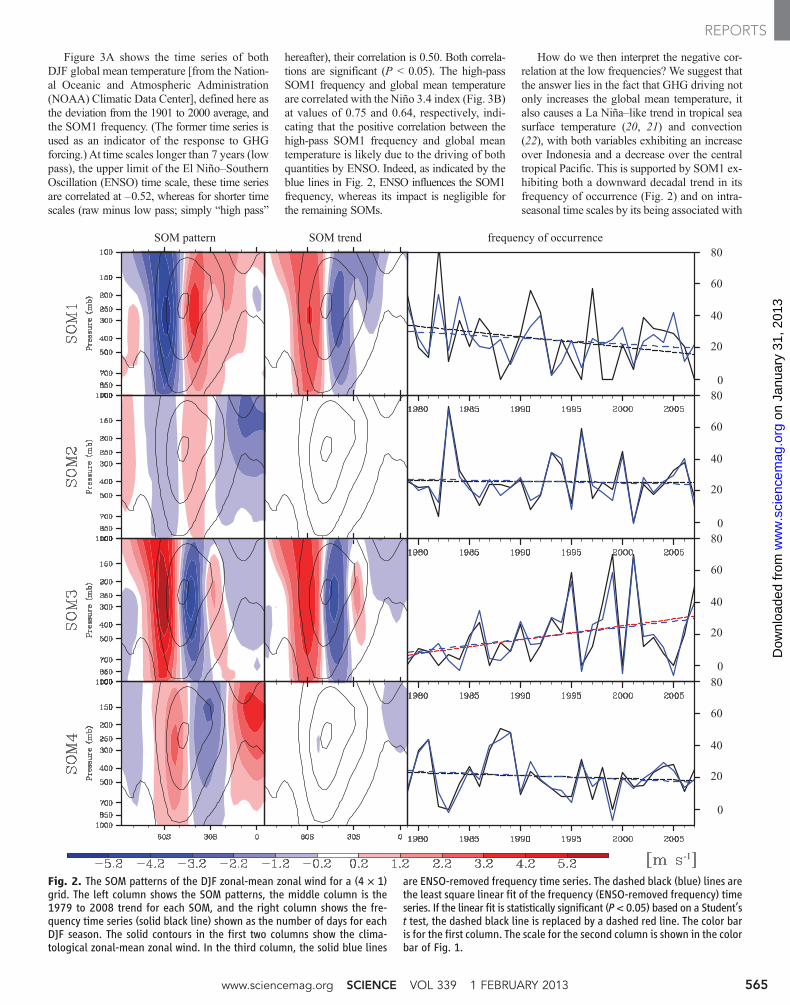
Figure 3A shows the time series of bothDJF global mean temperature [from the Nation-al Oceanic and Atmospheric Administration(NOAA) Climatic Data Center], defined here asthe deviation from the 1901 to 2000 average, andthe SOM1 frequency. (The former time series isused as an indicator of the response to GHGforcing.) At time scales longer than 7 years (lowpass), the upper limit of the El Niño–SouthernOscillation (ENSO) time scale, these time seriesare correlated at –0.52, whereas for shorter timescales (raw minus low pass; simply “high pass”
hereafter), their correlation is 0.50. Both correla-tions are significant (P < 0.05). The high-passSOM1 frequency and global mean temperatureare correlated with the Niño 3.4 index (Fig. 3B)at values of 0.75 and 0.64, respectively, indi-cating that the positive correlation between thehigh-pass SOM1 frequency and global meantemperature is likely due to the driving of bothquantities by ENSO. Indeed, as indicated by theblue lines in Fig. 2, ENSO influences the SOM1frequency, whereas its impact is negligible forthe remaining SOMs.
How do we then interpret the negative cor-relation at the low frequencies? We suggest thatthe answer lies in the fact that GHG driving notonly increases the global mean temperature, italso causes a La Niña–like trend in tropical seasurface temperature (20, 21) and convection(22), with both variables exhibiting an increaseover Indonesia and a decrease over the centraltropical Pacific. This is supported by SOM1 ex-hibiting both a downward decadal trend in itsfrequency of occurrence (Fig. 2) and on intra-seasonal time scales by its being associated with
80
60
40
20
0
Fig. 2. The SOM patterns of the DJF zonal-mean zonal wind for a (4 × 1)grid. The left column shows the SOM patterns, the middle column is the1979 to 2008 trend for each SOM, and the right column shows the fre-quency time series (solid black line) shown as the number of days for eachDJF season. The solid contours in the first two columns show the clima-tological zonal-mean zonal wind. In the third column, the solid blue lines
are ENSO-removed frequency time series. The dashed black (blue) lines arethe least square linear fit of the frequency (ENSO-removed frequency) timeseries. If the linear fit is statistically significant (P < 0.05) based on a Student’st test, the dashed black line is replaced by a dashed red line. The color baris for the first column. The scale for the second column is shown in the colorbar of Fig. 1.
www.sciencemag.org SCIENCE VOL 339 1 FEBRUARY 2013 565
REPORTS
on
Janu
ary
31, 2
013
ww
w.s
cien
cem
ag.o
rgD
ownl
oade
d fr
om

an El Niño–like outgoing long-wave radiation(OLR; a proxy of tropical convection intensity)anomaly pattern (fig. S4a) that is opposite insign to that for La Niña. [If the OLR compositeis confined to ENSO neutral years, the La Niña–like convection anomalies remain intact, exceptin the eastern Pacific (fig. S4b).] The trend intropical OLR associated with the SOM patternsis dominated by SOM1, and consistently the 1979to 2008 OLR trend exhibits a La Niña–like OLRstructure (fig. S5). This connection between theLa Niña–like convection and the poleward jetshift is consistent with previous studies (23, 24).
The SOM3 frequency is not correlated withthe global mean temperature and is instead sig-
nificantly correlated at –0.45 (P < 0.05) with aNovember Antarctic ozone index, which we de-fine as the integrated total column ozone anomaly(from ERA-Interim data) poleward of 75°S (witharea weighting), where the reference state forthe anomaly is the 1979 to 2008 DJF mean totalcolumn ozone. (The SOM1 frequency is uncor-related with the ozone index.) To facilitate com-parison with the SOM3 frequency, we plottedthe ozone index with its sign reversed (Fig. 3C).Moreover, the SOM3 frequency time series close-ly resembles the yearly time series of the calen-dar date of the stratospheric final warming (25),whose trend toward later dates is attributed toozone depletion. The final warming occurs most-
ly during December. Consistently, we found thatfor this month SOM3 occurs most frequently andits trend is positive. A separate SOM analysisfor each of the three months, which yields similarpatterns, also found that the frequency time seriesfor SOM3-like patterns exhibits the highest cor-relations with the Antarctic ozone index duringDecember. In contrast, the correlations betweenSOM1-like frequency series and the global meantemperature were found to be largest during Jan-uary and February, indicating that the influenceof GHG is strongest during the late summer.
The composite temperature structure providesfurther support for these relationships between theSOM patterns and the external forcings (Fig. 4).
A B
CFig. 3. (A) Raw (thin solid lines) and low-pass (thick dashed lines) SOM1frequency (blue) and global mean temperature (red) time series. (B) Raw-minus-low-pass SOM1 frequency (blue line), global mean temperature (red line),and the Niño 3.4 index (×0.1; black dashed line) where values greater than0.5 (0.05 in this graph) indicate El Niño conditions and less than –0.5 (–0.05 inthis graph) indicate La Niña conditions. (C) November Antarctic (poleward of75°S) total ozone column anomaly multiplied by −1 × 10³ (red line), SOM3 fre-quency (solid blue line), and ENSO-removed SOM3 frequency (dashed blue line).
A B
Fig. 4. Time-averaged (lag –10 days to +10 days) composite zonal-mean tem-perature based on (A) SOM1 and (B) SOM3. The dots indicate statistical signif-icance (P < 0.05) based on a Student’s t test. For SOM1, the days are chosen only
from ENSO neutral years. Because of the negative SOM1 frequency trend, mul-tiplication of the SOM1 composites by −1 yields the canonical GHG-inducedpattern of widespread stratospheric cooling and tropospheric warming.
1 FEBRUARY 2013 VOL 339 SCIENCE www.sciencemag.org566
REPORTS
on
Janu
ary
31, 2
013
ww
w.s
cien
cem
ag.o
rgD
ownl
oade
d fr
om

The SOM1 composite, which is confined to ENSOneutral years (supplementary text; to isolate theinfluence of non-ENSO processes), shows that inthe tropics and mid-latitudes there is widespreadwarming in the stratosphere and cooling in thetroposphere. Because the decadal SOM1 frequencytrend is negative, this spatial structure indicatesthat the long-term temperature trend associatedwith SOM1 is stratospheric cooling and tropo-spheric warming. This is indeed consistent withthe canonical temperature response to an increasedatmospheric loading of GHG. The GHG-inducedpolar stratospheric temperature changes also matchwith the findings of modeling studies (26) (supple-mentary text). For SOM3, there is cooling in theAntarctic lower stratosphere, which is consistentwith ozone depletion. All of the above evidencecollectively suggests that SOM1 is driven byGHG, whereas SOM3 is driven by ozone.
Although a number of different theories forthe jet shift have been proposed (27–30), themechanism is still a subject of debate because itis difficult to tease apart the proposed causal-ities. The finding here that the trends are realizedthrough fundamentally short time processes pro-vides an avenue to test the theories in the future.One mechanism that has received limited atten-tion is the impact of tropical convection on thepoleward jet shift. Such a mechanism is appeal-ing because it would link two robust trends seenin climate models: (i) intensification of tropicalprecipitation minus evaporation (hence tropicalconvection) and (ii) a positive SAM trend (pole-ward jet shift). Indeed, the SOM1 zonal windanomalies are established about 10 days after theEl Niño–like convection strengthens (figs. S4Band S6), and we found evidence that this connec-tion involves convectively excited Rossby waves.The remaining three SOM patterns are also asso-
ciated with significant (P < 0.05) tropical con-vection anomalies reminiscent of the eastward-propagating convective complex in the tropicsknown as the Madden-Julian Oscillation. How-ever, a more detailed description of the role ofthe convection will be reported elsewhere, as doingso is beyond the scope of this report.
The zonal wind evolution (fig. S6) indicatesthat from lag –5 to lag +5 days SOM1 is accom-panied by significant zonal wind anomalies withfeatures close to being symmetric about the equa-tor, particularly within the tropics and subtropics.This quasi-hemispheric symmetry further suggeststhat tropical convection plays an important rolefor enabling GHG forcing to influence the mid-latitude jets. For SOM3, extratropical anomalies arefirst established by lag –15 days. The signal ex-tends into the tropical troposphere by the lag-0 day,and 5 days later it reaches the Arctic troposphereand stratosphere. This picture of a tropical conduithelps to explain the fact that the model responses toAntarctic ozone depletion also produce a substantialresponse in the Northern Hemisphere (19).
This study shows evidence that the atmo-spheric response to GHG and stratospheric ozonechanges can be distinguished by applying clus-ter analysis to daily data.We found that the ozoneforcing had a greater effect on the jet shift, sup-porting the modeling results (9, 10). Moreover,this method allows us to estimate the trendscaused by each of the forcings. Given the debateover the uncertainly in the ozone recovery (31),we make estimates of the year 2040 1000-hPazonal-mean zonal wind for the following twolimiting scenarios: the first based on the assump-tion that the ozone concentration will remain atits current value (scenario 1) and the secondbased on the assumption that the ozone will re-cover by 2040 (32) (scenario 2). In both scenarios,
we assume that the GHG-driven zonal wind trendwill remain at its 1979 to 2008 value. As Table 2shows, the greatest fractional changes occur be-tween 60° and 67.5°S. At 65°S, close to the coast-line of Antarctica where the wind stress changecan have a great impact on coastal upwelling,the wind speed would increase by 126% underscenario 1, whereas under scenario 2, the windspeed would decrease to almost zero.
References and Notes1. J. W. Kidson, J. Clim. 12, 2808 (1999).2. D. W. J. Thompson, J. M. Wallace, G. C. Hegerl, J. Clim.
13, 1018 (2000).3. G. J. Marshall, J. Clim. 16, 4134 (2003).4. J. R. Toggweiler, J. L. Russell, S. R. Carson, Paleoceanography
21, PA2005 (2006).5. R. F. Anderson et al., Science 323, 1443 (2009).6. M. Tedesco, A. J. Monaghan, Geophys. Res. Lett. 36,
L18502 (2009).7. V. Limpasuvan, D. L. Hartmann, Geophys. Res. Lett. 26,
3133 (1999).8. P. J. Kushner, I. M. Held, T. L. Delworth, J. Clim. 14, 2238
(2001).9. J. M. Arblaster, G. A. Meehl, J. Clim. 19, 2896 (2006).
10. L. M. Polvani, D. W. Waugh, G. J. P. Correa, S.-W. Son,J. Clim. 24, 795 (2011).
11. C. Franzke, S. B. Feldstein, J. Atmos. Sci. 62, 3250 (2005).12. N. C. Johnson, S. B. Feldstein, B. Tremblay, J. Clim. 21,
6354 (2008).13. T. Kohonen, Self-Organizing Maps: Information Science
(Springer, Berlin, 2001).14. B. C. Dee et al., Q. J. R. Meteorol. Soc. 137, 553 (2011).15. Materials and methods are available as supplementary
materials on Science Online.16. M. E. Higgins, J. J. Cassano, J. Geophys. Res. 114,
D16107 (2009).17. D. J. Lorenz, E. T. DeWeaver, J. Geophys. Res. 112,
D10119 (2007).18. A. Y. Karpechko, N. P. Gillett, L. J. Gray, M. Dall'Amico,
J. Geophys. Res. 115, D22117 (2010).19. S. M. Kang, L. M. Polvani, J. C. Fyfe, M. Sigmond, Science
332, 951 (2011); 10.1126/science.1202131.20. A. C. Clement, R. Seager, M. A. Cane, S. E. Zebiak,
J. Clim. 9, 2190 (1996).21. M. A. Cane et al., Science 275, 957 (1997).22. S. Lee, T. Gong, N. Johnson, S. B. Feldstein, D. Pollard,
J. Clim. 24, 4350 (2011).23. M. L. L'Heureux, D. W. J. Thompson, J. Clim. 19, 276
(2006).24. T. Gong, S. B. Feldstein, D. Luo, J. Atmos. Sci. 67, 2854
(2010).25. R. X. Black, B. A. McDaniel, J. Atmos. Sci. 64, 2968 (2007).26. B. Grassi, G. Redaelli, G. Visconti, Geophys. Res. Lett. 33,
L23704 (2005).27. W. A. Robinson, J. Clim. 10, 176 (1997).28. L. M. Polvani, P. J. Kushner, Geophys. Res. Lett. 29, 1114
(2002).29. S.-W. Son, S. Lee, J. Atmos. Sci. 62, 3741 (2005).30. G. Chen, I. M. Held, Geophys. Res. Lett. 34, L21805
(2007).31. E. C. Weatherhead, S. B. Andersen, Nature 441, 39 (2006).32. A. Tabazadeh, E. Cordero, Atmos. Environ. 38, 647 (2004).
Acknowledgments: This research was supported by NSF grantsAGS-1036858 and AGS-1139970. The authors acknowledgeN. Johnson for providing the Matlab codes used for the SOManalysis and two anonymous reviewers for their helpfulsuggestions and comments.
Supplementary Materialswww.sciencemag.org/cgi/content/full/339/6119/563/DC1Materials and MethodsFigs. S1 to S6References (33, 34)24 May 2012; accepted 27 November 201210.1126/science.1225154
Table 2. Projected 1000-hPa zonal-mean zonal wind changes (relative to 1979 to 2008 climatologicalvalues) in the year 2040, based on two scenarios: the Antarctic ozone concentration remaining at thecurrent level (scenario 1); the ozone concentration recovering to the pre-1980 value (scenario 2). In bothscenarios, it is assumed that the rate of zonal wind change caused by the GHG increase remains at its 1979to 2008 value.
Latitude (°S) Scenario 1 (m/s) Scenario 2 (m/s) Climatology (m/s)30.0 –0.13 –0.04 –2.3932.5 –0.17 0.01 –1.2935.0 –0.21 0.07 0.1337.5 –0.22 0.12 2.0240.0 –0.20 0.15 3.8542.5 –0.14 0.15 5.4245.0 –0.06 0.14 6.6847.5 0.05 0.11 7.4050.0 0.17 0.06 7.6452.5 0.27 –0.01 7.4255.0 0.37 –0.08 6.7357.5 0.44 –0.15 5.6560.0 0.47 –0.23 4.0762.5 0.44 –0.27 2.2065.0 0.33 –0.23 0.2667.5 0.18 –0.15 –1.5570.0 0.08 –0.09 –2.31
www.sciencemag.org SCIENCE VOL 339 1 FEBRUARY 2013 567
REPORTS
on
Janu
ary
31, 2
013
ww
w.s
cien
cem
ag.o
rgD
ownl
oade
d fr
om

Uncovering the ProteinTranslocon at the ChloroplastInner Envelope MembraneShingo Kikuchi,1 Jocelyn Bédard,1* Minako Hirano,2 Yoshino Hirabayashi,1 Maya Oishi,1Midori Imai,1† Mai Takase,1 Toru Ide,2 Masato Nakai1‡
Chloroplasts require protein translocons at the outer and inner envelope membranes, termedTOC and TIC, respectively, to import thousands of cytoplasmically synthesized preproteins. However,the molecular identity of the TIC translocon remains controversial. Tic20 forms a 1-megadaltoncomplex at the inner membrane and directly interacts with translocating preproteins. We purified the1-megadalton complex from Arabidopsis, comprising Tic20 and three other essential components, oneof which is encoded by the enigmatic open reading frame ycf1 in the chloroplast genome. All fourcomponents, together with well-known TOC components, were found stoichiometrically associated withdifferent translocating preproteins. When reconstituted into planar lipid bilayers, the purified complexformed a preprotein-sensitive channel. Thus, this complex constitutes a general TIC translocon.
Translocation of nuclear-encoded prepro-teins across the double envelope mem-branes of chloroplasts is mediated by two
protein translocons, the TOC and TIC complexes(1–5). Tic20, an integral inner membrane proteinwith four predicted transmembrane helices, hasbeen proposed to form part of a general protein-conducting channel (6, 7). Recombinant Tic20has further been reported to have the capacity toform a channel (8). A 1-megadalton (MD) trans-location intermediate complex has been recentlyidentified at the inner membrane, in which Tic20is in close contact with a translocating preprotein(9). Whereas Tic20 forms a stable 1-MD complexin the inner membrane, Tic21 interacts only weak-ly with the complex, and other known Tic pro-teins such as Tic110 and Tic40 are not involvedin the complex (9). Thus, detailed organization ofthis 1-MD complex has remained elusive.
Here, we generated transgenic Arabidopsisplants expressing a protein A–tagged Tic20-I (themajor Tic20 isoform in Arabidopsis), and the taggedTic20-I–containing complexes were purified (fig.S1). Three proteins with molecular masses of 214,100, and 56 kD were specifically copurified withTic20-I, which were confirmed to form a stable1-MD complex together with Tic20-I (Fig. 1A).Subsequent mass spectrometric analysis revealedthree previously uncharacterized Arabidopsis pro-teins (fig. S2A).
Surprisingly, the 214-kD protein, AtCg01130,is encoded by the previously enigmatic chloro-plast gene ycf1 (hypothetical chloroplast open
reading frame 1) (10–12). The deduced protein,here renamed Tic214, is 1786 amino acids inlength with a calculated relative molecular massMr of 213,742 and is predicted to contain sixN-terminal transmembrane domains (figs. S2Band S3). The 100-kD protein, At5g22640, is anuclear-encoded protein of 871 amino acids with
a calculated Mr of 99,954 (fig. S4). This proteinlikely has no cleavable transit peptide (fig. S2A)and thus was named Tic100. The 56-kD protein,At5g01590, is also a nuclear-encoded protein of527 amino acids with a calculated Mr of 61,625(fig. S5). This protein is most likely synthesizedas a preprotein and processed to form a matureprotein upon import (fig. S6A) and thus wasdesignated Tic56. Tic100 and Tic56 are highlyconserved among most land plants, but show noremarkable overall sequence similarity to any pro-teins of known function and have no predictedtransmembrane segment.
In wild-type chloroplasts, Tic214, Tic100,Tic56, and Tic20-I appeared to form stable 1-MDTIC complexes (Fig. 1, B and C, and fig. S6, Band C), which were shown to associate with pre-proteins (fig. S7). If we assume that the stoichiom-etry of the components in the 1-MD complexis 1:1:1:1 (fig. S8), we would expect that thecomplex represents a trimeric assembly of Tic214,Tic100, Tic56, and Tic20-I (1170 kD). The stoi-chiometry of Tic20-I:Toc75 (the channel proteinof the TOC complex) in the envelope membraneswas roughly estimated to be 1:2.5 (fig. S8). Tic20-Iand Tic214 likely constitute the membrane-integralpart of the 1-MD TIC complex; Tic20-I is entirelyburied in the core of the complex, whereas Tic214
1Laboratory of Regulation of Biological Reactions, Institutefor Protein Research, Osaka University, 3-2 Yamadaoka, Suita,Osaka 565-0871, Japan. 2Graduate School for the Creationof New Photonics Industries, 1955-1 Kurematsu Nishi-ku,Hamamatsu, Shizuoka 431-1202, Japan.
*Present address: Department of Biology, University ofLeicester, Leicester LE1 7RH, UK.†Present address: Department of Plastic Surgery, Kobe Uni-versity Graduate School of Medicine, Kobe, Japan.‡To whom correspondence should be addressed. E-mail:[email protected]
Fig. 1. The 1-MD complex is composed of Tic20-I and three other Tic proteins. (A) Tic214, Tic100, and Tic56were copurified with protein A–tagged Tic20-I (PA2-Tic20-I). The purified fraction was separated by two-dimensional blue native (2D-BN) SDS-PAGE followed by silver staining. Tic20-I*, tobacco etch virus (TEV)protease–cleaved PA2-Tic20-I. (B) Wild-type Arabidopsis chloroplasts were solubilized with 1% digitonin inthe presence of 1 M NaCl and then separated by 2D-BN SDS-PAGE followed by immunoblotting. (C) Co-immunoprecipitation of the 1-MD TIC complex components. (D and E) The localization and topology of thedifferent TIC complex components were analyzed by alkaline (D) and protease (E) treatment. (D) Chloroplastswere treated with either 10 mM HEPES-KOH, pH 7.5 (hypotonic lysis), or 100 mM Na2CO3 on ice for 30 min,followed by centrifugation to obtain supernatant (S) and membrane pellet (P) fractions. (E) Inverted innerenvelope membrane vesicles (26) were treated with or without thermolysin (T-lysin; 100 mg/ml) and with orwithout Triton X-100 [TX-100; 0.1% (w/v)] on ice for the indicated time periods.
www.sciencemag.org SCIENCE VOL 339 1 FEBRUARY 2013 571
REPORTS
on
Janu
ary
31, 2
013
ww
w.s
cien
cem
ag.o
rgD
ownl
oade
d fr
om

is exposed to both sides of the inner membrane(Fig. 1, D and E, and fig. S6D). Tic100 is asso-ciated peripherally in the complex at the inter-membrane space side, whereas Tic56 is mostlyembedded in the complex.
In a search for evidence of direct involvementof the 1-MD TIC complex as a general proteintranslocation machinery at the inner membrane,we used purified model preproteins in importexperiments in vitro to isolate translocationintermediate–associated proteins from Arabi-dopsis chloroplasts (Fig. 2 and fig. S9) (13–15).Almost all major isolated proteins could be as-signed to either the well-known TOC compo-
nents (including Toc159, Toc75, and Toc33) orthe 1-MD TIC complex components (includingTic214, Tic100, Tic56, and Tic20-I) (Fig. 2). As-sociation of these TOC and TIC components withpreproteins absolutely required adenosine tri-phosphate (ATP) in the import reactions thatcould drive preprotein translocation across theenvelope membranes (fig. S9B). Tic214, Tic100,Tic56, and Tic20-I were purified at levels com-parable to those of TOC components and pre-proteins (Fig. 2 and fig. S9B). Two different modelpreproteins, pSTEVand pFdTEV, resulted in es-sentially similar profiles of associated proteins(Fig. 2), which supports the direct involvement of
the 1-MD TIC complex in protein translocationas a general import machinery in concert with thewell-established TOC complex.
By contrast, we observed hardly any specificassociation of Tic110 or Tic40 with the translo-cation intermediate complexes (Fig. 2 and fig.S9B). This is surprising because Tic110, an abun-dant inner membrane protein, was initially iden-tified by a similar method (15) and has long beenconsidered to be a central player (5), together withTic40, in preprotein translocation across the innermembrane (16). The migration of Tic110 uponSDS–polyacrylamide gel electrophoresis (PAGE)was almost the same as that of Tic100. However,
Fig. 2. Association of the 1-MD TIC complex compo-nents with two distinct model preproteins. Arabidopsischloroplasts were incubated with 100 nM urea-denaturedprotein A–tagged preproteins pSTEV or pFdTEV in thepresence of 0.5 mM ATP for 10 min at 25°C. As a control,incubation without preprotein (–) was also performed.Reisolated chloroplasts were directly solubilized with1% digitonin, and insoluble material was removed byultracentrifugation. The resulting supernatant was incu-bated with immunoglobulin G–sepharose for 2 hours at4°C. After the beads were washed thoroughly, bound pro-tein complexes were eluted under nondenaturing conditionsby TEV cleavage. The denatured samples were separatedby 12.5% SDS-PAGE followed by silver staining (left) orimmunoblotting (right). ENV, Arabidopsis mixed envelopefraction; TIC, the 1-MD TIC complex purified from PA2-Tic20-I plants; *1, unidentified protein currently under in-vestigation; *2, unknown contaminating protein; AcTEV,TEV protease; pFd and pS, TEV-cleaved preproteins; Tic20-I*,TEV-cleaved PA2-Tic20-I.
Fig. 3. Characterization of tic100 and tic56 Arabidopsisknockout mutants. (A) Schematic representation of thegenes encoding Tic100 and Tic56. Triangles, T-DNA inser-tions; solid boxes, exons; thin lines, introns; shaded boxes,untranslated regions. (B) Visible phenotypes of varioustic and toc mutants (16, 19–22, 27) grown on sucrose-containing media for 3 weeks. Scale bars, 5 mm. (C) Totalproteins were extracted from 3-week-old wild-type Arabi-dopsis and from homozygous albino tic100-1, tic56-1, andtic20-I mutants; 24 mg of total protein was subjected toSDS-PAGE and immunoblotting. Hsp93 and Hsp70,stromal molecular chaperones; LHCP, light-harvestingchlorophyll-binding protein; OE33, 33-kD protein of theoxygen-evolving complex of photosystem II. (D) Doubleand single knockouts were identified in the progeny derivedfrom a +/tic20-I +/tic100-1 heterozygous plant (left) andfrom a +/tic20-I +/tic56-1 heterozygous plant (right). Scalebars, 1 cm.
1 FEBRUARY 2013 VOL 339 SCIENCE www.sciencemag.org572
REPORTS
on
Janu
ary
31, 2
013
ww
w.s
cien
cem
ag.o
rgD
ownl
oade
d fr
om
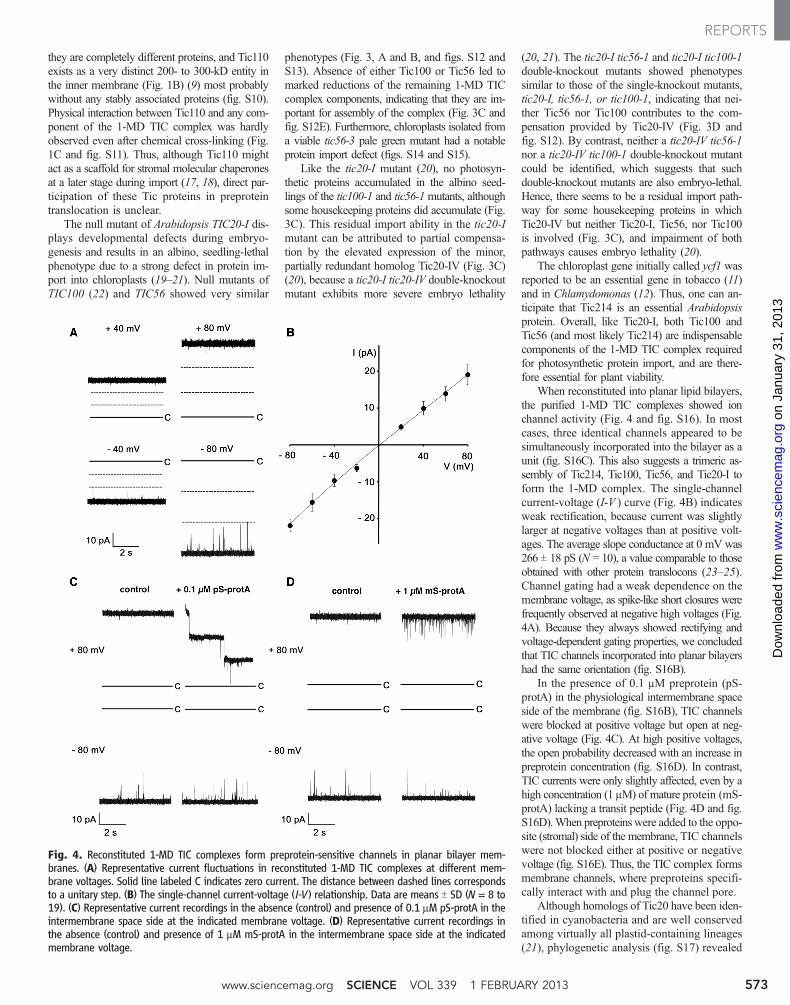
they are completely different proteins, and Tic110exists as a very distinct 200- to 300-kD entity inthe inner membrane (Fig. 1B) (9) most probablywithout any stably associated proteins (fig. S10).Physical interaction between Tic110 and any com-ponent of the 1-MD TIC complex was hardlyobserved even after chemical cross-linking (Fig.1C and fig. S11). Thus, although Tic110 mightact as a scaffold for stromal molecular chaperonesat a later stage during import (17, 18), direct par-ticipation of these Tic proteins in preproteintranslocation is unclear.
The null mutant of Arabidopsis TIC20-I dis-plays developmental defects during embryo-genesis and results in an albino, seedling-lethalphenotype due to a strong defect in protein im-port into chloroplasts (19–21). Null mutants ofTIC100 (22) and TIC56 showed very similar
phenotypes (Fig. 3, A and B, and figs. S12 andS13). Absence of either Tic100 or Tic56 led tomarked reductions of the remaining 1-MD TICcomplex components, indicating that they are im-portant for assembly of the complex (Fig. 3C andfig. S12E). Furthermore, chloroplasts isolated froma viable tic56-3 pale green mutant had a notableprotein import defect (figs. S14 and S15).
Like the tic20-I mutant (20), no photosyn-thetic proteins accumulated in the albino seed-lings of the tic100-1 and tic56-1mutants, althoughsome housekeeping proteins did accumulate (Fig.3C). This residual import ability in the tic20-Imutant can be attributed to partial compensa-tion by the elevated expression of the minor,partially redundant homolog Tic20-IV (Fig. 3C)(20), because a tic20-I tic20-IV double-knockoutmutant exhibits more severe embryo lethality
(20, 21). The tic20-I tic56-1 and tic20-I tic100-1double-knockout mutants showed phenotypessimilar to those of the single-knockout mutants,tic20-I, tic56-1, or tic100-1, indicating that nei-ther Tic56 nor Tic100 contributes to the com-pensation provided by Tic20-IV (Fig. 3D andfig. S12). By contrast, neither a tic20-IV tic56-1nor a tic20-IV tic100-1 double-knockout mutantcould be identified, which suggests that suchdouble-knockout mutants are also embryo-lethal.Hence, there seems to be a residual import path-way for some housekeeping proteins in whichTic20-IV but neither Tic20-I, Tic56, nor Tic100is involved (Fig. 3C), and impairment of bothpathways causes embryo lethality (20).
The chloroplast gene initially called ycf1 wasreported to be an essential gene in tobacco (11)and in Chlamydomonas (12). Thus, one can an-ticipate that Tic214 is an essential Arabidopsisprotein. Overall, like Tic20-I, both Tic100 andTic56 (and most likely Tic214) are indispensablecomponents of the 1-MD TIC complex requiredfor photosynthetic protein import, and are there-fore essential for plant viability.
When reconstituted into planar lipid bilayers,the purified 1-MD TIC complexes showed ionchannel activity (Fig. 4 and fig. S16). In mostcases, three identical channels appeared to besimultaneously incorporated into the bilayer as aunit (fig. S16C). This also suggests a trimeric as-sembly of Tic214, Tic100, Tic56, and Tic20-I toform the 1-MD complex. The single-channelcurrent-voltage (I-V ) curve (Fig. 4B) indicatesweak rectification, because current was slightlylarger at negative voltages than at positive volt-ages. The average slope conductance at 0 mV was266 T 18 pS (N = 10), a value comparable to thoseobtained with other protein translocons (23–25).Channel gating had a weak dependence on themembrane voltage, as spike-like short closures werefrequently observed at negative high voltages (Fig.4A). Because they always showed rectifying andvoltage-dependent gating properties, we concludedthat TIC channels incorporated into planar bilayershad the same orientation (fig. S16B).
In the presence of 0.1 mM preprotein (pS-protA) in the physiological intermembrane spaceside of the membrane (fig. S16B), TIC channelswere blocked at positive voltage but open at neg-ative voltage (Fig. 4C). At high positive voltages,the open probability decreased with an increase inpreprotein concentration (fig. S16D). In contrast,TIC currents were only slightly affected, even by ahigh concentration (1 mM) of mature protein (mS-protA) lacking a transit peptide (Fig. 4D and fig.S16D).When preproteinswere added to the oppo-site (stromal) side of the membrane, TIC channelswere not blocked either at positive or negativevoltage (fig. S16E). Thus, the TIC complex formsmembrane channels, where preproteins specifi-cally interact with and plug the channel pore.
Although homologs of Tic20 have been iden-tified in cyanobacteria and are well conservedamong virtually all plastid-containing lineages(21), phylogenetic analysis (fig. S17) revealed
Fig. 4. Reconstituted 1-MD TIC complexes form preprotein-sensitive channels in planar bilayer mem-branes. (A) Representative current fluctuations in reconstituted 1-MD TIC complexes at different mem-brane voltages. Solid line labeled C indicates zero current. The distance between dashed lines correspondsto a unitary step. (B) The single-channel current-voltage (I-V) relationship. Data are means T SD (N = 8 to19). (C) Representative current recordings in the absence (control) and presence of 0.1 mM pS-protA in theintermembrane space side at the indicated membrane voltage. (D) Representative current recordings inthe absence (control) and presence of 1 mM mS-protA in the intermembrane space side at the indicatedmembrane voltage.
www.sciencemag.org SCIENCE VOL 339 1 FEBRUARY 2013 573
REPORTS
on
Janu
ary
31, 2
013
ww
w.s
cien
cem
ag.o
rgD
ownl
oade
d fr
om

no direct homologs for Tic214, Tic100, or Tic56in extant cyanobacteria, Glaucophyta, or Rho-dophyta, indicating that this TIC transport systemevolved largely after the initial endosymbiotic event.Thus, the chloroplast inner membrane protein trans-locon that we describe here has changed markedlyduring evolution through modifications of bothnuclear and chloroplast genomes.
References and Notes1. K. Cline, C. Dabney-Smith, Curr. Opin. Plant Biol. 11,
585 (2008).2. P. Jarvis, New Phytol. 179, 257 (2008).3. F. Kessler, D. J. Schnell, Curr. Opin. Cell Biol. 21, 494 (2009).4. H. M. Li, C.-C. Chiu, Annu. Rev. Plant Biol. 61, 157 (2010).5. S. Schwenkert, J. Soll, B. Bölter, Biochim. Biophys. Acta
1808, 901 (2011).6. A. Kouranov, X. Chen, B. Fuks, D. J. Schnell, J. Cell Biol.
143, 991 (1998).7. X. Chen, M. D. Smith, L. Fitzpatrick, D. J. Schnell,
Plant Cell 14, 641 (2002).8. E. Kovács-Bogdán, J. P. Benz, J. Soll, B. Bölter,
BMC Plant Biol. 11, 133 (2011).9. S. Kikuchi et al., Plant Cell 21, 1781 (2009).
10. S. Sato, Y. Nakamura, T. Kaneko, E. Asamizu, S. Tabata,DNA Res. 6, 283 (1999).
11. A. Drescher, S. Ruf, T. J. Calsa Jr., H. Carrer, R. Bock,Plant J. 22, 97 (2000).
12. E. Boudreau et al., Mol. Gen. Genet. 253, 649(1997).
13. D. J. Schnell, F. Kessler, G. Blobel, Science 266, 1007(1994).
14. F. Kessler, G. Blobel, H. A. Patel, D. J. Schnell, Science266, 1035 (1994).
15. F. Kessler, G. Blobel, Proc. Natl. Acad. Sci. U.S.A. 93,7684 (1996).
16. M.-L. Chou et al., EMBO J. 22, 2970 (2003).17. T. Inaba, M. Li, M. Alvarez-Huerta, F. Kessler, D. J. Schnell,
J. Biol. Chem. 278, 38617 (2003).18. M.-L. Chou, C.-C. Chu, L.-J. Chen, M. Akita, H. M. Li,
J. Cell Biol. 175, 893 (2006).19. Y.-S. Teng et al., Plant Cell 18, 2247 (2006).20. Y. Hirabayashi, S. Kikuchi, M. Oishi, M. Nakai,
Plant Cell Physiol. 52, 469 (2011).21. A. R. Kasmati, M. Töpel, R. Patel, G. Murtaza, P. Jarvis,
Plant J. 66, 877 (2011).22. Q. Liang et al., Physiol. Plant. 140, 380 (2010).23. K. Hill et al., Nature 395, 516 (1998).24. K. N. Truscott et al., Nat. Struct. Biol. 8, 1074
(2001).25. P. Kovermann et al., Mol. Cell 9, 363 (2002).26. D. T. Jackson, J. E. Froehlich, K. Keegstra, J. Biol. Chem.
273, 16583 (1998).27. J. Bauer et al., Nature 403, 203 (2000).
Acknowledgments: We thank K. Iwasaki, N. Miyazaki,S. Thompson, T. Takao, C. Awada, H. Mori, and J. Mima forhelpful suggestions and valuable discussions; P. Jarvis,D. Schnell, and I. Nishimura for vectors; the ArabidopsisBiological Resource Center, Institut National de la RechercheAgronomique, and Cold Spring Harbor Laboratory for theT-DNA lines; and RIKEN Bioresource Center for the full-lengthcDNAs. Supported by grants-in-aid for scientific researchfrom the Ministry of Education, Culture, Sports, Science andTechnology, Japan (20059022, 22020024, 24117511, and24657073, M.N.; 21107518 and 22370059, T.I.; 23770190and 23113519, M.H.) and by a Japan Society for thePromotion of Science postdoctoral fellowship for foreignresearchers ( J.B.). S.K., J.B., Y.H., M.O., M.I., M.T., and M.N.performed biochemical and genetic analyses; M.H. and T.I.performed electrophysiological analyses; M.N. conceived andsupervised the whole project and wrote the paper.
Supplementary Materialswww.sciencemag.org/cgi/content/full/339/6119/571/DC1Materials and MethodsFigs. S1 to S17Table S1References (28–48)
24 August 2012; accepted 30 November 201210.1126/science.1229262
Emergent Sensing of ComplexEnvironments by MobileAnimal GroupsAndrew Berdahl,1*† Colin J. Torney,1* Christos C. Ioannou,1,2 Jolyon J. Faria,1 Iain D. Couzin1†
The capacity for groups to exhibit collective intelligence is an often-cited advantage of groupliving. Previous studies have shown that social organisms frequently benefit from pooling imperfectindividual estimates. However, in principle, collective intelligence may also emerge frominteractions between individuals, rather than from the enhancement of personal estimates. Here,we reveal that this emergent problem solving is the predominant mechanism by which amobile animal group responds to complex environmental gradients. Robust collective sensingarises at the group level from individuals modulating their speed in response to local, scalar,measurements of light and through social interaction with others. This distributed sensing requiresonly rudimentary cognition and thus could be widespread across biological taxa, in addition tobeing appropriate and cost-effective for robotic agents.
Research on collective intelligence hasdemonstrated how organisms, includinghumans, can improve decision-making
accuracy by appropriately pooling individualestimates (1–8). In the earliest study, in 1907,Sir Francis Galton made a near-perfect estimateof the weight of an ox by using 787 guesses madeby others (9). Pooling of information is not exclu-sive to the human domain; for example, it has alsobeen suggested that aggregating imperfect esti-
mates may help organisms, or cells, navigate weakor noisy environmental gradients (2–5). If eachindividual makes an error-prone estimate of thelocal gradient, it may benefit by also basing itsmovement decisions on the direction of motion ofothers, termed the “many wrongs” hypothesis (3).
Despite the importance of collective sensingto the ecology of many social species (10, 11)and the value to bio-inspired technological ap-plications [such as particle swarm optimization(12), or swarm robotics (13)], with the excep-tion of the social insects (8), we do not know howgrouping enhances sensing capabilities in animalgroups. Here, we use an integrated experimentaland theoretical approach to address this deficit.Weuse schooling fish (golden shiners, Notemigonuscrysoleucas) as our model experimental systemand take advantage of their natural preferencefor a shaded (darker) habitat (14). Thus, our ex-
periments do not require training and are notsusceptible to confounding factors relating tocompetition for, or consumption of, a preferredresource. Shiners school naturally in shallowwater (15) and remain highly cohesive (14), whichallowed us to explore the role of group size duringa gradient detection task.
Our experiments were conducted with juve-nile fish (body length 4.9 T 0.5 cm) in a shallowtank (213 cm by 122 cm, 8-cm water depth). Dy-namic light fields were projected onto the tank.These fields consisted of a circular patch that wasdarkest at its center and transitioned smoothly(as an exponential) to the brightest light levels.Noise was added to this gradient to generate localvariability in space and time. Furthermore, the cir-cular patch itself moved at a constant speed be-tween a series of randomly selected locationswithinthe tank. See (16) for further details. The task forthe fish was to track the preferred, darker regionsof this dynamic environment.
We investigated the performance of single fishand groups of 2, 4, 8, 16, 32, 64, 128, and 256individuals. Three levels of environmental noisewere employed. For the lowest value, the light fieldwas dominated by the simple circular patch; forthe highest level of noise, the field largely consistedof ephemeral, local peaks. Measured light levels atthe surface of the tank ranged from 4.2 lux (ap-proximately twilight) to 150 lux (overcast day),corresponding to their natural environment in themorning or evening. We stress, however, that lightis used as a proxy for any important environmentalcue (such as temperature or salinity), with the cir-cular patch representing large-scale features andthe noise recreating fine-scale structure.
Because golden shiners are highly cryptic whenin dark regions, the tank was lit with infrared light.The level of the projected light field, with respectto their positions, was then used to calculate a
1Department of Ecology and Evolutionary Biology, PrincetonUniversity, Princeton, NJ 08544, USA. 2School of BiologicalSciences, University of Bristol, Woodland Road, Bristol BS81UG, UK.
*These authors contributed equally to this work.†To whom correspondence should be addressed. E-mail:[email protected] (A.B.); [email protected](I.D.C.)
1 FEBRUARY 2013 VOL 339 SCIENCE www.sciencemag.org574
REPORTS
on
Janu
ary
31, 2
013
ww
w.s
cien
cem
ag.o
rgD
ownl
oade
d fr
om

performance metric, Y: the time-averaged dark-ness level at the locations of the fish. This wasnormalized by a null performance value suchthat Y = 1 in the absence of an environmentalresponse. The value of Y increases above unityas performance increases, up to a theoretical max-imum of Ymax = 3.2 T 0.5 (16).
The level of performance,Y, increased greatlyas a function of group size (Fig. 1B). The value ofY was marginally above 1 for the smallest groupsizes and for single fish; thus, fish always soughtdarker regions, regardless of group size. However,larger groups were significantly more effective atdoing so [c21 = 67, P = 3.3 × 10⁻¹⁶, linear mixed
model (LMM)]. Results were not dependent onthe level of noise in the projected light field (noisemain effect: c21 = 0.016, P = 0.97, noise × groupsize: c21 = 0, P = 1, LMM). The strategy is there-fore robust, as it is unaffected by the structure andcomplexity of the light field.
In order to investigate the mechanism under-lying the observed collective response to lightgradients, fish were tracked individually to obtaintrajectories (16). For all group sizes, we found astrong positive relation between individual speedand the light level at the location of that fish; fishtended to travel more slowly in dark regions andmore quickly in light regions, as shown in Fig. 2A.
Using the accelerations of each fish, we as-sessed the degree to which the motion of indi-viduals may be explained by environmental andsocial influences. On the basis of attraction toconspecifics, we estimated a social vector, Si, foreach individual, i, by taking into account thepositions of neighbors within a fixed distance.We used seven body lengths, or 34.3 cm, for thisdistance; however, results are not dependent onthe specific range (16). In addition, we measuredthe environmental vector,Gi, for each fish, whichpoints in the direction of steepest ascent in thedarkness level with a magnitude proportional tothe rate of increase (the gradient of the light fieldmeasured from the perspective of the focal fish).We then measured the actual response of individ-ual fish to these potential cues (Si andGi) as thecorrelation between the direction of these influencesand the direction of their acceleration (16).
The relation between the predicted influence(x axis) and the observed response ( y axis) to SiandGi, respectively, is shown in Fig. 2, B and C.Acceleration was muchmore strongly influencedby the location of conspecifics than by environ-mental gradients (Fig. 2, B and C). When themagnitude of the social vector was high (near-neighbors were located in a consistent directionfrom the focal individual), the social influencewas entirely dominant (Fig. 2B). Groups and sol-itary fish responded similarly to gradients (Fig.2C). The slight dip in the response of groups tovery high gradients can be attributed to the factthat such steep changes in light level are con-tributed predominantly by local, ephemeral noise(fig. S17), not by the longer-range feature to betracked.
Although there is an interdependence be-tween social and environmental effects, becauseof the increased likelihood of a fish being locatedin darker regions, these results show that the lo-cation of near-neighbors is a far better predictorof an individual’s motion than the direction of thenearest dark region. Thus, when making move-ment decisions, fish more strongly respond to so-cial cues than they do to the environment.
We isolate two complementary processes thatresult in effective gradient tracking by larger groups.
Fig. 1. (A) The positions of a group of32 fish as they negotiate the light field,superimposed on that field. Mediumnoise level (0.25) is shown. Note thatthe frame only includes a small regionof the larger tank. The snapshots are 2 sapart, with time increasing to the right.(B) Performance, Y, as a function ofgroup size. The data points show themean Y over experimental trials, andthe error bars show twice the standarderror. The solid blue line is the statisticalmodel's fit to the data, and the shadedregion is its 95% confidence interval.The red line is the equivalent perform-ance measure for a numerical schooling model that incorporates a simple speed-differential algorithm. The quantitative values of this curve are dependent onmodel parameters, but the qualitative trend is independent of implementation details (16).
Fig. 2. (A) Average speed as a function of locallight level (solid blue curve; 0 is darker, 1 isbrighter). Speeds are control-adjusted to ac-count for spatial effects induced by tank walls.The dashed red line is the median slope of thespeed-light relation when calculated at singlepoints in time across the group, averaged overgroup sizes 16 to 128 (slopes at instantaneoustime could not be calculated reliably for groupsizes of eight and below). (B) Individual responseto social and environmental cues as a function ofthe magnitude of the social vector, |S|. Solid anddashed lines show the correlation between the direction of acceleration and the direction of the socialvector and environmental vector, respectively. (C) Individual response to social and environmental cues asa function of the magnitude of the environmental vector, |G|. Legend as (B). Gray diamonds show solitaryfish and demonstrate that the response to the environmental vector is approximately the same forindividuals and those in groups. All shaded regions and error bars denote twice the standard error, data in(A) is down-sampled to remove any spatial correlations in speed and light level. See (16) for details andgroup sizes shown separately.
www.sciencemag.org SCIENCE VOL 339 1 FEBRUARY 2013 575
REPORTS
on
Janu
ary
31, 2
013
ww
w.s
cien
cem
ag.o
rgD
ownl
oade
d fr
om

To illustrate the first mechanism, consider a sce-nario where a polarized group is travelling per-pendicular to a gradient in light level. Individualswithin the group, if located on the brighter side ofthe environment, will travel more quickly. This,in conjunction with interindividual attraction, in-duces rotation and turning toward the darker re-gion. We find that, for a single instance in time,variation in speed among fish within a groupcorresponds to the variation in light level at theirlocations (Fig. 2A, dashed line). This speed dif-ferential across a group causes turning toward thosewho move more slowly (fig. S10). Second, as in-dividuals slow down, the distance between them isreduced (see fig. S14), which increases the localdensity of animals in darker regions. Social in-fluence results in acceleration tending to be inthis direction (Fig. 2B).
To demonstrate the generic nature of theseresults, we performed simulations of groupingindividuals (17, 18) that moderate their speedaccording to their local light level. Simulated in-dividuals move within the same light fields thatwere presented to the real fish, yet lack any ex-plicit gradient detection capacity. As in the ex-periments, greater group-level responsiveness tothe environment arises spontaneously as groupsize increases (Fig. 1B). Further, we show that,although increased group numbers reduce mea-surement error, the key determinant of perform-ance is the spatial extent of the group in relationto the length scale of the environment; groupsthat span a larger area are more likely to capturethe variation in cue required to elicit a speeddifferential across the group (16).
Motion toward darker regions (taxis), there-fore, results from social interactions among in-dividuals, each of whom exhibits a rudimentary,nondirectional response to their environment(kinesis). Thus, the collective dynamics create a
group-level responsiveness to the environment thatis absent at the individual level (19). The result-ing increase in gradient-tracking ability for largergroups agrees with previous hypotheses (20, 21)and could explain empirical studies showing thatgrouping facilitates the detection of chemical cues(22–24) and improves the accuracy of migrationsthat rely on such cues (25, 26).
The simple algorithm revealed here may allowgroups to respond to environmental gradients thatoccur over long length scales, for instance duringthe seasonal migration of fish tracking a singleisotherm (27). If the mechanism we observed hereis found to be widespread, as would be suggestedby its robust nature and ease of implementation (inevolutionary terms), there are important ramifica-tions for ecosystem conservation and manage-ment. Our results demonstrate that the ability torespond to environmental information may declineas populations are fragmented and average groupsizes decrease.
References and Notes1. A. W. Woolley, C. F. Chabris, A. Pentland, N. Hashmi,
T. W. Malone, Science 330, 686 (2010).2. D. Grünbaum, Evol. Ecol. 12, 503 (1998).3. A. M. Simons, Trends Ecol. Evol. 19, 453 (2004).4. E. A. Codling, J. W. Pitchford, S. D. Simpson, Ecology 88,
1864 (2007).5. P. A. Larkin, A. Walton, J. Fish. Res. Board Can. 26, 1372
(1969).6. C. W. Clark, M. Mangel, Theor. Popul. Biol. 30, 45 (1986).7. I. D. Couzin et al., Science 334, 1578 (2011).8. N. R. Franks, S. C. Pratt, E. B. Mallon, N. F. Britton,
D. J. Sumpter, Phil. Trans. R. Soc. B 357, 1567 (2002).9. F. Galton, Nature 75, 450 (1907).10. S. Bauer et al., in Animal Migration: A Synthesis,
E. J. Milner-Gulland, J. M. Fryxell, A. R. E. Sinclair, Eds.(Oxford Univ. Press, New York, 2011), pp. 68–87.
11. T. J. Pitcher, J. K. Parrish, Behaviour of Teleost Fishes(Springer, New York, 1993), vol. 2, pp. 369–439.
12. R. Poli, J. Kennedy, T. Blackwell, Swarm Intell. 1, 33 (2007).13. P. Ogren, E. Fiorelli, N. E. Leonard, IEEE Trans. Automat.
Contr. 49, 1292 (2004).
14. S. G. Reebs, Anim. Behav. 59, 403 (2000).15. D. J. Hall et al., J. Fish. Board Can. 36, 1029 (1979).16. Materials and methods are available as supplementary
materials on Science Online.17. I. D. Couzin, J. Krause, N. R. Franks, S. A. Levin, Nature
433, 513 (2005).18. M. Camperi, A. Cavagna, I. Giardina, G. Parisi, E. Silvestri,
Interface Focus 2, 715 (2012).19. C. J. Torney, Z. Neufeld, I. D. Couzin, Proc. Natl. Acad.
Sci. U.S.A. 106, 22055 (2009).20. A. Huth, C. Wissel, Ecol. Modell. 75-76, 135 (1994).21. U. Kils, thesis, University of Kiel, Germany (1987).22. R. E. McNicol, E. Scherer, J. H. Gee, Environ. Biol. Fishes
47, 311 (1996).23. L. W. Hall Jr., D. T. Burton, S. L. Margrey, W. C. Graves,
J. Toxicol. Environ. Health 10, 1017 (1982).24. C. W. Steele, A. D. Scarfe, D. W. Owens, J. Fish Biol. 38,
553 (1991).25. T. P. Quinn, K. Fresh, Can. J. Fish. Aquat. Sci. 41, 1078
(1984).26. J. J. Hard, W. R. Heard, Can. J. Fish. Aquat. Sci. 56, 578
(1999).27. K. Schaefer, D. Fuller, B. Block, Mar. Biol. 152, 503 (2007).
Acknowledgments: We thank J. Herbert-Read for experimentalassistance, N. O. Handegard for providing code and advicefor track linking, and A. Haenssen for technical support.Suggestions from members of the Couzin laboratory andtwo anonymous reviewers greatly improved this manuscript.Funded by NSF awards PHY-0848755, EAGER-1251585,and CNH-1211972; U.S. Office of Naval Research awardN00014-09-1-1074; U.S. Army Research Office grantW911NG-11-1-0385; Leverhulme Early Career Fellowship;Natural Sciences and Engineering Research Council of CanadaPostgraduate Scholarship Fellowship; and the Yukon Foundation.All experiments were conducted in accordance with federaland state regulations and were approved by the PrincetonUniversity Institutional Animal Care and Use Committee. Codefreely available at http://icouzin.princeton.edu.
Supplementary Materialswww.sciencemag.org/cgi/content/full/339/6119/574/DC1Materials and MethodsSupplementary TextFigs. S1 to S17Tables S1 and S2References (28–30)
11 June 2012; accepted 12 December 201210.1126/science.1225883
The Bacteriophage T7 VirionUndergoes Extensive StructuralRemodeling During InfectionBo Hu,1 William Margolin,2 Ian J. Molineux,3* Jun Liu1*
Adsorption and genome ejection are fundamental to the bacteriophage life cycle, yet theirmolecular mechanisms are not well understood. We used cryo–electron tomography to captureT7 virions at successive stages of infection of Escherichia coli minicells at ~4-nm resolution.The six phage tail fibers were folded against the capsid, extending and orienting symmetricallyonly after productive adsorption to the host cell surface. Receptor binding by the tail triggeredconformational changes resulting in the insertion of an extended tail, which functions as theDNA ejection conduit into the cell cytoplasm. After ejection, the extended phage tail collapsed ordisassembled, which allowed resealing of the infected cell membrane. These structuralstudies provide a detailed series of intermediates during phage infection.
After encountering a cell, a bacteriophagedelivers its genetic material into the hostcytoplasm via an orchestrated series of
conformational changes (1). T7 is a member ofthe Podoviridae, having short, noncontractiletails that are too short to span a bacterial cell en-
velope (2). The icosahedral 2-nm-thick T7 capsidis 60 to 61 nm in diameter, and inside, coaxial tothe dodecameric head-tail connector, is a 26- by21-nm internal core, which is thought to consistof three proteins: gp14, gp15, and gp16 (2, 3). Thecore is essential for both virion morphogenesisand ejection of the 40-kb genome. Near the head-proximal end of the 23-nm tail are six fibers, tri-mers of gp17. Each fiber has anN-terminal domainthat attaches the fiber to the tail, followed byproximal and distal half-fibers. The latter inter-act with the cell surface (4, 5). After adsorption,the core proteins are ejected through the portal-tail
1Department of Pathology and Laboratory Medicine, Universityof Texas Medical School at Houston, Houston, TX 77030, USA.2Department of Microbiology and Molecular Genetics, Uni-versity of Texas Medical School at Houston, Houston, TX 77030,USA. 3Molecular Genetics and Microbiology, Institute for Celland Molecular Biology, University of Texas at Austin, Austin, TX78712, USA.
*To whom correspondence should be addressed. E-mail:[email protected] (I.J.M.); [email protected] ( J.L.)
1 FEBRUARY 2013 VOL 339 SCIENCE www.sciencemag.org576
REPORTS
on
Janu
ary
31, 2
013
ww
w.s
cien
cem
ag.o
rgD
ownl
oade
d fr
om

complex into the infected cell, and it has beenhypothesized that they extend the tail, creatinga trans-envelope channel used for DNA transport(6–8). Here, we used cryo–electron tomography(cryo-ET) to provide three-dimensional (3D)structures of infected cell complexes in near-native, frozen-hydrated states at ~4-nm resolu-tion (fig. S1).
We infected small (≤0.3 mm in diameter)Escherichia coliminicells (9) to achieve maximumresolution. The T7-infected minicells producedinfective centers at normal efficiencies, andthe parent skinny cells were good hosts for thephage, which suggested that our structures re-flected the normal infection pathway (10).The 3D reconstructions revealed adsorbed vi-rions at three stages of infection (Fig. 1 andmovie S1) and supported the hypothesis (6–8)that T7 internal core proteins form a trans-envelope channel (Fig. 1, B and E). Dual-axistomography confirmed the presence of variousconformations (movie S2). In order to obtainbetter structural details, we used subvolume av-eraging to determine the 3D structures duringinfection (10).
Asymmetric reconstructions of a fiberlessgene 17 mutant (Fig. 2, A and D) and wild-type(Fig. 2, B and E) virions were derived from1945 and 6116 subvolumes, respectively. Theoverall structure of wild-type T7 (Fig. 2B) is sim-ilar to that reported (3), but our tomographicreconstruction resolved the tail fibers (Fig. 2,B, C, E, and F). Placing a known structure ofpart of the distal half-fiber (5) into the cryo-ETdensity revealed a good fit (Fig. 2F). Each fiber
was folded back onto the capsid with the proxi-mal half-fiber rising across the face of a capso-mer. The ~90° kink between proximal and distalhalf-fibers was visible in 3D surface renderings(Fig. 2, E and F). Fibers retained a conforma-tion similar to that of isolated tail complexes(fig. S2) (4).
The T7 tail exhibited 6-fold symmetry, butthe distal half-fibers were bound to the capsid,which is 5-fold symmetrical at the connector.To better understand the symmetry mismatchand the fiber-capsid interactions, we classifiedeach fiber independently by correspondenceanalysis (figs. S3 and S4). Class I fibers exhib-ited only a short fragment corresponding to theN-terminal domain that is bound to the tail (4),which indicated that neither half-fiber was boundto the capsid. Proximal and distal half-fiberswere visible in class II and were subdivided intosubclasses by their different orientations onthe capsid (Fig. 2, H and I). Projecting all distalhalf-fiber conformations onto the same sur-face showed that there is no specific bindingsite (fig. S4).
Phage tail fibers are normally depicted ex-tending away from the capsid, poised for ad-sorption. However, we found that ~50% ofmature T7 virions had five fibers bound to thecapsid and ~30% had four; very few had nobound fibers (Fig. 2J). Most published elec-tron microscopy (EM) images of T7 do notresolve fibers; they were visible in a tomogramof negatively stained T7 particles only as shortprojections from the capsid (fig. S2). More than95% of the wild-type T7 prepared for this study
made infective centers in exponentially growingcells within 2 to 3 min, which suggested that ex-tended fibers were not required for rapid adsorp-tion (10). Proximal half-fibers of the T7-relatedphage P-SSP7 also appear bound in mature vi-rions but are extended in spontaneously emptiedfree particles (11). Furthermore, cryo-EM recon-structions of T4 virions show fibers wrappedaround the tail sheath, not pointing away fromthe capsid (12). Maintaining tail fibers on thebody of free virions may thus be typical of manyphages.
Adsorbed T7 virions were generally orientedperpendicular to the cell surface with the tailslightly indenting the outer membrane (Fig. 3,A and B; fig. S5; and movie S3), similar to ad-sorbed phage P-SSP7 (11). Proximal half-fibersextended horizontally, whereas distal half-fiberswere vertical; bound fibers exhibited the same6-fold symmetry as the tail, covering ~3000 nm2
of the cell surface. During adsorption, fibers un-derwent a large rotation, which was probablydue to the N-terminal domain pivoting on itsconnection to the tail (fig. S6). Two-thirds (3352)of adsorbed phages analyzed were captured atthis intermediate stage, with the internal coreremaining intact within the capsid, which sug-gests that recognition of the cell surface by allsix fibers is insufficient to trigger later steps ofinfection.
About one-third (1886) of adsorbed parti-cles displayed a tubelike extension of the tailthat penetrated both cell membranes (Fig. 3, Cand D; figs. S5 and S7; and movie S3). A func-tional extension of the T7 tail is essential forgenome delivery into the host (2). The energyrequired for this dramatic change in structuremust be stored in the virion, because cellularenergy sources will not yet be accessible. Theinteraction between the tail and the outer mem-brane also changed, which presumably reflectsthe conformational changes that signal ejec-tion of the internal core, which was no longervisible (Fig. 3, A and C). However, the head stillappeared full, which suggested that the encap-sidated DNA had expanded to occupy the vol-ume originally occupied by the core.
The extended tail is probably composed ofejected core proteins, which have been foundin the infected cell envelope (7, 8). Gp14 lo-calizes to the infected cell outer membrane,whereas gp15 and gp16 span the periplasm andcytoplasmic membrane. Various mutant gp16-containing virions change the kinetics of genomeejection or prevent DNA from entering the cy-toplasm; the latter defect can be suppressed byvirions also harboring a mutant gp15 (8, 13–16).After infection by 16E37F mutant virions, whichare defective in cell wall hydrolysis and whichexhibit delayed DNA entry into the cytoplasm(14, 17), the extended tail took ~20 times aslong to form (fig. S8). The estimated volume ofthe internal core (3) is sufficient to form the en-tire extension. The overall tail extension was~45 nm, and the tube had an outer diameter of
Fig. 1. Three stages of T7 infection. (A andD) T7 adsorbed to the outer membrane. The density spanningthe cell envelope at 270° in (A) was derived from fiducial gold markers (shown explicitly in movie S1as a series of slices across the cell in (A). (B and E) An extended tail (arrow) spanned the cell envelope.(C and F) After DNA ejection, the extended tail was not apparent.
www.sciencemag.org SCIENCE VOL 339 1 FEBRUARY 2013 577
REPORTS
on
Janu
ary
31, 2
013
ww
w.s
cien
cem
ag.o
rgD
ownl
oade
d fr
om

Fig. 2. Asymmetric reconstructions of virions. (A)A central slice of a fiberless virion revealed the tail,capsid, and internal core. Fibers were visible in acentral slice (B) and a cross section of wild-typevirions (C). Surface rendering of fiberless (D) andwild-type virions in side (E) and bottom (F) views. Acrystal structure of the receptor-binding domain ofT7 fibers (5) was placed into three fiber densities.Residues A518, D520, and V544, known to affectphage host range (5), are highlighted in red (F).Classification revealed different conformations offibers not bound (G) or bound to the capsid (H andI). (J) Distribution of the number of bound fibers onfree virions; few had either six or zero fibers bound.
Fig. 3. Adsorption structures. (A) Central slice and (B) 3D surface view of asubvolume average derived from 3352 virions. All six fibers were bound tothe cell, and the tail made a small indentation in the outer membrane(OM); the internal core and DNA were still in the capsid. (C) Central slice
and (D) 3D surface view of a subvolume average derived from 1886 virions.The internal core had been ejected from the virion, forming an extended tailthat penetrated the cell cytoplasm. PG, peptidoglycan cell wall; IM, innermembrane.
1 FEBRUARY 2013 VOL 339 SCIENCE www.sciencemag.org578
REPORTS
on
Janu
ary
31, 2
013
ww
w.s
cien
cem
ag.o
rgD
ownl
oade
d fr
om

≥8 nm, sufficient to accommodate double-stranded DNA in its lumen. As the tube ap-proached the cytoplasmic membrane, densitybroadened (Fig. 3, C and D), probably becausethe extended tail was flexible (movie S4). Den-sity associated with the tube was less distinctinside the cytoplasm, but ~12 nm below thecenter of the membrane a ~30 by 6 nm toroidwith a ~4-nm central cavity was clearly present(fig. S9 and movie S4). The toroid may be partof the molecular motor that has been hypoth-esized to pull the leading genome end into thecell (6, 8, 16).
About 3% (162) of adsorbed phages hadcompletely ejected their genome. Virion struc-ture at this stage of infection was thus deter-mined only at relatively low resolution (fig.S10 and movie S3). The cytoplasmic toroid wasnot visible, and the tube traversing the peri-plasm had collapsed or disassembled, whichpresumably prevented dissipation of the mem-brane potential, which would inhibit phage de-velopment. We tested whether an energizedmembrane was required for channel forma-tion by treating minicells with carbonyl cyanidem-chlorophenyl hydrazone (CCCP) before in-fection. Of the 244 virions observed, 14% didnot adsorb, 55% adsorbed without tail exten-sion, 31% formed a trans-envelope structure,but none ejected their genome (fig. S11). Anenergized membrane was thus not necessaryfor adsorption or ejection of internal proteins,but, as expected (16, 18), it is essential for ge-nome translocation.
The combination of technical advances incryo-ET and a reduction in E. coli cell size hasallowed us to describe detailed features of themature T7 virion and structural changes dur-ing infection. Tail fibers, usually depicted ex-tending away from the virion, were mostly boundto the capsid. Our data suggest a dynamic equi-librium between bound and unbound states.Maintaining fibers in a folded-back configu-ration would allow a higher rate of virion dif-
fusion, whereas transient extension could stillpermit the phage to explore a large volume insearch of a cell. Binding of fibers to bacterialreceptors is weak, but transient binding couldreduce the dimensional space for finding a suit-able site for infection from three to two (19).Weak binding could potentially achieve the nec-essary specificity of adsorption by cooperativebinding among fibers or by a second compo-nent, i.e., the tail, binding with high specificity(2, 7, 20). We propose that the transition to astably adsorbed state occurs following a ran-dom walk after an initial interaction betweena fiber and the cell; e.g., bound fiber no. 1 isdirectly replaced by binding of fiber no. 2 with-out virion release (Fig. 4 and movie S5). Al-ternatively, in a quasi-2D diffusion process, fiberno. 1 may dissociate, followed rapidly by fiberno. 2 detaching from the capsid and binding tothe cell. Note that the common lab strain ofphage l, which lacks side tail fibers, has beensuggested to move across the cell surface in aquasi-1D process (21). At a preferred site ofinfection, the tail interacts specifically with itsreceptor, which prevents further lateral move-ment and allows all fibers to bind. The fibers ofphage T7 may thus function primarily to facil-itate interaction of the tail with its specific re-ceptor. After stable adsorption, infection istriggered by ejection of the internal core pro-teins into the cell envelope and the formation ofan extended tail, which may protect the enteringgenome from periplasmic nucleases.
References and Notes1. J. E. Johnson, W. Chiu, Curr. Opin. Struct. Biol. 17,
237 (2007).2. S. R. Casjens, I. J. Molineux, Adv. Exp. Med. Biol.
726, 143 (2012).3. X. Agirrezabala et al., EMBO J. 24, 3820 (2005).4. A. C. Steven et al., J. Mol. Biol. 200, 351
(1988).5. C. Garcia-Doval, M. J. van Raaij, Proc. Natl. Acad.
Sci. U.S.A. 109, 9390 (2012).6. I. J. Molineux, Mol. Microbiol. 40, 1 (2001).
7. P. Kemp, L. R. Garcia, I. J. Molineux, Virology 340,307 (2005).
8. C. Y. Chang, P. Kemp, I. J. Molineux, Virology 398,176 (2010).
9. J. Liu et al., Proc. Natl. Acad. Sci. U.S.A. 109,E1481 (2012).
10. See supplementary materials on Science Online.11. X. Liu et al., Nat. Struct. Mol. Biol. 17, 830
(2010).12. P. G. Leiman et al., Virol. J. 7, 355 (2010).13. L. R. García, I. J. Molineux, J. Bacteriol. 178, 6921
(1996).14. M. Moak, I. J. Molineux, Mol. Microbiol. 37, 345
(2000).15. J. S. Struthers-Schlinke, W. P. Robins, P. Kemp,
I. J. Molineux, J. Mol. Biol. 301, 35 (2000).16. P. Kemp, M. Gupta, I. J. Molineux, Mol. Microbiol.
53, 1251 (2004).17. M. Moak, I. J. Molineux, Mol. Microbiol. 51, 1169
(2004).18. A. Z. Zimkus, S. K. Zavriev, L. L. Grinius, Mol. Biol. (Mosk)
20, 185 (1986).19. G. Adam, M. Delbrück, in Structural Chemistry and
Molecular Biology, R. Rich, N. Davidson, Eds.(Freeman, San Francisco, 1968), pp. 198–215.
20. U. Qimron, B. Marintcheva, S. Tabor, C. C. Richardson,Proc. Natl. Acad. Sci. U.S.A. 103, 19039 (2006).
21. E. Rothenberg et al., Biophys. J. 100, 2875 (2011).
Acknowledgments: We thank P. Leiman, S. Norris, andY. W. Yin for comments. B.H. and J.L. were supported in partby grants R01AI087946 from the National Institute onAllergy and Infection, NIH, and AU-1714 from the WelchFoundation. W.M. was supported by NIH grant R01GM61074and a grant from the Human Frontier Science Program.EM maps have been deposited in the EM Data Bank(www.ebi.ac.uk/pdbe/emdb/) with accession nos. EMD-5534,5535, 5536, and 5537. J.L. and I.J.M. designed research;B.H. and W.M. constructed the E. coli mutants; B.H. andJ.L. collected and analyzed data; and B.H., W.M., J.L., andI.J.M. wrote the paper.
Supplementary Materialswww.sciencemag.org/cgi/content/full/science.1231887/DC1Materials and MethodsFigs. S1 to S11Table S1References (22–30)Movies S1 to S5
23 October 2012; accepted 13 December 2012Published online 10 January 2013;10.1126/science.1231887
Fig. 4. Schematic model of T7infection. The insert tomogramsshow the different orientationsof tail fibers. Fibers bound to thecell are highlighted with yellowarrows, unbound fiberswith greenarrows. After “walking” acrossthe cell surface to find the re-ceptor for the tail, all fibers ro-tate downward to contact theouter membrane. Commitmentto infection occurs after internalcore proteins are ejected fromthe virion and the extended tail(red arrow) forms.
www.sciencemag.org SCIENCE VOL 339 1 FEBRUARY 2013 579
REPORTS
on
Janu
ary
31, 2
013
ww
w.s
cien
cem
ag.o
rgD
ownl
oade
d fr
om

Circulating Breast Tumor CellsExhibit Dynamic Changes in Epithelialand Mesenchymal CompositionMin Yu,1,6* Aditya Bardia,1,3* Ben S. Wittner,1 Shannon L. Stott,1,2 Malgorzata E. Smas,1
David T. Ting,1 Steven J. Isakoff,1,3 Jordan C. Ciciliano,1 Marissa N. Wells,1 Ajay M. Shah,2
Kyle F. Concannon,1 Maria C. Donaldson,1 Lecia V. Sequist,1,3 Elena Brachtel,1,4
Dennis Sgroi,1,4 Jose Baselga,1,3 Sridhar Ramaswamy,1,3 Mehmet Toner,2,5
Daniel A. Haber,1,3,6† Shyamala Maheswaran1,5†
Epithelial-mesenchymal transition (EMT) of adherent epithelial cells to a migratory mesenchymalstate has been implicated in tumor metastasis in preclinical models. To investigate its role inhuman cancer, we characterized EMT in circulating tumor cells (CTCs) from breast cancer patients.Rare primary tumor cells simultaneously expressed mesenchymal and epithelial markers, butmesenchymal cells were highly enriched in CTCs. Serial CTC monitoring in 11 patients suggested anassociation of mesenchymal CTCs with disease progression. In an index patient, reversible shiftsbetween these cell fates accompanied each cycle of response to therapy and disease progression.Mesenchymal CTCs occurred as both single cells and multicellular clusters, expressing known EMTregulators, including transforming growth factor (TGF)–b pathway components and the FOXC1transcription factor. These data support a role for EMT in the blood-borne dissemination ofhuman breast cancer.
Most cancer-related deaths are caused bymetastasis, the dissemination of cancercells from the primary tumor through
the blood to new organ sites (1). Aberrant acti-vation of epithelial-mesenchymal transition (EMT)has been implicated in this process, based on
studies with human cancer cell lines and mousemodels (2, 3). Immunohistochemical approachesto identify EMT in tumors is complicated by thepresence of reactive mesenchymal stromal cells(4, 5), and analysis of circulating tumor cells (CTCs)has been hampered by reliance on epithelial markers
to separate cancer cells from surrounding hema-topoietic cells of mesenchymal origin (6, 7). Toaddress these technical challenges, we optimizedmicrofluidic capture of CTCs with epithelial- andtumor-specific antibodies, and we then used thistechnology to analyze EMT in CTCs from breastcancer patients.
We established a quantifiable, dual-colorimetricRNA–in situ hybridization (ISH) assay to exam-ine tumor cells for expression of seven pooledepithelial (E) transcripts [keratins (KRT) 5, 7, 8,18, and 19; EpCAM (epithelial cell adhesionmolecule); and CDH1 (cadherin 1)] and threemesenchymal (M) transcripts [FN1 (fibronectin1), CDH2 (cadherin 2), and SERPINE1/PAI1(serpin peptidase inhibitor, clade E)]. These probeswere validated in cell lines to confirm differen-tial expression in epithelial versus mesenchymalcancer cells and the absence of expression inblood cells that contaminate CTC preparations(table S1 and fig. S1A). After validating the
1Massachusetts General Hospital Cancer Center, Harvard Med-ical School, Charlestown, MA 02129, USA. 2Center for Bioengi-neering in Medicine, Harvard Medical School, Charlestown,MA 02129, USA. 3Department of Medicine, Harvard MedicalSchool, Charlestown, MA 02129, USA. 4Department of Pathol-ogy, Harvard Medical School, Charlestown, MA 02129, USA.5Department of Surgery, Harvard Medical School, Charlestown,MA 02129, USA. 6Howard Hughes Medical Institute, ChevyChase, MD 20815, USA.
*These authors contributed equally to this work.†To whom correspondence should be addressed. E-mail:[email protected] (D.A.H.); [email protected] (S.M.)
B
TN
A C
Lymph node
TumorE/M
(Hematoxylin)
E/M(Hematoxylin)
E/M(Hematoxylin)
Her2/M(Hematoxylin)
D
E/M
dua
l pos
itive
(%
)
DCISER/PR+
HER2+TN
Tumor
50
40
30
20
10
0Fig. 1. RNA-ISH analysis of EMT markers in human breast tumors. Representa-tive RNA-ISH analysis of pooled epithelial (E) (red dots, arrowheads) andmesenchymal (M) (dark blue dots, arrows) markers in (A) primary tumor and(B) tumor-infiltrated lymph node of a patient with ductal ER+/PR+ type breastcancer. (C) RNA-ISH analysis of HER2 (red dots, arrowheads) and M (dark blue dots, arrows) expression in a HER2+ primary breast tumor. (D) Quantitation ofE and M dual-positive tumor cells (percentage of total tumor cells) in a TMA consisting of premalignant DCIS (N = 7 cases) and ER+/PR+ (N = 20 cases), HER2+
(N = 9 cases), and TN (N = 16 cases) breast cancers. A representative image from a TN case is shown on the right. E, red dots; M, dark blue dots; nuclei arestained with hematoxylin, light blue. Scale bars: (A) to (D), 20 mm; inserts, 10 mm.
1 FEBRUARY 2013 VOL 339 SCIENCE www.sciencemag.org580
REPORTS
on
Janu
ary
31, 2
013
ww
w.s
cien
cem
ag.o
rgD
ownl
oade
d fr
om

E/M RNA-ISH analysis in mouse xenografts ofepithelial or mesenchymal breast cancer cells(fig. S1B), we applied the assays to primary hu-man breast cancer specimens.
Among the majority of E+ cancer cells, anddistinct from the M+ stromal cells, we detected asmall number of biphenotypic E+/M+ cells withclear epithelial histology, both in primary tumorsand in draining lymph nodes (Fig. 1, A and B).Dual–RNA-ISH staining for M markers and atumor-specific marker (HER2) confirmed theidentity of such mesenchymal cells as tumor-derived (Fig. 1C). We scored tissue microarrays(TMAs) containing multiple primary breast can-cers of various histological subtypes for the num-ber of dual E+/M+ cells. Using this assay, we foundthat benign breast tissue (N = 6 cases) and tu-mor cells in pre-invasive ductal carcinoma in situ
(DCIS) lesions (N = 7 cases) were exclusivelyepithelial, whereas reactive stromal cells wereexclusively mesenchymal. In contrast, we foundthat all three major histological subtypes of in-vasive breast cancer contained rare tumor cellswith epithelial morphology that stained with bothE and M markers: ER/PR+ subtype (mean = 3.3%,range 0 to 10%, N = 20 cases); HER2+ subtype(mean = 2.7%, range 0 to 10%, N = 9 cases); andthe triple negative (TN) (ER–/PR–/HER2–) sub-type (mean = 12.1%, range 0 to 45%, N = 16 cases)(Fig. 1D). The higher number of M+ tumor cellsin primary TN breast cancer is consistent withthis type of breast cancer being enriched for mes-enchymal markers, including vimentin (8, 9).Some TN cases contained clusters of cells in themiddle of the tumor mass that were strongly pos-itive for both E and M markers, yet were histo-
logically indistinguishable from the neighboringE+ tumor cells (Fig. 1D). Thus, human primarybreast tumors contain rare cancer cells that co-express mesenchymal and epithelial markers.
To extend our EMT analysis to CTCs, weused the microfluidic HB (herringbone)–chip (10)to capture CTCs from blood with an antibodycocktail directed against EpCAM, EGFR (epi-thelial growth factor receptor), and HER2 (humanepithelial growth factor receptor 2) (fig. S2). Hu-man breast cancer cell lines exhibiting epithelial(MCF7 and SKBR3) and mesenchymal (MDA-MB-231) characteristics were spiked into bloodand captured on the triple-antibody cocktail-coatedCTC-chip to ensure capture efficiencies of 80 to90%. MCF10A cells expressing the EMT-inducingtranscription factor LBX1 (11) were used to op-timize the quantitative immunofluorescence–based
Fig. 2. RNA-ISH analysis of EMT markers in CTCsfrom patients with metastatic breast cancer. (A)Representative images of five types of CTCs iso-lated from patients with metastatic breast cancer,based on RNA-ISH staining of E (green dots) and M(red dots) markers. Scale bar, 5 mm (B) Quantita-tion of EMT features in CTCs based on E and MRNA-ISH staining of histological subtypes of breastcancer [lobular, ductal, and U (unknown)], alongwith molecular classification (ER/PR, HER2, TN).CTC numbers per 3 ml of blood based on RNA (E+M)or protein (CK) staining are listed below. (C) Frac-tionation of CTCs according to E/M ratios in fivepatients who were clinically responding to treat-ment (top) and five patients who had progressivedisease on treatment (bottom). The subtype of breastcancer, each patient’s treatment regimen, and thenumber of days on treatment are shown. The drugsused to inhibit the signaling pathways shown on thefigure are as follows: MET + VEGF (vascular endothe-lial growth factor), cabozantinib; AI (aromatase inhib-itor), letrozole; PI3K (phosphatidylinositol 3-kinase),BKM120, INK1117, and BYL719; PI3K/mTOR (mam-malian target of rapamycin), SAR245409; MEK (MAPkinase kinase), MSC193639B; EGFR/HER3 (humanepidermal growth factor receptor 3), MEHD7945A.The chemotherapeutic drugs used were cisplatin,taxol, and adriamycin. Tumor genotypes are givenin table S2.
E E>M E=M M>E MA
BE/M/DAPI
ER/PR+ Her2+ TN
Lobular Ductal
41 59 19 350 17 20 28 5 19 8 20 8 8 15 9 12 14 73 219 42 5604 0 38 1 40 2 3 0 1 0 0 0 8 11
:RNA (E+M) :Protein (CK)
Per
cent
age
of C
TC
s
U
Patient-derived CTCs
Patient ID
CTC #
E
E>M
E=M
M>E
M
100
80
60
40
20
01 2 3 4 5 6 7 8 9 10 11 12 13 14 15 16 17
C
TreatmentResponsive
CT
C n
umbe
r/3m
l
0 28 MET+VEGF
0 36 AI+PI3K
5 21 PI3K
0 14 PI3K Treatment
ProgressiveDisease
365 8 Chemo1 Chemo2
0 42Chemotherapy
0 52PI3K/mTORi+MEK
23 127 EGFR+HER3
CT
C n
umbe
r/3m
l
Treatment
ER/PR+(Ductal)
ER/PR+(Ductal) ER/PR+(Lobular) HER2+
HER2+
TN
Days on
Days on 0 48 PI3K
0 220 AI+PI3K
ER/PR+(Lobular)
www.sciencemag.org SCIENCE VOL 339 1 FEBRUARY 2013 581
REPORTS
on
Janu
ary
31, 2
013
ww
w.s
cien
cem
ag.o
rgD
ownl
oade
d fr
om
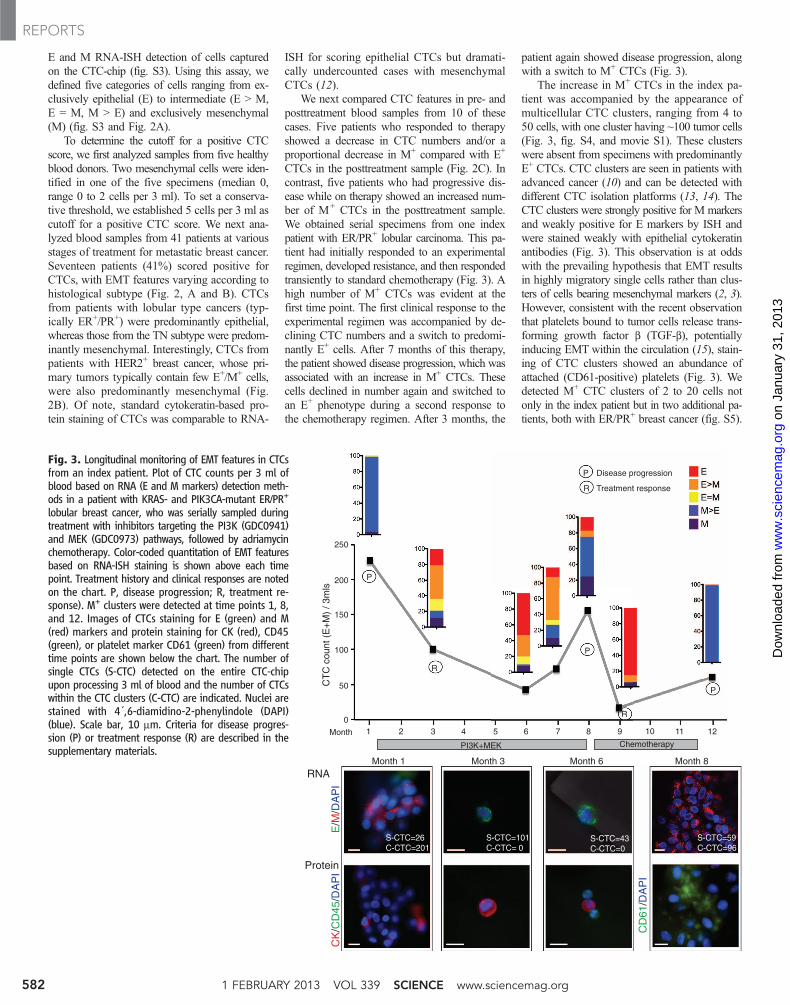
E and M RNA-ISH detection of cells capturedon the CTC-chip (fig. S3). Using this assay, wedefined five categories of cells ranging from ex-clusively epithelial (E) to intermediate (E > M,E = M, M > E) and exclusively mesenchymal(M) (fig. S3 and Fig. 2A).
To determine the cutoff for a positive CTCscore, we first analyzed samples from five healthyblood donors. Two mesenchymal cells were iden-tified in one of the five specimens (median 0,range 0 to 2 cells per 3 ml). To set a conserva-tive threshold, we established 5 cells per 3 ml ascutoff for a positive CTC score. We next ana-lyzed blood samples from 41 patients at variousstages of treatment for metastatic breast cancer.Seventeen patients (41%) scored positive forCTCs, with EMT features varying according tohistological subtype (Fig. 2, A and B). CTCsfrom patients with lobular type cancers (typ-ically ER+/PR+) were predominantly epithelial,whereas those from the TN subtype were predom-inantly mesenchymal. Interestingly, CTCs frompatients with HER2+ breast cancer, whose pri-mary tumors typically contain few E+/M+ cells,were also predominantly mesenchymal (Fig.2B). Of note, standard cytokeratin-based pro-tein staining of CTCs was comparable to RNA-
ISH for scoring epithelial CTCs but dramati-cally undercounted cases with mesenchymalCTCs (12).
We next compared CTC features in pre- andposttreatment blood samples from 10 of thesecases. Five patients who responded to therapyshowed a decrease in CTC numbers and/or aproportional decrease in M+ compared with E+
CTCs in the posttreatment sample (Fig. 2C). Incontrast, five patients who had progressive dis-ease while on therapy showed an increased num-ber of M+ CTCs in the posttreatment sample.We obtained serial specimens from one indexpatient with ER/PR+ lobular carcinoma. This pa-tient had initially responded to an experimentalregimen, developed resistance, and then respondedtransiently to standard chemotherapy (Fig. 3). Ahigh number of M+ CTCs was evident at thefirst time point. The first clinical response to theexperimental regimen was accompanied by de-clining CTC numbers and a switch to predomi-nantly E+ cells. After 7 months of this therapy,the patient showed disease progression, which wasassociated with an increase in M+ CTCs. Thesecells declined in number again and switched toan E+ phenotype during a second response tothe chemotherapy regimen. After 3 months, the
patient again showed disease progression, alongwith a switch to M+ CTCs (Fig. 3).
The increase in M+ CTCs in the index pa-tient was accompanied by the appearance ofmulticellular CTC clusters, ranging from 4 to50 cells, with one cluster having ~100 tumor cells(Fig. 3, fig. S4, and movie S1). These clusterswere absent from specimens with predominantlyE+ CTCs. CTC clusters are seen in patients withadvanced cancer (10) and can be detected withdifferent CTC isolation platforms (13, 14). TheCTC clusters were strongly positive for M markersand weakly positive for E markers by ISH andwere stained weakly with epithelial cytokeratinantibodies (Fig. 3). This observation is at oddswith the prevailing hypothesis that EMT resultsin highly migratory single cells rather than clus-ters of cells bearing mesenchymal markers (2, 3).However, consistent with the recent observationthat platelets bound to tumor cells release trans-forming growth factor b (TGF-b), potentiallyinducing EMT within the circulation (15), stain-ing of CTC clusters showed an abundance ofattached (CD61-positive) platelets (Fig. 3). Wedetected M+ CTC clusters of 2 to 20 cells notonly in the index patient but in two additional pa-tients, both with ER/PR+ breast cancer (fig. S5).
Fig. 3. Longitudinal monitoring of EMT features in CTCsfrom an index patient. Plot of CTC counts per 3 ml ofblood based on RNA (E and M markers) detection meth-ods in a patient with KRAS- and PIK3CA-mutant ER/PR+
lobular breast cancer, who was serially sampled duringtreatment with inhibitors targeting the PI3K (GDC0941)and MEK (GDC0973) pathways, followed by adriamycinchemotherapy. Color-coded quantitation of EMT featuresbased on RNA-ISH staining is shown above each timepoint. Treatment history and clinical responses are notedon the chart. P, disease progression; R, treatment re-sponse). M+ clusters were detected at time points 1, 8,and 12. Images of CTCs staining for E (green) and M(red) markers and protein staining for CK (red), CD45(green), or platelet marker CD61 (green) from differenttime points are shown below the chart. The number ofsingle CTCs (S-CTC) detected on the entire CTC-chipupon processing 3 ml of blood and the number of CTCswithin the CTC clusters (C-CTC) are indicated. Nuclei arestained with 4´,6-diamidino-2-phenylindole (DAPI)(blue). Scale bar, 10 mm. Criteria for disease progres-sion (P) or treatment response (R) are described in thesupplementary materials. PI3K+MEK Chemotherapy
E/M
/DA
PI
CK
/CD
45/D
AP
I
0
250
200
150
100
50CT
C c
ount
(E
+M
) / 3
mls
1 2 3 4 5 6 7 8 9
CD
61/D
AP
I
RNA
Protein
S-CTC=26C-CTC=201
S-CTC=59C-CTC=96
S-CTC=101C-CTC= 0
S-CTC=43C-CTC=0
10 11 12Month
R
R
P
P
P
Month 1 Month 3 Month 6 Month 8
P
R
Disease progression
Treatment response
1 FEBRUARY 2013 VOL 339 SCIENCE www.sciencemag.org582
REPORTS
on
Janu
ary
31, 2
013
ww
w.s
cien
cem
ag.o
rgD
ownl
oade
d fr
om
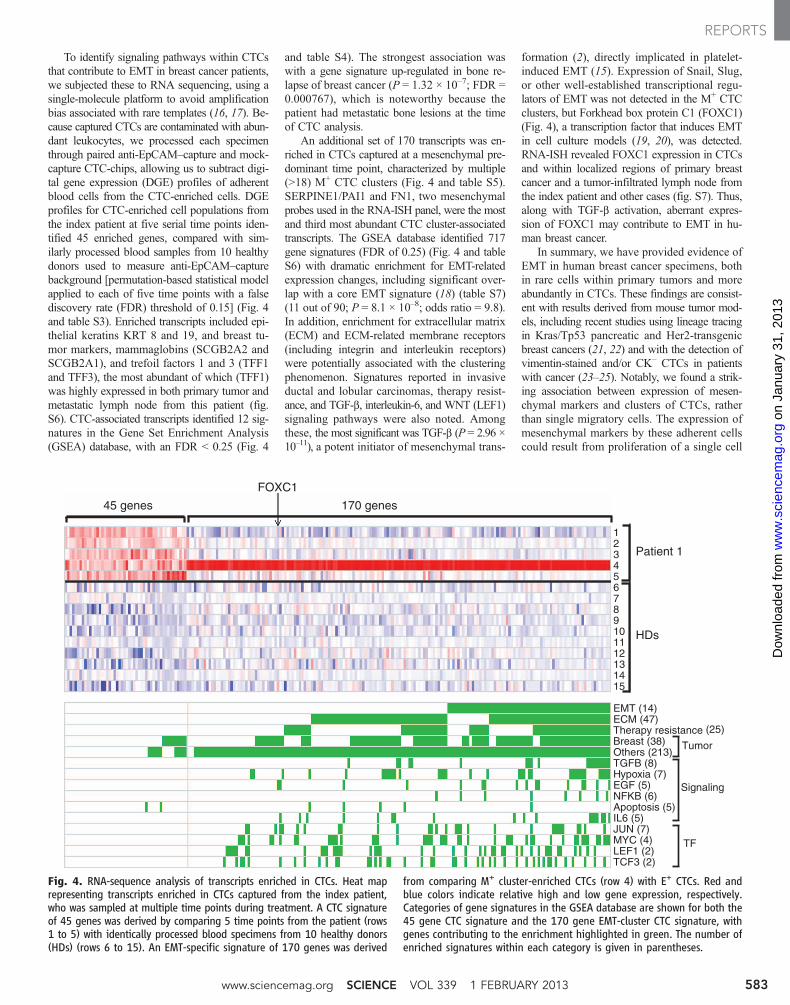
To identify signaling pathways within CTCsthat contribute to EMT in breast cancer patients,we subjected these to RNA sequencing, using asingle-molecule platform to avoid amplificationbias associated with rare templates (16, 17). Be-cause captured CTCs are contaminated with abun-dant leukocytes, we processed each specimenthrough paired anti-EpCAM–capture and mock-capture CTC-chips, allowing us to subtract digi-tal gene expression (DGE) profiles of adherentblood cells from the CTC-enriched cells. DGEprofiles for CTC-enriched cell populations fromthe index patient at five serial time points iden-tified 45 enriched genes, compared with sim-ilarly processed blood samples from 10 healthydonors used to measure anti-EpCAM–capturebackground [permutation-based statistical modelapplied to each of five time points with a falsediscovery rate (FDR) threshold of 0.15] (Fig. 4and table S3). Enriched transcripts included epi-thelial keratins KRT 8 and 19, and breast tu-mor markers, mammaglobins (SCGB2A2 andSCGB2A1), and trefoil factors 1 and 3 (TFF1and TFF3), the most abundant of which (TFF1)was highly expressed in both primary tumor andmetastatic lymph node from this patient (fig.S6). CTC-associated transcripts identified 12 sig-natures in the Gene Set Enrichment Analysis(GSEA) database, with an FDR < 0.25 (Fig. 4
and table S4). The strongest association waswith a gene signature up-regulated in bone re-lapse of breast cancer (P = 1.32 × 10⁻⁷; FDR =0.000767), which is noteworthy because thepatient had metastatic bone lesions at the timeof CTC analysis.
An additional set of 170 transcripts was en-riched in CTCs captured at a mesenchymal pre-dominant time point, characterized by multiple(>18) M+ CTC clusters (Fig. 4 and table S5).SERPINE1/PAI1 and FN1, two mesenchymalprobes used in the RNA-ISH panel, were the mostand third most abundant CTC cluster-associatedtranscripts. The GSEA database identified 717gene signatures (FDR of 0.25) (Fig. 4 and tableS6) with dramatic enrichment for EMT-relatedexpression changes, including significant over-lap with a core EMT signature (18) (table S7)(11 out of 90; P = 8.1 × 10⁻⁸; odds ratio = 9.8).In addition, enrichment for extracellular matrix(ECM) and ECM-related membrane receptors(including integrin and interleukin receptors)were potentially associated with the clusteringphenomenon. Signatures reported in invasiveductal and lobular carcinomas, therapy resist-ance, and TGF-b, interleukin-6, and WNT (LEF1)signaling pathways were also noted. Amongthese, the most significant was TGF-b (P = 2.96 ×10⁻¹¹), a potent initiator of mesenchymal trans-
formation (2), directly implicated in platelet-induced EMT (15). Expression of Snail, Slug,or other well-established transcriptional regu-lators of EMT was not detected in the M+ CTCclusters, but Forkhead box protein C1 (FOXC1)(Fig. 4), a transcription factor that induces EMTin cell culture models (19, 20), was detected.RNA-ISH revealed FOXC1 expression in CTCsand within localized regions of primary breastcancer and a tumor-infiltrated lymph node fromthe index patient and other cases (fig. S7). Thus,along with TGF-b activation, aberrant expres-sion of FOXC1 may contribute to EMT in hu-man breast cancer.
In summary, we have provided evidence ofEMT in human breast cancer specimens, bothin rare cells within primary tumors and moreabundantly in CTCs. These findings are consist-ent with results derived from mouse tumor mod-els, including recent studies using lineage tracingin Kras/Tp53 pancreatic and Her2-transgenicbreast cancers (21, 22) and with the detection ofvimentin-stained and/or CK– CTCs in patientswith cancer (23–25). Notably, we found a strik-ing association between expression of mesen-chymal markers and clusters of CTCs, ratherthan single migratory cells. The expression ofmesenchymal markers by these adherent cellscould result from proliferation of a single cell
123456789101112131415
EMT (14)ECM (47)Therapy resistanceBreast (38)Others (213)TGFB (8)Hypoxia (7)EGF (5)NFKB (6)Apoptosis (5)IL6 (5)JUN (7)MYC (4)LEF1 (2)TCF3 (2)
170 genes 45 genes
FOXC1
HDs
Patient 1
Signaling
TF
Tumor
(25)
Fig. 4. RNA-sequence analysis of transcripts enriched in CTCs. Heat maprepresenting transcripts enriched in CTCs captured from the index patient,who was sampled at multiple time points during treatment. A CTC signatureof 45 genes was derived by comparing 5 time points from the patient (rows1 to 5) with identically processed blood specimens from 10 healthy donors(HDs) (rows 6 to 15). An EMT-specific signature of 170 genes was derived
from comparing M+ cluster-enriched CTCs (row 4) with E+ CTCs. Red andblue colors indicate relative high and low gene expression, respectively.Categories of gene signatures in the GSEA database are shown for both the45 gene CTC signature and the 170 gene EMT-cluster CTC signature, withgenes contributing to the enrichment highlighted in green. The number ofenriched signatures within each category is given in parentheses.
www.sciencemag.org SCIENCE VOL 339 1 FEBRUARY 2013 583
REPORTS
on
Janu
ary
31, 2
013
ww
w.s
cien
cem
ag.o
rgD
ownl
oade
d fr
om

that has undergone EMT into a cluster of suchcells or, alternatively, from the mesenchymaltransformation of preexisting CTC clusters with-in the bloodstream. The proposal that mesenchy-mal transformation of epithelial cells is mediatedby TGF-b released from platelets (15) is sup-ported by our observation of strong TGF-b sig-natures in mesenchymal CTC clusters, manyof which carry attached platelets. Collectivemigration of grouped cells that maintain theircell-cell and cell-matrix connections has beenimplicated in cancer metastasis (26, 27), andmay involve increased survival signals as CTCclusters circulate in the blood (17, 28, 29). Theclinical importance of EMT as a potential bio-marker of therapeutic resistance and as a poten-tial drug target in breast cancer warrants furtherinvestigation.
References and Notes1. D. X. Nguyen, P. D. Bos, J. Massagué, Nat. Rev. Cancer 9,
274 (2009).2. J. P. Thiery, Nat. Rev. Cancer 2, 442 (2002).3. R. Kalluri, R. A. Weinberg, J. Clin. Invest. 119, 1420
(2009).4. T. Brabletz, Nat. Rev. Cancer 12, 425 (2012).5. H. Ledford, Nature 472, 273 (2011).
6. K. Pantel, R. H. Brakenhoff, B. Brandt, Nat. Rev. Cancer8, 329 (2008).
7. M. Yu, S. Stott, M. Toner, S. Maheswaran, D. A. Haber,J. Cell Biol. 192, 373 (2011).
8. H. Jeong, Y. J. Ryu, J. An, Y. Lee, A. Kim, Histopathology60, E87 (2012).
9. Z. Jiang et al., Cell Cycle 10, 1563 (2011).10. S. L. Stott et al., Proc. Natl. Acad. Sci. U.S.A. 107, 18392
(2010).11. M. Yu et al., Genes Dev. 23, 1737 (2009).12. R. E. Payne et al., Br. J. Cancer 106, 1790 (2012).13. M. G. Krebs et al., J. Thorac. Oncol. 7, 306 (2012).14. E. H. Cho et al., Phys. Biol. 9, 016001 (2012).15. M. Labelle, S. Begum, R. O. Hynes, Cancer Cell 20, 576
(2011).16. F. Ozsolak et al., Nat. Methods 7, 619 (2010).17. M. Yu et al., Nature 487, 510 (2012).18. J. H. Taube et al., Proc. Natl. Acad. Sci. U.S.A. 107,
15449 (2010).19. K. Polyak, R. A. Weinberg, Nat. Rev. Cancer 9, 265
(2009).20. N. Bloushtain-Qimron et al., Proc. Natl. Acad. Sci. U.S.A.
105, 14076 (2008).21. Y. Hüsemann et al., Cancer Cell 13, 58 (2008).22. A. D. Rhim et al., Cell 148, 349 (2012).23. A. J. Armstrong et al., Mol. Cancer Res. 9, 997 (2011).24. A. Lecharpentier et al., Br. J. Cancer 105, 1338
(2011).25. C. V. Pecot et al., Cancer Discov 1, 580 (2011).26. O. Ilina, P. Friedl, J. Cell Sci. 122, 3203 (2009).27. D. G. Duda et al., Proc. Natl. Acad. Sci. U.S.A. 107,
21677 (2010).
28. Y. N. Kim, K. H. Koo, J. Y. Sung, U. J. Yun, H. Kim, Int. J.Cell Biol. 2012, 306879 (2012).
29. J. M. Hou et al., J. Clin. Oncol. 30, 525 (2012).
Acknowledgments: We are grateful to all the patients whoparticipated in this study; we thank D. Juric, C. Koris, andthe Massachusetts General Hospital (MGH) clinical researchcoordinators for help with clinical studies; A. Gilman, B. Brannigan,and M. Zeinali for technical support; F. Ozsolak and P. Milos(Helicos) for RNA sequencing; A. Forrest-Hay and Q. Nguyen(Affymetrix) for RNA-ISH reagents; L. Libby for mouse studies; andJ. Walsh for expertise with microscopy. This work was supportedby grants from the Breast Cancer Research Foundation (D.A.H.),Stand Up To Cancer (D.A.H., M.T., and S.M.), Susan G. Komen forthe Cure KG090412 (S.M.), NIBIB EB008047 (M.T., D.A.H.),NCI CA129933 (D.A.H.), the National Cancer Institute–MGHFederal Share Program (S.M.), and the Howard Hughes MedicalInstitute (M.Y. and D.A.H.). The MGH and M.T. have filed a patentfor the HB (Herringbone) microchip (U.S. patent 09816815.4).Sequencing data have been deposited in the Gene ExpressionOmnibus database (accession no. GSE41245).
Supplementary Materialswww.sciencemag.org/cgi/content/full/339/6119/580/DC1Materials and MethodsFigs. S1 to S7Tables S1 to S7References (30–36)Movie S1
7 August 2012; accepted 6 December 201210.1126/science.1228522
Systematic Identificationof Signal-Activated StochasticGene RegulationGregor Neuert,1,2* Brian Munsky,3* Rui Zhen Tan,1,5,6 Leonid Teytelman,1
Mustafa Khammash,4,7† Alexander van Oudenaarden1,8†‡
Although much has been done to elucidate the biochemistry of signal transduction and generegulatory pathways, it remains difficult to understand or predict quantitative responses. Weintegrate single-cell experiments with stochastic analyses, to identify predictive models oftranscriptional dynamics for the osmotic stress response pathway in Saccharomyces cerevisiae.We generate models with varying complexity and use parameter estimation and cross-validationanalyses to select the most predictive model. This model yields insight into several dynamicalfeatures, including multistep regulation and switchlike activation for several osmosensitive genes.Furthermore, the model correctly predicts the transcriptional dynamics of cells in response to differentenvironmental and genetic perturbations. Because our approach is general, it should facilitatea predictive understanding for signal-activated transcription of other genes in other pathwaysor organisms.
Acentral goal of systems biology is to un-derstand and predict the complex, stochas-tic dynamics of gene regulation (1–3).
Although biochemical studies have identifiedmanyregulatory proteins in these processes, this typi-cally does not enable construction of quantitative-ly predictive models of transcriptional dynamics.One challenge lies in the fact that gene regula-tion is a dynamic multistate process with largelyunknown reaction rates. For example, a two-statesystem may represent closed and open chromatin(4–6) or the presence or absence of a transcriptionfactor (7–9). Including more states or regulatoryreactions results in a combinatorial increase in the
number of possible model structures (10) and leadsto a complicated trade-off between overfitting andpredictive power.
We propose a data-driven comprehensive ap-proach to identify and validate predictive, quan-titative models of transcriptional dynamics throughthe integration of single-cell experiments and dis-crete stochastic analyses within a system identifi-cation framework. We apply this approach to thewell-characterized high-osmolarity glycerol (HOG)mitogen-activated protein kinase (MAPK) pathwayin Saccharomyces cerevisiae and focus on theregulation of STL1, CTT1, and HSP12 (11, 12)genes. Upon osmotic shock, the Hog1p kinase
quickly enters the nucleus (Fig. 1A, and figs. S2to S4, and S6) (13–16) and activates STL1, CTT1,and HSP12 gene expression (figs. S6 and S9)(17). We find that the Hog1p translocation dynam-ics is homogeneous (14, 15, 17), yet downstreamgene activation is heterogeneous among cells(17). To quantify STL1 expression directly, we de-veloped a single-molecule fluorescent in situ hy-bridization (smFISH) (18, 19, 20) assay, whichcaptures the stochastic nature of mRNA transcrip-tion with high temporal and single-molecule res-olution (Fig. 1B) (21, 22, 23).
In addition to the kinase Hog1p, we considerthe effects of the transcription factor Hot1p andthe chromatin modifiers Arp8p and Gcn5p thatmodulate STL1 transcription (17, 24). For thissystem, we seek to find and validate a model thatpredicts the system’s dynamic mRNA expression
1Departments of Physics and Biology and Koch Institute forIntegrative Cancer Research, Massachusetts Institute of Tech-nology, Cambridge, MA 02139, USA. 2Department of Molec-ular Physiology and Biophysics, School of Medicine, VanderbiltUniversity, Nashville, TN 37232, USA. 3Center for NonlinearStudies and the Information Sciences Group, Los AlamosNational Laboratory, Los Alamos, NM 87545, USA. 4Depart-ment of Biosystems Science and Engineering, ETH-Zuerich,4058 Basel, Switzerland. 5Bioinformatics Institute, A*STAR,Singapore 138671, Singapore. 6Harvard University GraduateBiophysics Program, Harvard Medical School, Boston, MA 02115,USA. 7Center for Control, Dynamical Systems and Computationand Department of Mechanical Engineering, University ofCalifornia, Santa Barbara, CA 93106, USA. 8Hubrecht Institute,Royal Netherlands Academy of Arts and Sciences and Uni-versity Medical Center Utrecht, Uppsalalaan 8, 3584 CT,Utrecht, Netherlands.
*These authors contributed equally to this work.†Co-senior authors.‡To whom correspondence should be addressed. E-mail:[email protected]
1 FEBRUARY 2013 VOL 339 SCIENCE www.sciencemag.org584
REPORTS
on
Janu
ary
31, 2
013
ww
w.s
cien
cem
ag.o
rgD
ownl
oade
d fr
om

for several genes (STL1, CTT1, and HSP12) inresponse to environmental and genetic perturba-tions. We propose a range of model structures,each with a discrete number of states, {S1, S2,…,SN} (Fig. 2A). Each haploid cell occupies onestate at a time, and transitions among states arediscrete, stochastic events. At least two states arerequired to explain bimodality, but additionalstates allow for more complex mechanisms, suchas chromatin remodeling or transcription factorbinding or release (7–9, 17). Because activatedmRNA transcription and degradation rates areconstant throughout different conditions (fig. S5),only transition rates can be variable and are as-
sumed to be constant or linearly dependent on thekinase. After identifying the model structure andHog1p dependency, we validate the model struc-ture for several mutants and different Hog1p-dependent genes.
To choose the best number of states neededto match STL1 gene expression dynamics, weallow every state transition rate to be Hog1p-dependent. For two-, three-, four-, and five-statemodel structures with any parameter set, we usethe finite state projection (FSP) approach (25) toformulate a finite set of linear ordinary differen-tial equations that predicts the time-varying prob-ability distributions.We adjust themodel parameters
until the FSP analysis fits the bimodal mRNAdistributions at all times (26). As expected, the fitimproves as themodel complexity increases (Fig.2B, red line, and fig. S11). However, increasedcomplexity leads to greater parametric uncertain-ty and may diminish predictive power. Applyingcross-validation analyses to replicate experimentsat 0.4 M NaCl (27), we score all models accord-ing to their estimated predictive power (Fig. 2B,blue line). This prediction estimate is validatedwith additional experiments conducted at 0.2 MNaCl, and we find that cross-validation providesan excellent estimate of predictive power (Fig. 2B,compare blue and green lines, and figs. S11 andS12). We find that the two- and three-state modelsare too simple, whereas the more complex five-state model structure is prone to overfitting (Fig.2B and figs. S11 and S12).
We now concentrate on the four-state mod-el structures and determine which reactions de-pend upon Hog1p. To identify a Hog1p-modelstructure with enough flexibility to match thedata while avoiding overfitting, we allow oneor two Hog1p dependencies. We then rank thecorresponding maximum likelihoods and cross-validate the top ranked Hog1p-model structures.The fit improves with increasing complexity(Fig. 2B, red line, and fig. S11), while constrain-ing the number of Hog1p dependencies reducesuncertainty (Fig. 2B and fig. S11). One nota-ble feature of the identified model structure andits corresponding parameters is that in the ab-sence of Hog1p, a fast reaction from S2 → S1keeps all cells in the inactive S1 state (fig. S8, red
A
Nucleus
Cytoplasm
GeneTF/CM
Kinase
PP
Kinase
PP
Kinase
B 0 min 4 min 8 min
15 min 20 min 30 min
Fig. 1. Quantitative analysis of single-cell stochastic gene regulation. (A) Schematic of a genericsignaling cascade in which a kinase enters the nucleus and interacts with transcription factors (TF) andchromatin modifiers (CM) to regulate gene expression. (B) Rapid, stochastic, and bimodal activation ofendogenous STL1 mRNA expression is detected with single-molecule RNA-FISH [yeast cell: gray circle;DAPI (4′,6-diamidino-2-phenylindole)–stained nucleus: blue; STL1 mRNA: green dots]. Scale bar: 2 mm.
Fig. 2. Identifying a maximally predictive model structure. (A) Two- and multistate modelstructures that allow for kinase, transcription factor, and chromatin modifier–dependentactivation of gene expression. (B) Relative likelihoods of best fit for different modelstructures at 0.4 M NaCl (red, left axis) and the resulting predictions at 0.2 M NaCl (green,right axis). Cross-validation at 0.4 M NaCl (27) is used to quantify predictive uncertainty(gray region, left axis) and yields excellent a priori knowledge of predictive power (compareblue and green lines). (C) mRNA expression distributions at two NaCl concentrations (blackand blue lines) and best fit at 0.4 M (red line) and the corresponding prediction at 0.2 MNaCl (green line). The fit and predictions correspond to the four-state structure with oneHog1p dependency identified at 0.4 M NaCl in (fig. S7). The black arrow indicates thesimilar mRNA expression levels after an osmotic shock of 0.2 and 0.4 M NaCl. The purplestar indicates the time point of gene expression deactivation.
www.sciencemag.org SCIENCE VOL 339 1 FEBRUARY 2013 585
REPORTS
on
Janu
ary
31, 2
013
ww
w.s
cien
cem
ag.o
rgD
ownl
oade
d fr
om

line). When Hog1p exceeds a certain threshold,the gene can transition among the active S2,S3, and S4 states (fig. S8, blue, green, and blacklines). Our final model captures all qualitativeand quantitative features of STL1 mRNA ex-pression dynamics after a 0.4 M NaCl osmoticshock (Fig. 2C, top). These features include aconstant time delay, t0, between Hog1p trans-location and mRNA expression; slow activa-tion of gene expression; transient bimodality inRNA populations; conserved maximal mRNAexpression between different conditions; andHog1p-dependent modulation of gene expres-sion duration. In addition, the model makes thebest predictions for the mRNA expression af-ter osmotic shock with 0.2 M NaCl (Fig. 2C,bottom).
To test the generality of this model’s predic-tive power, we collect new data sets at 0.4 MNaCl for several different mutant strains andfor different Hog1p-activated genes. The dif-ferent mutant strains include a fivefold Hot1p-overexpression strain and gene knockouts ofthe chromatin modifiers ARP8 orGCN5. We alsoconsider two additional stress response genes:CTT1 and HSP12. The model identified abovefits equally well to the mRNA expression dy-namics for STL1 in the Hot1p-overexpressionstrain as well as the arp8D and gcn5D mutants(Fig. 3A and figs. S15, S18, and S19). The samestructure also fits the CTT1 and HSP12 mRNAexpression dynamics (figs. S9, S15, S18, and S19)with relatively few parameter changes betweenthe different genes andmutations (table S2) (27).The resulting model makes excellent predictionsfor the dynamics of CTT1 and HSP12 mRNA
expression at 0.2 M NaCl (Fig. 3, B and C, andfigs. S16, S18, and S19). Combining the relativechanges in the rates measured for STL1 in themutant ARP8 strain with the rate changes forthe CTT1 and HSP12 expression measured inwild-type strain results in a very good predic-tion of the CTT1 and HSP12 mRNA expressionin the ARP8 mutant strain (Fig. 3C and figs. S17to S19) (27).
Having determined that the model structureidentified above can fit and predict STL1, CTT1,and HSP12 mRNA expression dynamics in dif-ferentmutant strains, we examinewhich rates varymost for each mutant and gene in comparison towild-type STL1 (Fig. 4A and table S2). The mostvariable rates between different mutations arethe k12 and k21 transition rates, which indicate
that Hot1p, Gcn5p, and Arp8p all modulate thetransition rates into and out of the S1 state but re-sult in different Hog1p-activation and -deactivationthresholds (fig. S10). Other transition rates areaffected to a much lower degree.
The identifiedmodel structure and parametersquantitatively capture and/or predict all of theobserved experimental data (Figs. 2 to 4 and figs.S15 to S19). The model also yields several qual-itative and quantitative insights, including (i) aswitchlike mechanism that activates each geneand stabilizes its activity when Hog1p exceeds agene-specific threshold and (ii) gene-specific pro-duction and degradation rates that are indepen-dent of the Hog1p-kinase dynamics. The four-statemodel structure is essential to explain the tem-poral dynamics in gene expression observed in
A B0 min 4 min 6 min 10 min 20 min 30 min 40 min 50 min
Experimental mRNA distributions at 0.4M NaCl
Fra
ctio
n of
cel
ls [0
- 0
.1]
Hot
1p 5
xar
p8∆
gcn5
∆W
T
Fit
FIT
FIT
0 80
FIT
FIT
Fra
ctio
n of
cel
ls [0
- 0
.1]
No. of mRNA
0 min 4 min 6 min 10 min 20 min 30 min 40 min 50 min
0 80
HS
P12
CT
T1
Experimental mRNA distribution at 0.2M NaCl
Prediction
PREDICTION
PREDICTION
C
Fra
ctio
n of
cel
ls [0
- 0
.1]
No. of mRNANo. of mRNA
0 min 4 min 6 min 10 min 20 min 30 min 40 min 50 min
0 80
HS
P12
in a
rp8
∆
PREDICTION
Experimental mRNA distributions at 0.4M NaCl in arp8∆ strain
PredictionFig. 3. Model structure validation. (A) Combined fit of the model structureidentified (fig. S7) to different genetic mutations affecting STL1 expressionat 0.4 M NaCl: wild-type (WT) (red), Hot1p 5× (blue), arp8D (black), and gcn5D (green). (B) Model prediction of CTT1 (cyan) and HSP12 (magenta)expression at 0.2 M NaCl. (C) Model prediction for HSP12 expression at 0.4 M in the arp8D strain.
k12 k21 k23 k32 k34 k43 kr1 kr2 kr3 kr4
HSP12CTT1arp8∆gcn5∆
Hot1p 5xWT
x 0.01
x 0.1
x 1
x 10
x 100A
B
Hot1p
S1 S2 S3
mRNA mRNA
S4
mRNAmRNA
Hog1p(t)Gcn5p
Gcn5p
Arp8p
Arp8p
Fig. 4. Relating model structure to biological function. (A) Mutant and gene-specific rate changesrelative to STL1. (B) Final model, in which Hog1p, Hot1p, Gcn5p, and Arp8p regulate transitions betweenstates S1 and S2.
1 FEBRUARY 2013 VOL 339 SCIENCE www.sciencemag.org586
REPORTS
on
Janu
ary
31, 2
013
ww
w.s
cien
cem
ag.o
rgD
ownl
oade
d fr
om

all of the experiments. This structure describesan Off state, S1, which is the default state in theabsence of osmotic shock, and three On stateswith different transcription rates and reaction ratesbetween the states. Activation occurs when nu-clear Hog1p represses the deactivation rate, k21,subject to the interplay of gene- and mutant-specific (de)activation thresholds (fig. S10 andtable S2). This interplay provides the main knobby which the duration of mRNA expression isfinely tuned in response to different environmentalconditions (e.g., different salt concentrations) orto different genetic mutations.
In this study, we have identified a single quan-titative model to understand and predict STL1,CTT1, andHSP12 gene expression dynamics inresponse to various environmental and geneticperturbations. We generated a large range ofpossible model structures and developed a dy-namic single-cell assay with which to discriminateamong these model structures. We combinedthis experimental assay with discrete stochasticanalyses and parameter identification approaches.Our cross-validation analyses systematically elim-inated oversimplified and overcomplex modelstructures. We eventually selected the model struc-ture and parameters for a single best model topredict STL1, CTT1, and HSP12 dynamics. Fur-thermore, the identified model provides detailedinsight into the biophysical dynamics of signal-activated gene regulation. Because the presentedexperimental and computational tools are ap-plicable to any gene or signaling pathway, this
integrated identification approach can lead toinsights into complex cellular networks for otherorganisms.
References and Notes1. H. Y. Chuang, M. Hofree, T. Ideker, Annu. Rev. Cell Dev.
Biol. 26, 721 (2010).2. M. A. Schwartz, H. D. Madhani, Annu. Rev. Genet. 38,
725 (2004).3. V. M. Weake, J. L. Workman, Nat. Rev. Genet. 11, 426
(2010).4. A. Raj, C. S. Peskin, D. Tranchina, D. Y. Vargas, S. Tyagi,
PLoS Biol. 4, e309 (2006).5. J. M. Raser, E. K. O’Shea, Science 304, 1811 (2004).6. M. S. Ko, H. Nakauchi, N. Takahashi, EMBO J. 9, 2835
(1990).7. A. C. Cheung, P. Cramer, Nature 471, 249 (2011).8. C. Hodges, L. Bintu, L. Lubkowska, M. Kashlev,
C. Bustamante, Science 325, 626 (2009).9. H. Boeger, J. Griesenbeck, R. D. Kornberg, Cell 133, 716
(2008).10. W. Ma, A. Trusina, H. El-Samad, W. A. Lim, C. Tang, Cell
138, 760 (2009).11. C. Ferreira et al., Mol. Biol. Cell 16, 2068 (2005).12. S. Hohmann, Microbiol. Mol. Biol. Rev. 66, 300 (2002).13. P. Ferrigno, F. Posas, D. Koepp, H. Saito, P. A. Silver,
EMBO J. 17, 5606 (1998).14. P. Hersen, M. N. McClean, L. Mahadevan, S. Ramanathan,
Proc. Natl. Acad. Sci. U.S.A. 105, 7165 (2008).15. J. T. Mettetal, D. Muzzey, C. Gómez-Uribe,
A. van Oudenaarden, Science 319, 482 (2008).16. D. Muzzey, C. A. Gómez-Uribe, J. T. Mettetal,
A. van Oudenaarden, Cell 138, 160 (2009).17. S. Pelet et al., Science 332, 732 (2011).18. A. Raj, P. van den Bogaard, S. A. Rifkin, A. van Oudenaarden,
S. Tyagi, Nat. Methods 5, 877 (2008).19. A. M. Femino, F. S. Fay, K. Fogarty, R. H. Singer, Science
280, 585 (1998).20. S. L. Bumgarner et al., Mol. Cell 45, 470 (2012).21. J. M. Pedraza, J. Paulsson, Science 319, 339 (2008).
22. B. Munsky, B. Trinh, M. Khammash, Mol. Syst. Biol. 5,318 (2009).
23. B. Munsky, G. Neuert, A. van Oudenaarden, Science 336,183 (2012).
24. P. M. Alepuz, E. de Nadal, M. Zapater, G. Ammerer,F. Posas, EMBO J. 22, 2433 (2003).
25. B. Munsky, M. Khammash, J. Chem. Phys. 124, 044104(2006).
26. Using full mRNA distributions for fitting yieldssubstantially improved predictions (fig. S13) comparedto fitting with the procedure in (28) that uses onlymeans and variances.
27. Materials and methods are available as supplementarymaterials on Science Online.
28. C. Zechner et al., Proc. Natl. Acad. Sci. U.S.A. 109, 8340(2012).
Acknowledgments: This work was funded by the NSF(ECCS-0835847) and Human Frontier Science Program(RGP0061/2011) to M.K.; the NSF (ECCS-0835623), NationalInstitutes of Health–National Cancer Institute Physical SciencesOncology Center at Massachusetts Institute of Technology(U54CA143874), and an NIH Pioneer award (1DP1OD003936)to A.v.O.; Los Alamos National Laboratory–LaboratoryDirected Research and Development to B.M.; the DeutscheForschungsgemeinschaft (Forschungs Stipendium) to G.N.; andthe A*STAR program, Singapore, to R.Z.T. We thank F. van Wervenfor the yeast crosses and N. Hengartner, B. Pando, S. Klemm,J. van Zon, and M. Wall for discussions on the model. We alsothank M. Bienko, N. Crosetto, C. Engert, S. Itzkovitz, J. P. Junker,S. Klemm, S. Semrau, J. van Zon, and H. Youk for commentson the manuscript.
Supplementary Materialswww.sciencemag.org/cgi/content/full/339/6119/584/DC1Materials and MethodsFigs. S1 to S19Tables S1 and S2References (29–38)
12 October 2012; accepted 10 December 201210.1126/science.1231456
Molecular Mechanism of Actionof Microtubule-StabilizingAnticancer AgentsAndrea E. Prota,1 Katja Bargsten,1 Didier Zurwerra,2 Jessica J. Field,3 José Fernando Díaz,4
Karl-Heinz Altmann,2 Michel O. Steinmetz1*
Microtubule-stabilizing agents (MSAs) are efficacious chemotherapeutic drugs widely used forthe treatment of cancer. Despite the importance of MSAs for medical applications and basicresearch, their molecular mechanisms of action on tubulin and microtubules remain elusive.We determined high-resolution crystal structures of ab-tubulin in complex with two unrelated MSAs,zampanolide and epothilone A. Both compounds were bound to the taxane pocket of b-tubulinand used their respective side chains to induce structuring of the M-loop into a short helix.Because the M-loop establishes lateral tubulin contacts in microtubules, these findings explainhow taxane-site MSAs promote microtubule assembly and stability. Further, our results offerfundamental structural insights into the control mechanisms of microtubule dynamics.
Thebinding ofmicrotubule-stabilizing agents(MSAs) such as paclitaxel (Taxol, Bristol-Myers Squibb) to microtubules is gener-
ally thought to shift the assembly equilibrium oftubulin toward the polymeric state and to blockcell entry into mitosis by suppressing microtu-bule dynamics (1, 2). However, MSAs are alsoknown to induce microtubule polymerization un-der conditions in which tubulin does not assem-
ble spontaneously, suggesting a role in tubulinactivation (3, 4). To provide insights into the in-teractions of MSAs with tubulin and microtu-bules at the molecular level, we crystallized thecomplex between ab-tubulin (T), the stathmin-like protein RB3 (R), and tubulin tyrosine ligase(TTL) in the presence of either zampanolide(Zampa) or epothilone A (EpoA) (Fig. 1A) anddetermined the structures of the corresponding
protein-ligand complexes (T2R-TTL-Zampa andT2R-TTL-EpoA) at 1.8 and 2.3 Å resolution, re-spectively, by x-ray crystallography (fig. S1Aand table S1) (5). The two tubulin heterodimersin the T2R-TTL-MSA complexes were aligned ina head-to-tail fashion and assumed a curved con-formation. Their overall structures superimposedwell with the ones obtained in the absence of aMSA or of tubulin in complexwith RB3 alone (6)[root mean square deviation (RMSD) rangingfrom 0.1 to 0.6 Å over more than 650 Ca atoms],which suggests that the binding of MSAs andTTL does not induce major structural changes inthe T2R complex. Both Zampa and EpoA weredeeply buried in a pocket formed by predom-inantly hydrophobic residues of helix H7; b strandS7; and the loops H6-H7, S7-H9 [designatedthe M-loop (7)], and S9-S10 of b-tubulin—thispocket is commonly known as the taxane pocket(Fig. 1, B to D) (8, 9).
1Biomolecular Research, Paul Scherrer Institut, Villigen PSI,Switzerland. 2Department of Chemistry and Applied Biosci-ences, Institute of Pharmaceutical Sciences, Swiss FederalInstitute of Technology (ETH) Zürich, Zürich, Switzerland.3Centre for Biodiscovery, Victoria University of Wellington,Wellington, New Zealand. 4Chemical and Physical Biology,Centro de Investigaciones Biológicas, Consejo Superior deInvestigaciones Científicas CIB-CSIC, Madrid, Spain.
*To whom correspondence should be addressed. E-mail:[email protected]
www.sciencemag.org SCIENCE VOL 339 1 FEBRUARY 2013 587
REPORTS
on
Janu
ary
31, 2
013
ww
w.s
cien
cem
ag.o
rgD
ownl
oade
d fr
om

In the T2R-TTL-Zampa complex, the C-9atom of Zampa was covalently bound to the NE2atom of His229 of b-tubulin (fig. S1B), which isconsistent with mass spectrometry data (10). Inaddition, two hydrogen bonds were formed be-tween the OH20 group and the O1′ atom ofZampa, and the main-chain carbonyl oxygenand the NH group of Thr276, respectively. In theT2R-TTL-EpoA complex, the O1, OH3, OH7, andN20 groups of EpoA were hydrogen bonded toatoms of residues Thr276 (main-chain NH), Gln281
(side-chain amide nitrogen), Asp226 (side-chainoxygen), and Thr276 (side-chain hydroxyl group)of b-tubulin, respectively. The binding mode ofEpoA in the tubulin-EpoA structure is funda-mentally different from the one proposed basedon electron crystallography data of zinc-stabilizedtubulin sheets (fig. S2A); however, the orienta-tion of the ligand in the taxane pocket was am-biguous in the electron crystallography structurebecause the density of the ligand in experimen-tal omit maps was discontinuous (9, 11). In con-trast, the density of EpoA in our tubulin-EpoAx-ray crystal structure is very well defined andallowed the orientation of the ligand as well asits conformation to be defined unambiguously(fig. S1C).
A comparison of the tubulin-Zampa taxanepocket with that of tubulin-EpoA showed thatits conformation is very similar in both complexstructures (RMSD of 0.4 Å over 55 Ca atoms)and revealed that the side chains of Zampa andEpoA superimposed well (fig. S2B). In contrast,completely different sets of interactions wereestablished by the two MSAs to anchor their
macrolide core structures in the taxane pocket,with the planes of the macrocycles oriented at a~90° angle.
A hallmark of both the tubulin-Zampa andtubulin-EpoA complex structures was the pres-ence of a short helix formed by residues Arg278-Tyr283 in the M-loop of b-tubulin (Fig. 2A).This segment was largely disordered in the ab-sence of a MSA (Fig. 2B). In contrast, the othersecondary structure elements of the taxane pocketsuperimposed well between the ligand-boundand -unbound states, suggesting that the bindingof a MSA is not required to structure these partsof the pocket (RMSD of 0.2 Å over 77 Ca atoms).The helical conformation of the M-loop inducedupon ligand binding can be explained by thevarious hydrophobic and polar contacts estab-lished between the side chains of Zampa andEpoA, respectively, and residues of the M-loop(Fig. 1, C and D). The helix was further sta-bilized by a characteristic intramolecular hydro-gen bonding network formed by residues of theM-loop and helix H9 of b-tubulin (Fig. 2C).
The “curved” structure of tubulin in thetubulin-RB3 complex corresponds to the con-formation of unassembled, free tubulin (12, 13).In contrast, a “straight” conformation of tubulinis found in microtubules (8, 14). To assess pos-sible structural differences between the taxanepocket in unassembled tubulin and microtubules,we compared models of b-tubulin in the curved(T2R-TTL-Zampa) and straight (14) conforma-tional states. Superimposition of these structuresshowed that the overall architecture of the taxanepocket is only slightly affected by the curved-
to-straight structural rearrangements (RMSDof 1.1 Å over 73 Ca atoms) (Fig. 3A). This ob-servation is in agreement with biochemicalstudies suggesting that some MSAs can bind tounassembled and/or oligomeric forms of tubulin(10, 15). The stronger binding of MSAs to mi-crotubules can be explained by the disorderednature of the M-loop in unassembled tubulinin comparison to its structured state in micro-tubules (7, 16).
The M-loop of both a- and b-tubulin is acrucial element for lateral tubulin contacts be-tween protofilaments in microtubules in the ab-sence of ligands (7, 16). To provide structuralinsights into lateral tubulin contacts, we mod-eled the helical conformation of the M-loop inthe context of the microtubule lattice. For thispurpose, we used the straight tubulin structure(14) and cryogenic electron microscopy (cryo-EM) reconstructions of microtubules at ~8 Åresolution (7, 16). In contrast to the non-nativeM-loop conformation in zinc-stabilized tubulinsheets (14), the MSA-stabilized helical M-loopconformation of b-tubulin adequately explainsthe corresponding density of EM reconstruc-tions of microtubules (Fig. 3B). In our model,Tyr283 of the M-loop is inserted across proto-filaments into a pocket shaped by the S2′-S2′′b hairpin and the H2-S3 loop (residues Ala56,Thr57, Val62, Gln85, Arg88, Pro89, and Asp90) ofa neighboring b-tubulin subunit (Fig. 3C), sec-ondary structure elements that were not consider-ably affected by the curved-to-straight tubulinconformational transition (RMSD of 0.7 Å over91 Ca atoms) (Fig. 3A). In addition, the M-loop
Fig. 1. Tubulin-Zampa and tubulin-EpoA complex structures. (A)Chemical structure of Zampa and EpoA. (B) Overall view of thecomplex formed between tubulin (gray surface; M-loop in yellow)and Zampa (green spheres). The dashed box depicts the area shownin more detail in (C). (C and D) Close-up views of the interactionnetwork observed between Zampa [green sticks, (C)] or EpoA [lightgreen sticks, (D)] and b-tubulin (gray cartoon). Interacting residuesof b-tubulin are shown in stick representation. Oxygen and ni-trogen atoms are red and blue, respectively, and carbon atomsare green (Zampa and EpoA) or gray and yellow (b-tubulin). Hydrogen bondsare depicted as black dashed lines. The covalent bond between the C-9 atomof Zampa and the NE2 atom of His229 of b-tubulin is indicated by an orange
stick. Single-letter abbreviations for the amino acid residues are as follows:A, Ala; C, Cys; D, Asp; E, Glu; F, Phe; G, Gly; H, His; I, Ile; K, Lys; L, Leu; M, Met;N, Asn; P, Pro; Q, Gln; R, Arg; S, Ser; T, Thr; V, Val; W, Trp; and Y, Tyr.
1 FEBRUARY 2013 VOL 339 SCIENCE www.sciencemag.org588
REPORTS
on
Janu
ary
31, 2
013
ww
w.s
cien
cem
ag.o
rgD
ownl
oade
d fr
om

residues Ser280, Gln282, Arg284, and Ala285 werefavorably positioned to form additional con-tacts to the neighboring b-tubulin. The M-loopof a-tubulin in our tubulin-MSA complexeswas also stabilized in a similar helical confor-mation, in this case due to a crystal contact (fig.S3). In combination with molecular dynamicssimulations (17), these data collectively sug-gest that the disordered M-loops of both a- andb-tubulin exhibit an intrinsic propensity to forma helix that establishes lateral tubulin contactsin microtubules.
Our study provides fundamental structuralinformation on the molecular mechanism of ac-tion of MSAs (Fig. 3D). Apart from additionalglobal effects (17–19), a common feature of tu-bulin activation by MSAs is the formation of ashort helix in the M-loop of b-tubulin upon MSAbinding. As M-loop structuring is a crucial pre-
requisite for lateral tubulin interactions, this ef-fect explains how MSAs promote microtubuleassembly and stabilization. Our data further sug-gest that the intramolecular interaction networkthat stabilizes the M-loop helix of both a- andb-tubulin also forms in microtubules in the ab-sence of a ligand. We propose that the helicalstructuring of the M-loop facilitates the curved-to-straight conformational change that occurs uponincorporation of tubulin into microtubules. Inthis context, the binding of a MSA leads to tu-bulin preorganization according to the gross struc-tural requirements of the assembly process, thusreducing the entropy loss associated with micro-tubule formation. In turn, our model impliesthat dissolution of the helical structure of theM-loops is an early molecular event in the pro-cess of microtubule disassembly.
The high-resolution structural informationobtained for the tubulin-MSA complexes reportedhere opens the possibility for structure-guideddrug engineering. Whereas the structure-activityrelationship of epothilones has been exploredextensively (20) and one epothilone derivative,ixabepilone, has been approved by the U.S.
Food and Drug Administration for breast cancertreatment (21), little structure-activity work hasbeen reported on Zampa (22). Zampa exhibitsfavorable properties that could make it an attrac-tive lead compound (10). It is a very potent MSAthat exerts its action through covalent bindingto tubulin, which might provide superior activiyin the case of P-glycoprotein–mediated multidrugresistance.
References and Notes1. C. Dumontet, M. A. Jordan, Nat. Rev. Drug Discov. 9, 790
(2010).2. P. B. Schiff, J. Fant, S. B. Horwitz, Nature 277, 665
(1979).3. J. F. Díaz, J. M. Andreu, Biochemistry 32, 2747
(1993).4. J. F. Díaz, M. Menéndez, J. M. Andreu, Biochemistry 32,
10067 (1993).5. Materials and methods are available as supplementary
materials on Science Online.6. R. B. Ravelli et al., Nature 428, 198 (2004).7. E. Nogales, M. Whittaker, R. A. Milligan, K. H. Downing,
Cell 96, 79 (1999).8. E. Nogales, S. G. Wolf, K. H. Downing, Nature 391, 199
(1998).9. J. H. Nettles et al., Science 305, 866 (2004).
10. J. J. Field et al., Chem. Biol. 19, 686 (2012).
Fig. 2. Conformation of the M-loop of b-tubulin.(A and B) 2mFo-DFc (gray mesh, contoured at 1.0s)and mFo-DFc (green and red mesh, T3.0s) electrondensity maps of the region surrounding the M-loopof b-tubulin in the T2R-TTL-Zampa (A) and T2R-TTL(B) complexes. (C) Close-up view of the Zampa-inducedintramolecular interaction network that contributesto the stabilization of the M-loop helix.
Fig. 3. Lateral tubulin interactions in microtubules. (A) Superimposition of the taxane pocket (right)and M-loop–contacting secondary structure elements across protofilaments (left) in curved (T2R-TTL-Zampa; gray) and straight (PDP ID 1JFF; light blue) b-tubulin. (B) Cryo-EM map at 8.2 Å resolution of amicrotubule viewed from its luminal side (gray surface; Electron Microscopy Data Bank map 1788). Twochimeric molecules composed of straight b-tubulin (cartoon representation) and elements shaping thetaxane pocket in the curved tubulin-Zampa complex (A) are fitted in the map. (C) Close-up view of thelateral b-tubulin contact model shown in (B). (D) Proposed molecular mechanism of action of MSAs ontubulin and microtubules. (1) Binding of a MSA (rhomboid) to the taxane-site structures the disorderedM-loop of b-tubulin (dashed line) into a helix (cylinder). (2) The MSA-stabilized M-loop promotes tubulinpolymerization. (3) The M-loop helices of a- and b-tubulin are also formed in the context of themicrotubule in the absence of a ligand. (4) All taxane-site MSAs bind to tubulin in the microtubule tostabilize lateral contacts. For more details, see text.
www.sciencemag.org SCIENCE VOL 339 1 FEBRUARY 2013 589
REPORTS
on
Janu
ary
31, 2
013
ww
w.s
cien
cem
ag.o
rgD
ownl
oade
d fr
om

11. J. H. Nettles, K. H. Downing, Top. Curr. Chem. 286, 209(2009).
12. P. Ayaz, X. Ye, P. Huddleston, C. A. Brautigam, L. M. Rice,Science 337, 857 (2012).
13. L. Pecqueur et al., Proc. Natl. Acad. Sci. U.S.A. 109,12011 (2012).
14. J. Löwe, H. Li, K. H. Downing, E. Nogales, J. Mol. Biol.313, 1045 (2001).
15. M. Reese et al., Angew. Chem. Int. Ed. 46, 1864(2007).
16. F. J. Fourniol et al., J. Cell Biol. 191, 463 (2010).17. A. Mitra, D. Sept, Biophys. J. 95, 3252 (2008).18. C. Elie-Caille et al., Curr. Biol. 17, 1765 (2007).19. H. Xiao et al., Proc. Natl. Acad. Sci. U.S.A. 103, 10166
(2006).20. K.-H. Altmann, B. Pfeiffer, S. Arseniyadis, B. A. Pratt,
K. C. Nicolaou, ChemMedChem 2, 396 (2007).
21. R. J. Lechleider et al., Clin. Cancer Res. 14, 4378(2008).
22. D. Zurwerra et al., Chemistry 18, 16868 (2012).
Acknowledgments: We thank R. Kammerer, F. Winkler, andY. Barral for critical reading of the manuscript; V. de Lucasde Segovia for providing calf brains for tubulin purification;and V. Olieric and M. Wang for excellent technical assistancewith the collection of x-ray data at beamline X06SA and X06DAof the Swiss Light Source (Paul Scherrer Institut, Villigen,Switzerland). J.J.F. received a short-term fellowship from theEuropean Molecular Biology Organization and a ProfessionalDevelopment Grant from the Genesis Oncology Trust. Thiswork was supported by grants from the Ministerio de Economíay Competitividad (BIO2010-16351) and the ComunidadAutónoma de Madrid (S2010/BMD-2457) (to J.F.D.), a Ph.D.fellowship from the Roche Research Foundation (to D.Z.),
and grants from the Swiss National Science Foundation(310030B_138659) and the Swiss SystemsX.ch initiative(BIP-2011/122) (to M.O.S.). Coordinates have been depositedat the Protein Data Bank (PDB) under identification(ID) nos. 4I4T (T2R-TTL-Zampa), 4I50 (T2R-TTL-EpoA), and4I55 (T2R-TTL ).
Supplementary Materialswww.sciencemag.org/cgi/content/full/science.1230582/DC1Materials and MethodsFigs. S1 to S3Table S1References (23–30)
21 September 2012; accepted 4 December 2012Published online 3 January 2013;10.1126/science.1230582
A Strategy for Modulation of Enzymesin the Ubiquitin SystemAndreas Ernst,1 George Avvakumov,2 Jiefei Tong,3 Yihui Fan,4 Yanling Zhao,4 Philipp Alberts,3
Avinash Persaud,3,5 John R. Walker,2 Ana-Mirela Neculai,1 Dante Neculai,2 Andrew Vorobyov,1
Pankaj Garg,1 Linda Beatty,1 Pak-Kei Chan,6 Yu-Chi Juang,7 Marie-Claude Landry,7
Christina Yeh,7,8 Elton Zeqiraj,7 Konstantina Karamboulas,1 Abdellah Allali-Hassani,2
Masoud Vedadi,2 Mike Tyers,6,7 Jason Moffat,1,8,9,10 Frank Sicheri,7,8 Laurence Pelletier,7,8
Daniel Durocher,7,8 Brian Raught,10 Daniela Rotin,3,5 Jianhua Yang,4 Michael F. Moran,3,8,9
Sirano Dhe-Paganon,2,11 Sachdev S. Sidhu1,8,9,10*
The ubiquitin system regulates virtually all aspects of cellular function. We report a methodto target the myriad enzymes that govern ubiquitination of protein substrates. We usedmassively diverse combinatorial libraries of ubiquitin variants to develop inhibitors of fourdeubiquitinases (DUBs) and analyzed the DUB-inhibitor complexes with crystallography. Weextended the selection strategy to the ubiquitin conjugating (E2) and ubiquitin ligase (E3)enzymes and found that ubiquitin variants can also enhance enzyme activity. Last, we showed thatubiquitin variants can bind selectively to ubiquitin-binding domains. Ubiquitin variants exhibitselective function in cells and thus enable orthogonal modulation of specific enzymatic steps in theubiquitin system.
The biological importance of the ubiquitinsystem for protein posttranslational mod-ification rivals and may exceed that of
phosphorylation (1, 2). Consequently, there isgreat interest in deciphering the role of protein
ubiquitination and deubiquitination in both normaland disease states (1). Ubiquitin (Ub) is a small,highly conserved protein that is covalently con-jugated to proteins through a cascade of enzymeactivities, E1→E2→E3, which can be read by acohort of Ub-binding domains (UBDs) and re-versed by deubiquitinating enzymes (DUBs). Ubmonomers and chains of different linkages can beassembled on the substrate, and this complexcode can target the substrate for degradation bythe 26S proteasome or alter its interactions, lo-calization, or activity (3).
The 58 human ubiquitin-specific proteases(USPs) (4), which represent more than half of theknown DUBs, have attracted attention as poten-tial therapeutic targets (5, 6). Numerous USPshave been implicated in cancer and other pathol-ogies, including neurodegenerative, haematolog-ical, and infectious diseases (7–13). USPs arecysteine proteases that share a structurally con-served catalytic domain with a well-defined cat-alytic cleft (14). Thus, it may be possible todevelop a general structure-based strategy forinhibiting family members by using similar yetspecific molecular entities, as has been the casefor kinases that have been targeted with small
molecules built on common scaffolds (15). How-ever, only a few weak inhibitors of USPs or otherDUBs have been reported (16–18). The paucityof specific inhibitors for DUBs has hamperedattempts to understand and manipulate deubiqui-tination pathways for therapeutic benefit.
We developed a strategy to use Ub as a scaffoldto generate highly specific and potent inhibitorsof USPs and then extended the approach to targetother DUB families, E2 enzymes, E3 enzymes,and UBDs. USP substrates contain a proximalUbmoiety that is conjugated through its C-terminalcarboxyl group to a lysine in a target Ub or proteinsubstrate (19, 20). Despite low sequence similarity,USP catalytic domains share a common fold thatincludes a structurally conserved Ub-binding sitefor the proximal Ub.
To aid our inhibitor design strategy, we solvedthe structure of USP21 in complex with a suicide-substrate Ub moiety that forms a covalent bondbetween its C terminus and the catalytic cysteineof the enzyme (table S1) (21, 22). Superpositionof the Ub:USP21 complex structure with struc-tures of four other Ub:USP complexes showsthat Ub occupies a similar site on all five en-zymes (Fig. 1A). The contact surface betweenUb and the USPs is large; for example, 1835 and1645 Å2 are buried on the surfaces of Ub andUSP21, respectively. Approximately 75% of theUb-binding surface on USP21 is composed ofresidues that are not conserved within the USPfamily (Fig. 1B and fig. S1).
Because Ub binds to USPs with low affinitybut through a large contact area, we reasonedthat we should be able to make mutations inUb that optimize intermolecular contacts andenhance affinity for a particular USP. Becausethe Ub-binding sites of USPs vary in sequence,Ub variants that bind tightly to one USP shouldnot interact with other USPs. Tight binding Ubvariants should act as competitive inhibitorsof catalytic activity by blocking the recognition ofnatural ubiquitinated substrates. To test our hy-pothesis, we constructed combinatorial, phage-displayed libraries of Ub variants for selectionagainst different USPs and other Ub-associatedproteins.
We defined the USP-binding site as ~30 Ubresidues that make contact with USP21 in the
1Terrence Donnelly Center for Cellular and Biomolecular Re-search, University of Toronto, 160 College Street, Toronto,Ontario M5S 3E1, Canada. 2Structural Genomics Consortium,MaRS Centre, 101 College Street, Suite 700, Toronto, OntarioM5G 1L7, Canada. 3Hospital for Sick Children, 101 CollegeStreet, Toronto, Ontario M5G 1L7, Canada. 4Texas Children’sCancer Center, Department of Pediatrics, Dan L. Duncan CancerCenter, Baylor College of Medicine, Houston, TX 77030, USA.5Biochemistry Department, University of Toronto, Toronto,OntarioM5S3E1, Canada. 6Institut de Recherche en Immunologieet Cancérologie, Université de Montréal, Montreal, Quebec H3C3J7, Canada. 7Samuel Lunenfeld Research Institute, Mount SinaiHospital, 600 University Avenue, Toronto, Ontario M5G 1X5,Canada. 8Department of Molecular Genetics, University ofToronto, 160 College Street, Toronto, Ontario M5S 3E1, Canada.9Banting and Best Department of Medical Research, Uni-versity of Toronto, 160 College Street, Toronto, Ontario M5S3E1, Canada. 10Ontario Cancer Institute and McLaughlinCentre for Molecular Medicine, University of Toronto, 101 Col-lege Street, Toronto, Ontario M5G 1L7, Canada. 11Depart-ment of Physiology, University of Toronto, 101 College Street,Toronto, Ontario M5G 1L7, Canada.
*To whom correspondence should be addressed. E-mail:[email protected]
1 FEBRUARY 2013 VOL 339 SCIENCE www.sciencemag.org590
REPORTS
on
Janu
ary
31, 2
013
ww
w.s
cien
cem
ag.o
rgD
ownl
oade
d fr
om
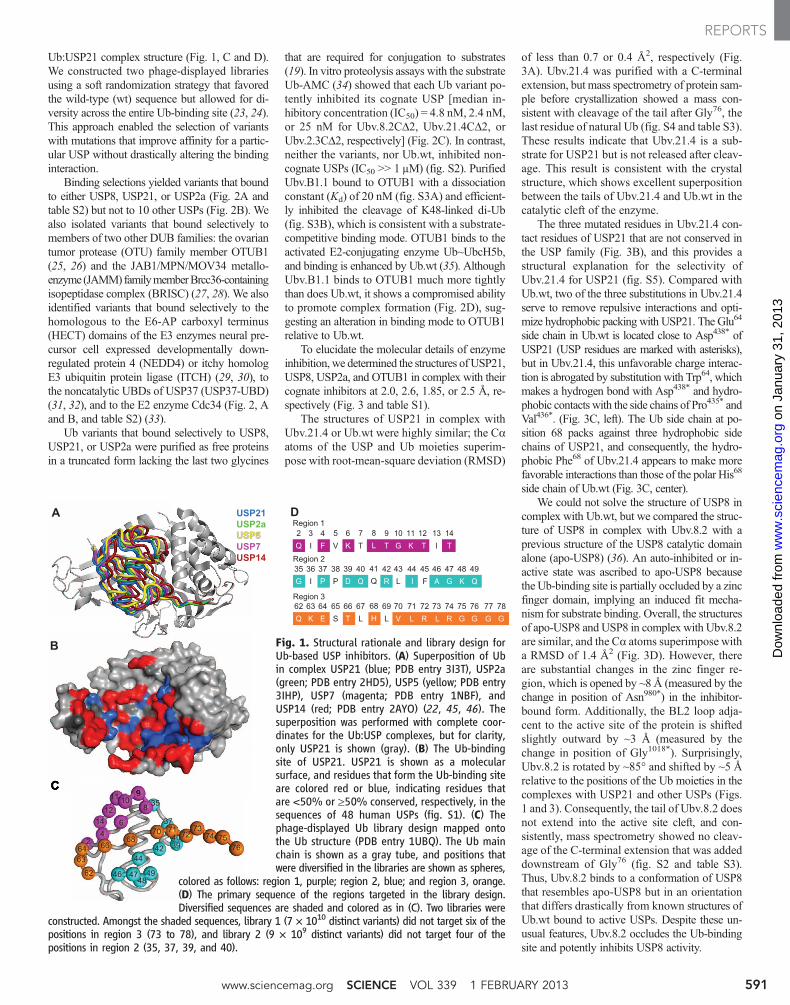
Ub:USP21 complex structure (Fig. 1, C and D).We constructed two phage-displayed librariesusing a soft randomization strategy that favoredthe wild-type (wt) sequence but allowed for di-versity across the entire Ub-binding site (23, 24).This approach enabled the selection of variantswith mutations that improve affinity for a partic-ular USP without drastically altering the bindinginteraction.
Binding selections yielded variants that boundto either USP8, USP21, or USP2a (Fig. 2A andtable S2) but not to 10 other USPs (Fig. 2B). Wealso isolated variants that bound selectively tomembers of two other DUB families: the ovariantumor protease (OTU) family member OTUB1(25, 26) and the JAB1/MPN/MOV34 metallo-enzyme (JAMM) familymemberBrcc36-containingisopeptidase complex (BRISC) (27, 28). We alsoidentified variants that bound selectively to thehomologous to the E6-AP carboxyl terminus(HECT) domains of the E3 enzymes neural pre-cursor cell expressed developmentally down-regulated protein 4 (NEDD4) or itchy homologE3 ubiquitin protein ligase (ITCH) (29, 30), tothe noncatalytic UBDs of USP37 (USP37-UBD)(31, 32), and to the E2 enzyme Cdc34 (Fig. 2, Aand B, and table S2) (33).
Ub variants that bound selectively to USP8,USP21, or USP2a were purified as free proteinsin a truncated form lacking the last two glycines
that are required for conjugation to substrates(19). In vitro proteolysis assays with the substrateUb-AMC (34) showed that each Ub variant po-tently inhibited its cognate USP [median in-hibitory concentration (IC50) = 4.8 nM, 2.4 nM,or 25 nM for Ubv.8.2CD2, Ubv.21.4CD2, orUbv.2.3CD2, respectively] (Fig. 2C). In contrast,neither the variants, nor Ub.wt, inhibited non-cognate USPs (IC50 >> 1 mM) (fig. S2). PurifiedUbv.B1.1 bound to OTUB1 with a dissociationconstant (Kd) of 20 nM (fig. S3A) and efficient-ly inhibited the cleavage of K48-linked di-Ub(fig. S3B), which is consistent with a substrate-competitive binding mode. OTUB1 binds to theactivated E2-conjugating enzyme Ub~UbcH5b,and binding is enhanced by Ub.wt (35). AlthoughUbv.B1.1 binds to OTUB1 much more tightlythan does Ub.wt, it shows a compromised abilityto promote complex formation (Fig. 2D), sug-gesting an alteration in binding mode to OTUB1relative to Ub.wt.
To elucidate the molecular details of enzymeinhibition, we determined the structures ofUSP21,USP8, USP2a, and OTUB1 in complex with theircognate inhibitors at 2.0, 2.6, 1.85, or 2.5 Å, re-spectively (Fig. 3 and table S1).
The structures of USP21 in complex withUbv.21.4 or Ub.wt were highly similar; the Caatoms of the USP and Ub moieties superim-pose with root-mean-square deviation (RMSD)
of less than 0.7 or 0.4 Å2, respectively (Fig.3A). Ubv.21.4 was purified with a C-terminalextension, but mass spectrometry of protein sam-ple before crystallization showed a mass con-sistent with cleavage of the tail after Gly76, thelast residue of natural Ub (fig. S4 and table S3).These results indicate that Ubv.21.4 is a sub-strate for USP21 but is not released after cleav-age. This result is consistent with the crystalstructure, which shows excellent superpositionbetween the tails of Ubv.21.4 and Ub.wt in thecatalytic cleft of the enzyme.
The three mutated residues in Ubv.21.4 con-tact residues of USP21 that are not conserved inthe USP family (Fig. 3B), and this provides astructural explanation for the selectivity ofUbv.21.4 for USP21 (fig. S5). Compared withUb.wt, two of the three substitutions in Ubv.21.4serve to remove repulsive interactions and opti-mize hydrophobic packing with USP21. The Glu64
side chain in Ub.wt is located close to Asp438* ofUSP21 (USP residues are marked with asterisks),but in Ubv.21.4, this unfavorable charge interac-tion is abrogated by substitution with Trp64, whichmakes a hydrogen bond with Asp438* and hydro-phobic contacts with the side chains of Pro435* andVal436*. (Fig. 3C, left). The Ub side chain at po-sition 68 packs against three hydrophobic sidechains of USP21, and consequently, the hydro-phobic Phe68 of Ubv.21.4 appears to make morefavorable interactions than those of the polar His68
side chain of Ub.wt (Fig. 3C, center).We could not solve the structure of USP8 in
complex with Ub.wt, but we compared the struc-ture of USP8 in complex with Ubv.8.2 with aprevious structure of the USP8 catalytic domainalone (apo-USP8) (36). An auto-inhibited or in-active state was ascribed to apo-USP8 becausethe Ub-binding site is partially occluded by a zincfinger domain, implying an induced fit mecha-nism for substrate binding. Overall, the structuresof apo-USP8 and USP8 in complex with Ubv.8.2are similar, and the Ca atoms superimpose witha RMSD of 1.4 Å2 (Fig. 3D). However, thereare substantial changes in the zinc finger re-gion, which is opened by ~8 Å (measured by thechange in position of Asn980*) in the inhibitor-bound form. Additionally, the BL2 loop adja-cent to the active site of the protein is shiftedslightly outward by ~3 Å (measured by thechange in position of Gly1018*). Surprisingly,Ubv.8.2 is rotated by ~85° and shifted by ~5 Årelative to the positions of the Ub moieties in thecomplexes with USP21 and other USPs (Figs.1 and 3). Consequently, the tail of Ubv.8.2 doesnot extend into the active site cleft, and con-sistently, mass spectrometry showed no cleav-age of the C-terminal extension that was addeddownstream of Gly76 (fig. S2 and table S3).Thus, Ubv.8.2 binds to a conformation of USP8that resembles apo-USP8 but in an orientationthat differs drastically from known structures ofUb.wt bound to active USPs. Despite these un-usual features, Ubv.8.2 occludes the Ub-bindingsite and potently inhibits USP8 activity.
Fig. 1. Structural rationale and library design forUb-based USP inhibitors. (A) Superposition of Ubin complex USP21 (blue; PDB entry 3I3T), USP2a(green; PDB entry 2HD5), USP5 (yellow; PDB entry3IHP), USP7 (magenta; PDB entry 1NBF), andUSP14 (red; PDB entry 2AYO) (22, 45, 46). Thesuperposition was performed with complete coor-dinates for the Ub:USP complexes, but for clarity,only USP21 is shown (gray). (B) The Ub-bindingsite of USP21. USP21 is shown as a molecularsurface, and residues that form the Ub-binding siteare colored red or blue, indicating residues thatare <50% or ≥50% conserved, respectively, in thesequences of 48 human USPs (fig. S1). (C) Thephage-displayed Ub library design mapped ontothe Ub structure (PDB entry 1UBQ). The Ub mainchain is shown as a gray tube, and positions thatwere diversified in the libraries are shown as spheres,
colored as follows: region 1, purple; region 2, blue; and region 3, orange.(D) The primary sequence of the regions targeted in the library design.Diversified sequences are shaded and colored as in (C). Two libraries were
constructed. Amongst the shaded sequences, library 1 (7 × 10¹⁰ distinct variants) did not target six of thepositions in region 3 (73 to 78), and library 2 (9 × 10⁹ distinct variants) did not target four of thepositions in region 2 (35, 37, 39, and 40).
www.sciencemag.org SCIENCE VOL 339 1 FEBRUARY 2013 591
REPORTS
on
Janu
ary
31, 2
013
ww
w.s
cien
cem
ag.o
rgD
ownl
oade
d fr
om

Nine of the 12 mutated residues in Ubv.8.2make contacts with USP8, and 70% of thesecontacts involve nonconserved residues in theUSP family (Fig. 3E), likely accounting for thehigh specificity of Ubv.8.2 for USP8 (Fig. 2B).The tail of Ubv.8.2 contains three mutated con-tact residues (Ala66, Tyr68, and Leu70) and in-teracts with an a-helix formed by residues 870*to 882* of USP8 (Fig. 3F, left). A second clus-ter of contacts involving mutated residues isformed by the interactions of Arg2, Val4, Ile14,and His64 with residues 891* to 895* (Fig. 3F,center). The remaining two mutated contact resi-dues (Met9 and Arg11) are in close proximity(Fig. 3F, right).
The structures of USP2a in complex with Ub.wt or Ubv.2.3 are highly similar (Fig. 3G) be-cause the Ca atoms of the USP and Ub moietiessuperimpose with a RMSD of 1.0 or 0.3 Å, re-spectively. The three mutated residues in Ubv.2.3make contacts with residues that are not con-served in the USP family (Fig. 3H), again ex-plaining the selectivity. Relative to Ub.wt, thethree substitutions alter hydrogen-bonding pat-terns (Fig. 3I). Whereas Lys6 of Ub.wt formed ahydrogen bond with Asp466*, Asn6 of Ubv.2.3forms a hydrogen bond with Lys503* (Fig. 3I, left).Consequently, Asp466* reorients and forms a hy-drogen bond with His12 of Ubv.2.3 (Fig. 3I,middle).
The structure of the OTUB1 OTU domain(OTUB145–271) in complex with Ubv.B1.1 (tableS1) reveals that Ubv.B1.1 binds to the distal Ub-binding site of OTUB1 (Fig. 3J) and enables arationalization of its altered binding and allo-steric properties. Compared with a previouslypublished Ub~UbcH5b-OTUB1-Ub complexstructure (35), Ubv.B1.1 is rotated by 22° rela-tive to the distal site Ub.wt (Fig. 3J). This de-viation in binding mode may account for thecompromised ability to allosterically promotebinding of Ub~UbcH5b to OTUB1. Four of thesix mutated residues in Ubv.B1.1 are in contactwith OTUB1 (Fig. 3K) and bind to a turn motifconnecting a8 and a9 of OTUB1. Most prom-inent in this interaction are Leu44, Arg47, andTyr68, which improve polar and hydrophobiccontacts. Arg47 establishes hydrogen bonds tofour main chain carbonyl groups in the turn mo-tif (Fig. 3L, left), whereas Tyr68 makes favorablepacking interactions with His192* and Phe193*
(Fig. 3L, middle). Leu44 establishes van der Waalscontacts with the peptide bonds of the a8:a9 loop(Fig. 3L, right). These results demonstrate thathigh-affinity Ub variants can be developed againstspecific UBDs.
We investigated the in vivo effects of dif-ferent variants expressed as C-terminal fusionswith Flag-tagged green fluorescent protein inmammalian cells. Mass spectrometric analysisof associated proteins showed that each inhib-itor interacted specifically with its cognate USP(table S4).
Ubiquitinated receptor-interacting protein1 (RIP1) is a positive regulator of nuclear factor
kB (NF-kB) activation induced by tissue necrosisfactor–a (TNFa), and in turn, USP21 has beenshown to down-regulate TNFa-induced NF-kB ac-tivation by deubiquitinatingRIP1 (37). Ubv.21.4CD2coimmunoprecipitated with USP21 in cotrans-fected human embryonic kidney (HEK) 293Tcells (Fig. 4A), blocked the deubiquitination ofRIP1 by USP21 (Fig. 4B), and restored NF-kBactivation (Fig. 4C). No such effects were ob-served when Ub.wt was cotransfected rather
than Ubv.21.4CD2. These results show thatUbv.21.4CD2 binds and inhibits USP21 in cellsand establish that Ub variants can act as or-thogonal genetic probes of USP function.
USP8 regulates ligand-mediated endocyto-sis of several receptors (38–40), including theepidermal growth factor receptor (EGFR), de-ubiquitination of which protects it from degra-dation in lysosomes (38). ImmunoprecipitatedUbv.8.2CD2, but not Ub.wtCD2, was associated
A
C
Ub 2 4 6 8 9 10 11 12 14 42 44 46 47 48 49 62 63 64 66 68 70 71 72 73 74 76 77 78wt Q F K L T G K T T R I A G K Q Q K E T H V L R L R G G G
Region1 Region 2 Region 3
0
20
40
60
80
100
US
P A
ctiv
ity (
%)
(Ub variant) [nM]
0.1 1 10 100 103
B
Opt
ical
den
sity
(45
0 nm
)
0
0.5
1
1.5
2
2.5
Ubv.8.2 Ubv.21.4 Ubv.2.3 Ubv.B1.1 Ubv.BR.1 Ubv.N.2 Ubv.IT.1 Ubv.37.1 Ub.wt
USP2a USP5 USP7 USP8 USP9x USP9y USP10 USP14
USP16 USP21 USP48 OTUB1 BRISC NEDD4 ITCH USP37-UBD
75G
8.2 R V - - M - R - I - - - - - - H N H A Y L - K - - - - - -21.4 - - - - - - - - - - - - - - - - - W - F L - - - - - - - -
2.3 - - N - S - - H - - - - - - - - - - - - - - - - -- - - -B1.1 - - - - - - - - - K L - R - - H - - F Y - - - - - - - - -
37.1 - - - I - A - - Y - - - - - - - - Q R Y L F Q - - - - - -
BR.1 L - N F P - P - - - S - Y - K K - M - - L - - V - F S Q-
N.2 - - - M R R E S S - F T - - - - - - - - - K - - P R Q Y-
IT.1 P L - - R - Q S I F - - R - H - - R - Y F - - F H M V A-
R1.2 L - N - - P P - - S F - - - - Y E Y R L W Y - R L T D KR
USP2aUbv.2.3C∆2
IC50 = 25 nM ± 3.4
USP8Ubv.8.2C∆2
IC50 = 4.8 nM ± 0.4
USP21Ubv.21.4C∆2
IC50 = 2.4 nM ± 0.3 0
0.5
1
1.5
2
2.5
3
3.5
4
Ub.wt
Ubv.B1.1
no Ub
EC50 = 11.1 µM ± 1.3
EC50 = 2.0 µM ± 0.2
EC50 n/d
(OTUB1) [µM]
0 5 10 15 20 25
Rel
ativ
e F
luor
esce
nce
(520
/490
)
D
Fig. 2. Selective binding of Ub variants to DUBs, Ub ligases, and UBDs, and inhibition of DUBfunction in vitro. (A) Sequence alignment of Ub.wt and representative Ub variants selected forbinding to USP8 (8.2), USP21 (21.4), USP2a (2.3), OTUB1 (B1.1), the BRISC protein complex (BR.1),NEDD4 (N.2), ITCH (IT.1), USP37-UBD (37.1), or Cdc34 (R1.2). The alignment shows only thosepositions that were diversified in the Ub library, and positions that were conserved as the wt sequenceare indicated by dashes. A complete list of selected variants is provided in table S2. (B) Ub variantsbind selectively to their cognate targets, as shown by phage enzyme-linked immunosorbent assays forbinding to the following immobilized proteins (color coded as indicated in the panel): USP2a, USP5,USP7, USP8, USP9x, USP9y, USP10, USP14, USP16, USP21, USP48, OTUB1, BRISC, NEDD4, ITCH,and USP37-UBD. Bound phage were detected spectrophotometrically (optical density at 450 nm),and background binding to neutravidin was subtracted from the signal. (C) Inhibition of USP2a,USP28, or USP21 shown as dose-response curves for Ub variants. The IC50 value was determined asthe concentration of Ub variant that reduced USP activity by 50%. (D) The effects of Ubv.B1.1 or Ub.wt on binding of OTUB1 to Ub~UbcH5B measured as relative fluorescence by means of time-resolvedFörster-energy transfer. The median effective concentration (EC50) value is defined as the half-maximal effective concentration of OTUB1.
1 FEBRUARY 2013 VOL 339 SCIENCE www.sciencemag.org592
REPORTS
on
Janu
ary
31, 2
013
ww
w.s
cien
cem
ag.o
rgD
ownl
oade
d fr
om

with endogenousUSP8 (Fig. 4D). EGF-stimulatedubiquitination of EGFR in transfected HEK293cells that express large amounts of Flag-taggedEGFR (~106/cell) (41) was greater in cells express-ingUbv.8.2CD2 than in cells expressingUb.wtCD2(Fig. 4E). Expression of Ubv.8.2CD2 in HEK293cells, but not Ub.wtCD2, resulted in more rapiddown-regulation of endogenous EGFR in response
to a low dose (5 ng/ml) of EGF (Fig. 4F), whichis the expected outcome of USP8 inhibition(38, 42). These data illustrate that Ubv.8.2CD2can modulate EGFR ubiquitination over a broadrange of receptor densities.
Confocal microscopy of cells expressingUbv.8.2CD2 or Ub.wtCD2 (fig. S6) showed nodifference in the colocalization of EGFR with
the early endosomal antigen 1 (EEA1), indicat-ing that endosomal uptake of EGFR in responseto EGF stimulation was not affected by the Ubvariant (Fig. 4G). However, Ubv.8.2CD2, butnot Ub.wtCD2, resulted in greater colocaliza-tion of EGFR with the lysosome-associatedprotein 1 (LAMP1) and correspondingly lesscolocalization with the endosomal recycling
Fig. 3. Molecular basis for DUB inhibition by Ub variants. (A) Superpositionof USP21 (yellow) in complex with Ubv.21.4 (purple) and USP21 (gray) incomplex with Ub.wt (blue). (B) Surface representation of the Ub-binding site ofUSP21 in complex with Ubv.21.4 (wheat tube). Residues in Ubv.21.4 that aremutated relative to Ub.wt are shown as colored sticks, and residues on theUSP21 surface that make contact with these residues are colored red or blue ifthey are <50% or ≥50% conserved in the sequences of 48 human USPs,respectively. (C) Details of the superposition of USP21 in complex Ubv.21.4 orUb.wt, showing the changes in molecular interactions caused by the mutationsat positions 64 (left), 68 (center), and 70 (right). The Ubv.21.4 side chains arecolored as in (B), and Ub.wt side chains are colored blue. Main chains andUSP21 side chains are colored as in (A). Residues are numbered according tothe PDB files, and asterisks indicate USP residues. (D) Superposition of USP8(yellow) in complex with Ubv.8.2 (purple) and apo-USP8 (gray). Dashed ovalsdemarcate structural changes in the zinc finger region (red) or the BL2 loop(black) of USP8. (E) Surface representation of the Ub-binding site of USP8 incomplex with Ubv.8.2 (wheat tube). Residues in Ubv.8.2 that are mutatedrelative to Ub.wt and make contact with USP8 are shown as colored sticks, andresidues on the USP8 surface that make contact with these residues arecolored red or blue, as in (B). (F) Details of USP8 in complex with Ubv.8.2,showing molecular interactions involving residues in Ubv.8.2 that are mutatedrelative to Ub.wt and are in contact with USP8. The Ubv.8.2 side chains are
colored as in (E). Main chains and USP8 side chains are colored as in (D). (G)Superposition of USP2a (yellow) in complex with Ubv.2.3 (purple) and USP2a(gray) in complex with Ub.wt (blue). (H) Surface representation of the Ub-binding site of USP2a in complex with Ubv.2.3 (wheat tube). Residues inUbv.2.3 that are mutated relative to Ub.wt are shown as colored sticks, andresidues on the USP2a surface that make contact with these residues arecolored red or blue, as in (B). (I) Details of the superposition of USP2a incomplex with Ubv.2.3 or Ub.wt, showing changes in molecular interactionscaused by the mutations at positions 6 (left), 12 (center), and 9 (right). TheUbv.2.3 side chains are colored as in (H). Main chains and USP2a side chainsare colored as in (G). (J) Superposition of OTUB1 (yellow) in complex with Ubv.B1.1 (purple) and OTUB1 (gray) in complex with distal Ub.wt (blue) and an E2-Ub covalent conjugate consisting of E2 conjugating enzyme UbcH5b (red) andUb.wt (green). (K) Surface representation of the Ub-binding site of OTUB1in complex with Ubv.B1.1 (wheat tube). Residues in Ubv.B1.1 that aremutated relative to Ub.wt are shown as colored sticks, and residues on theOTUB1 surface that are in contact with these residues are colored red. (L)Details of the superposition of OTUB1 in complex with Ubv.B1.1 or Ub.wt,showing changes in molecular interactions caused by the mutations atpositions 47 (left), 66 and 68 (center), and 42 and 44 (right). The Ubv.B1.1side chains are colored as in (K). Main chains and OTUB1 side chains arecolored as in (J).
www.sciencemag.org SCIENCE VOL 339 1 FEBRUARY 2013 593
REPORTS
on
Janu
ary
31, 2
013
ww
w.s
cien
cem
ag.o
rgD
ownl
oade
d fr
om
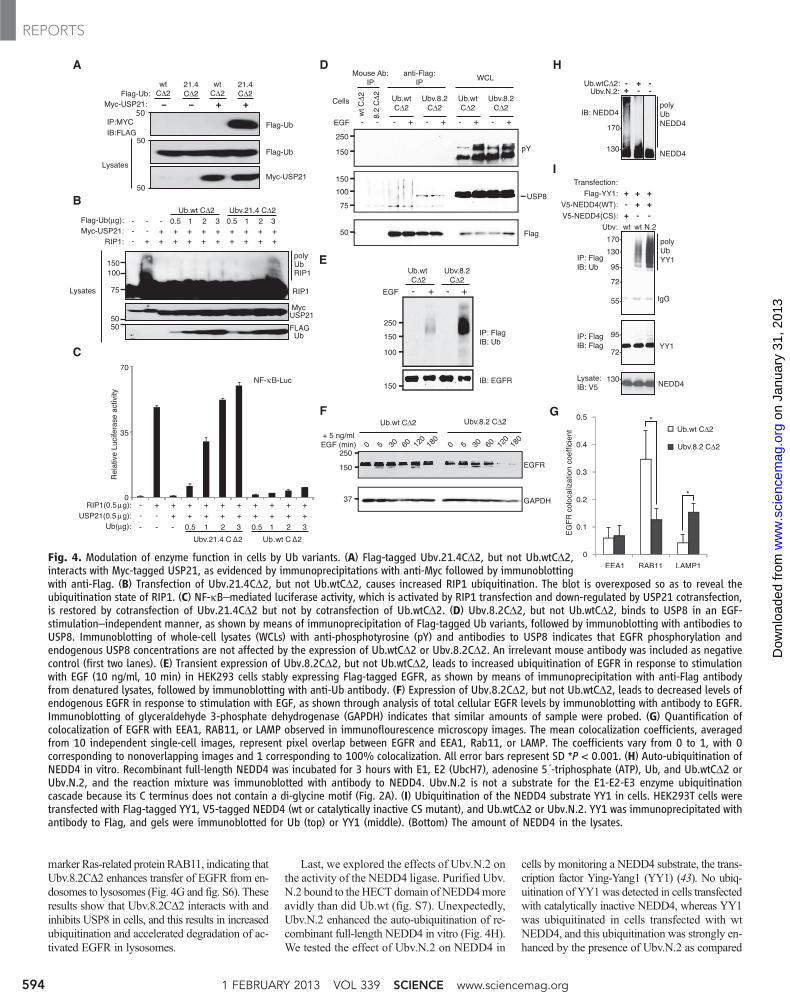
marker Ras-related protein RAB11, indicating thatUbv.8.2CD2 enhances transfer of EGFR from en-dosomes to lysosomes (Fig. 4G and fig. S6). Theseresults show that Ubv.8.2CD2 interacts with andinhibits USP8 in cells, and this results in increasedubiquitination and accelerated degradation of ac-tivated EGFR in lysosomes.
Last, we explored the effects of Ubv.N.2 onthe activity of the NEDD4 ligase. Purified Ubv.N.2 bound to the HECT domain of NEDD4moreavidly than did Ub.wt (fig. S7). Unexpectedly,Ubv.N.2 enhanced the auto-ubiquitination of re-combinant full-length NEDD4 in vitro (Fig. 4H).We tested the effect of Ubv.N.2 on NEDD4 in
cells by monitoring a NEDD4 substrate, the trans-cription factor Ying-Yang1 (YY1) (43). No ubiq-uitination of YY1was detected in cells transfectedwith catalytically inactive NEDD4, whereas YY1was ubiquitinated in cells transfected with wtNEDD4, and this ubiquitination was strongly en-hanced by the presence of Ubv.N.2 as compared
Fig. 4. Modulation of enzyme function in cells by Ub variants. (A) Flag-tagged Ubv.21.4CD2, but not Ub.wtCD2,interacts with Myc-tagged USP21, as evidenced by immunoprecipitations with anti-Myc followed by immunoblottingwith anti-Flag. (B) Transfection of Ubv.21.4CD2, but not Ub.wtCD2, causes increased RIP1 ubiquitination. The blot is overexposed so as to reveal theubiquitination state of RIP1. (C) NF-kB–mediated luciferase activity, which is activated by RIP1 transfection and down-regulated by USP21 cotransfection,is restored by cotransfection of Ubv.21.4CD2 but not by cotransfection of Ub.wtCD2. (D) Ubv.8.2CD2, but not Ub.wtCD2, binds to USP8 in an EGF-stimulation–independent manner, as shown by means of immunoprecipitation of Flag-tagged Ub variants, followed by immunoblotting with antibodies toUSP8. Immunoblotting of whole-cell lysates (WCLs) with anti-phosphotyrosine (pY) and antibodies to USP8 indicates that EGFR phosphorylation andendogenous USP8 concentrations are not affected by the expression of Ub.wtCD2 or Ubv.8.2CD2. An irrelevant mouse antibody was included as negativecontrol (first two lanes). (E) Transient expression of Ubv.8.2CD2, but not Ub.wtCD2, leads to increased ubiquitination of EGFR in response to stimulationwith EGF (10 ng/ml, 10 min) in HEK293 cells stably expressing Flag-tagged EGFR, as shown by means of immunoprecipitation with anti-Flag antibodyfrom denatured lysates, followed by immunoblotting with anti-Ub antibody. (F) Expression of Ubv.8.2CD2, but not Ub.wtCD2, leads to decreased levels ofendogenous EGFR in response to stimulation with EGF, as shown through analysis of total cellular EGFR levels by immunoblotting with antibody to EGFR.Immunoblotting of glyceraldehyde 3-phosphate dehydrogenase (GAPDH) indicates that similar amounts of sample were probed. (G) Quantification ofcolocalization of EGFR with EEA1, RAB11, or LAMP observed in immunoflourescence microscopy images. The mean colocalization coefficients, averagedfrom 10 independent single-cell images, represent pixel overlap between EGFR and EEA1, Rab11, or LAMP. The coefficients vary from 0 to 1, with 0corresponding to nonoverlapping images and 1 corresponding to 100% colocalization. All error bars represent SD *P < 0.001. (H) Auto-ubiquitination ofNEDD4 in vitro. Recombinant full-length NEDD4 was incubated for 3 hours with E1, E2 (UbcH7), adenosine 5´-triphosphate (ATP), Ub, and Ub.wtCD2 orUbv.N.2, and the reaction mixture was immunoblotted with antibody to NEDD4. Ubv.N.2 is not a substrate for the E1-E2-E3 enzyme ubiquitinationcascade because its C terminus does not contain a di-glycine motif (Fig. 2A). (I) Ubiquitination of the NEDD4 substrate YY1 in cells. HEK293T cells weretransfected with Flag-tagged YY1, V5-tagged NEDD4 (wt or catalytically inactive CS mutant), and Ub.wtCD2 or Ubv.N.2. YY1 was immunoprecipitated withantibody to Flag, and gels were immunoblotted for Ub (top) or YY1 (middle). (Bottom) The amount of NEDD4 in the lysates.
1 FEBRUARY 2013 VOL 339 SCIENCE www.sciencemag.org594
REPORTS
on
Janu
ary
31, 2
013
ww
w.s
cien
cem
ag.o
rgD
ownl
oade
d fr
om

with Ub.wtCD2 (Fig. 4I). NEDD4 is auto-inhibitedby intramolecular protein-protein interactions(44), and it is likely that Ubv.N.2 alleviates thisinhibition.
Through engineered optimization of the low-affinity interactions between Ub and enzymesof the ubiquitin system, we were able to devel-op potent and selective modulators of ubiquitinsystem activity. Structural analyses explainedthe higher affinity of the Ub variants and un-derscored the plasticity of the Ub fold as a rec-ognition scaffold. Ub variants cause target-specific effects on enzyme activity and can actas simple competitive inhibitors in the case ofsome USPs, as both a competitive inhibitor ofcatalytic function and an allosteric attenuatorof Ub~UbcH5b docking in the case of OTUB1,or as enhancers of ubiquitin ligase activity inthe case of NEDD4.
Collectively, these results show that the dy-namic interactions of Ub can be harnessed todevelop selective modulators of major enzymeclasses in the ubiquitin system. Our findingsillustrate a previously unappreciated feature ofubiquitin itself, namely that the extreme sequenceconservation of ubiquitin is likely dictated bythe constraints of low-affinity interactions withhundreds of partners, few if any of which cantolerate mutational drift toward higher-affinityinteraction. As we illustrate here, Ub variantswill serve as useful genetic probes to assess andmodulate ubiquitin system function in vivo.Applications of Ub variants in drug discoverywill include target validation, competition-basedscreening assays, and structure-guided designof small-molecule mimetics of the stabilized Ub-target interface.
References and Notes1. P. Cohen, M. Tcherpakov, Cell 143, 686 (2010).2. D. Komander, Biochem. Soc. Trans. 37, 937 (2009).3. D. Komander, M. Rape, Annu. Rev. Biochem. 81, 203
(2012).4. S. M. B. Nijman et al., Cell 123, 773 (2005).5. Y. L. Yang, J. Kitagaki, H. Wang, D. X. Hou, A. O. Perantoni,
Cancer Sci. 100, 24 (2009).6. L. Daviet, F. Colland, Biochimie 90, 270 (2008).7. M. J. Edelmann, B. M. Kessler, Biochim. Biophys. Acta
1782, 809 (2008).
8. S. Hussain, Y. Zhang, P. J. Galardy, Cell Cycle 8, 1688(2009).
9. J. M. Grunda et al., J. Neurooncol. 80, 261 (2006).10. X. Zhang, F. G. Berger, J. Yang, X. Lu, EMBO J. 30, 2177
(2011).11. J. M. Cummins, B. Vogelstein, Cell Cycle 3, 687
(2004).12. M. Y. Li, C. L. Brooks, N. Kon, W. Gu, Mol. Cell 13, 879
(2004).13. C. Priolo et al., Cancer Res. 66, 8625 (2006).14. D. Komander, M. J. Clague, S. Urbé, Nat. Rev. Mol. Cell
Biol. 10, 550 (2009).15. O. Fedorov et al., Proc. Natl. Acad. Sci. U.S.A. 104,
20523 (2007).16. F. Colland, Biochem. Soc. Trans. 38, 137 (2010).17. B. H. Lee et al., Nature 467, 179 (2010).18. V. Kapuria et al., Cancer Res. 70, 9265 (2010).19. C. M. Pickart, M. J. Eddins, Biochim. Biophys. Acta 1695,
55 (2004).20. W. Li, Y. Ye, Cell. Mol. Life Sci. 65, 2397 (2008).21. K. D. Wilkinson, T. Gan-Erdene, N. Kolli, Methods
Enzymol. 399, 37 (2005).22. M. Hu et al., Cell 111, 1041 (2002).23. F. A. Fellouse, G. Pal, in Phage Display in
Biotechnology and Drug Discovery, S. S. Sidhu,Ed. (Taylor and Francis Group, Boca Raton,FL, 2005), vol. 3, pp. 111–142.
24. S. S. Sidhu et al., in Methods in Enzymology(Academic Press, 2000), vol. 328, pp. 333–IN5.
25. M. J. Edelmann et al., Biochem. J. 418, 379(2009).
26. S. Nakada et al., Nature 466, 941 (2010).27. E. M. Cooper, J. D. Boeke, R. E. Cohen, J. Biol. Chem.
285, 10344 (2010).28. E. M. Cooper et al., EMBO J. 28, 621 (2009).29. W. L. Perry et al., Nat. Genet. 18, 143 (1998).30. G. Melino et al., Cell Death Differ. 15, 1103 (2008).31. J. H. Hurley, S. Lee, G. Prag, Biochem. J. 399, 361
(2006).32. X. Huang et al., Mol. Cell 42, 511 (2011).33. D. M. Wenzel, K. E. Stoll, R. E. Klevit, Biochem. J. 433,
31 (2010).34. L. C. Dang, F. D. Melandri, R. L. Stein, Biochemistry
37, 1868 (1998).35. Y.-C. Juang et al., Mol. Cell 45, 384 (2012).36. G. V. Avvakumov et al., J. Biol. Chem. 281, 38061
(2006).37. G. F. Xu et al., J. Biol. Chem. 285, 969 (2010).38. I. Berlin, H. Schwartz, P. D. Nash, J. Biol. Chem.
285, 34909 (2010).39. C. M. Balut, C. M. Loch, D. C. Devor, FASEB J. 25,
3938 (2011).40. I. M. J. Meijer, J. E. M. van Leeuwen, Cell. Signal.
23, 458 (2011).41. J. Tong, P. Taylor, S. M. Peterman, A. Prakash,
M. F. Moran, Mol. Cell. Proteomics 8, 2131 (2009).42. S. Niendorf et al., Mol. Cell. Biol. 27, 5029 (2007).
43. A. Persaud et al., Mol. Syst. Biol. 5, 333 (2009).44. S. Wiesner et al., Cell 130, 651 (2007).45. M. Renatus et al., Structure 14, 1293 (2006).46. M. Hu et al., EMBO J. 24, 3747 (2005).
Acknowledgments: The authors thank I. Pot and J.J. Adamsfor helpful comments on the manuscript and Y. Li for cloningprotease constructs. This project was supported by operatinggrants from the Canadian Institutes for Health Research toS.S.S. (MOP-111149), D.R. (MOP-13494), F.S., M.T.(MOP-57795), and M.F.M. (MOP-102536). J.Y. receivesfunding from a NIH–National Institute of NeurologicalDisorders and Stroke grant (1R01NS072420-01). F.S., D.R.,M.T., and M.F.M. hold Canada Research Chairs (Tier 1) inStructural Principles of Signal Transduction, CanadianFoundation for Innovation, Systems and Synthetic Biology, andMolecular Signatures, respectively. The Structural GenomicsConsortium is a registered charity (number 1097737) thatreceives funds from the Canadian Institutes for HealthResearch, the Canada Foundation for Innovation, GenomeCanada through the Ontario Genomics Institute, GlaxoSmithKline,Karolinska Institutet, the Knut and Alice WallenbergFoundation, the Ontario Innovation Trust, the Ontario Ministryfor Research and Innovation, Merck & Co., the NovartisResearch Foundation, the Swedish Agency for InnovationSystems, the Swedish Foundation for Strategic Research, andthe Wellcome Trust. The funders had no role in studydesign, data collection and analysis, decision to publish, orpreparation of the manuscript. A.E., G.A., S.D., and S.S.S.designed the study. A.E., A.V., P.G., and L.B. performed phagedisplay selections, protein purification, and in vitro inhibitionassays. G.A., A.-M.N., D.N., J.W., Y.-C.J., and S.D. purifiedproteins used in this study and solved all the crystal structures.J.T. and M.F.M. performed intracellular USP8 inhibitionexperiments. Y.F., Y.Z., and J.Y. performed intracellular USP21inhibition experiments. Y.-C.J., M.-C.L., C.Y., E.Z, F.S., L.P., M.T.,and D.D. purified proteins used as targets for phage displayselections. K.K. and J.M. performed initial intracellularcharacterizations of Ub variants. A.A.-H. and M.V. performedin vitro enzymatic assays. P.-K.C. and B.R. provided Ub variantsexpressing stable cell lines and performed mass spectrometryexperiments. P.A., A.P., and D.R. performed NEDD4ubiquitination experiments; A.E. and S.S.S. analyzed data,prepared figures, and wrote the paper. S.S.S., L.B., and A.E.are inventors on a pending patent, “Specific Active Site Inhibitorsof Enzymes or Substrate Binding Partners and Methods ofProducing the Same” (PCT/US11/39601).
Supplementary Materialswww.sciencemag.org/cgi/content/full/science.1230161/DC1Materials and MethodsSupplementary TextFigs. S1 to S7Tables S1 to S5References (47–69)
13 September 2012; accepted 7 December 2012Published online 3 January 2013;10.1126/science.1230161
www.sciencemag.org SCIENCE VOL 339 1 FEBRUARY 2013 595
REPORTS
on
Janu
ary
31, 2
013
ww
w.s
cien
cem
ag.o
rgD
ownl
oade
d fr
om

Electronically submit your new product description or product literature information! Go to www.sciencemag.org/products/newproducts.dtl for more information.
LASER SHUTTERSSafeClose laser shutters, based on the proven rotor drive actuation tech-nology modified to close on power down. The proprietary Rotor Drive actuator provides a reliable, multimillion-cycle operation and ability to withstand harsh environmental conditions, including wide temperature variations (from -40°C to +70°C), high shock, and vibration in a clean environment. Designed for laser safety and laser switching, the Safe-Close shutter was designed to be highly reliable and to always maintain laser safe conditions by closing automatically when power is interrupt-ed. The fail-safe magnetic return mechanism guarantees that the blade will reliably close upon signal interruption. The SafeClose shutter does not require a separate controller and a simple 9V DC signal is suffi-cient to actuate the shutter and hold it open. With its small diameter/aperture, SafeClose shutters work efficiently with small beam diameter lasers and provided with a standard gold-plated blade design for high laser damage thresholds. CVI MELLES GRIOT For info: 505-296-9541 www.cvimellesgriot.com
DIGITAL PCR SYSTEMThe QuantStudio 3D Digital PCR System is a scalable, chip-based in-strument that features a simple workflow with minimal hands-on time. Designed with a scalable architecture, the QuantStudio 3D Digital PCR System’s first generation chips enable up to 20,000 data points in a sin-gle run—coverage that satisfies the needs for most digital polymerase chain reaction (PCR) applications today. The capacity of future chips will increase exponentially to meet increasing demands of the research community. Digital PCR takes researchers beyond the limits of real-time PCR for applications that require absolute quantitation of targeted DNA molecules. Additionally, Life’s simple workflow and chip-based platform reduce the risk of sample contamination and loss of DNA nor-mally associated with droplet-based systems. The technology is ideal for accurately detecting rare mutations important in cancer or infectious diseases. It is also increasingly used as a mechanism to perform quality control experiments on next generation sequencing libraries.LIFE TECHNOLOGIESFor info: 800-955-6288 www.lifetechnologies.com
Newly offered instrumentation, apparatus, and laboratory materials of interest to researchers in all disciplines in academic, industrial, and governmental organizations are featured in this space. Emphasis is given to purpose, chief characteristics, and availability of products and materials. Endorsement by Science or AAAS of any products or materials mentioned is not implied. Additional information may be obtained from the manufacturer or supplier.
New ProductsLife Science Technologies
Produced by the Science/AAAS Custom Publishing Office
596 1 FEBRUARY 2013 VOL 339 SCIENCE www.sciencemag.org/products
WORKSTATIONThe WS6 downflow workstation is designed especially for histology and pathology labora-tory analysis. The compact, versatile design of the WS6 makes a variety of installation for-mats possible according to individual needs. By drawing contaminated air downward into the stainless steel work surface, the WS6 provides excellent containment of potentially harmful vapors present when cutting or staining samples. Contaminated air is then drawn through a two-stage filter system for maximum fume adsorption. The advanced coconut shell carbon filtration media is designed to adsorb chemical vapors as well as neutralize a wide range of chemicals commonly used in histology and pathology. The open design and downward airflow pattern of the WS6 makes the unit particularly suited for microscopy work, or where close visibility is required. The workstation is ergonomically designed with integral fluorescent lighting to evenly illuminate the entire work surface, providing glare-fee viewing, and helping eliminate operator fatigue. MYSTAIRE MISONIXFor info: 919-229-8511 www.mystaire.com
CHILLER UNITThe FlowSyn Polar Bear is a state-of-the-art chiller unit which, in com-bination with FlowSyn Continuous Flow Reactor, allows users to per-form and control reactions down to -88°C. The FlowSyn Polar Bear is ideal for precooling reagents and controlling temperature in highly exothermic reactions. The system is compatible with the FlowSyn range of reactor modules and is designed to prevent ice formation so that you can clearly observe reactions as they occur. With its fully integrated plug-and-play design, the Polar Bear is both easy to install and simple to operate as well as providing superb cooling performance. The Polar Bear uses advanced cooling technology without the need for solid CO2, solvents, or heat transfer fluids to deliver rapid cooling down to -88°C at the simple touch of a button. The Polar Bear module is compatible with all Uniqsis coil reactors and mixer blocks and works in combina-tion with and can be controlled by any FlowSyn flow reactor system. UNIQSISFor info: +44-(0)-8458-647747 www.uniqsis.com
COMBUSTION SYSTEM The Model OFCU-1 from Exeter Analytical provides a safe tool for preparing samples for elemental analysis of halogens, phosphorus, and sulfur using the Oxygen Flask Combustion procedure. The oxygen flask combustion procedure is provided as the preparatory step in the deter-mination of bromine, chlorine, fluorine, iodine, phosphorus, and sulfur in some Pharmacopeial articles. Combustion of the material under test (usually organic) yields water-soluble inorganic products, which may be analyzed for specific elements as directed in the individual Pharmaco-peia monograph or general chapter. The oxygen flask combustion pro-cedure using the OFCU-1 can be used for repeatable determination of elemental composition from percentage levels to parts per million. The durably constructed Oxygen Flask Combustion Unit (OFCU-1) copes easily with a wide range of sample types and is very simple to set up, use, and maintain. The OFCU-1 remotely ignites samples inside a safety interlocked chamber using focused infrared heat from two tungsten-halogen lamps. EXETER ANALYTICALFor info: +44-(0)-2476-323223 www.exeteranalytical.co.uk
on
Janu
ary
31, 2
013
ww
w.s
cien
cem
ag.o
rgD
ownl
oade
d fr
om

Cédric Blanpain is Professor of Stem Cell
and Developmental Biology and WELBIO
Investigator at the Université Libre de
Bruxelles (ULB). He qualified as a Doctor
of Medicine at the ULB in 1995 and holds
a PhD in Medical Science from the same
University. After postdv octoral research
at the Rockefeller University in New York,
he returned in 2006 to his native Belgium,
where he heads his own lab at the
Interdisciplinary Research Institute for
Human and Molecular Biology.
Cédric Blanpain’s work on skin cancer has
shown that cancerous tissue may contain
stem cells responsible for tumor growth
and which may explain resistance to
anticancer treatments. He has also
demonstrated the existence of two
separate populations of mammary stem
cells; a paradigm shift with major
implications for the understanding of the
cellular origin of breast cancer and
variations in prognosis. He is currently
focusing on a new type of stem cell that
contributes to wound healing in the skin
epidermis, as well as further investigating
the different types of mammary gland stem
cells and whether the cancer stem cell
mechanisms identified in skin tumors are
also present in other cancers.
2 0 1 2 P R I Z E W I N N E R S
C É D R I C B L A N P A I N
LIFESCIENCES
2012LILIANE BETTENCOURT
PRIZE FOR
Bettencourt Schueller Foundation
27-29 rue des Poissonniers
92200 Neuilly-sur-Seine • France
www.fondationbs.org
Contact : [email protected]
The 16th Liliane Bettencourt Prize for Life Sciences was awarded to
Cédric Blanpain, Professor of Stem Cell and Developmental Biology
and WELBIO investigator, at the Interdisciplinary Research Institute of
the Université Libre de Bruxelles.
The Liliane Bettencourt Prize for Life Sciences, worth € 250,000, has
been awarded every year since 1997 to a European researcher under
the age of 45, who is recognised within the scientiTc community for the
quality of his international publications. In addition to his status as an
author and leader in his own scientiTc Teld, the candidate must be
leading a particularly promising research project and have the personal
qualities for mobilising an entire team.
Recognised in 1987 as a public interest foundation, the Bettencourt
Schueller Foundation was set up by Liliane Bettencourt, in memory of
her father Eugène Schueller, a renowned researcher and chemist. Its
goal is to constantly expand the boundaries of knowledge in the life
sciences in order to improve public health; to reveal talent and pass on
expertise within the Teld of artistic creativity; and to relieve suffering,
combat exclusion and respond to social welfare emergencies.
0102013/THERAConseil
R&D Systems Cytokines & Growth FactorsSetting the Standard for the Life Science Industry
for over 25 Years
R&D Systems Tools for Cell Biology Research™
For research use only. Not for use in diagnostic procedures.
www.RnDSystems.com/CytokinesGrowthFactors
B. SDS-PAGE Analysis of High Purity Recombinant Mouse Wnt-3a. High
Purity Recombinant Mouse Wnt-3a (Catalog # 1324-WNP; 1 µg/lane) was
loaded on a 12% SDS-PAGE gel under reducing conditions and visualized by
silver staining.
A. Activity Comparison Data for Recombinant Mouse Wnt-3a. The
MC3T3-E1 mouse preosteoblast cell line was treated with increasing
concentrations of R&D Systems Recombinant MouseWnt-3a (Catalog # 1324-
WN) or with mouse Wnt-3a from two other companies. The R&D Systems
protein shows greater than a four-fold increase in activity compared to the
other commercially available proteins.
1
2
AlkalinePhosphatase(O.D.)
0.01
0.7
0.1 1 10 100 1000
Wnt-3a (ng/mL)
R&D Systems
Company 2
Company 1 92
66
55
43
36
29
22
18
kDaMouseWnt-3a(High Purity)
✓ R&D Systems currently offers more than 3,000 bioactive recombinant proteins
✓ We are the most referenced manufacturer of recombinant & natural proteins
✓ Our scientists are dedicated to developing the highest quality products & new processes that meet the needs of researchers
High purity proteins, traditional & cell culture grade • Animal-free proteins • GMP proteins
A. B.

MOLECULAR BIOLOGY SUMMER WORKSHOPS
~ 28TH ANNUAL ~
www.neb.com
Learn Molecular Biology in 2 Weeks!We are pleased to announce the twenty-eighth annual Molecular Biology Summer Workshops, sponsored
by New England Biolabs in conjunction with Smith College. Workshops are held at Ford Hall, Smith College,
Northampton, MA, USA. Well over 3,000 people have graduated from this intensive training program in the past
twenty-seven years. These intensive courses emphasize hands-on molecular biology laboratory work and cover a
wide variety of topics and techniques. This course is the largest and longest running molecular biology course for
professionals in the world. No prior experience in molecular biology is required.
when:two-week sessions:
Session 1: June 9 - June 22, 2013
Session 2: July 7 - July 20, 2013
where:Ford Hall
Smith College
Northampton, MA USA 01063
Dr. Steven A. Williams, Director
to apply:website:
http://www.science.smith.edu/neb
email:
phone:
(413) 585-3915
topics/techniques:• gene cloning
(and library construction)
• gene expression analysis
• PCR and quantitative RT-PCR
• genomics and bioinformatics
• DNA sequencing
& next-gen sequencing
• RNAi, siRNA and microarrays
• and much more — visit our
website for a complete list!
Two-week Molecular Biology Sessions AvailableBoth two-week long courses cover in-depth DNA cloning, PCR, DNA sequencing, genomics,
next-gen sequencing and bioinformatics. Learn hands-on techniques used in gene expression
analysis including microarray analysis, RNAi and quantitative RT-PCR, bioinformatics and
genomics and proteomics.
application information: No previous experience in molecular biology is required or
expected. Forty participants per session will be selected from a variety of disciplines and
academic backgrounds, including principal investigators, directors of programs, medical
doctors, postdoctoral fellows, graduate students, research assistants, sales associates,
equipment engineers, etc.
fee: $4300 per participant. This fee includes lab manual, use of all equipment and supplies,
and room and board (all rooms are singles).
application deadlines: June 1, 2013 for session 1 and July 1, 2013 for session 2.
First come, first served (apply now!). Late applications will be accepted on a space available basis.
payment deadline: Three weeks following receipt of your email acceptance letter.

Our labwindow.
Your labwindow.
ImageCredit:NASA
Space Is Closer Than You Think.
The International Space Station provides research conditions that simply can’t be replicated on Earth. CASIS oferscost-efective access to the International Space Station – enabling groundbreaking discoveries and advancementsthat will give your research a competitive edge.
Access to microgravity, extreme temperature cycling, ultra-vacuum, and much more – in the world’s most advancedlab – it’s all closer than you think. Visit iss-casis.org to learn more today.
SM-001

CONFERENCE & EXPO ’13
Cambridge Healthtech Institute’s Twel�h Annual
April 9 – 11, 2013 • World Trade Center • Boston, MA
Enabling Technology. Leveraging Data. TransformingMedicine.
Register Early for
Maximum Savings!
Bio-ITWorldExpo.comOrganized by:
Cambridge Healthtech Institute
CONFERENCE TRACKS:
IT Infrastructure – Hardware
Software Development
Cloud Computing
Bioinformatics
Next-Gen Sequencing Informatics
Systems Pharmacology
eClinical Trials Solutions
Data Visualization NEW!
Drug Discovery Informatics
Clinical Omics NEW!
Collaborations and Open
Access Innovations
Cancer Informatics
1
22
33
4
5
6
7
8
99
10
1111
12
PLENARY SESSION:KEYNOTE PRESENTERS: The Life Sciences CIO Panel
From managing big data and cloud computing capabilities to building
virtual communities and optimizing drug development, the life sciences
CIO has to be a firefighter, evangelist, visionary. In this special plenary
roundtable, Bio-IT World invites a select group of CIOs from big pharma,
academia and government to discuss the major issues facing today’s
biosciences organization and the prospects for future growth and
organizational success.
Special guests:
Remy Evard – CIO, Novartis Institutes for BioMedical Research
Martin Leach – CIO, Broad Institute
Andrea T. Norris – Director, Center for
Information Technology (CIT) and CIO, NIH
Gunaretnam Rajagopal – CIO, Johnson & Johnson
Cris Ross – CIO, Mayo Clinic
Andrew L. Hopkins, D.Phil, FRSC, FSB,
Division of Biological Chemistry and
Drug Design, College of Life Sciences,
University of Dundee
Atul Butte, M.D., Ph.D., Division Chief
and Associate Professor, Stanford
University School of Medicine; Director,
Center for Pediatric Bioinformatics,
Lucile Packard ChildrenÕs Hospital;
Co-founder, Personalis and Numedii
Be Sure to Mention Keycode L35
when Registering
Produced by the Science/AAAS Custom Publishing Ofˇce
Five Steps to a SuccessfulSabbaticalUniversity life can be a grind of teaching, grant writing, and department politics.
But every seven years, facultymembers get amagical opportunity that is coveted by
nonacademics: sabbatical leave. In this period of career development, a professor
might learn new techniques, expand a research program, or finish off that book or
pile of languishing manuscripts.The dream starts with meticulous advanced plan-
ning, but ends best for those who are adaptable and open-minded. Here are five
pointers from professors with recent sabbatical experience.
Faculty Positions
Focus on Careers
Innovations and Opportunities: IndiaóFebruary 22
Postdocs: Identifying OpportunitiesóMarch 8
Regional Focus: GermanyóMarch 22
Upcoming Features
See full story on page 599.

Final reminder to register
online before joining us in
Boston.
Visit the Annual Meeting
website for registration and
program information.
See you soon in Boston!
Connect to the meetingon your mobile device.
HYNES CONVENTION CENTER
THE BEAUTY AND
BENEFITS OF SCIENCE
1 4 - 1 8 F E B R U A R Y • B O S TO NANNUALMEETING
2013AAAS
Register atwww.aaas.org/meetings
www.aaas.org/go/appw
The 2013 AAAS Annual Meeting app
gives you complete access:
Build your itinerary and take it with you.
Browse sessions, speakers, andmaps.
Be connected...wherever you go.

������� �� ��� �� ���
������������ ������
Publishing Office
High throughput sequencing technologies have proven to be critical
tools in understanding the molecular basis of disease, particularly in
oncology. Recent advances have enabled characterization of the ge-
netic mechanisms of cancer, revealing variants associated with novel
pathways that determine tumor formation and response to treatment.
The clinical potential of sequencing technologies in the diagnosis and
treatment of diseases has now been demonstrated, but challenges re-
main, particularly in sample preparation and data interpretation. In this
webinar our expert panel will describe recent discoveries in cancer ge-
nomics and inherited diseases, and how these advances are enabling
personalized medicine and the individualization of treatment.
������ ��� ������ ����� ����
• Gain insight into how mining tumor genomes can lead to betterunderstanding of cancer
• Learn how technologies are being applied to tumor genome analysis
• Improve their understanding of the pain points in genome analysisand how they can be overcome.
• Have the opportunity to ask questions of the expert panel, live!
������ �������� �� ������ � � �! " �#$# %! � &#$# '�! ( &#$# )�!
REGISTER NOW!
��������������������
Webinar sponsored by
��������
����� ���� �����Washington University Schoolof MedicineSt. Louis, MO
����� ������� �����Stanford UniversityStanford, CA
������ �������� �����Foundation MedicineCambridge, MA
��������� ���������������� ������ �� ������ ���������� ����������

Cancer Biology
www.promega.com/pathwaybiologyTo get a FREE sample of any one of these reagents, visit:
The complexity of cancer systems biology requires
innova�ve tools for interroga�ng the signaling pathways
responsible for oncological transforma�on.
Promegaís integrated tools for reporter
gene analysis assure biologically
relevant results in cancer research.
FuGENEÆ HDThe next genera�on
transfec�on reagent,
effec�ve on almost every
cell type with virtually
no cell toxicity
ONE-Gloô+ToxMul�plexed reporter
gene analysis with off-
target toxicity detec�on
in the same well
New! NanoLucô
and pGL4 Tox VectorsIntroducing NanoLuc - the
brightest, smallest, luciferase
available - plus a new line
of pGL4 response element
vectors formapping
oncological pathways

There’s only oneGalileo Galilei
Career advice I Job postings I Job Alerts I Career Forum I Crafting resumes/CVs I Preparing for interviews
For your career in science, there’s only one
Careers
ScienceCareers.org
orn in 1564, Galileo Galilei once contemplated a career in the priesthood. It’s perhaps fortunate
for science that upon the urging of his father, he instead decided to enroll at the University of
Pisa. His career in science began with medicine and from there he subsequently went on to become
a philosopher, physicist, mathematician, and astronomer, for which he is perhaps best known. His
astronomical observations and subsequent improvements to telescopes built his reputation as a
leading scientist of his time, but also led him to probe subject matter counter to prevailing dogma.
His expressed views on the Earth’s movement around the sun caused him to be declared suspect
of heresy, which for some time led to a ban on the reprinting of his works.
Galileo’s career changed science for all of us and he was without doubt a leading light in the
scientific revolution, which is perhaps why Albert Einstein called him the father of modern science.
Want to challenge the status quo and make the Earth move? At Sciencewe are here to help you
in your own scientific career with expert career advice, forums, job postings, and more— all for free.
For your career in science, there’s only one Science. Visit ScienceCareers.org today.
B

FOOD ALLERGY RISK ASSESSMENT SPECIALIST
ASSISTANT PROFESSOR
The Department of Food Science and Technology, University of Nebraska – Lincoln is seeking applicants fora 9-month, tenure-track Food Allergy Risk Assessment Specialist faculty position. The successful candidatewill be one of four faculty involved in the world-renowned Food Allergy Research & Resource Program(FARRP), a food industry-funded consortium with more than 70 member companies. The candidate will beexpected to develop and lead a food allergy research team on the development and application of quantita-tive risk assessment approaches related to food allergen residues. This will include assembling critical inputinformation for risk assessments by conducting and coordinating research on the threshold levels for food-allergic individuals, the consumption patterns of food-allergic individuals, and the distribution of allergenresidue levels in various food product categories. The candidate will also contribute to existing nationaland international extension efforts assisting food and related industries in the quantitative assessment offood allergen risks, implementation of allergen control programs, and application of appropriate sanitationapproaches. The candidate will also provide training in the use of analytical systems for detection of allergenresidues using individual consultations, seminars, workshops, webinars, and on-site and distance educationapproaches. The position will have a teaching component through regular and distance learning approaches.The appointment split will be 50% research, 40% Extension, and 10% teaching.
Additional opportunities are available through FARRP’s existing worldwide network of clinical, biochemical,risk assessment, and applied research and outreach collaborators in the U.S., Canada, Europe, andAustralia.Acandidate with the ability to expand those collaborations is sought. National and international travel is integralto this position. Collaborative opportunities also exist at UNL especially with faculty in the Department ofStatistics where a courtesy appointment is available to an interested and capable candidate. The Departmentof Food Science and Technology is housed in a modern, well-equipped facility.
Applicants must have a Ph.D. or equivalent in food science, statistics, toxicology, immunology or a relatedfield and experience related to chemical and/or food-related risk assessment. Experience related to allergenicfoods is preferred but not required. Experience interacting with food and related industries is preferred butnot required. Excellent verbal and written communication skills are also required.
For further details and to apply for this position visit http://employment.unl.edu, REQUISITION NUMBER 130008.Complete the Faculty/Administrative form and attach a Curriculum Vitae, the names and contact informa-tion of three (3) references and a Letter of Application that includes a two page description of your proposedresearch program, a one page description of your vision for Extension efforts related to food allergies andrisk assessment together with a brief statement of your experiences interacting with the food industry. Lettersfrom your three references must be sent to SaraWeixelman, University of Nebraska – Lincoln, 221 ChaseHall, Lincoln, NE 68583-0726 and must be received no later thanMarch 10, 2013. Application review willbegin onMarch 15, 2013 and continue until the position is filled.
The University of Nebraska has an active National Science Foundation ADVANCE gender equity program,and is committed to a pluralistic campus community through affirmative action, equal opportunity, work-
life balance, and dual careers.
Neural Circuits Underlying MovementAssistant ProfessorDalhousie University
Department of Medical NeuroscienceHalifax, Nova Scotia, Canada
The Department of Medical Neuroscience at Dalhousie University invites applications to fill aprobationary tenure-track position at the rank of Assistant Professor. Applicants must hold a PhDor MD degree or the equivalent, with a minimum of three years postdoctoral training in biomedicalsciences. The successful candidate will be expected to establish a research program in the developmentor function of neural circuits underlying movement. The candidate will join a dynamic group ofneuroscientists in the Life Sciences Research Institute, studying the development, physiology, andpathophysiology of motor system circuitry. This group forms the core of the Atlantic Mobility ActionProject (www.amap.ca), which undertakes a combination of basic and clinical neuroscience researchand is part of an interdisciplinary neuroscience community at Dalhousie University. Outstanding corefacilities available within the Faculty of Medicine include: Cellular and Molecular Digital Imaging,Proteomics, Maritime Brain Tissue Bank, Gene Analysis, Flow Cytometry, a new Animal Facility, anda Zebrafish Facility (research.medicine.dal.ca/core.htm).
Salary will be commensurate with qualifications and experience. The candidate will be expected tocompete for external research and salary support, supervise graduate students, and contribute to theteaching activities of the Department. We are committed to the success of our faculty members andprovide modern laboratory space, startup funds, and mentorship. Further information concerning themembers of the Department may be obtained by consulting our website (www.medical-neuroscience.medicine.dal.ca). Dalhousie University is located in the historic port city of Halifax, with excellentrecreational, cultural, and lifestyle opportunities (www.halifax.ca/visitors.asp).
Applicants should submit a curriculum vitae, a brief statement of research plans, teaching goals/interests and should arrange to have three letters of reference sent under separate cover to: SearchCommittee, Department of Medical Neuroscience, Faculty of Medicine, 5850 College St., PO Box
15000, Sir Charles TupperMedical Building, Dalhousie University, Halifax, Nova Scotia B3H 4R2
Canada. Closing date for receipt of applications is April 1, 2013. Starting date is negotiable, howeverit is intended that the position will be filled by September 1, 2013.
All qualified applicants are encouraged to apply; however, Canadians and permanent residentswill be given priority. Dalhousie University is an Employment Equity/Affirmative Action Employer.The University encourages applications from qualified Aboriginal people, persons with a disability,
racially visible persons, and women.
on
lin
e @
scie
nce
care
ers
.org
fa
cu
lt
y p
os
it
io
ns
Tracy HolmesWorldwide Associate Director
Science Careers
Phone: +44 (0) 1223 326525
THE AMERICAS
E-mail: [email protected]: 202-289-6742
Tina BurksEast Coast/West Coast/South AmericaPhone: 202-326-6577
Allyson RosenMidwest/Canada/CorporatePhone: 202-326-6578
Marci GallunSales AdministratorPhone: 202-326-6582
Online Job Posting QuestionsPhone: 202-312-6375
EUROPE/INDIA/AUSTRALIA/
NEW ZEALAND/REST OF WORLD
E-mail: [email protected]
Fax: +44 (0) 1223 326532
Lucy NelsonPhone: +44 (0)1223 326527
Kelly GracePhone: +44 (0) 1223 326528
JAPAN
Yuri KobayashiPhone: +81-(0)90-9110-1719E-mail: [email protected]
CHINA/KOREA/SINGAPORE/
TAIWAN/THAILAND
Ruolei Wu
Phone: +86-1367-1015-294E-mail: [email protected]
For full advertising details, go toScienceCareers.org and clickFor Employers, or call one ofour representatives.
All ads submitted for publicationmust comply
with applicable U.S. and non-U.S. laws. Science
reserves the right to refuse any advertisement
at its sole discretion for any reason, including
without limitation for offensive language or
inappropriate content, and all advertising is
subject to publisher approval. Science encour-
ages our readers to alert us to any ads that
they feel may be discriminatory or offensive.
Science CareersAdvertising
There’s only one
ScienceCareers.org
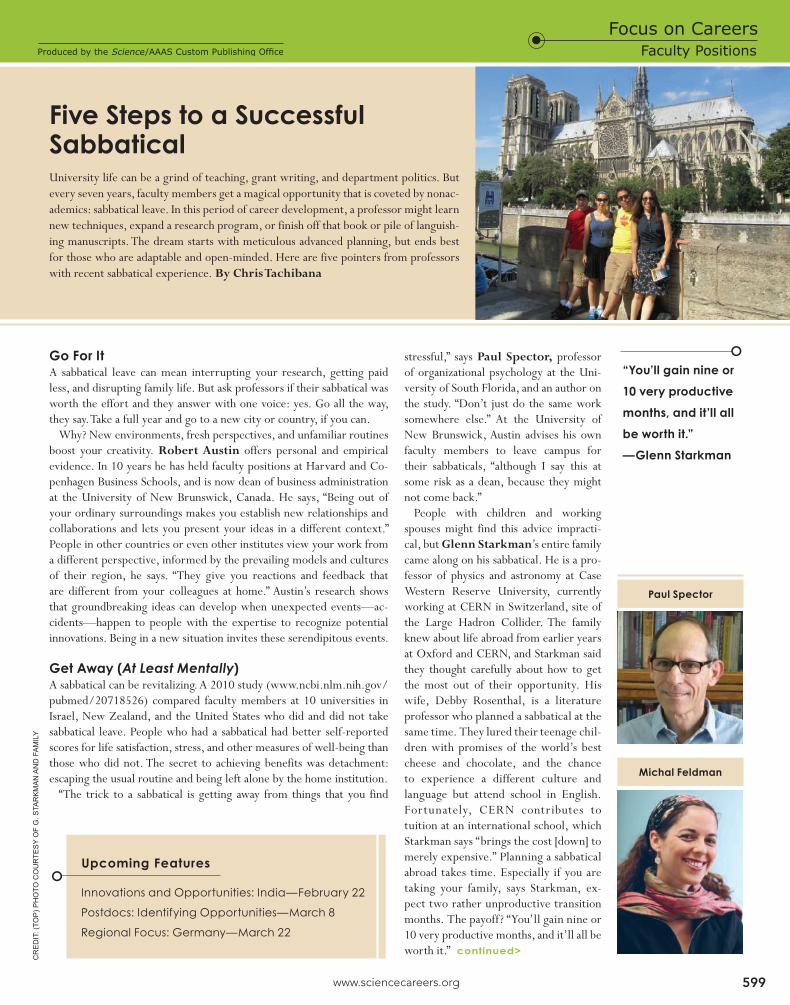
Produced by the Science��������������������� �����
599
stressful,î says Paul Spector, professor
of organizational psychology at the Uni-
versity of South Florida, and an author on
the study. ìDonít just do the same work
somewhere else.î At the University of
New Brunswick, Austin advises his own
faculty members to leave campus for
their sabbaticals, ìalthough I say this at
some risk as a dean, because they might
not come back.î
People with children and working
spouses might find this advice impracti-
cal, but Glenn Starkmanís entire family
came along on his sabbatical. He is a pro-
fessor of physics and astronomy at Case
Western Reserve University, currently
working at CERN in Switzerland, site of
the Large Hadron Collider. The family
knew about life abroad from earlier years
at Oxford and CERN, and Starkman said
they thought carefully about how to get
the most out of their opportunity. His
wife, Debby Rosenthal, is a literature
professor who planned a sabbatical at the
same time. They lured their teenage chil-
dren with promises of the worldís best
cheese and chocolate, and the chance
to experience a different culture and
language but attend school in English.
Fortunately, CERN contributes to
tuition at an international school, which
Starkman says ìbrings the cost [down] to
merely expensive.î Planning a sabbatical
abroad takes time. Especially if you are
taking your family, says Starkman, ex-
pect two rather unproductive transition
months. The payoff? ìYouíll gain nine or
10 very productive months, and itíll all be
worth it.î
Go For It A sabbatical leave can mean interrupting your research, getting paid
less, and disrupting family life. But ask professors if their sabbatical was
worth the effort and they answer with one voice: yes. Go all the way,
they say. Take a full year and go to a new city or country, if you can.
Why? New environments, fresh perspectives, and unfamiliar routines
boost your creativity. Robert Austin offers personal and empirical
evidence. In 10 years he has held faculty positions at Harvard and Co-
penhagen Business Schools, and is now dean of business administration
at the University of New Brunswick, Canada. He says, ìBeing out of
your ordinary surroundings makes you establish new relationships and
collaborations and lets you present your ideas in a different context.î
People in other countries or even other institutes view your work from
a different perspective, informed by the prevailing models and cultures
of their region, he says. ìThey give you reactions and feedback that
are different from your colleagues at home.î Austinís research shows
that groundbreaking ideas can develop when unexpected eventsóac-
cidentsóhappen to people with the expertise to recognize potential
innovations. Being in a new situation invites these serendipitous events.
Get Away (At Least Mentally)A sabbatical can be revitalizing. A 2010 study (www.ncbi.nlm.nih.gov/
pubmed/20718526) compared faculty members at 10 universities in
Israel, New Zealand, and the United States who did and did not take
sabbatical leave. People who had a sabbatical had better self-reported
scores for life satisfaction, stress, and other measures of well-being than
those who did not. The secret to achieving benefits was detachment:
escaping the usual routine and being left alone by the home institution.
ìThe trick to a sabbatical is getting away from things that you find
ìYouíll gain nine or
10 very productive
months, and itíll all
be worth it.î
óGlenn Starkman
Five Steps to a SuccessfulSabbaticalUniversity life can be a grind of teaching, grant writing, and department politics. But
every seven years, faculty members get a magical opportunity that is coveted by nonac-
ademics: sabbatical leave. In this period of career development, a professor might learn
new techniques, expand a research program, or finish off that book or pile of languish-
ing manuscripts. The dream starts with meticulous advanced planning, but ends best
for those who are adaptable and open-minded. Here are five pointers from professors
with recent sabbatical experience. By Chris Tachibana
continued>
Michal Feldman
Innovations and Opportunities: IndiaóFebruary 22
Postdocs: Identifying OpportunitiesóMarch 8
Regional Focus: GermanyóMarch 22
Upcoming Features
Faculty Positions
Focus on CareersC
RE
DIT
: (T
OP
) P
HO
TO
CO
UR
TE
SY
OF
G. S
TA
RK
MA
N A
ND
FA
MIL
Y
Paul Spector
www.sciencecareers.org

www.sciencecareers.org600
Paul Spector took his own advice about getting away
when he took a sabbatical without leaving town. ìI had
a young kid, so I stayed home for eight months and
worked. I didnít go to the office, I told my colleagues
Iíd be away, and they left me alone.î Spector told his
graduate students in advance to not schedule their de-
fense during his sabbatical. He used his time for pro-
fessional development that he had been putting off. ìI
spent a week learning about logistic regression,î he says,
ìbecause it was something I wanted to learn but never
had time before. I had a great eight months and came
back recharged.î
Start Planning, Now Reconfiguring a professional and personal life takes se-
rious planning. Sabbaticalhomes.com can help with re-
location. Meet with your universityís human resources
department to find out how a leave will affect paychecks,
taxes, and benefits, advises a blog at The Chronicle of
Higher Education (chronicle.com/blogs/profhacker/
author/nhighberg). Since many universities reduce salary
during sabbaticals, look for funding opportunities, but
start early. Applications for government and foundation
grants such as Fulbright or Guggenheim fellowships are
due more than a year before funding starts. Finally, tell
your institution what other resources you need. Universi-
ties realize that sabbaticals promote recruitment and re-
tention, so they want to help.
The University of North Carolina (UNC) Department
of Medicine gave Michael Pignone, chief of general internal medi-
cine, a physicianís assistant to support his six-month visit to the Univer-
sity of Sydney, Australia in 2010. After working alongside Pignone for
several months, the assistant managed Pignoneís primary care patients
while he was gone. Pignoneís sabbatical project was part of a five-year
National Institutes of Health (NIH) Established Investigator grant and
was also funded by an Australian-American Health Policy fellowship.
Pignone says the formal applications made him start thinking about his
sabbatical about three years in advance. ìThey forced me to plan ahead,
and Iím glad I did that,î he says. He arranged his administrative and
mentoring responsibilities to avoid major decisions, grants, or activities
while he was away.
Pignoneís school-age children and his wife Lisa Fail, who could work
remotely, went along and had a great time. He says going to an English-
speaking country and returning in June, as summer vacation was start-
ing, made the transition easier for his family. If youíre making the effort
to go to another country, consider a full year, he says, because ìhonestly,
six months went by pretty fast.î
Professors at small colleges can also get NIH support through the
Academic Research Enhancement Award (AREA, or R15) program,
which supports biomedical and behavioral sciences research at educa-
tional institutions that do not have large NIH grants. National Science
Foundation funding is another option. Rebecca Whelan, a newly ten-
ured chemistry/biochemistry associate professor at Oberlin College in
Ohio, which has 3,000 undergraduates, received an R15 grant for her
sabbatical. Whelan is developing new cancer tests based on synthetic
DNA molecules that bind to a specific target. To devel-
op the assays, she needed two resources not available at
Oberlin: specific ovarian cancer cell lines and a flow cy-
tometer to test binding to the cells. ìFlow cytometry is
the type of technology that requires a core facility,î says
Whelan. ìItís just not something we have at Oberlin.î
Detailed, advanced planning drove the success of
Whelanís sabbatical. She had to develop her idea, line
up a host lab, and submit a grant proposal in time to re-
ceive funding during her planned leave. Her advice: ìBe-
gin thinking strategically two or three years ahead to get
funding and establish a relationship with the lab where
youíll spend your sabbatical.î
To find a host lab, Whelan cold-called (or rather, e-
mailed) a researcher she cited often in her publications
but hadnít met. Manish Patankar, associate professor of
obstetrics and gynecology at University of Wisconsin-
Madison said Whelanís sabbatical proposal caught his eye
because it was clear, complete, and within the scope of
his main research program, but with a different angle and
a new approach. It was the beginning of a fruitful col-
laboration. Back in her Oberlin lab, Whelan has enthusi-
astic undergraduates advancing the project and continues
working with Patankar. ìWeíre writing a manuscript with
one or two in the pipeline,î she says, ìand weíre working
on getting Oberlin students to the University of Wiscon-
sin for a summer.î Patankar urges professors at large uni-
versities to consider sabbatical requests from motivated
researchers from small colleges. He says, ìA place like
Oberlin is small only in terms of student population. They have some
really nice resources and research.î
Both Whelan and Pignone reiterate the importance of getting away.
ìMost of us are conscientious and want to participate in our depart-
ment, so weíll always be pulled back,î says Whelan. But she recom-
mends protecting your time and setting a high threshold for partici-
pating in meetings. ìI did a phone conference for a tenure case in our
department, but I let all the other stuff slide by,î she says. ìYou donít
have to physically get away, but you must get away mentally.î If you
think you could be persuaded to return to your home institution, make
it hard to travel back. Pignone said being in Australia, nearly a full dayís
travel from North Carolina, was an advantage. Flying back was simply
impractical.
If you are in the European Union or an associated country or
arranging a sabbatical there, Marie Curie Actions offer a variety of
fellowship opportunities. Although known as an excellent source
of postdoctoral funding, the fellowships can also support established
investigators as visiting scientists. Michal Feldman, an associate
professor at the Hebrew University of Jerusalem, is visiting the Harvard
School of Engineering and Applied Sciences on a Curie grant. She offers
this advice: The application for her International Outgoing Fellowship
was complex, she says, so plan ahead. Youíll need details about your
research plan, your collaborative arrangement, and the facilities at
the institute you will be visiting. In addition, you must describe the
larger goals of your fellowship and how you intend to achieve them.
The application requires a complete description continued>
Science��������������������� �����Faculty Positions
Focus on Careers
CR
ED
IT:
MA
RIA
'S P
OR
TR
AIT
ST
UD
IO (
FR
ED
ER
ICT
ON
, N
B C
AN
AD
A)
ìBeing out of
your ordinary
surroundings
makes you
establish new
relationships and
collaborations
and lets you
present your ideas
in a different
context.î
óRobert Austin
Genomic Regulatory SystemsBiology - Faculty Position
The California Institute of Technology invitesapplications for a tenure-track junior facultyposition in the Division of Biology. Relevantexperimental research areas include systemsbiology approaches to gene regulatory circuits;evolution of gene regulatory networks; designprinciples in gene regulatory circuits; genomicsoriented, quantitative exploration of less under-stood aspects of gene regulatory systems such ascis-regulatorymodule choice, molecular biologyof enhancer function, mechanisms of enhancer-promoter interaction.
Candidates with strong commitments to researchand teaching excellence are encouraged to apply.Initial appointments at the assistant professorlevel are for four years, and are contingent uponcompletion of the Ph.D. degree.
Please submit on-line application at: http://biology.caltech.edu/Positions, and includea brief cover letter; curriculum vitae; relevantpublications, a description of proposed research;and a statement of teaching interests.Applicantsshould arrange to have four reference lettersuploaded. Application review will commenceimmediately and continue until March 15,2013.
The California Institute of Technology isan Equal Opportunity/Affirmative ActionEmployer. Women, minorities, veterans, anddisabled persons are encouraged to apply.
Department of Health and Human ServicesNational Institutes of Health
Center for Human Immunology, Autoimmunity, and InflammationDivision of Intramural Research
STAFF SCIENTIST/LAB LEADER
The NIH Center for Human Immunology, Autoimmunity and Inflammation (CHI) is a trans-NIH initiative that studies the human immune system inhealth and disease using high-throughput multi-dimensional assays, and then integrating the dense data sets using advanced computational approaches.The Staff Scientist/Lab Leader position is located in CHI’s Genomics Laboratory, and leads a group of 3 who perform the work of the laboratory.Responsibilities include: gene expression profiling, miR profiling, SNP scan, next generation sequencing, and biomarker validation using cutting edgetechnologies and instruments for clinical samples, and generating metadata spread sheets for data analysis; clinical sample processing and preservation(up to 40 samples/day for both serum and cells, hundreds of samples/ year), biorepository inventory, sample tracking, and distribution; development ofSOP’s and experimental QC; maintenance of lab instruments; training research fellows, lab technicians and collaborators in new technologies; workinga flexible schedule as dictated by clinical protocols.
The selected individual will have the following qualifications: M.D. or Ph.D. in a life sciences-related discipline, M.D./Ph. D. or M.D./M.S. preferred;minimum of 8 years experience in life sciences research, and more than 5 years hands on experience in biomedical research utilizing multiple highthroughput technologies, with multidimensional data collection and analysis; extensive experience and capability in adapting new technologies andplatform validation; experience and skill in gene expression profiling, micro RNA profiling, genome wide SNP scan, and next generation sequencing(NGS); demonstrated ability to integrate processing of high volume of clinical samples while also carrying out high throughput technologies, daily labmultitasking activity, instrument monitoring, and prioritization based on scientific need; the focus and organization to consistently produce researchdata of the highest quality; upbeat personality and ability to be a team player; track record of training research fellows, lab technicians and collaboratorin new technologies.
The position is not for a candidate who is seeking an independent research position.
How to Apply: The successful candidate will be offered salary and benefits commensurate with experience and accomplishments. The appointmentwould be through the Title 42 mechanism. Applicants may be U.S. Citizens, resident aliens, or non-resident aliens holding or eligible for a validemployment visa. Applications must be received within one month of the date of publication of this ad. Please submit a curriculum vitae and briefstatement of how your experience relates to the needed qualifications along with 3 letters of reference to: Neal S. Young, M.D. Director CHI c/oChristen Sandoval Building 15F2 MSC 2664 NIH Bethesda MD 20892, or electronically to [email protected]
The NIH is dedicated to building a diverse community in its training and employment programs.DHHS, NIH, and the NHLBI are Equal Opportunity Employers.
Assistant Professor (Tenure Track)of EnvironmentalMicrobiology
The Department of Environmental Systems Science (www.usys.ethz.ch) at ETH Zurich invitesapplications for an Assistant Professorship (Tenure Track) in EnvironmentalMicrobiology.
Candidates with outstanding scientific track records in any related field will be considered,but preference is given to applicants working on microbial processes in environmentalsystems.The new Professor should establish aworld-class research group and integrate intoresearch activities in related fields at ETH Zurich. In addition, he or she should contributeto the teaching of undergraduate level courses (German or English) and graduate levelcourses (English) for students of Environmental Science and Biology. The Professorship willbe equipped with a generous personnel and operational budget, but it will be expected toattract further funds for research through competitive grants.
The appointment is expected to be made at the Assistant Professor level. Assistant Profes-sorships have been established to promote the careers of younger scientists. The initialappointment is for four years with the possibility of renewal for an additional two-yearperiod and promotion to a permanent position.
Your application should include your curriculum vitae, a list of refereed publications as wellas a statement of your research and teaching interests. The letter of application should beaddressed to the President of ETH Zurich, Prof. Dr. Ralph Eichler. The closing date for appli-cations is 30 April 2013. ETH Zurich is an equal opportunity and affirmative action employer. Inorder to increase the number ofwomen in leading academic positions,we specifically encour-agewomen to apply. ETH Zurich is further responsive to the needs of dual career couples andqualifies as a family friendly employer. Please apply online at www.facultyaffairs.ethz.ch.
on
lin
e @
scie
nce
care
ers
.org
fa
cu
lt
y p
os
it
io
ns

Canít Do It? Let Them Come To YouIf you simply canít get away, consider hosting a sabbatical professor.
Manish Patankar, Whelanís host at the University of Wisconsin-Mad-
ison, didnít take a sabbatical when he earned tenure a few years ago,
but says his research program benefited when a sabbatical came to him
in the form of Whelanís visit. ìShe brought in skills and techniques we
didnít have in the lab,î he says. Whelanís analytical chemistry back-
ground unexpectedly came in handy when she performed gas chroma-
tography analysis on anticancer compounds the Patankar lab is explor-
ing. Says Patankar, ìYou never know where things will go.î
The positive effects of a visiting scientist can ripple beyond your re-
search group. Lyndal Trevena, an associate professor at the Sydney
school of public health, University of Sydney, hosted Pignone on his sab-
batical leave from UNC, and says his work had national impact. Pignone
and his Sydney colleagues did a cost-effectiveness study on colorectal
cancer screening in Australia. Trevena says
that being on sabbatical, without teaching
and administrative duties, meant Pignone
could focus intensely on the project, in-
cluding traveling to the capital of Canberra
to talk to people in the government. Being
an outside expert also gave extra weight
to his perspective. All this raised the pro-
file of their work, says Trevena. ìThe study
has really been influential for advancing a
program for colorectal cancer screening in
Australia,î she says.
One of the study coauthors was Profes-
sor Kirsten Howard. Before Pignone
arrived in her department, she knew of
his work, but had never met him. Howard
and Pignone quickly discovered common
interests in shared decision-makingó
studying how patients and physicians can
cooperatively make informed health care decisions. They now make up
a forceful collaborative team, with Pignone contributing clinical ex-
pertise and Howard developing the health economics methods for two
projects funded by grants they applied for while Pignone was in Austra-
lia. Howardís department supported her own sabbatical the next year to
UNC. To encourage the type of informal interactions that can develop
into new scientific partnerships, Howard suggests integrating visiting
scientists as much as possible into the department. She says, ìAttending
seminars, research presentations, and student talks creates chance en-
counters and conversations that can lead to spin-off collaborations and
new research directions.î
Trevena recommends hosting a sabbatical professor whose work fits
well with your research program. Then, make the most of every minute.
The visit goes by quickly, she says, so squeeze as much time as possible
with your visitor into your already busy schedule. She says, ìYouíll see
that you can really do some meaty, productive work in that time and
cement a collaboration.î
602
of your collaboratorís research and mentoring achievements, so
Feldman says, ìwork with someone who is well respected in the
field.î
Expect the UnexpectedFrom the other side of their sabbatical, professors say that although
some people accomplish everything they proposeódeveloping meth-
ods, publishing manuscripts, and writing booksómany find that their
plan simply isnít feasible. Be flexible and be ready to change the project
if necessary, or even better, if something more interesting comes along.
University of New Brunswickís Robert Austin says, ìItís exceeding un-
likely that your sabbatical project will proceed exactly as planned, but
be open-minded and youíll see opportunities for collaborations and
other sources of value that you didnít see going into your sabbatical.î
Even Whelan, whose project went as planned, had unexpected sci-
entific benefits from working at a new institution. After a colleague
mentioned the universityís high throughput sequencing equipment, she
used the facilities to enhance her research by characterizing the most
successful DNA molecules from her screen. Some professors advise
building flexibility into a research plan from the start. Propose a practi-
cal project that you know you can accomplish, to ensure that you get
something done, but also work on something riskyóthatís the point of
a sabbatical. DOI: 10.1126/science.opms.r1300127
Chris Tachibana is a science writer based in Seattle, USA, and Copenhagen, Denmark.
Faculty Positions
Focus on Careers Produced by the Science��������������������� �����
ìAttending
seminars, research
presentations,
and student talks
creates chance
encounters and
conversations that
can lead to spin-
off collaborations
and new research
directions.î
óKirsten Howard
Featured Participants
Case Western Reserve Universitycase.edu
CERNcern.ch
Harvard School of Engineering and Applied Scienceseas.harvard.edu
Hebrew University of Jerusalemhuji.ac.il/huji/eng
Oberlin Collegeoberlin.edu
University of New Brunswickunb.ca
University of North Carolinaunc.edu
University of South Floridausf.edu
University of Sydneysydney.edu.au
University of Wisconsin-Madisonwisc.edu
Additional Resources
Australian-American Health Policy Fellowship- www.commonwealthfund.org/Fellowships/Australian-American-Health-Policy-Fellowships.aspx
Fulbright Programwww.cies.org/Fulbright
Guggenheim Foundationwww.gf.org
Marie Curie Actionsec.europa.eu/research/mariecurieactions/index_en.htm
National Institutes of Healthgrants.nih.gov
National Science Foundationwww.nsf.gov
Nels Highberg sabbatical blogchronicle.com/blogs/profhacker/author/nhighberg
Sabbatical Homessabbatical homes.com
www.sciencecareers.org

The University of Texas Health Science Center at Tyler invites applica-tions from outstanding scientists for state-funded faculty positions at alllevels. Tyler is locatedmidway betweenDallas and Shreveport amidst thepicturesque lakes, hills and forests of East Texas. Themission of the basicand clinical research at the UT Health Science Center focuses on lunginjury/repair and therapeutics, pulmonary infectious diseases, and
oncology. Applicants in these and related fields are welcome. A strongtrack record of scientific accomplishment and current extramural
funding are required.
Acomplete listing and description of current faculty research interests canbe found online viaUTHSCT’swebsite http://www.uthct.edu/Research.The successful candidate will bring or establish a dynamic independentresearch program in a discipline related to the mission of UTHSCT.Teaching in the biotechnology graduate program is encouraged butcommensurate with committed research time. Our institution is growingand substantive resources are being allocated to build its translationalresearch portfolio.
Applicants should submit their curriculum vitae, a statement of futureresearch plans and the names of three references to: Dr. Anna Kurd-owska, Faculty Search Committee Chair, University of Texas Health
Science Center at Tyler, 11937 US Highway 271, Tyler, Texas 75708-
3154, or by email to [email protected].
is an EEO/AA Employer M/F/V/D. This position issecurity sensitive and subject to Texas Education Code 51.215 whichauthorizes the employer to obtain criminal history information
The University of Texas Health Science Center at Tyler invites applica-tions from extramurally funded, outstanding scientist/administratorsto serve as Chair of Oncology Research. Administrative experiencerequired. Administrative responsibilities include overall leadership andprofessional mentorship of faculty within the department. Track record ofsuccessful research and current extramural funding required. Resourcesto support this recruitment include ample laboratory space, additionalfaculty positions to support growth of research programs and unique UTSystem resources.
Tyler is locatedmidway betweenDallas and Shreveport amidst the pictur-esque lakes and piney woods of East Texas.Anew $40 million academicbuilding housing the Oncology Program opened in November 2011. Acomplete listing and description of current faculty research interests can befound online via UTHSCT’s website http://www.uthct.edu/Research.
The successful candidate will bring or a dynamic independent researchprogram in oncology. Essential functions include: promoting researchexcellence and productivity, supporting education and training, andadvancing community outreach. Associate and Full Professor levelcandidates will be considered.
Applicants should submit their curriculum vitae, a statement of futureadministrative and research plans and the names of three references to:Dr.AnnaKurdowska, Faculty SearchCommitteeChair, University of
Texas Health Science Center at Tyler, 11937 US Highway 271, Tyler,
Texas 75708-3154, or by email to [email protected].
is an EEO/AA Employer M/F/V/D. This position issecurity sensitive and subject to Texas Education Code 51.215 whichauthorizes the employer to obtain criminal history information.
TheUniversity of Texas Health Science Center at Tyler invites applica-tions from an extramurally funded, outstanding investigator to serveas Chairman of Infectious Lung Diseases. The candidate shouldhave a track record of successful research and extramural funding,and will oversee faculty members who are working on tuberculosisand influenza. Resources to support this recruitment include amplelaboratory space, all necessary equipment, an endowment and uniqueUT System resources.
Tyler is located midway between Dallas and Shreveport amidst thepicturesque lakes and piney woods of East Texas. The Departmentof Infectious Lung Disease is part of the Center for BiomedicalResearch, which focuses on lung injury, coagulation and oncology, aswell as pulmonary infectious diseases.Adescription of current facultyresearch interests can be found online at UTHSCT’s website http://www.uthct.edu/Research.
Associate and Full Professor level candidates will be considered.Applicants should submit their curriculum vitae, a statement offuture research plans and the names of three references to: Dr. AnnaKurdowska, Faculty SearchCommittee Chair, University of Texas
Health ScienceCenter atTyler, 11937USHighway 271,Tyler, Texas
75708-3154, or by email to [email protected].
is an EEO/AA Employer M/F/V/D. This positionis security sensitive and subject to Texas Education Code 51.215
which authorizes the employer to obtain criminalhistory information.
TEMASEK RESEARCH FELLOWSHIP (TRF)
A globally connected cosmopolitan city, Singapore provides a supportive
environment for a vibrant research culture. Its universities Nanyang
Technological University (NTU), National University of Singapore (NUS)
and Singapore University of Technology and Design (SUTD) invite
outstanding young researchers to apply for the prestigious TRF awards.
Under the TRF scheme, selected young researchers with a PhD degree have
an opportunity to conduct and lead defence-related research. It offers:
A 3-year research grant of up to S$1 million commensurate with the•
scope of work, with an option to extend for another 3 years
Postdoctoral or tenure-track appointment (eligibility for tenure-track•
will be determined by the university)
Attractive and competitive remuneration•
Fellows may lead, conduct research and publish in these areas:
Advanced Materials for Aerospace Applications•
Bio-mimetic Aerodynamics•
Cognitive Science and Neuroengineering•
Cyber Security•
High Power Laser Diode•
High Speed High Voltage Switching Devices•
For more information and application procedure, please visit:
NTU – http://www3.ntu.edu.sg/trf/index_trf.html
NUS – http://www.nus.edu.sg/dpr/funding/trf.html
SUTD – http://www.sutd.edu.sg/trf
Closing date: 15 March 2013 (Friday)
Shortlisted candidates will be invited to Singapore to present their research
plans, meet local researchers and identify potential collaborators in July
2013.
on
lin
e @
scie
nce
care
ers
.org
fa
cu
lt
y p
os
it
io
ns

Medical EducatorPhysiology/Pharmacology
The Department of Pharmacology and Physiology at TheGeorgeWashington University School of Medicine and HealthSciences invites applications for a full-time non-tenured facultyteaching position at the Assistant or Associate Professor level.The successful candidate will teach Physiology/Pharmacologycourses to medical and health science students. Courses areteam-taught with a strong clinical emphasis; the candidate willbecome course director for one or more of these courses.
Basic qualifications: a Ph.D. in physiology, pharmacology orrelated discipline and/or anM.D. Strong teaching credentials asevidenced by teaching evaluations and experience in teachingphysiology, pharmacology or a related discipline.
Application process: Please complete an online facultyapplication at http://www.gwu.jobs/postings/13282 and uploadcurriculum vitae, a letter of introduction describing relevantteaching experience. Only completed applications will beconsidered. Review of applications will beginMarch 1, 2013and continue until the position is filled.
The George Washington University is an Equal Opportunity/Affirmative Action Employer.
Senior Faculty Position inMolecular Cancer Biology
The George Washington UniversitySchool of Medicine and Health Sciences
The Department of Biochemistry and Molecular Biology at The GeorgeWashington University School of Medicine and Health Sciences invitesapplication for a tenured Associate or Full Professorship. We seek anoutstanding scientist with an innovative research program in cancer.
Basic Qualifications: Applicants must hold a Ph.D. and/or M.D.degree in appropriate discipline and shall have an established researchprogram supported by extramural funding.
Current cancer strengths of the department include phenotypicsignaling, epigenetic control, DNA damage, NO signaling, and cancergenomic and bioinformatics. The School of Medicine and HealthSciences is located on Foggy Bottom campus of GWU. The presenceof basic and applied science departments and the proximity of the NIH,Children’s National Research Institute and other medical centers in thearea, offer ample opportunities for collaboration.
Application process: George Washington University will providea competitive start-up package to successful candidates. Interestedapplicants must complete an online faculty application at http://www.gwu.jobs/postings/13422 and upload a complete CV and astatement of current and future research interests. Reviewof applicationswill begin on March 3, 2013 and continue until the position has beenfilled. Only complete applications will be considered.
The George Washington University is an Affirmative Action/EqualOpportunity Employer.
Faculty Positions in Microbiology
The Department of Microbiology is expanding its research program byinviting applications for multiple tenure track/tenured faculty positionson any level. Successful candidates will have demonstrated records oforiginality and productivity in research in microbial sciences. UABMicrobiology is a national leader in NIH research funding and offers auniquely interactive research environment.
Collaborations among basic science disciplines and between basic andclinical faculty are stimulated bymultidisciplinary centers at UAB: Centerfor AIDS Research, Comprehensive Cancer Center, Southern ResearchInstitute for drug development, Center for Structural Biology, Center forClinical andTranslational Sciences, Center for Emerging Infections, CysticFibrosis Research Center and a campus-wide Program in Immunology. Aworld-class BSL3/ABSL3 building is available. UAB is one of the topclinical and research institutions in the nation, located in an affordable citywith many cultural and outdoor attractions.
Microbiology at UAB (www.microbio.uab.edu/micro-genetics/) is adiverse group of scientists with a focus on microbial pathogens. Investi-gators with expertise in microbiome research are particularly encouragedto apply. Review of applications will continue until positions are filled.Applicants should submit their CV including a research plan (1 p), thecontact information of three references and their three top publications asa single pdf file to: Michael Niederweis, Ph.D., c/o Kristina Sinclair,email: [email protected].
A pre-employment background investigation is performed on candidatesfor employment. UAB is an Equal Opportunity/Affirmative ActionEmployer committed to fostering a diverse, equitable and family-
friendly environment in which all faculty and staff can excel and achievework/life balance irrespective of ethnicity, gender, faith, gender identifyand expression as well as sexual orientation. UAB also encouragesapplications from individuals with disabilities and veterans.
Tenure-Track Faculty PositionNeuroscience and Experimental Therapeutics
The Department of Neuroscience and Experimental Therapeutics invitesapplications for a tenure-track faculty position at the level of ASSISTANT/ASSOCIATEPROFESSOR.We are interested in outstanding scientists in theneurosciences, neuropharmacological or translational sciences with a strongrecord of extramural funding, research achievement and a commitment to gradu-ate and medical education. Candidates should have a high level of competenceand research productivity by way of scholarly publications, and a strong trackrecord of external research grant support. The ideal candidate’s research programshould also complement existing research strengths in the department. Currentresearch programs focus on molecular, cellular and behavioral approaches tostudy brain development, aging, circadian biology, epilepsy, neurodegenerativediseases and stroke (for more details see http://medicine.tamhsc.edu/basic-sciences/index).
In addition to the departmental faculty, the neuroscience community at theTexasA&Mconsists of 70+ faculty located in the departments of Biology/Psychology/Veterinary Medicine with an active graduate program through the TexasA&MInstitute for Neuroscience (http://tamin.tamu.edu). Clinical collaborations arepossible through the Texas Brain and Spine Institute (http://www.txbsi.com/)as well as the Department of Psychiatry and Behavioral Science.
This position offers an outstanding research environment in a newly builtresearch facility with a modern vivarium, and highly competitive start up pack-ages, compensation and benefits. Successful candidates are expected to developindependent research programs that are well funded, and that take advantage ofthe diverse collaborative opportunities available. Candidates will also participatein teaching programs and service assignments within the Department. Reviewof applications will begin as they are received and continue until the positionsare filled. Applicants should submit a current curriculum vitae, a statement ofresearch goals and names/addresses of three references to:Dr. Farida Sohrabji,Chair of SearchCommittee, Department ofNeuroscience andExperimental
Therapeutics, Texas A&M Health Science Center, College of Medicine,
Medical Research and Education Building, 8447 State Highway 47, Bryan,
TX 77807 ([email protected]).
The TAMHSC is an Affirmative Action/Equal Opportunity Employer.
on
lin
e @
scie
nce
care
ers
.org
fa
cu
lt
y p
os
it
io
ns

Faculty of Arts & Science
University of Lethbridge
The University of Lethbridge isseeking two exceptional scholars to fillthe positions of (i) Alberta InnovatesHealth Solutions (AIHS) TranslationalHealth Chair: RNA in Health & Disease,and (ii) Campus Alberta InnovatesProgram (CAIP) Chair: SyntheticBiology & RNA Based Systems.
(i) The AIHS Translational Health Chairwill address the priority area of ChronicDisease and will contribute to enhancingthe province’s capacity to provide evidence-informed decisions regarding healthpromotion and disease prevention, and totranslate research outcomes into effectivetreatment and prevention strategies andhealth care solutions.
The goal of this Chair position will be:(1) to develop internationally-recognized,long-term research that will build upon ourunderstanding of factors that contributeto chronic diseases, and (2) to developand implement effective and integratedknowledge mobilization strategies to ensurethat new knowledge is transferred to endusers to support disease prevention and topromote health equity in the province.
The candidate should have demonstratedexpertise in the study of structure andfunction of RNA-based systems invivo and/or in vitro using rational-design
approaches to the biological systems understudy (synthetic biology), biochemical,biophysical or molecular biologyapproaches, and bring a special focuson applications in chronic health conditionssuch as cancer, inherited diseases oracquired chronic conditions, includingbut not limited to viral infections like HIVand hepatitis.
(ii) The CAIP Chair, along with a specialfocus on the energy sector, must bringdemonstrated expertise in the engineeringof biological systems (synthetic biology)and the study of structure and/orfunction of RNA-based systems,using in vivo and/or in vitro approaches,having made major impacts in hisor her fields of research. Candidateswill be expected to play a lead role incontributing to the University’s capacity insynthetic biology and RNA Research.
The AIHS Translational Health Chair aswell as the CAIP Chair will be appointedto the Department of Chemistry& Biochemistry at the Universityof Lethbridge.
The University of Lethbridge is home to theAlberta RNA Research and TrainingInstitute (ARRTI), the first of its kind inWestern Canada.Through first-class RNAresearch and training excellence,ARRTI
contributes to the multidisciplinary researchand teaching community at the Universityof Lethbridge and facilitates the transfer ofleading-edge knowledge into the privateand public sectors, as well as academia.Members of the Institute operate severalfocused laboratories including: a laboratoryfor structure and function of smallnoncoding RNAs, a laboratory forbiomolecular design and engineering,a laboratory for systems biology andmathematical modeling, and alaboratory for synthetic biology.
For more information about Canada’sResearch Infosource 2012Undergraduate ResearchUniversity of the Year, pleasevisit our website at www.uleth.ca.
For a detailed job descriptions, includingsubmission requirements, please visit:uleth.ca/artsci/ResearchChairSearch
For more information please contactDr. René Boeré at [email protected].
on
lin
e @
scie
nce
care
ers
.org
fa
cu
lt
y p
os
it
io
ns

www.ntu.edu.sg
with the fastest-rising universitiesin the world’s Top 50. NTU.
RISE TO THE
OPPORTUNITY
Faculty Positions at School ofChemical and Biomedical Engineering (SCBE)
Nanyang Technological University (NTU) in Singapore is ranked47th in the QS World University Rankings 2012. SCBE at NTUinvites applications for Assistant, Associate or Full Professors. Formore information, visit www.scbe.ntu.edu.sg/About_Us/Pages/
Open_Positions.aspx
Research Areas
Chemical and BiomolecularEngineering Division
· Process systems engineering· Product and process design· Pharmaceutical engineering· Food engineering· Separation technology· Colloid and interface science
Bioengineering Division
· Cardiovascular biomechanics· Bioinstrumentation· Biosignal processing and imaging· BioQuid· Neuro bioengineering· Nature inspired bioengineering· Mechanobiology of cell-celland cell-matrix interactions
Application DetailsGuidelines: www.ntu.edu.sg/ohr/Career/SubmitApplications/Pages/
Faculty.aspx
Email: [email protected]
Purdue University Center for Animal Welfare ScienceCluster Hire
Purdue University has a well-established record of excellence in research andteaching programs in Human Animal Bond and Farm Animal Welfare. Thenewly created Purdue Center for Animal Welfare Science hosts the largestcollaborative group of scientists in the United States working in these fields;utilizing diverse, cross-disciplinary approaches in the areas of animal andpoultry science, veterinarymedicine, psychology, philosophy, genetics, publichealth, and zoology. The mission of the Center is to promote the welfare ofanimals through innovation in research, education and outreach. To furtherenhance our capacity, we are currently looking to fill three new tenure trackpositions: a Center Director and two Assistant Professors.
Director position:A tenure-track senior faculty position in domestic animalwelfare is available to head the Center for Animal Welfare Science. Thisindividual will lead a team of scientists and educators in the Department ofAnimal Sciences (College ofAgriculture) and Comparative Pathobiology andVeterinary Clinical Sciences (College ofVeterinaryMedicine) by facilitatingresearch, teaching, and extension efforts. For details regarding the position,please go to: http://www.vet.purdue.edu/cpb/employment.php
Assistant Professor, Human–Animal Interactions position: A tenure-track faculty position is available in Human-Animal Interactions based inthe Department of Comparative Pathobiology at Purdue University CollegeofVeterinaryMedicine. For details regarding the position, please go to: http://www.vet.purdue.edu/cpb/employment.php
Assistant Professor,AnimalWelfare position:A tenure-track faculty posi-tion inAnimalWelfare is available at PurdueUniversity. The home departmentwill be determined based on the area of expertise of the successful applicant.For details regarding the position, please go to:http://www.vet.purdue.edu/cpb/employment.php
A background check is required for employment in these three positions.Purdue University is an Equal Opportunity/Equal Access/AffirmativeAction Employer fully committed to achieving a diverse workforce.
FACULTY POSITION IN STRUCTURAL BIOLOGY and/or IMAGING
Department of Biochemistry and Molecular Biology
Thomas Jeferson University
The Department of Biochemistry and Molecular Biology at Thomas Jeferson Uni-
versity in Philadelphia invites applications for faculty positions in structural biology
and/or molecular/cellular imaging, with the possibility of leading development of a
new research center in the field of interest. We seek outstanding investigators to
complement our existing strengths in structural biology, receptor signaling and pro-
tein trafcking, DNA repair, and transcriptional-translational regulation. The Depart-
ment ofers a highly collaborative culture and in conjunction with the Kimmel Cancer
Center provides state-of-the-art core resources for structural biology, imaging and
cancer biology research (http://www.kimmelcancercenter.org/research/). All faculty
ranks will be considered, and the successful candidate will have a demonstrated track
record of research excellence and extramural funding, and will participate in gradu-
ate training.
Thomas Jeferson University is located in the vibrant Center City area of Philadel-
phia surrounded by a wide variety of cultural, historical, and recreational attractions.
There is convenient housing for both faculty and trainees nearby, while the Phila-
delphia suburbs are readily accessible to Jeferson by mass transit or car. Thomas
Jeferson University is an Afrmative Action/Equal Opportunity Employer.
Candidates should submit curriculum vitae, a brief statement of research interests
and future plans, and contact information for three references to:
Dr. James Keen, ChairFaculty Search Committeec/o Ms. Lisa WaitesDepartment of Biochemistry & Molecular BiologyThomas Jeferson University233 South 10th Street, BLSB 350Philadelphia, PA [email protected] apply online at: www.jefersonhr.org
Professor in Neurodegenerative Disease Research
McLaughlin Research Institute (MRI) seeks an innovative scientist at theProfessor level with an established program in neurodegenerative diseaseresearch who can take advantage of the Institute’s strengths in mousegenetics and animalmodels. Low animal care costs and transgenic servicesat MRI facilitate mouse-intensive projects that would be cost-prohibitiveat many other centers.Applicants with interests in human stem cell modelsforAlzheimer’s and related diseases are particularly encouraged to apply.Faculty have opportunities for collaborations with physicians at BenefisHealth System which serves a patient population of 250,000. Candidatesshould have a record of research excellence and a demonstrated ability tocompete successfully for funding. The ability to establish intramural andextramural collaborations is essential. An endowed chair is a possibilityfor the successful candidate.
The Institute is a small non-profit organization located near Montana’sRockyMountain Front and offers a non-bureaucratic, interactive researchenvironment in a spacious, modern research facility. Faculty membersalso benefit from the active involvement of MRI’s Scientific AdvisoryCommittee (Irv Weissman, David Baltimore, David Cameron, NealCopeland, Jeff Frelinger, Leroy Hood, and Nancy Jenkins). ContactGeorge Carlson, MRI’s Director, for more information. Applications,including names and contact information for three to five individuals whomay serve as references, should be sent to: SearchCommittee, 1520 23rd
Street South, Great Falls, MT 59405 or [email protected]
on
lin
e @
scie
nce
care
ers
.org
fa
cu
lt
y p
os
it
io
ns

New Faculty Position in Biology andEducation
The School of Life Sciences at Arizona State University ismaking a commitment to enhancing life science education
at the undergraduate level. ASU is a dynamic, progressive university dedicated to interdisciplinary col-laborations, to rethinking university education, and to integrating excellence in research and teaching. TheSchool of Life Sciences atArizona State University’s Tempe campus is committed to reflective curriculardevelopment and innovation, with a focus on learner-centered education and teaching excellence. Weare revising introductory courses, promoting active learning, and introducing a diversity of innovativeapproaches to instruction. ASU offers opportunities for collaboration with diverse science educationinitiatives across the university. To support this effort, the School invites applications for a tenure-trackposition at any level. The successful applicant will have a strong disciplinary content knowledge inbiological sciences, established expertise in and commitment to biology education including scholar-ship related to teaching and learning and evidence of the capacity for leadership. Candidates must havea primary research focused on teaching and learning in biology at the undergraduate level, which willpromote quality undergraduate instruction through independent and collaborative efforts andwill promotethe SoLS teaching mission. The successful candidate will demonstrate scholarly excellence with thecapacity to develop and sustain a creative, extramurally-funded research program in education-relatedwork in the biological sciences, with evidence of interdisciplinary collaboration. In addition, candidateswith demonstrated records of mentoring at the undergraduate, graduate, and/or postdoctoral levels, strongrecords of outreach and service, and experience working in a highly-interdisciplinary environment likethe ASU School of Life Sciences are preferred.. The start-up package, teaching, and service loads willsupport the expected high research productivity. Candidates must have a Ph.D. in biological sciences oreducation, with experience or training equivalent to a Master’s degree in the other area.All qualificationswill be evaluated as appropriate to the level of appointment.
To apply, send a cover letter, curriculum vitae, three representative publications, separate statements ofresearch focus/plans, teaching philosophy/experience, and three reference letters of support toAnnaFields,attn. Biology Education Faculty SearchCommittee, School of Life Sciences, POBox 874501, Tempe,
AZ 85287-4501, with electronic applications sent as PDF files to [email protected] preferred.The initial closing date for receipt of complete applications is February 22, 2013; the committee willreview applications weekly thereafter until the search is closed. For additional information, please feelfree to contact James Collins ([email protected]) or Jane Maienschein ([email protected]).
A background check is required for employment at Arizona State University, which is an EqualOpportunity/Affirmative Action Employer committed to excellence through diversity. We especiallyencourage women and minorities to apply. For additional information on this position and the School
of Life Sciences, please visit http://sols.asu.edu/jobs.
EstablishedCardiovascularInvestigator
The new Department of Integrative Biology andPhysiology at the University ofMinnesotaMedicalSchool seeks outstanding faculty candidates inintegrative systems biology of the cardiovascularsystem and related fields at the Associate or FullProfessor levels. Substantial resources includingleading focused junior faculty cluster hires forprogram development and new state-of-the-artresearch buildings are committed to this effort:http://www.ahc.umn.edu/research/bdd/ .Successful candidates will have an establishedand innovative research program that embracesbiological complexity from molecular buildingblocks to the living organism. Applicants musthave a strong record of research accomplishments,as documented by publications in leading peer-reviewed journals. A commitment to excellencein teaching is essential. An outstanding record ofextramural funding with a multiple grant portfoliois required. Minimum requirements are a PhD,MD or MD/PhD with tenure at an academicresearch institution. Additional information aboutthe department: http://physiology.med.umn.edu/.Information on the vibrant Twin Cities communityand Minnesota’s acclaimed high quality of life:http://www1.umn.edu/wishyouwerehere/.Nominations are appreciated: Dr. Randi
Lundell [email protected]. Applicants pleaseapply on-line (http://www1.umn.edu/ohr/employment/ – requisition number #179062;submit cover letter, curriculum vitae, statementof programmatic and research goals, and referenceletters to this web address).
The University of Minnesota is an EqualOpportunity Educator and Employer.
Director of Research – VanAndel Research Institute
Van Andel Research Institute currently seeks an accomplished, energetic, and visionary Director of Research tolead the strategic development of its basic oncology science, neurodegenerative science, and translationalprograms. The Director will have a unique opportunity to shape and influence the focus of these researchinitiatives, guiding the private, independent biomedical institute to achieve its full potential.
VARI is located in a rapidly growing life sciences community in Grand Rapids, Michigan; it currently houses 23laboratories devoted to basic science/translational research and dedicated to exploring the genetic andmolecular mechanisms underlying disease.
Applications are invited from candidates who have a Ph.D. in biological sciences, an M.D., or both. Candidateswill be expected to have a reputation for outstanding scholarship and a track record of significant researchcontributions, preferably in cancer, in order to build upon our established foundation and legacy. Experience inbasic science and background in translational research are requirements. Experience in clinical research isdesirable, as are connections to the scientific, biotechnology, and pharmaceutical communities.
Learn more about this exceptional opportunity by visiting
http://www.vai.org/en/about-vai/careers.aspx
Van Andel Research Institute is an Equal Opportunity Employer.
on
lin
e @
scie
nce
care
ers
.org
fa
cu
lt
y p
os
it
io
ns

At Stony Brook Medicine, our highest calling is to put the power of ideas to work in ourpatients’ lives. Stony Brook Medicine integrates and elevates all of Stony Brook University’shealth-related initiatives: education, research and patient care. It includes Stony BrookUniversity Hospital, Long Island’s premier academic medical center. With 597 beds, SBUHis the region’s only tertiary care center and Regional Trauma Center. We are home to the StonyBrook Heart Institute, Stony Brook Cancer Center, Stony Brook Long Island Children’s Hospital,Stony Brook Neurosciences Institute and Stony Brook Digestive Disorders Institute. At StonyBrook Medicine, we put the power of ideas to work. Join our team at Stony Brook Medicine —the best ideas in medicine.
The best ideas in medicine start with the best people.
Assistant/Associate Professor
TWIN CITIES CAMPUS FACULTYPOSITIONS
SUSTAINABLE HORTICULTURE
TENURE-TRACK ASSISTANTPROFESSOR POSITIONS (2) INSUSTAINABLE & ORGANIC FOOD
SYSTEMS
The University of Minnesota has openings fortwo nine-month, tenure-track Assistant Professorpositions in Sustainable & Organic HorticulturalFood Systems. The tenure home for thesepositions will be in the Dept. of HorticulturalScience. The successful candidates will eachdevelop and teach one foundational course inthe Sustainable and Organic Food Systemsinitiative and another upper-level course forundergraduates in his/her area of specialization.The individuals will also be expected to lead andparticipate in graduate-level seminar courses,advise undergraduates and graduate students.
Assistant Professor – Sustainable & Organic
Horticultural Food Production Systems, 60%teaching, 40% research. Requisition #182205.
Assistant Professor - Biological Principles of
Sustainable & Organic Foos Systems, 60%teaching, 40% research. Requisition #182695.
For complete job descriptions, go to: https://employment.umn.edu and search postings.Review of applications will begin March 15,2013.
The University of Minnesota is an Equal
Opportunity Educator and Employer.
on
lin
e @
scie
nce
care
ers
.org
fa
cu
lt
y p
os
it
io
ns
Faculty Positions in Human Immunology at the
Vaccine & Gene Therapy Institute of Florida
At theVaccine & GeneTherapy Institute of Florida (VGTI Florida), we are committed to discovering innovativetherapies and vaccines to improve human health. It is ultimately the researchers we recruit that determinesour success and our state-of-the-art technologies and resources that enables our institute to realize thesesuccesses. Our scientists are the most important asset in our pursuit of achieving excellence in research. Ourstaff not only enjoys outstanding benefits but also work in an environment noted for community involvement,intellectual excitement, and natural beauty.
We are seeking to recruit outstanding Immunologists in the areas of Infectious Disease and Cancer Immu-nobiology to direct programs in basic and translational human immunology. Candidates are expected toassist in establishing clinical research immunology programs and recruit additional Principal Investigators.VGTI Florida is one of the internationally acclaimed research institutes invited to locate to Florida as partof a State-sponsored initiative to enhance biomedical research in Florida. Research at VGTI Florida focuseson Global Health initiatives utilizing systems biology approaches to study the human innate and adaptiveimmune response to infectious diseases and cancer.
Research themes of VGTI-FL include:• HIV-1 and emerging infectious pathogens• Infuenza• Vaccine development and adjuvants• Cancer Immunology• Ageing and the immune response
VGTI Florida has ongoing basic and clinical research collaborations with the University of Miami, MoffittCancer Center and Martin Health Systems. The institute occupies a new 100,000 sq. ft. state of the art andLEED Gold Certified facility in Port St. Lucie, FL. The institute is located on the sunny Atlantic coast in aBiotech cluster that includes Torrey Pines Institute for Molecular Studies, the Mann Research Center, andthe new Tradition Medical Center. Florida Atlantic University, the Scripps Research Institute of Florida andthe Max Planck Florida Institute for Neuroscience are within 30 minutes’ drive.
Successful candidates (M.D. and/or Ph.D.) will have an established extramurally funded research program anda strong publication record in one of the priority areas described above. The positions have highly competitivesalary and startup packages, with access to state-of-the-art Genomics, Bioinformatics and Flow Cytometrycore facilities as well as BSL3/ ABSL3 containment facilities within the institute. For more information,including a description of the Faculty and their research interests, please visit: www.vgtifl.org. Qualifiedcandidates should apply by submitting their curriculum vitae and a description of their proposed researchprogram: https://home.eease.adp.com/recruit/?id=3795661
VGTI Florida is an Equal Opportunity Institution, committed to recruiting, hiring, and promotingqualified minorities, women, individuals with disabilities, and veterans.
Download your free copy tod
ay at
ScienceCareers.org/bookle
ts
Brought to you by theAAAS/Science Business Office

on
lin
e @
scie
nce
care
ers
.org
CONFERENCE
The Seattle Children’s Research Institute and the Department of Pediatrics at theUniversity ofWashington School ofMedicine are recruiting a qualified individualto serve as the Director for the Center for Childhood Infections and Prema-turity Research at Seattle Children’s Research Institute. The Center’s researchvision is to translate basic biology to strategies for the diagnosis, treatment andprevention of infectious diseases and conditions that impact children locally,nationally, and globally. The Center for Childhood Infections and PrematurityResearch is located on one floor of the modern 225,000sq ft. Seattle Children’sResearch Institute and hasmature programs in host-pathogen interactions, globaland emerging infectious diseases, vaccine discovery and evaluation, mechanismsof microbial drug resistance.
The Center Director will be responsible for the allocation of research spaceand available resources within the policies of the SCRI and will develop avision for the Center, recruit outstanding scientists, support and collaboratewith current scientists within the Center, mentor current and future faculty, andactively participate in philanthropic efforts on behalf of the Center and SeattleChildren’s Research Institute. This is a full-time academic appointment at therank of Professor, without tenure (MD and/or PhD required). The successful can-didate must have an established record of academic achievement and leadershipexperience and active NIH-funded research grants. For more information see:www.seattlechildrens.org/research. Please send CV and a statement of currentand future research interests to:Danielle Zerr,MD,MPH,Chair, SearchCom-mittee, Professor, Department of Pediatrics, Division of Infectious Disease,
University of Washington faculty engage in teaching, research, and service. Inorder to be eligible for University sponsorship for an H1-B visa, graduates offoreign (non-U.S.) medical schools must show successful completion of all threesteps of the U.S.Medical Licensing Exam (USMCE), or equivalent as determinedby the Secretary of Health and Human Services. The University of Washingtonis building a culturally diverse faculty and strongly encourages applicationsfrom female and minority candidates. The University is an Equal OpportunityAffirmative Action Employer.
If you have a question about the details of this search/position please contact
the hiring unit directly. Thank you for your interest in this position at the
University of Washington.
CHAIRDepartment of Bioinformatics
TheUniversity of Texas SouthwesternMedical Center is seach-ing for a Chairperson to establish a new Department of Bioin-formatics. We are seeking an individual to form a world-classdepartment within an exceptionally strong biomedical researchenvironment. The successful candidate will have a robust andinternationally recognized research program in bioinformatics,a record of superb scientific achievement, outstanding leader-ship skills, and a strong vision for establishing and leadingthe department. The Chair will be expected to recruit six newfaculty members who are leaders in bioinformatics and infor-matics-driven biomedical discovery. The Chair will also fosterand grow a research environment that integrates with existingdepartments, programs, and infrastructure and will establish agraduate program in bioinformatics and genomics. Significantresources will be provided to accomplish these endeavors.
Interested individuals should send a curriculum vitae and a coverletter to the Chair of the Search Committee, W. Lee Kraus,Ph.D. ([email protected]).
The University of Texas Southwestern Medical Center is anEqual Opportunity Institution.
POSITIONS OPEN FACULTY POSITIONS

Produced by the Science/AAAS Custom Publishing Office
For recruitment in science,
there’s only one
E-mail:
Or telephone us:
US: 202-326-6582
Europe/RoW: +44 (0) 1223 326500
Japan: +81-(0) 90-9110-1719
China/Korea/Singapore/Taiwan/Thailand: +86-1367-1015-294
To Book Your Ad:
Postdoc CareersSpecial Career Feature: March 8, 2013
Reserve your ad by February 19 to guarantee space.*
*Ads accepted until March 4 if space is still available.
SpecialDistribution:
Additional mailingto 100,000 scientistsbeyond our regular
circulation
Here’s why you should advertise in this issue:
Scientific collaborations are a key element of success in the current
economic climate. Postdocs, more than ever, must be effective at identifying and
forging relationships with fellow scientists and organizations. This special feature
examines how to best develop these types of partnerships, and Ph.D.s from around
the globe will be reading this important content. Tell these scientists what exciting
postdoc experiences await them at your university or organization.
Your job ad is seen by 700,000 readers around the globe from varied backgrounds
and it sits on special bannered pages promoting postdoctoral opportunities. Over
57% of our weekly readers work in academia and 67% are Ph.D.s. Science
connects you with more scientists in academia than any other publication.
• Bonus distribution to National Postdoctoral Association,15–17March, Charleston, SC
• Bonus distribution to PittCon, 17–21March, Philadelphia, PA
• Special distribution to 100,000 additional scientists
beyond our regular circulation
ScienceCareers.org

on
lin
e @
scie
nce
care
ers
.org
The Institute for Genomic Biology at the University of Illinois at Urbana-Champaign offers a number of fellowships for truly exceptional youngscholars who have completed their Ph.D. within the last several years, and are looking for a stimulating and supportive interdisciplinary envi-ronment to carry out independent and collaborative research in the field of genomic biology. IGB Fellows will spend up to three years conduct-ing research in one of several research themes in the Institute, and ideally this research will also overlap with two or more of these thematicareas. Visit www.igb.illinois.edu/content/fellows-application formore information about the Institute, the research themes and the applicationprocedures. The closing date for all positions is April 1, 2013. Fellows will be announced on or about May 15, 2013.
BiocomplexityWe seek a postdoc with a strong quantitative background to join a multidis-ciplinary group exploring collective effects in biology from the genome to theecosystem scale. Ongoing research addresses the emergence of life and thenature of evolution prior to the Last Universal CommonAncestor, the evolu-tion of core cellular machinery in Archaea and other domains of life, the roleof horizontal gene transfer in shaping communities of microbes and phages,geomicrobiology, and the systems biology of microbes, biofilms and ecosys-tems. We are also developing an interest in evolutionary medicine, with specialinterest in combating the emergence of antibiotic resistance.(Nigel Goldenfeld,Teme Leader)
Genomic Ecology of Global ChangeTe Fellow will be involved in a cross-disciplinary project investigating howchanges in networks of genes affect plant and ecosystem function when chal-lenged by elements of global change, including greater carbon dioxide, ozone,drought, temperature, disease and herbivory.Te ideal candidate will have astrong background in plant biology and a record of expertise in molecular bi-ology, genomic ecology, physiology or modeling of gene networks or ecosystemfunction.Te ability to work creatively and productively in a highly interdisci-plinary and collaborative environment is essential. (Don Ort,Teme Leader)
Energy Biosciences InstituteTe Energy Biosciences Institute (EBI) is an externally funded theme withinthe IGB. It is the largest academia collaboration to date, currently receiving$500 million over ten years and focusing on the development of second-generation biofuels intended to significantly slow the rate of global climatechange. Its research ranges from systems biology of fermentative organismsto quantification of ecosystem services provided by new sustainable biofuelcrops.Te EBI also has an interest in geomicrobial approaches to increasingthe efficiency of oil extraction. Te full range of research can be seen at www.energybiosciencesinstitute.org.We seek an outstanding candidate across theseareas interested in applying genomic biology to understanding and develop-ing opportunities for improving sustainable biofuel production. Researchcan be at any point in the supply chain from improving feedstocks and theirenvironmental sustainability to producing fuel.Te appointee will work inan interdisciplinary laboratory of over 100 exceptional colleagues focused onthis challenge.Te appointment would also involve collaboration with ourpartners: UC Berkeley and BP. (Isaac Cann,Teme Leader)
Cellular Decision Making in CancerWe seek an individual with interest in quantitative biology. Our theme facultymembers have expertise in single molecule biophysics, genomics and chemicalbiology. Building on the current strengths on cell death, antiviral signaling, stemcell differentiation, live cell probing of decision making and genome instabilitymodeling, we aim to develop a multiple-scale narrative on how single moleculeevents in the cell are integrated into the protein networks to determine the cellfate. Cancer is a major focus area of research. (Taekjip Ha,Teme Leader)
Business, Economics, and Law of Genomic BiologyWe seek an individual with training in economics, business, law, or strategyand with an interest in technology entrepreneurship, technology industries,and biotechnology.Te Fellow will join a multidisciplinary group that includesbusiness, law, and technology experts; agricultural economics faculty; andpersonnel from the campus Office of Technology Management. Our theme isexploring issues in university-industry technology transfer, industry evolution,
intellectual property protection, the competitive and cooperative dynamics forboth entrepreneurial start-ups and existing corporations, the impact that glo-balization of biotechnology has on the evolution of industry, and the positionof U.S. firms in the global marketplace. (Jay Kesan,Teme Leader)
Regenerative Biology & Tissue EngineeringTe Fellow will be involved in one or more of our multidisciplinary projectsrelated to regenerative biology and harnessing the potential of adult/embry-onic stem cells for tissue engineering applications. Of particular interest isleveraging theme expertise in biomaterials fabrication, drug delivery systems,microfluidics-based in vitro experimental platforms, and in vivo evolution-ary biology and regeneration medicine studies.Te ideal candidate will haveexperience in one or more areas of (stem) cell biology, induced pluripotent celltechnology, biomaterials, microfluidics, and/or tissue engineering.(Paul Kenis,Teme Leader)
Mining Microbial GenomesTe Fellow will be involved in one of several multidisciplinary projects focusedon (1) the discovery, design, and development of novel antibiotics, or (2) theassignment of function to novel enzymes discovered in genome projects.Teideal candidate will have a proven record of expertise in microbially producednatural products and/or enzyme evolution. We are interested in candidateswith previous experience in bacterial metabolism, bacterial genetics, molecularbiology, biochemistry, enzyme evolution,metabolic engineering, organic syn-thesis, mass spectroscopy, bioinformatics and/or metagenomics.(Bill Metcalf,Teme Leader)
Gene Networks and DiversityWe seek a biologist with strong bioinformatics skills and training in one ormore of the following areas: gene regulation (especially relating to transcrip-tion factor dynamics or epigenomics), evolutionary biology, neuroscience, orsystems biology.Applicants with expertise in both experimental biology andbioinformatics will be strongly preferred.Te successful candidate will join amultidisciplinary team using systems biology approaches to analyze regulatorymechanisms underlying complex developmental and behavioral phenotypes,and components that may define determinants of inter- and intraspeciesdiversity. Fellows are expected to conduct research that contributes to thedevelopment of theme goals by integrating components from multiple thememembers’ areas of expertise. (Lisa Stubbs,Teme Leader)
Host-Microbe SystemsTe Fellow will be responsible for developing DNA isolation,microbial isola-tion, 16S rRNA gene sequencing and other metagenomic analysis techniquesfor surveying microbial content of the human and nonhuman primate vaginaland intestinal microbiomes.Additional responsibilities will include the cultureisolation and genome sequencing and other molecular biology techniquesto examine microbial, metabolic, and immunologic contents, phylogeneticcomparisons, and performing analyses using bioinformatics and othercomputational and analytical methods.Te ideal candidate will have a strongbackground in microbiology, biochemistry, or a related field with experienceand expertise in molecular microbial ecology and bioinformatics and/or bio-statistics. (BrendaWilson,Teme Leader)
Postdoctoral Fellowships in Genomic Biologyat the University of Illinois at Urbana-Champaign
The University of Illinois is an Affirmative Action/Equal Opportunity Employerwww.igb.illinois.edu

Research Position atICYS, NIMS, Japan
The International Center for Young Scientists (ICYS) of theNational Institute forMaterials Science (NIMS) is now seekinga few researchers. Successful applicants are expected to pursueinnovative research on broad aspects ofmaterials science usingmost advanced facilities inNIMS (http://www.nims.go.jp/eng/index.html).In the ICYS,we offer a special environment that enables youngscientists to work independently based on their own idea andinitiatives. All management and scienti.c discussions will beconducted in English. An annual salary between 5.03 and5.35 million yen (level of 2012) will be offered depending onquali.cation and experience. The basic contract term is twoyears andmay be renewed to one additional year depending onthe person’s performance. A research grant of 2million yen peryear will be supplied to the ICYS researcher.All applicants must have obtained a PhD degree within thelast ten years. Applicants should submit an application form,which can be downloaded from our web site, together with aresume (CV) and a list of publications. A research proposal onan interdisciplinary or integrated area related to the materialsscience should also be submitted. The application letter shouldreach the following address via e-mail or air mail by March29, 2013.Visit ourwebsite formore details (http://www.nims.go.jp/icys/).
ICYSAdministrative Of.ce,National Institute forMaterials Science
Sengen 1-2-1, Tsukuba, Ibaraki 305-0047, Japane-mail: [email protected]
The University of Konstanz, with its Institutional Strategy topromote Top-Level Research, has been receiving contnuous funding since 2007 within the framework of the Excellence Inititiveby the German Federal and State Governments.
The Zukunftskolleg of the University of Konstanz is offering:
A. up to fifteen ZIF Marie Curie 2-year PostdoctoralFellowships in any discipline represented at theUniversity of Konstanz (Salary Scale 13 TV-L)
for researchers in the early stage of their career, so as to enable themto develop and implement individual and independent researchprojects.
Fellowships will begin on September 1, 2013, and end on August 31,2015. Reference number 2013/015
B. up to seven ZIF Marie Curie 5-year ResearchFellowships in any discipline represented at theUniversity of Konstanz (Salary Scale 14 TV-L)
for the development and implementation of individual researchprojects.
Fellowships will begin on November 1, 2013, and end on October 31,2018. Reference number 2013/014
Applications, supporting materials, and two letters of reference should besubmitted in English by March 15, 2013 (17:00:00 GMT + 1:00) usingthe Online Application Platform:www.zukunftskolleg.uni-konstanz.de/online-application
Details concerning application require-ments and information about theZukunftskolleg are available on ourwebsite: http://www.zukunftskolleg.uni-konstanz.de
Contact: Dr. Nani Clow
e-mail: [email protected]
phone: +49 (0)75 31/88-5678
on
lin
e @
scie
nce
care
ers
.org
on
lin
e @
scie
nce
care
ers
.org
We are seeking postdoctoral research associates to conduct research on a five–year research award from the Bill &Melinda Gates Foundation(BM FG ). Te project, titled“RIPE – Realizing Increased Photosynthetic Efficiency,”has the potential to benefit farmers around the world by increas-ing productivity of staple food crops. Te goal of the research is to improve the photosynthetic properties of key food crops, particularly rice and cas-sava. Increasing photosynthetic efficiency has not yet been addressed by conventional breedingmethods, though it has the potential to increase yieldsand increase efficiency of water and nitrogen use. Project teammembers will apply recent advances in photosynthesis research and crop bioengineer-ing in RIPE. In addition, computer simulationmodels of the highly complex photosynthetic system, frommetabolic networks to field crop biophysics,combined with practical engineering,will identify the best targets for improving photosynthesis efficiency.
DUTIES&RESPONSIBILITIES: Tepostdoctoral positions will conduct research to improve photosynthesis and yield in C3 crop plants. Re-sponsibilities of the team of appointees will be to develop a computational engineering framework for selecting systems and synthetic approaches toincreasing crop photosynthesis, practical engineering of the selected changes, andmolecular, biochemical and whole crop physiological phenotypingin the laboratory and field.
EDUCATION&EXPERIENCE: Prospective candidates need a PhD in plant biology, plant genetics, plant biotechnology or a closely related discipline.Demonstrated skills in one ormore of the following areas of photosynthesis research is required:molecular biology and genetics, plant transforma-tion, use of available bioinformatics resources, gas exchange and/or mechanistic modeling which could be at the level of metabolic pathways or fieldcrop biophysics/micrometeorology.Te duties of this position require that the incumbent have a strong background in plant molecular biology, plantbiochemistry/physiology, or computational biology and be broadly knowledgeable of photosynthesis. Good oral and written communication skillscoupled with the ability to work independently and cooperatively are required.
PROPOSED START DATE: As soon as possible.
SALARY: Commensurate with qualifications and experience.
APPOINTMENT STATUS: Up to five years, contingent on changes in project scope and performance.
APPLICATION PROCESS: Please send a letter of application, resume/CV, and three professional references including phone number and emailaddress to the RIPE ProgramManager, Lisa Emerson <[email protected]>.
Postdoctoral Position Announcementat the University of Illinois at Urbana-Champaign, Institute for Genomic Biology

EMBL ofers a highly collaborative, uniquely international culture. It fosters
top quality, interdisciplinary research by promoting a vibrant environment
consisting of young, independent researchers with access to outstanding
graduate students and postdoctoral fellows. EMBL is an inclusive, equal
opportunity employer ofering attractive conditions and benefts appropriate
to an international research organisation.
Group Leader
Membrane Protein
Structural Biologyat EMBL/CSSB Hamburg, Germany
www.embl.org
This Group Leader position will be associated with EMBL as a
partner of the future Center for Structural Systems Biology (CSSB)
on DESY Campus, which will allow highly interdisciplinary research
across its members.
State-of-the-art infrastructures for applications in Life Sciences on
DESY Campus, Hamburg, Germany, provide a world-class
environment for most challenging experiments in Structural Biology
with high scientific significance. The Hamburg Unit of EMBL has built
an integrated facility in Structural Biology with three synchrotron
radiation beamlines for applications in macromolecular X-ray
crystallography and small angle X-ray scattering of biological
samples at the new PETRA III ring.
The successful candidate is expected to have his/her research focus
matching experience and research projects in membrane protein
crystallography with medically relevant research interests, preferably
in infection biology. It should include:
• Innovative use of synchrotron radiation in structural biology
• Complementary “hybrid” structural biology approaches
• Interest into Free Electron Laser applications (optionally)
• Plans for complementary functional experiments
The candidate will take a leading role both at CSSB and the EMBL
Hamburg Unit. She/he should have a PhD or similar degree in a
relevant research area, at least three years of postdoctoral
experience and an excellent research record.
Please apply online through www.embl.org/jobs and include a
cover letter, CV and a concise description of research interests
and future research plans. Please also arrange for 3 letters of
recommendation to be emailed to [email protected] at the
latest by 17 March 2013.
Interviews are planned for 22 and 23 April 2013.
Further details on Group Leader appointments can be found under
www.embl.org/gl_faq.
For further information about the position and about research at
EMBL please visit …
on
lin
e @
scie
nce
care
ers
.org
FACULTY POSITIONUniversity Of Florida
Department of Geography and theEmerging Pathogens Institute (EPI)
Department of Geography and the Emerging Path-ogens Institute (EPI) invite applications for a full-timeposition at the level ofASSISTANT or ASSOCIATEPROFESSOR, starting August 16, 2013. This is anine-month, tenure accruing, research-oriented posi-tion, with a specialization in quantitative spatial andspatio-temporal models to address questions in infec-tious diseases or public health. Specialties can include(but are not limited to) geospatial or mathematicalmodeling for transmission of human and animal dis-eases, interactions between climate and disease ecology,relationships between socio-economics and disease risk,and health intervention strategies. We seek individualswith demonstrated success in grant activity and pub-lications in top journals. The successful candidate shouldpossess a doctoral degree in Geography or other relevantdisciplines and will be expected to engage deeply in theEPI research program while maintaining good standingin teaching and service to the Geography Departmentand its mission. Submit a curriculum vitae and letter ofapplication describing research program and its future toDr. Peter Waylen, Search Committee Chair, Depart-ment of Geography, University of Florida, Box117315, Gainesville, FL, 32611. We prefer thatapplication materials be sent electronically to e-mail:[email protected] and the application be completedonline at website: http://jobs.ufl.edu/postings/31925. All application materials must be received byMarch 15, 2013. Short-listed candidates will be con-tacted to provide three letters of reference. Minorities,women, and those from underserved groups are encouraged to apply.The University of Florida is an Equal Opportunity Institution.
ASSISTANT/ASSOCIATEPROFESSOR of Biology
Morris College, a private four year Liberal Arts Col-lege in Sumter, South Carolina, is seeking to fill thefollowing position(s): Assistant/Associate Professor ofBiology. Will teach three sections of a laboratory-based,general education (for non-majors), introductory biol-ogical sciences course. Duties also include studentadvising, committee assignments, participation in reg-istration, and other duties as needed.Must have a Ph.D.or M.S. degree in biology. Must be available for em-ployment in August 2013.Submit a letter of application, personal resume, three
letters of recommendation, and official academic tran-scripts to: Director of Personnel, Morris College,100 W. College, Sumter, SC 29150-3599. Morris Col-lege is an Equal Opportunity/Affirmative Action Employer.
The Department of Biological Sciences at ChicagoState University (CSU) seeks applications for threetenure-trackASSISTANT PROFESSOR positions.Appointments begin in August 2013. All areas ofbiology will be considered; however, preference willbe given to candidates in microbiology, cell biology,zoology, urban agriculture/aquaponics, and secondaryeducation. Selected individuals are expected to establisha research program involving undergraduate and grad-uate students, supported by extramural funding. Ph.D.in Biology or related fields required; postdoctoral and/orteaching experience preferred. Only electronic appli-cations are accepted. Instructions are available atwebsite:https://chicagostate.peopleadmin.com/postings.Review will start immediately and will continue untilFebruary 28, 2013. Reference letters (3) will be acceptedelectronically at e-mail: [email protected]. CSU is anEqual Opportunity/Affirmative Action Employer.
UNIVERSITY OF HAWAII atManoa Cancer Center
ASSISTANT RESEARCHER (Cancer Biology Pro-gram), Position #70209, Tenure-track, Continuous—application review begins February 5, 2013. Refer towebsite: http://www.pers.hawaii.edu/wuh/ for com-plete information. The University of Hawaii is an EqualOpportunity/Affirmative Action Institution. Women and minor-ities are encouraged to apply.
FACULTY POSITIONS

AAAS is here – helping scientists achieve career success.
Every month, over 400,000 students and scientists visit ScienceCareers.org in search of the information, advice, and
opportunities they need to take the next step in their careers.
A complete career resource, free to the public, Science Careers offers a suite of tools and services developed specifically
for scientists. With hundreds of career development articles, webinars and downloadable booklets filled with practical
advice, a community forum providing answers to career questions, and thousands of job listings in academia, govern-
ment, and industry, Science Careers has helped countless individuals prepare themselves for successful careers.
As a AAAS member, your dues help AAAS make this service freely available to the scientific community. If you’re not
a member, join us. Together we can make a difference.
To learn more, visit aaas.org/plusyou/sciencecareers