science of driving - safer-simsafersim.nads-sc.uiowa.edu/final_reports/ui-6-y2_finalreport.pdf ·...
TRANSCRIPT
Science of Driving
Leslie Flynn, Ph,D, Clinical Assistant Professor
Teaching and Learning The University of Iowa
Timothy Brown Ph.D. Associate Research Scientist
National Advanced Driving Simulator
The University of Iowa

ii
Science of Driving
Timothy L Brown, Ph.D.
Associate Research Scientist
National Advanced Driving Simulator
The University of Iowa
Leslie Flynn, Ph.D.
Clinical Assistant Professor
College of Education
The University of Iowa
A Report on Education Sponsored by
Safer Sim University Transportation Center

iii
August 2016
iv
Table of Contents
Table of Contents ............................................................................................................................ iv
List of Figures ................................................................................................................................... vi
Abstract .......................................................................................................................................... vii
1 Background ................................................................................................................................ 8
2 Approach .................................................................................................................................... 9
SaferSim Curriculum Module Development..................................................................................... 9
SaferSim Teacher Professional Development .................................................................................. 9
SaferSim Teacher Classroom Labs .................................................................................................... 9
3 Curriculum................................................................................................................................ 11
4 Development Process .............................................................................................................. 11
5 Curriculum Summary ............................................................................................................... 12
Graphing Interpretation Competition ............................................................................................ 13
5.1.1 Goals .................................................................................................................. 13
5.1.2 Justification ....................................................................................................... 13
5.1.3 Lesson One: On the Move ................................................................................. 13
5.1.4 Lesson Two: Graphing Complex Motion ........................................................... 13
5.1.5 Lesson Three: Simulation Driving Day ............................................................... 13
Friction 13
5.1.6 Goals .................................................................................................................. 13
5.1.7 Justification ....................................................................................................... 13
5.1.8 Lesson One: Factors that Affect Motion ........................................................... 14
5.1.9 Lesson Two: Simulation Driving Day ................................................................. 14
5.1.10 Lesson Three: Finalizing Friction ....................................................................... 14
6 Professional Development ....................................................................................................... 14
7 Development Process .............................................................................................................. 16
8 Next Steps ................................................................................................................................ 17
9 Outreach .................................................................................................................................. 18
10 Conclusions, Recommendations and Future Work ................................................................. 23
References ...................................................................................................................................... 24
v
Appendix A Curriculum Materials for Graphing and Friction ......................................................... 25
Appendix B Curriculum Materials for Driver Distraction ............................................................. 119
vi
List of Figures
Figure 4.1 - Student texting and driving simulation. ...................................................................... 12
Figure 9.1 - Classroom of students watching another student driving the simulation on
friction. ..................................................................................................................................... 18
Figure 9.2 - A male middle school student driving a simulation scenario in front of his class in
Norwalk, Iowa. ......................................................................................................................... 19
Figure 9.3 - A female middle school student driving the texting simulation scenario in front of
her class in Norwalk, Iowa. ...................................................................................................... 19
Figure 9.4 - Students receiving instruction before driving the simulator. ..................................... 20
Figure 9.5 - Students discussing the classroom portion of the curriculum. .................................. 20
Figure 9.6 - A male student from Bettendorf Middle School driving the texting simulator
scenario. ................................................................................................................................... 21
Figure 9.7 - Students observing another student driving the simulator. ....................................... 21
Figure 9.8 - Students in Bettendorf, Iowa, engaged and answering questions prior to a drive on
the simulator. ........................................................................................................................... 22
vii
Abstract
The Science of Driving project focused on developing a collaborative relationship to develop
curriculum units for middle school and high school students to engage them in exciting real-
world scenarios. This effort involved faculty, staff, and students from the Colleges of Education,
Business, and Engineering who worked to link Next Generation Science and Engineering
Standards to the reality of driving. This resulted in the development of three curriculum units
focused on graphical interpretation, friction, and distracted driving. These curriculum units
were provided to over 56 in-service teachers with a potential to impact 7,700 students. Future
development will include a new website to expand the reach of the curriculum modules across
the country.
8 Science of Driving
1 Background
The federal government has identified a critical need for additional STEM workers as the nation
moves forward. In April 2012, a report issued by the U.S. Congress Joint Economic Committee
chairman’s staff identified that improving access to STEM education is required to strengthen
the U.S. workforce to compete in the world economy. In many cases, it remains a challenge to
get school-aged children excited about STEM classes, which can often be more challenging.
There is a critical need for outreach to teachers and students to make this content more
relevant and approachable.
As children grow and develop, there is an increasing desire for independence. Independent
mobility is a key factor that allows adolescents access to their friends, educational
opportunities, recreational activities, and employment. For many, obtaining a license is a “rite of
passage” that leads to this independence. School-aged children aged 13-16 are often very
interested in and motivated by driving as they approach getting their license. Building on this
interest creates an opportunity to introduce STEM concepts to these teens through an
interactive driving simulation environment.
9 Science of Driving
2 Approach
The research project involved the development, testing, and implementation of a driving-based
curriculum for STEM education. This effort was geared toward two endpoints, professional
development (PD) and classroom-based lab (CL). Both focused on enhancing STEM education
through a “Science of Driving” paradigm. This included the development of lesson plans that
can be utilized in these two approaches and the development of necessary driving simulator
scenarios and data reduction scripts to make the data usable for students and teachers. The
aim of the PD was an in-depth exposure to the curriculum modules including data and how it
can be used to understand the physics of driving, what drivers are doing, and how systems can
be evaluated. Additionally, the PD provided feedback on gaps in the curriculum. The aim of the
classroom course is to provide context and allow students to collect data that they can use to
address an immediate question and in future lessons.
2.1 SaferSim Curriculum Module Development
A team of science education graduate students from the College of Education and their
professor, Dr. Leslie Flynn, engaged with the National Advanced Driving Simulator (NADS) staff
to tour the NADS facility and learn the SaferSim program and current capabilities of the miniSim.
Across the course of the semester, students developed two independent curricular,
instructional, and assessment modules that complement the miniSim experience. Students
communicated frequently with NADS staff to make sure they were meeting expectations and
the content was accurate. The modules were aligned to national science and mathematics
standards including conceptual understandings (force, motion, friction, velocity, etc.) and
practices of science (making observations, asking questions, analyzing and interpreting data,
etc.). Additionally, PD activities were developed for use with teachers. Following the initial PD, a
team of science education graduate students from the College of Education and their professor,
Dr. Flynn, engaged with NADS staff to adapt the developed curriculum material based on
feedback from the teacher PD.
2.2 SaferSim Teacher Professional Development
The curriculum modules were used during the fall 2015 PD institute and distributed to 56 in-
service and 21 pre-service teachers in 2016 to expand the learning opportunities of their
students who could work with miniSim. In the fall of 2015, 9 in-service and 2 pre-service STEM
teachers engaged in a full day of PD and explored the NADS facility and engaged with SaferSim.
The teachers engaged in the curriculum modules and made curricular, instructional, and
assessment suggestions for revision. Facilitating the PD were three science education graduate
students who developed the modules, Dr. Flynn, and NADS staff. Dr. Flynn also facilitated a
school-year follow-up to see how curriculum materials had been incorporated into classroom
practice and how students responded to the lessons.
2.3 SaferSim Teacher Classroom Labs
Utilizing the curriculum developed in the other tasks, classroom labs were coordinated to
provide hands-on experiences for students and to provide context to the data. Local schools
and teachers were recruited to participate. This was facilitated through contact with teachers in
the PD program and through the local Area Education Associations and the Kirkwood Regional
10 Science of Driving
Center at the University of Iowa, next door to NADS. The number of classes conducted at each
school was dependent on the size and participation from the interested schools. The classroom
lab was offered both as a full implantation of the curriculum and as an augmentation to existing
curriculum in use in the district. In the case of augmentation, the simulation and related
activities were used to either introduce or reinforce a concept or a practice of science. For the
classroom sessions, the course was conducted and feedback was obtained from the teacher. A
portable miniSim was set up at the school to allow for the collection and processing of data that
was used by the students for exploration of STEM concepts and practices as part of the assigned
lesson and subsequent lessons conducted by the teacher. Simulator data was sent back to
teachers approximately one week after the simulator visit.
11 Science of Driving
3 Curriculum
Curriculum was developed in three units: graphing interpretation, friction, and texting. Each is a
fully developed curriculum component that includes all instruction and assessment tools for
implementation, and all units are mapped to National Science and Engineering Standards. This
section details the development process in more detail, summarizes each of the curriculum
units, and outlines the PD.
3.1 Development Process
The process to develop the curriculum was an iterative process between NADS and the College
of Education at the University of Iowa. It provided the side benefit of additional STEM exposure
and educational opportunities to teachers-in-training. The process used the following steps,
with the most effort associated with the iterative development, testing, and refinement of the
curriculum and scenarios.
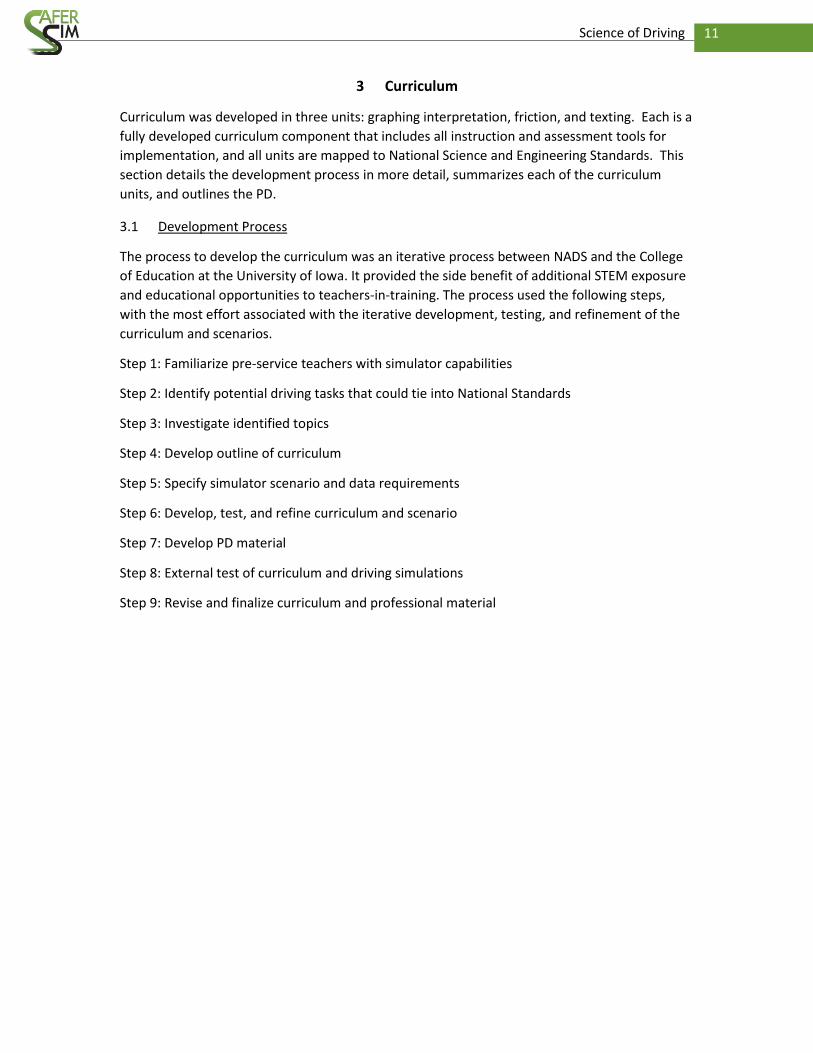
Step 1: Familiarize pre-service teachers with simulator capabilities
Step 2: Identify potential driving tasks that could tie into National Standards
Step 3: Investigate identified topics
Step 4: Develop outline of curriculum
Step 5: Specify simulator scenario and data requirements
Step 6: Develop, test, and refine curriculum and scenario
Step 7: Develop PD material
Step 8: External test of curriculum and driving simulations
Step 9: Revise and finalize curriculum and professional material
12 Science of Driving
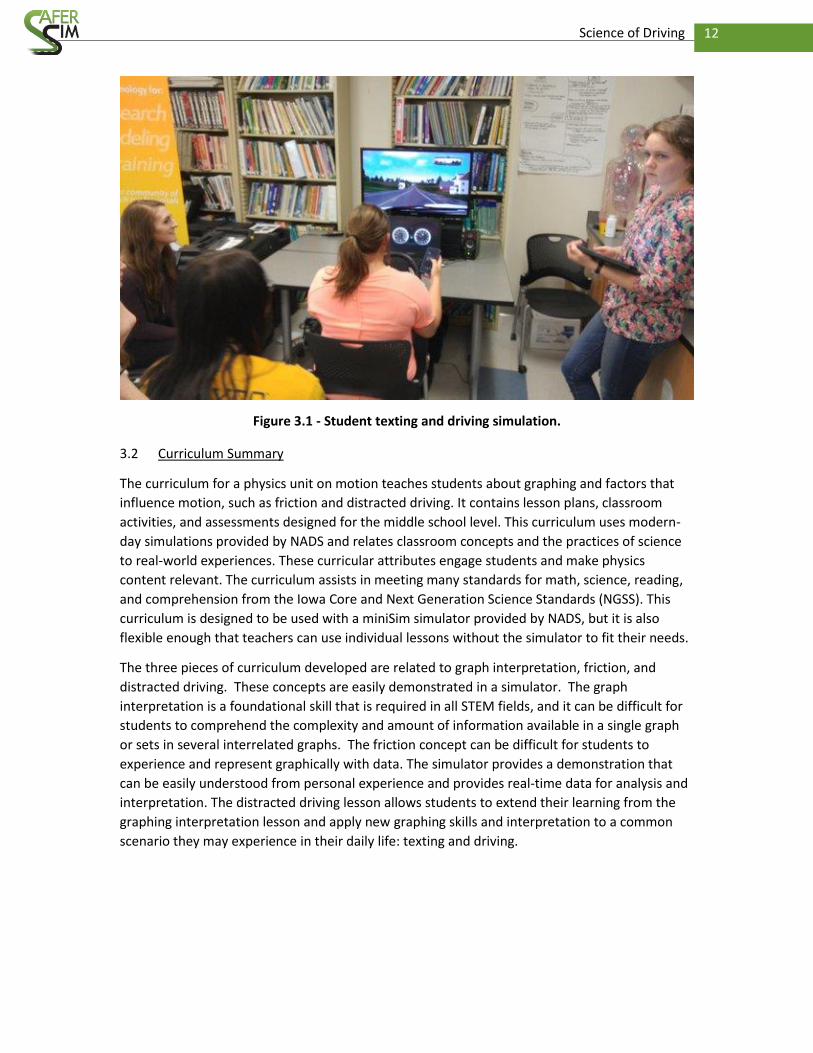
Figure 3.1 - Student texting and driving simulation.
3.2 Curriculum Summary
The curriculum for a physics unit on motion teaches students about graphing and factors that
influence motion, such as friction and distracted driving. It contains lesson plans, classroom
activities, and assessments designed for the middle school level. This curriculum uses modern-
day simulations provided by NADS and relates classroom concepts and the practices of science
to real-world experiences. These curricular attributes engage students and make physics
content relevant. The curriculum assists in meeting many standards for math, science, reading,
and comprehension from the Iowa Core and Next Generation Science Standards (NGSS). This
curriculum is designed to be used with a miniSim simulator provided by NADS, but it is also
flexible enough that teachers can use individual lessons without the simulator to fit their needs.
The three pieces of curriculum developed are related to graph interpretation, friction, and
distracted driving. These concepts are easily demonstrated in a simulator. The graph
interpretation is a foundational skill that is required in all STEM fields, and it can be difficult for
students to comprehend the complexity and amount of information available in a single graph
or sets in several interrelated graphs. The friction concept can be difficult for students to
experience and represent graphically with data. The simulator provides a demonstration that
can be easily understood from personal experience and provides real-time data for analysis and
interpretation. The distracted driving lesson allows students to extend their learning from the
graphing interpretation lesson and apply new graphing skills and interpretation to a common
scenario they may experience in their daily life: texting and driving.
13 Science of Driving
3.3 Graphing Interpretation Competition
3.3.1 Goals
To give students the skills to analyze and construct graphs (position vs. time, velocity vs. time,
acceleration vs. time, and direction vs. time).
3.3.2 Justification
Students are often introduced to graphs, but according to the teachers consulted, students
rarely have the ability to fully analyze and describe them. Graph interpretation is needed in
many professions and in day-to-day life, and is seen on many standardized tests. By introducing
students to graphing early, they will be given the opportunity to improve graphing skills
throughout middle school and high school.
3.3.3 Lesson One: On the Move
The introduction to graphing motion starts with probes to discuss the misconceptions. An
activity follows to engage students in kinesthetic learning and produces data that is graphed.
Velocity and acceleration are calculated based on the data acquired.
3.3.4 Lesson Two: Graphing Complex Motion
Students use their homework to evaluate position (distance), speed, acceleration, and direction
for complex motion. Students analyze the trip they wrote for their homework from the
perspectives of distance, speed, acceleration, and direction to be used to graph the motion. The
teacher asks students to draw a data set consisting of four graphs by the end of class: (1)
distance vs. time, (2) speed vs. time, (3) acceleration vs. time, and (4) direction vs. time.
Students are then expected to analyze a data set of a new situation and determine the trip
events in order for complex motion. Students work in groups of four, and roles for the simulator
are assigned.
3.3.5 Lesson Three: Simulation Driving Day
Groups should finalize their driving plan before driving the simulator to replicate the graphs
given to them the prior day. Afterwards, NADS-generated graphs are compared to the activity
graphs. An assessment follows NADS simulation and graph comparison.
3.4 Friction
3.4.1 Goals
To educate middle school students about friction and how it affects driving: Students will
understand that there are forces and factors that influence motion, including mass, velocity, and
friction.
3.4.2 Justification
Middle school students have many misconceptions about physics, particularly in friction. These
misconceptions are as follows:
14 Science of Driving
Friction is caused by surface roughness (there are many times when this is indeed true,
but there are other times where a surface may not be as rough but still has more
friction, e.g., the sticky side of tape is less rough than sandpaper but has more friction)
An object doesn’t stop because of the presence of a force; it stops because of the
absence of a force
Objects at rest have no forces acting on them
Moving objects come to a stop even when there is no friction
Friction only occurs between solids
There are tiny bumps that cause friction (the use of sandpaper)
Friction always hinders motion; reducing friction is always desired
The science teacher should address these misconceptions, identify where they come from, and
provide experiences for students to address their conceptions to prevent them from recurring.
3.4.3 Lesson One: Factors that Affect Motion
This lesson serves as an introduction to the driving simulator activity. Students collect data and
draw conclusions about how different variables such as mass, velocity, and friction affect
motion. Students are then introduced to the stopping distance calculation that they will use in
the driving simulation activity.
3.4.4 Lesson Two: Simulation Driving Day
The purpose of the lesson is to have students collect data on stopping distance using a
combination of variables. Students are assigned their variable combination and are to complete
their calculations predicting the stopping distance needed with that variable combination. The
variables are car type (either the BMW or Expedition) and coefficient of friction (COF) (0.85, 0.4,
or 0.2). There are six possible car and COF combinations: BMW+0.85 COF, BMW+0.4 COF,
BMW+0.2 COF, Expedition+0.85 COF, Expedition+0.4 COF, and Expedition+0.2 COF. Students
drive the simulator for their given variables. The simulation will be set up to match each group’s
variable combination when they arrive at the simulator. After students run the simulation for
their assigned variables, they record their results, discuss their results with class members, and
partake in journaling as an assessment.
3.4.5 Lesson Three: Finalizing Friction
Students are given a quiz to assess their understanding of the concepts that were used in
the previous lessons. After the quiz, students engage in either an open or guided discussion
of the simulation activity and/or discuss the concepts themselves, clearing up any
misconceptions that still persist. There may also be opportunity for further journaling.
3.5 Professional Development
Professional development for teachers who will implement the Science of Driving curriculum is
an essential element for incorporation into existing school curricular, instruction, and
assessment practices. Our approach is to provide multiple experiences for teachers across
several years to increase the likelihood of implementation. Research indicates that this
approach is effective in translating teacher learning into practice to impact student learning
15 Science of Driving
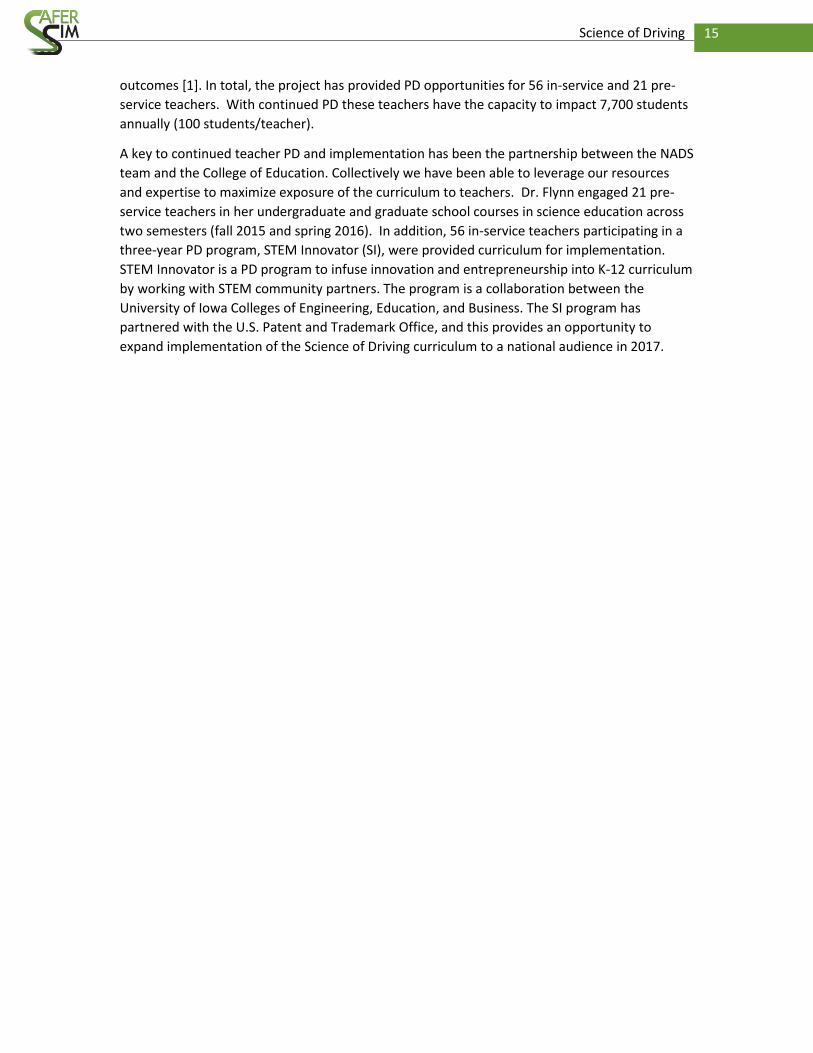
outcomes [1]. In total, the project has provided PD opportunities for 56 in-service and 21 pre-
service teachers. With continued PD these teachers have the capacity to impact 7,700 students
annually (100 students/teacher).
A key to continued teacher PD and implementation has been the partnership between the NADS
team and the College of Education. Collectively we have been able to leverage our resources
and expertise to maximize exposure of the curriculum to teachers. Dr. Flynn engaged 21 pre-
service teachers in her undergraduate and graduate school courses in science education across
two semesters (fall 2015 and spring 2016). In addition, 56 in-service teachers participating in a
three-year PD program, STEM Innovator (SI), were provided curriculum for implementation.
STEM Innovator is a PD program to infuse innovation and entrepreneurship into K-12 curriculum
by working with STEM community partners. The program is a collaboration between the
University of Iowa Colleges of Engineering, Education, and Business. The SI program has
partnered with the U.S. Patent and Trademark Office, and this provides an opportunity to
expand implementation of the Science of Driving curriculum to a national audience in 2017.
16 Science of Driving
4 Development Process
Step 1: Identification of existing PD opportunities to incorporate curriculum
Step 2: Identification of new PD opportunities
Step 3: Needs assessment of in-service teachers
Step 4: Pilot testing of PD curriculum Units 1 (graphing) and 2 (friction) by pre-service teachers
and Dr. Flynn
Step 5: Development of December 2015 PD
Step 6: Delivery of December 2015 PD
Step 7: Revision of curriculum Units 1 and 2 based on teacher feedback from December 2015 PD
Step 8: Development of Unit 3 curriculum (distracted driving)
Step 9: Pilot testing of Unit 3 PD activities with pre-service teachers
Step 9: Revision of Unit 3 PD activities by Dr. Flynn, pre-service teachers, and NADS
Step 9: Pilot testing of Unit 3 with in-service middle school teachers and students
Step 10: Introduction of curriculum to 56 middle and high school teachers at STEM Innovator
teacher conference (June 2016)
Step 11: Planning of next steps for additional PD

17 Science of Driving
5 Next Steps
Dr. Flynn’s pre-service teachers of fall 2016 are engaging with NADS and high school students to
develop additional driving scenarios around teen driving. The goal is to incorporate the
scenarios into additional curricular unit opportunities for teachers in 2017. Through the STEM
Innovator teacher PD program, there is an expansion opportunity to have NADS serve as a
national model for curriculum development and PD implementation in the arena of
transportation education.
18 Science of Driving
6 Outreach
Implementation of the curriculum and related materials is a critical aspect of evaluating the
success of this project. As discussed earlier, two forms of outreach were used to expose
students to the developed lessons. The first, and most straightforward, was the classroom labs.
This involved providing support for the curriculum exactly as documented in the curriculum by
working with the teachers. The second approach was more complex and involved miniSim
demos for teachers. In this method, we worked with teachers to determine how the curriculum
material could be used to enhance the learning experiences of their students. This generally
involved the following approaches: introducing new topics before the teacher covered it with
their existing curriculum and/or reinforcing previous lessons through the simulator experience.
A typical miniSim demo involved working with the teacher to prepare for the demo, working on
demonstration day, and providing data for the students and teacher. The preparation work
began with conversations between a coordinator at NADS and the teacher about content and
dates. During this portion, the material for the overall curriculum was shared to help determine
what was to be covered during the demo. On the demonstration day, a team was present at the
school for the entire day and went through the agreed-upon material relating to graphing and
friction with the students. This may have included students from multiple teachers, depending
upon class size and number of sections. At the end of the day, data from the student drives was
reduced and provided to the teacher for use with the class.
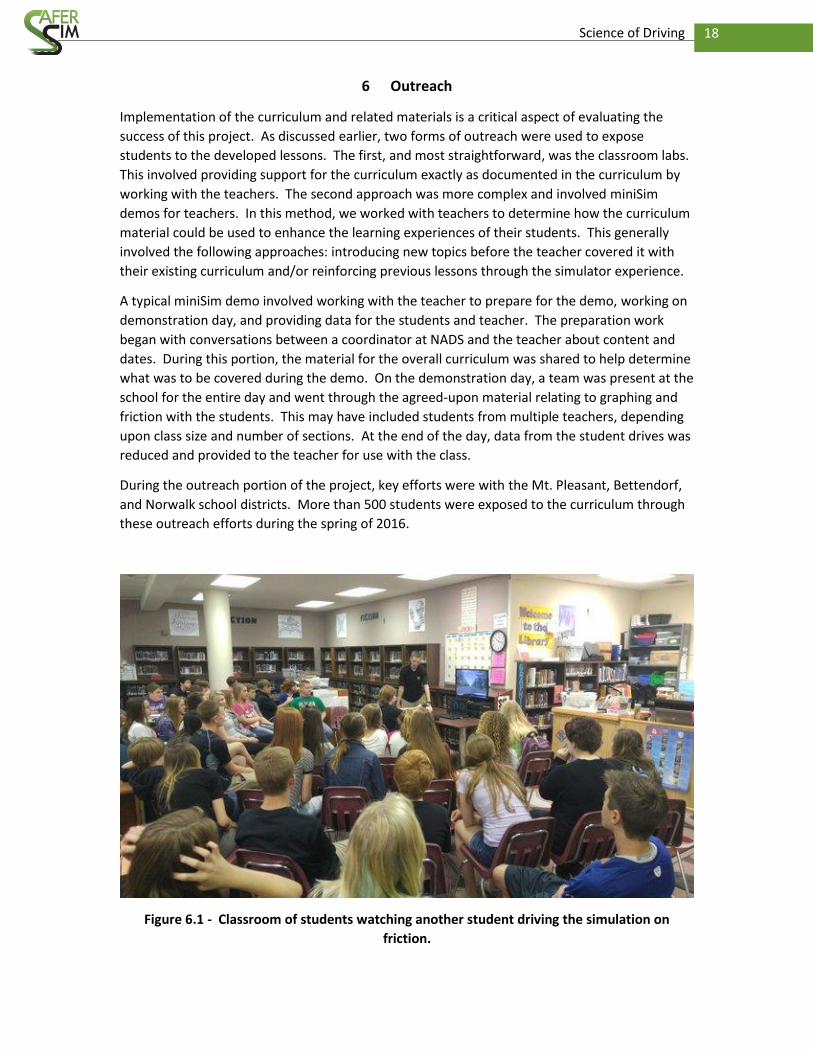
During the outreach portion of the project, key efforts were with the Mt. Pleasant, Bettendorf,
and Norwalk school districts. More than 500 students were exposed to the curriculum through
these outreach efforts during the spring of 2016.
Figure 6.1 - Classroom of students watching another student driving the simulation on
friction.
19 Science of Driving
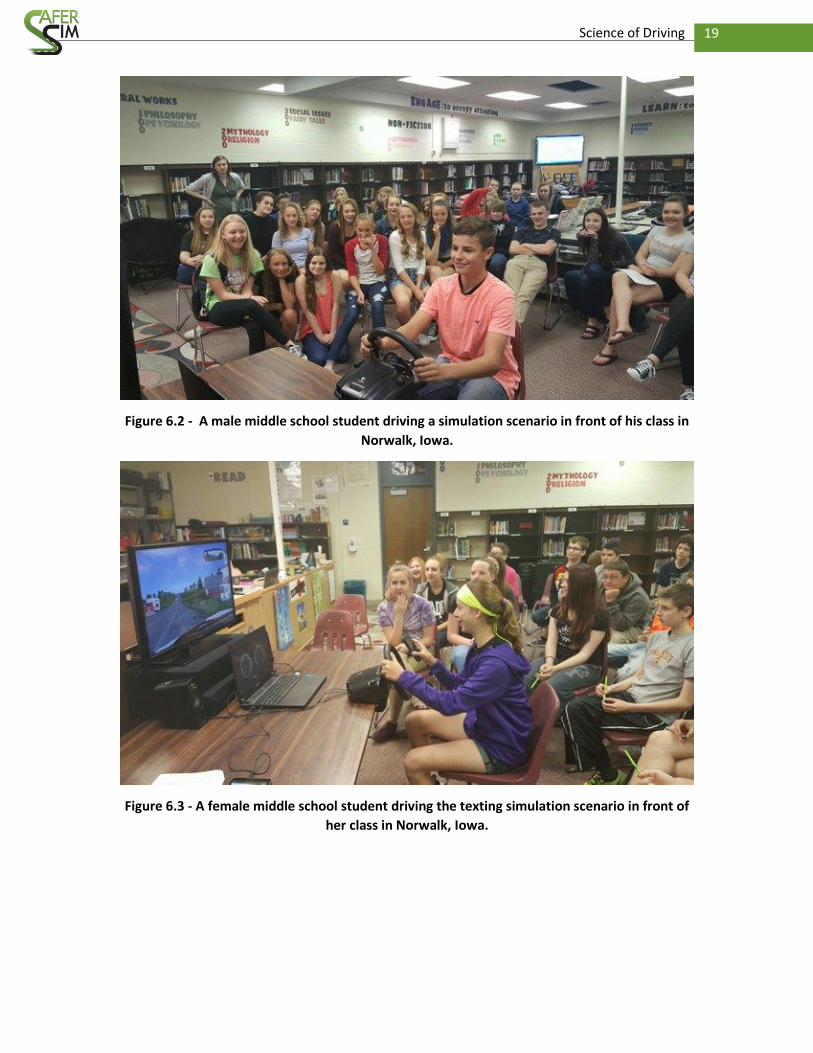
Figure 6.2 - A male middle school student driving a simulation scenario in front of his class in
Norwalk, Iowa.
Figure 6.3 - A female middle school student driving the texting simulation scenario in front of
her class in Norwalk, Iowa.
20 Science of Driving
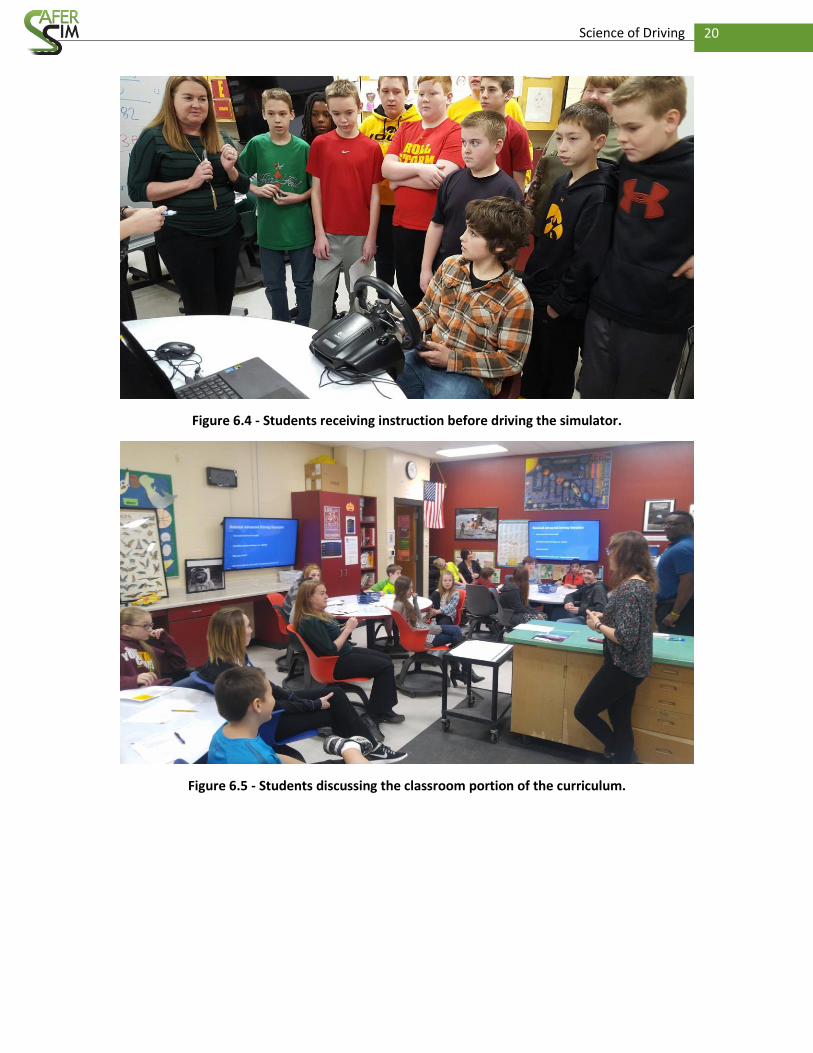
Figure 6.4 - Students receiving instruction before driving the simulator.
Figure 6.5 - Students discussing the classroom portion of the curriculum.
21 Science of Driving
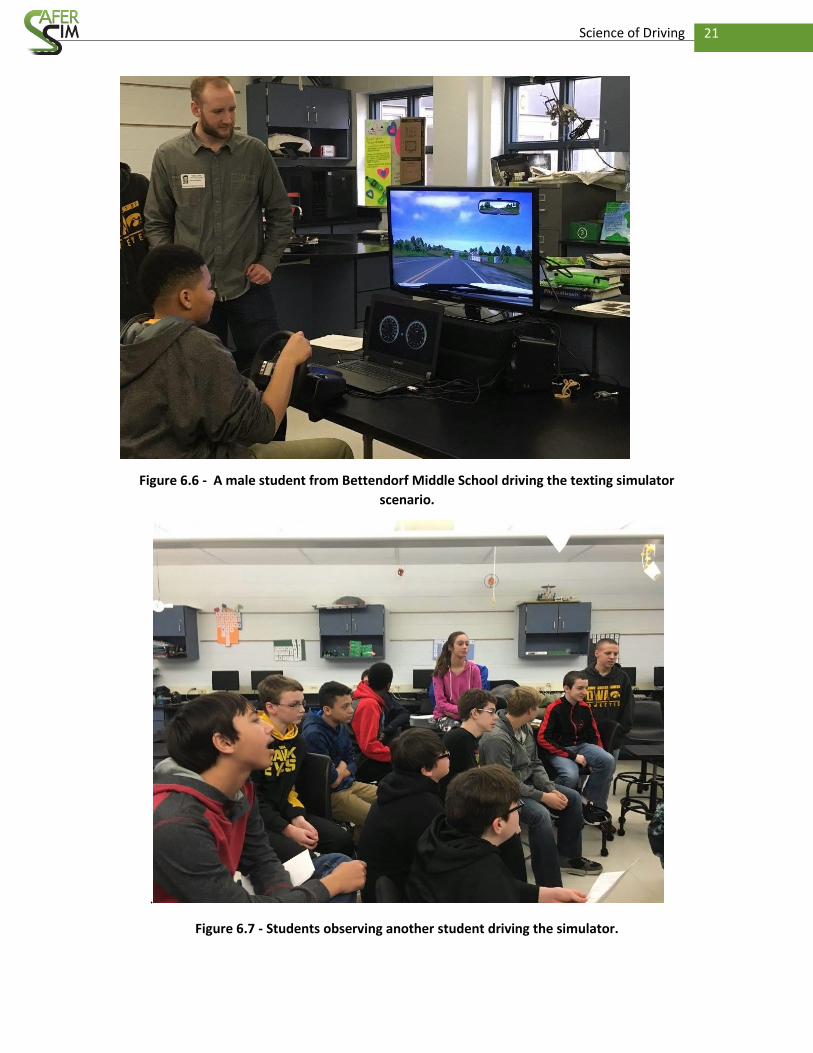
Figure 6.6 - A male student from Bettendorf Middle School driving the texting simulator
scenario.
.
Figure 6.7 - Students observing another student driving the simulator.
22 Science of Driving
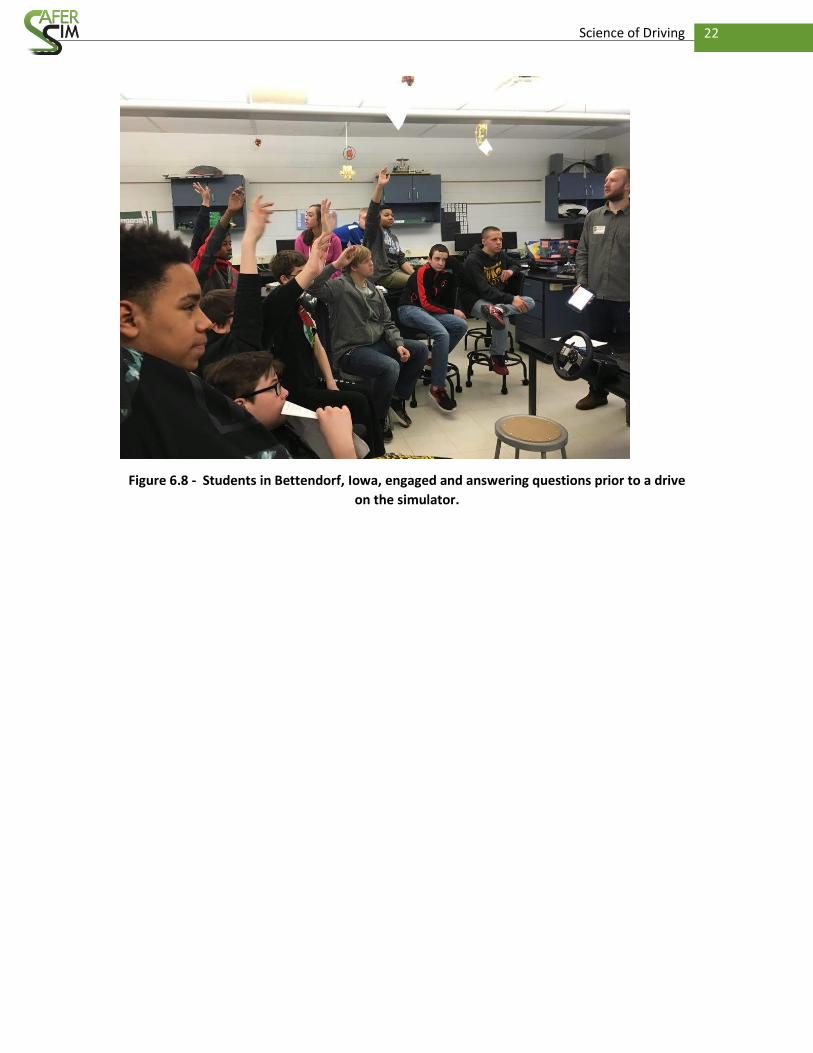
Figure 6.8 - Students in Bettendorf, Iowa, engaged and answering questions prior to a drive
on the simulator.
23 Science of Driving
7 Conclusions, Recommendations, and Future Work
This effort has provided the foundation for continued work to provide K-12 STEM curriculum
that is tied to national standards for use in the classroom. Overall the teachers and students
that we have interacted with provided positive responses to the material in the curriculum and
are excited for future developments. Despite only providing the material for one semester,
there was tremendous interest, which will allow us to increase our outreach moving forward.
The process of collaboration between the College of Education and NADS creates the
opportunity to add additional lessons using the same process. The integration of this
development with Dr. Flynn’s class also allows for a richer educational opportunity for the
teachers in training. The plans include continued collaboration to develop additional lessons on
other topics related to driving, with a new lesson being completed or refined each year.
In addition to providing the classroom component, the team is planning to begin the process of
developing a web page as a resource for K-12 schools. It would include the ability to download
curriculum, request lab or demo visits, and access videos and data that could be used by
teachers across the country who do not have access to the simulator for a visit.

24 Science of Driving
References
1. Cochran-Smith, M. (2005). Studying Teacher Education: The Report of the AERA Panel on
Research and Teacher Education. Mahwah, New Jersey: Lawrence Erlbaum Publishers.
2. Keeley, P. (2010). Uncovering Student Ideas in Physical Science, Volume 1: 45 New Force and
Motion Assessment. Arlington, VA: NSTA Press.
3. NGSS Lead States. (2013). Next Generation Science Standards: For States, By States.
Washington, DC: The National Academies Press.

25 Science of Driving
Appendix A Curriculum Materials for Graphing and Friction
27 Science of Driving
Curriculum Overview
This curriculum, for a physics unit on motion, teaches students about
graphing and factors that influence motion, such as friction. It contains lesson
plans, classroom activities, and assessments designed for the middle school level.
This curriculum uses modern-day simulations provided by The National Advanced
Driving Simulator (NADS) and relates classroom content to real-world
experiences. Both of these attributes will engage students and make physics
content relevant. The curriculum assists in meeting many standards for math,
science, reading, and comprehension from the Iowa Core and Next Generation
Science Standards (NGSS). This curriculum is designed to be used with a portable
MiniSim simulator brought into your classroom by NADS, but it is also flexible
enough, so teachers can use individual lessons to fit their needs.
This project was funded by a Safer-Sim Department of Transportation grant.
This project was created by The University of Iowa, College of Education,
Social and Educational Applications of Physics class in cooperation with the
National Advanced Driving Simulator and students from The University of Iowa
College of Engineering.
28 Science of Driving
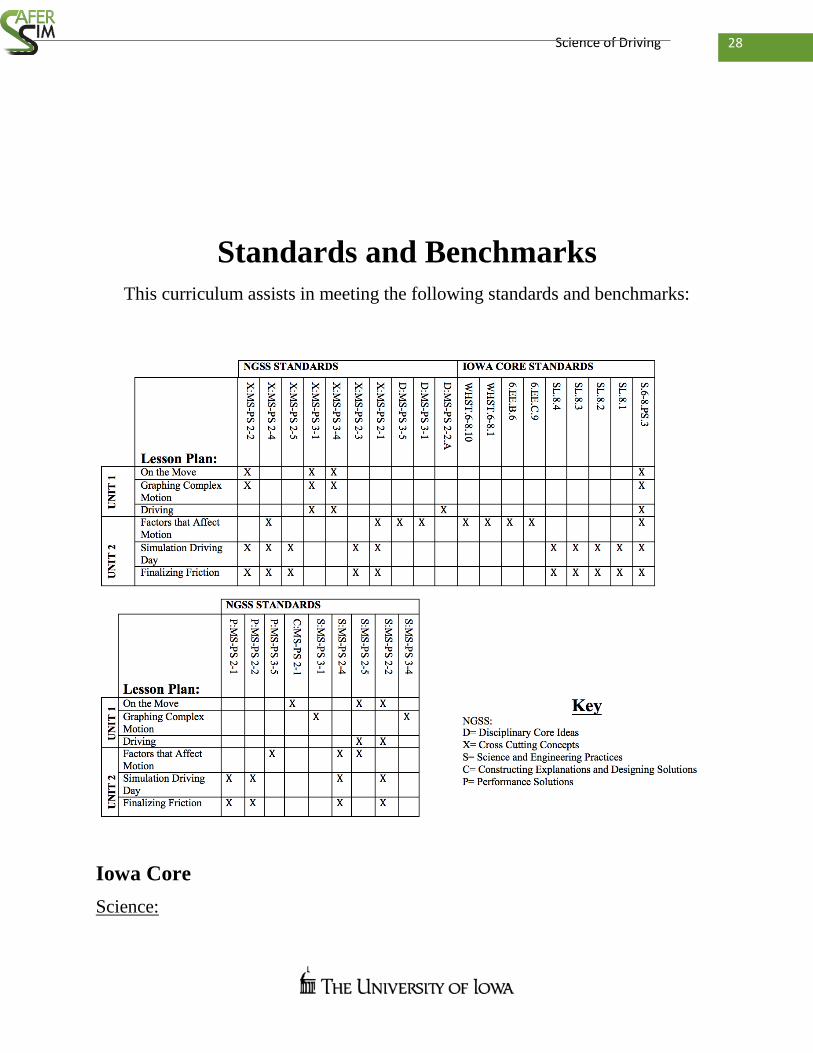
Standards and Benchmarks
This curriculum assists in meeting the following standards and benchmarks:
Iowa Core
Science:
29 Science of Driving
S.6–8.PS.3:
o Essential Concept and/or Skill: Understand and apply knowledge of motions and
forces.
The motion of an object can be described by its position, direction of motion, and
speed. That motion can be measured and represented on a graph.
An object that is not being subjected to a force will continue to move at a constant
speed and in a straight line.
o If more than one force acts on an object along a straight line, then the forces will
reinforce or cancel one another, depending on their direction and magnitude.
Unbalanced forces will cause changes in speed or direction of an object’s motion.
Comprehension and Collaboration:
SL.8.1:
o Engage effectively in a range of collaborative discussions (one–on–one, in groups,
and teacher–led) with diverse partners on grade 8 topics, texts, and issues, building
on others’ ideas and expressing their own clearly.
SL.8.2:
o Analyze the purpose of information presented in diverse media and formats (e.g.,
visually, quantitatively, orally) and evaluate the motives (e.g., social, commercial,
political) behind its presentation.
SL.8.3:
o Delineate a speaker’s argument and specific claims, evaluating the soundness of the
reasoning and relevance and sufficiency of the evidence and identifying when
irrelevant evidence is introduced.
Presentation of Knowledge and Ideas:
SL.8.4:
o Present claims and findings, emphasizing salient points in a focused, coherent manner
with relevant evidence, sound valid reasoning, and well–chosen details; use
appropriate eye contact, adequate volume, and clear pronunciation.
Mathematics:
6.EE.C.9:
o Use variables to represent two quantities in a real–world problem that change in
relationship to one another; write an equation to express one quantity, thought of as
the dependent variable, in terms of the other quantity, thought of as the independent
variable. Analyze the relationship between the dependent and independent variables
using graphs and tables, and relate these to the equation.
30 Science of Driving
6.EE.B.6:
o Use variables to represent numbers and write expressions when solving a real–world
or mathematical problem; understand that a variable can represent an unknown
number, or, depending on the purpose at hand, any number in a specified set.
Literacy
WHST.6-8.1:
o Write arguments focused on discipline–specific content.
WHST.6-8.10:
o Write routinely over extended time frames (time for reflection and revision) and
shorter time frames (a single sitting or a day or two) for a range of discipline–specific
tasks, purposes, and audiences.
NGSS
Disciplinary Core Ideas:
MS-PS2-2.A:
o All positions of objects and the directions of forces and motions must be described in
an arbitrarily chosen reference frame and arbitrarily chosen units of size. In order to
share information with other people, these choices must also be shared.
MS-PS3-1:
o Motion energy is properly called kinetic energy; it is proportional to the mass of the
moving object and grows with the square of its speed.
MS-PS3-5:
o When the motion energy of an object changes, there is inevitably some other change
in energy at the same time.
Cross-Cutting Concepts:
MS-PS2-2:
o Plan an investigation to provide evidence that the change in an object’s motion
depends on the sum of the forces on the object and the mass of the object. All
positions of objects and the directions of forces and motions must be described in an
arbitrarily chosen reference frame and arbitrarily chosen units of size. In order to
share information with other people, these choices must also be shared.
MS-PS3-1:
31 Science of Driving
o Construct and interpret graphical displays of data to describe relationships of kinetic
energy to the mass of an object and to the speed of an object.
MS-PS 3-1, 3-4:
o Proportional relationships (e.g. speed as the ratio of distance traveled to time taken)
among different types of quantities provide information about the magnitude of
properties and processes.
MS-PS 3-4:
o Plan an investigation individually and collaboratively, and in the design: identify
independent and dependent variables and controls, what tools are needed to do the
gathering, how measurements will be recorded, and how many data are needed to
support a claim.
MS-PS 3-1 :
o Construct and interpret graphical displays of data to identify linear and nonlinear
relationships.
MS-PS2-3, MS-PS2-5:
o Cause and effect relationships may be used to predict phenomena in natural or
designed systems.
MS-PS2-1, MS-PS2-4:
o Models can be used to represent systems and their interactions such as inputs
processes and outputs and energy and matter flows within systems.
MS-PS2-2:
o Explanations of stability and change in natural or designed systems can be
constructed by examining the changes over time and forces at different scales.
Science and Engineering Practices:
Planning and carrying out investigations to answer questions or test solutions to problems
in 6–8 builds on K–5 experiences and progresses to include investigations that use
multiple variables and provide evidence to support explanations or design solutions.
MS-PS2-2:
o Plan an investigation individually and collaboratively, and in the design: identify
independent and dependent variables and controls, what tools are needed to do the
gathering, how measurements will be recorded, and how many data are needed to
support a claim.
MS-PS 2-5:
32 Science of Driving
o Conduct an investigation and evaluate the experimental design to produce data to
serve as the basis for evidence that can meet the goals of the investigation.
MS-PS2-4:
o Construct and present oral and written arguments supported by empirical evidence
and scientific reasoning to support or refute an explanation or a model for a
phenomenon or a solution to a problem.
MS-PS2-2, MS-PS2-4:
o Science knowledge is based upon logical and conceptual connections between
evidence and explanations.
Constructing Explanations and Designing Solutions:
Constructing explanations and designing solutions in 6–8 builds on K–5 experiences and
progresses to include constructing explanations and designing solutions supported by
multiple sources of evidence consistent with scientific ideas, principles, and theories.
MS-PS 2-1:
o Apply scientific ideas or principles to design an object, tool, process or system.
Performance Expectations:
MS-PS3-5:
o Construct, use, and present arguments to support the claim that when the kinetic
energy of an object changes, energy is transferred to or from the object.
MS-PS2-2:
o The motion of an object is determined by the sum of the forces acting on it; if the
total force on the object is not zero, its motion will change. The greater the mass of
the object, the greater the force needed to achieve the same change in motion. For any
given object, a larger force causes a larger change in motion.
MS-PS2-1:
o For any pair of interacting objects, the force exerted by the first object on the second
object is equal in strength to the force that the second object exerts on the first, but in
the opposite direction (Newton’s third law).
33 Science of Driving
Unit 1
Unit 1: Graphing Interpretation Competition
Goals:
To give students the skills to analyze and construct graphs (position vs. time,
velocity or speed vs. time, acceleration vs. time, and direction vs. time).
Justification:
Students are often introduced to graphs, but according to teachers consulted,
students rarely have the ability to fully analyze and describe them.
Graphical interpretation is needed in many professions, day-to-day life, and is seen
on many standardized tests.
By introducing students to graphing early, they will be given the opportunity to
improve graphing skills throughout middle and high school.
34 Science of Driving
Lesson One: On the Move
Grade level: 6-8
Expected length of lesson: 45 minutes
Overview:
Introduction to graphing motion starting with probes to discuss misconceptions. An activity
titled “On the Move: Velocity Activity” follows the probes to engage students in kinesthetic
learning. The activity produces data that are graphed. Speed and acceleration are calculated
based on the data acquired.
Standards and/or benchmarks:
NGSS:
Disciplinary Core Idea:
MS-PS2-2:
o All positions of objects and the directions of forces and motions must be described in
an arbitrarily chosen reference frame and arbitrarily chosen units of size. In order to
share information with other people, these choices must also be shared.
Science and Engineering Practices:
Planning and Carrying Out Investigations
35 Science of Driving
MS-PS2-2:
o Plan an investigation individually and collaboratively, and in the design: identify
independent and dependent variables and controls, what tools are needed to do the
gathering, how measurements will be recorded, and how many data are needed to
support a claim.
MS-PS2-5:
o Conduct an investigation and evaluate the experimental design to produce data to
serve as the basis for evidence that can meet the goals of the investigation.
Constructing Explanations and Designing Solutions
MS-PS2-1:
o Apply scientific ideas or principles to design an object, tool, process or system.
Cross-Cutting Concept:
Scale, Proportion, and Quantity
MS-PS3-1, MS-PS3-4:
o Proportional relationships (e.g. speed as the ratio of distance traveled to time taken)
among different types of quantities provide information about the magnitude of
properties and processes.
Iowa Core:
S.6–8.PS.3
o Essential Concept and/or Skill: Understand and apply knowledge of motions and
forces.
o The motion of an object can be described by its position, direction of motion, and
speed. That motion can be measured and represented on a graph
Learning Goals:
Students will understand:
Graphs do not directly represent the motion; addresses the “What You See Is What
You Get (WYSIWYG)” issue.
The relationship of position to velocity and acceleration.
Learning Performances:
Students will be able to:
Collect data to generate graphs.
Generate graphs:
o Position vs. time
o Speed vs. time
o Acceleration vs. time.
Identify the motion of the object.
36 Science of Driving
Materials:
Following Jack Part II
o Probe teacher guide
Go Cart Test Run
o Probe teacher guide
On the Move: Velocity Activity worksheet
o On the Move: Velocity Activity Teacher notes
Masking tape
Timer
Meter stick
Motion story worksheet
Safety:
Consider location during On the Move: Velocity Activity; walking and running is required.
Critical Thinking Question:
What story are the graphs are telling us?
Students’ Ideas:
The students should have some familiarity with distance, direction, speed and/or velocity,
acceleration and what those mean scientifically. Students will likely have misconceptions about
graphing.
Main Lesson:
1. Teachers present the lesson’s critical thinking question: What story are the graphs telling
us?
2. Hand out Go Cart Test Run probe and instruct students to complete it.
3. After students are done with the probe sheets, instruct students to form small groups (2~3
students).
a. Students discuss reasoning for their answers.
b. This is to engage students who are most comfortable with talking in smaller
groups.

37 Science of Driving
4. Instruct students to have a class discussion sharing thoughts from the small group
discussion.
a. Whole class discussion reveals class misconceptions.
5. Instruct students to start On the Move: Velocity Activity.
a. Use a jigsaw activity to allow students to explain different parts of the instructions
to their peers.
b. Model the experiment set up. (Applying tape, walking, running etc.)
c. Model how to create and/or fill out the table.
6. Pair students to conduct the activity.
a. Monitor progress.
b. Ensure data table completion.
7. After data is collected, instruct students to return to seats and begin graphing.
a. Instruct students work individually or in pairs.
b. Monitor the graphing process, and if necessary, model how to fill out the graphs.
c. Collect worksheets.
8. Hand out Motion Story Worksheet Homework:
a. Read instructions out loud.
b. Go over the worksheet example.
c. Stories will include 3-5 events such as: stopping for a light, changes in speed,
turning left or right, etc.
d. The length of the trip can be adjusted to meet student needs
Differentiation:
Students should be grouped appropriately.
Activity worksheet differentiation is described in section five On the Move: Teacher Notes.
Homework can be modified with maps and drawing instead of writing long descriptions.
Assessment:
The assessment is On the Move: Velocity Activity. Rubric is found in section four of On the Move:
Teacher Notes.
38 Science of Driving
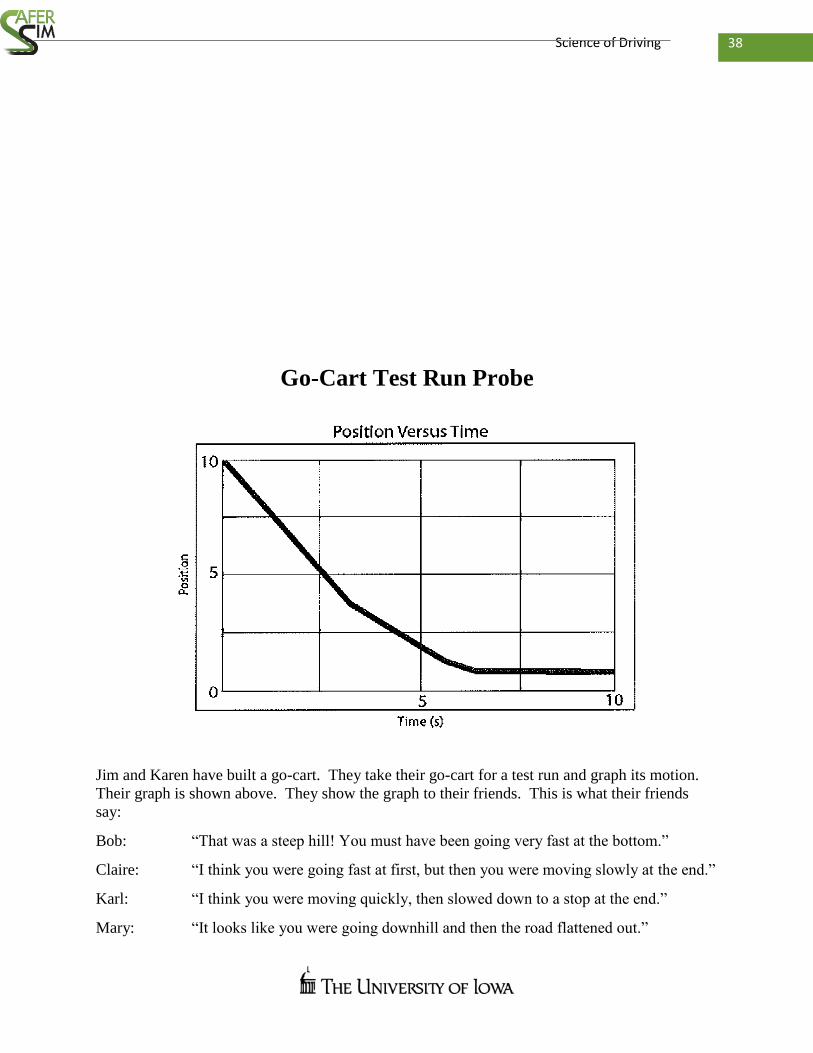
Go-Cart Test Run Probe
Jim and Karen have built a go-cart. They take their go-cart for a test run and graph its motion.
Their graph is shown above. They show the graph to their friends. This is what their friends
say:
Bob: “That was a steep hill! You must have been going very fast at the bottom.”
Claire: “I think you were going fast at first, but then you were moving slowly at the end.”
Karl: “I think you were moving quickly, then slowed down to a stop at the end.”
Mary: “It looks like you were going downhill and then the road flattened out.”
39 Science of Driving
Circle the name of the friend you think best describes the motion of the go-cart based on the
graph. Explain why you agree with that friend.
Revised version of probe 5 Go-Cart Test Run in Vol. 1 of Uncovering Student Ideas in Physical Science (Keeley & Harrington, 2010)
40 Science of Driving
Go-Cart Test Run Probe Teacher Notes
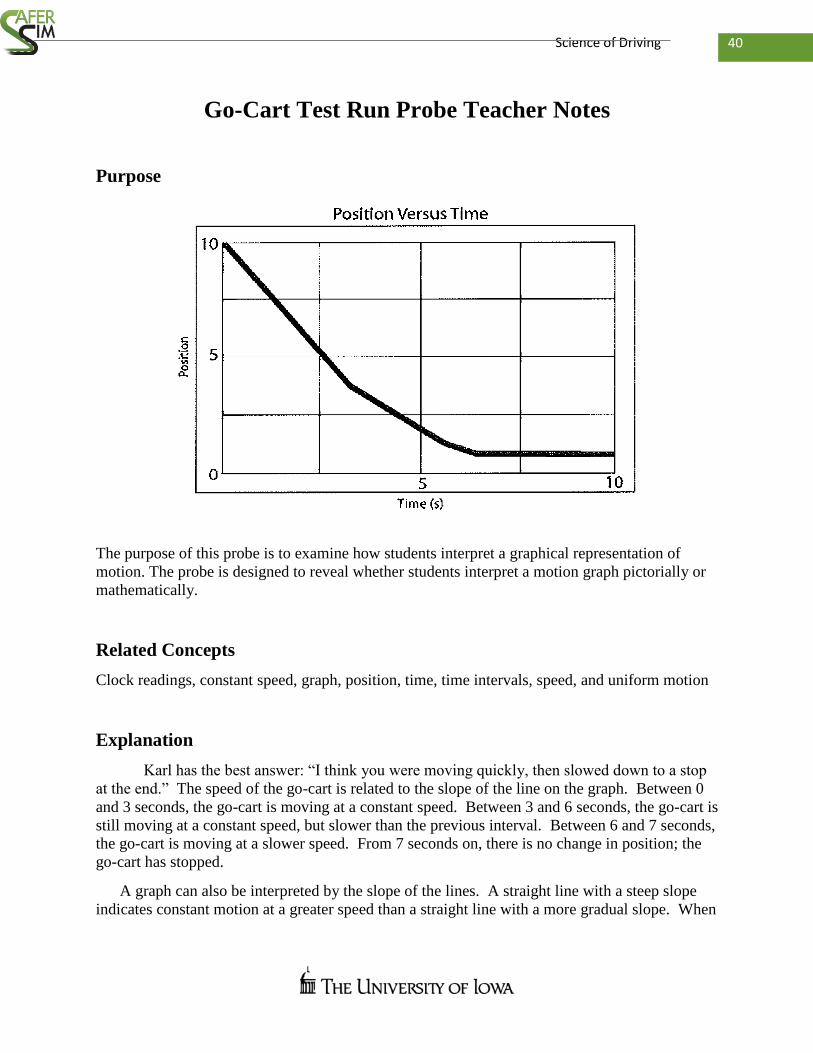
Purpose
The purpose of this probe is to examine how students interpret a graphical representation of
motion. The probe is designed to reveal whether students interpret a motion graph pictorially or
mathematically.
Related Concepts
Clock readings, constant speed, graph, position, time, time intervals, speed, and uniform motion
Explanation
Karl has the best answer: “I think you were moving quickly, then slowed down to a stop
at the end.” The speed of the go-cart is related to the slope of the line on the graph. Between 0
and 3 seconds, the go-cart is moving at a constant speed. Between 3 and 6 seconds, the go-cart is
still moving at a constant speed, but slower than the previous interval. Between 6 and 7 seconds,
the go-cart is moving at a slower speed. From 7 seconds on, there is no change in position; the
go-cart has stopped.
A graph can also be interpreted by the slope of the lines. A straight line with a steep slope
indicates constant motion at a greater speed than a straight line with a more gradual slope. When
41 Science of Driving
the line on a graph is horizontal, that means that as time goes by, the position of an object is not
changing. The horizontal line on this graph means that the go-cart stops at the end of the motion.
Administering the Probe
This probe is appropriate for middle school students and high school students. You may adapt
the probe by eliminating the answer choices and having students “tell the story” indicated by the
graph. For students who may be unfamiliar with position versus time graphs, it may be helpful to
describe the y axis as the milepost or distance marker.
Suggestions for Instruction and Assessment
Provide multiple opportunities for students to construct and interpret graphs, so you can
see what students understand or misunderstand about graphs and graphing.
Provide students with different types of motion graphs, and have them make up stories
about what the graphs show. Encourage discussions about the accuracy of their stories.
Do the stories accurately reflect the information on the graphs? This strategy, popular in
mathematics classes, can help students overcome the tendency to view graphs as a literal
picture.
Use motion detectors and students’ real movements to help students construct a visual
and kinesthetic understanding of position versus time. MBLs (microcomputer-based
laboratories) are known to improve the development of students’ abilities to interpret
graphs. MBLs are particularly effective in helping middle school students understand
that a graph is not a literal picture.
Most middle school science curricula use distance versus time graphs instead of position
versus time graphs. Although both types of graphs can be interpreted in the same way,
teachers should help students understand the distinction between distance and
position. In some textbooks, distance may mean distance traveled whereas position refers
to the location of an object. In some special cases (such as when the motion starts at zero
position) these terms mean the same thing. However, to avoid confusion, physics
teachers tend to use position, which has a well-defined meaning.
42 Science of Driving
Revised version of probe 5 Go-Cart Test Run Teacher Notes in Vol. 1 of Uncovering Student Ideas in Physical Science (Keeley & Harrington, 2010)
On the Move: Velocity Activity
Name: Date:
Group Mates:
Materials:
Meter stick
Masking tape
Timer
Directions:
In small groups you will conduct an experiment to create a position vs. time graph.
1. With masking tape, make a start line on the floor. Make sure it is visible to everyone.
43 Science of Driving
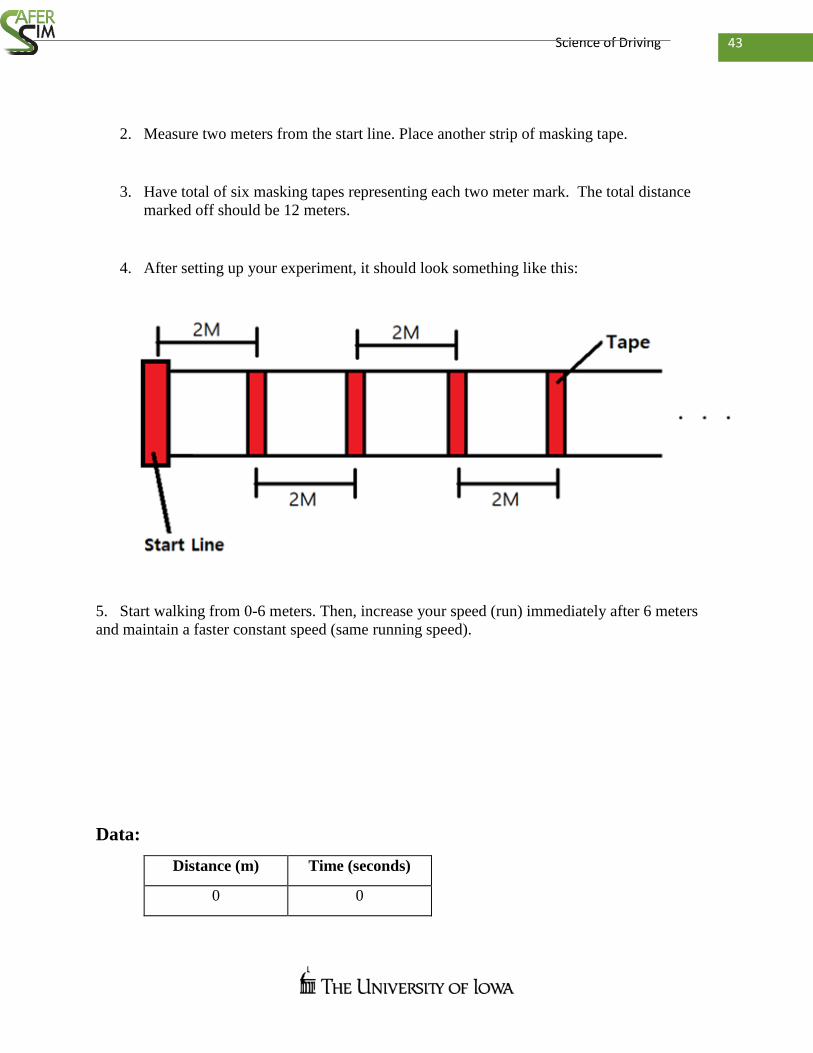
2. Measure two meters from the start line. Place another strip of masking tape.
3. Have total of six masking tapes representing each two meter mark. The total distance
marked off should be 12 meters.
4. After setting up your experiment, it should look something like this:
5. Start walking from 0-6 meters. Then, increase your speed (run) immediately after 6 meters
and maintain a faster constant speed (same running speed).
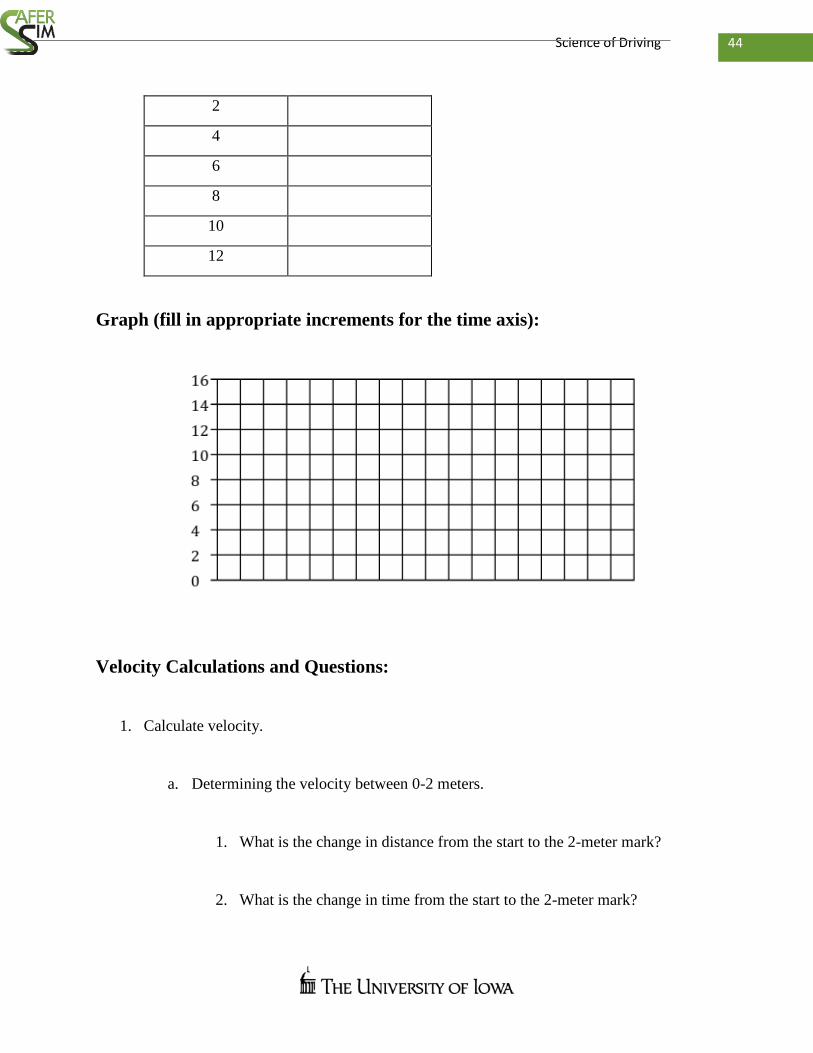
Data:
Distance (m) Time (seconds)
0 0
44 Science of Driving
2
4
6
8
10
12
Graph (fill in appropriate increments for the time axis):
Velocity Calculations and Questions:
1. Calculate velocity.
a. Determining the velocity between 0-2 meters.
1. What is the change in distance from the start to the 2-meter mark?
2. What is the change in time from the start to the 2-meter mark?
45 Science of Driving
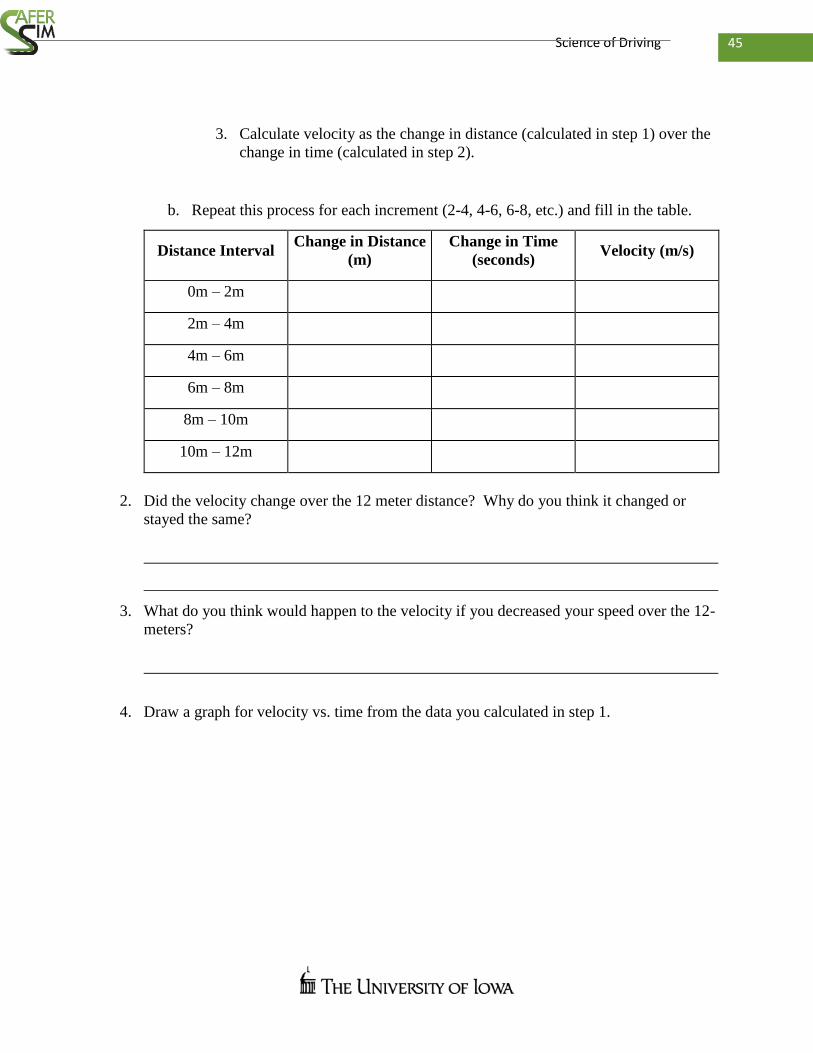
3. Calculate velocity as the change in distance (calculated in step 1) over the
change in time (calculated in step 2).
b. Repeat this process for each increment (2-4, 4-6, 6-8, etc.) and fill in the table.
Distance Interval Change in Distance
(m)
Change in Time
(seconds) Velocity (m/s)
0m – 2m
2m – 4m
4m – 6m
6m – 8m
8m – 10m
10m – 12m
2. Did the velocity change over the 12 meter distance? Why do you think it changed or
stayed the same?
3. What do you think would happen to the velocity if you decreased your speed over the 12-
meters?
4. Draw a graph for velocity vs. time from the data you calculated in step 1.

46 Science of Driving
47 Science of Driving
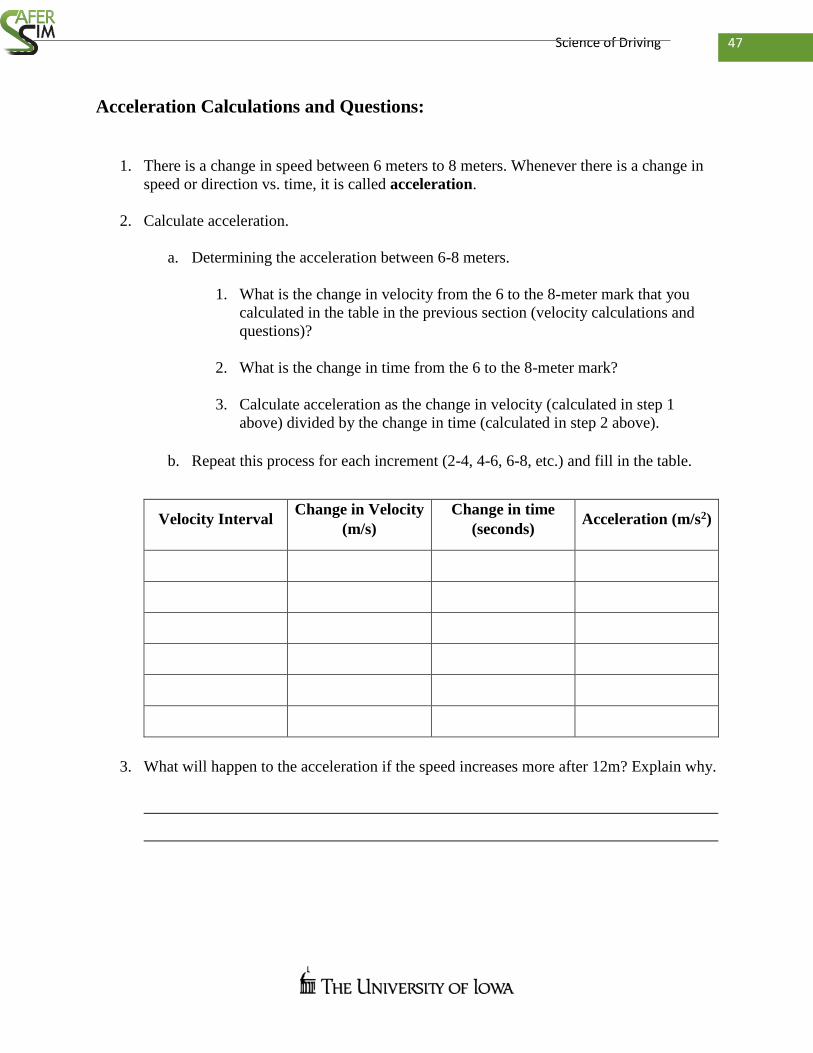
Acceleration Calculations and Questions:
1. There is a change in speed between 6 meters to 8 meters. Whenever there is a change in
speed or direction vs. time, it is called acceleration.
2. Calculate acceleration.
a. Determining the acceleration between 6-8 meters.
1. What is the change in velocity from the 6 to the 8-meter mark that you
calculated in the table in the previous section (velocity calculations and
questions)?
2. What is the change in time from the 6 to the 8-meter mark?
3. Calculate acceleration as the change in velocity (calculated in step 1
above) divided by the change in time (calculated in step 2 above).
b. Repeat this process for each increment (2-4, 4-6, 6-8, etc.) and fill in the table.
Velocity Interval Change in Velocity
(m/s)
Change in time
(seconds) Acceleration (m/s2)
3. What will happen to the acceleration if the speed increases more after 12m? Explain why.
48 Science of Driving
4. Draw a graph for acceleration vs. time.
49 Science of Driving
On the Move: Teacher Notes
Groups of 2-4 are recommended.
Materials:
Timer
Tape
Meter stick
Directions:
1. Setting up the experiment:
a. Students will follow the instructions that were provided on activity to set up the
experiment.
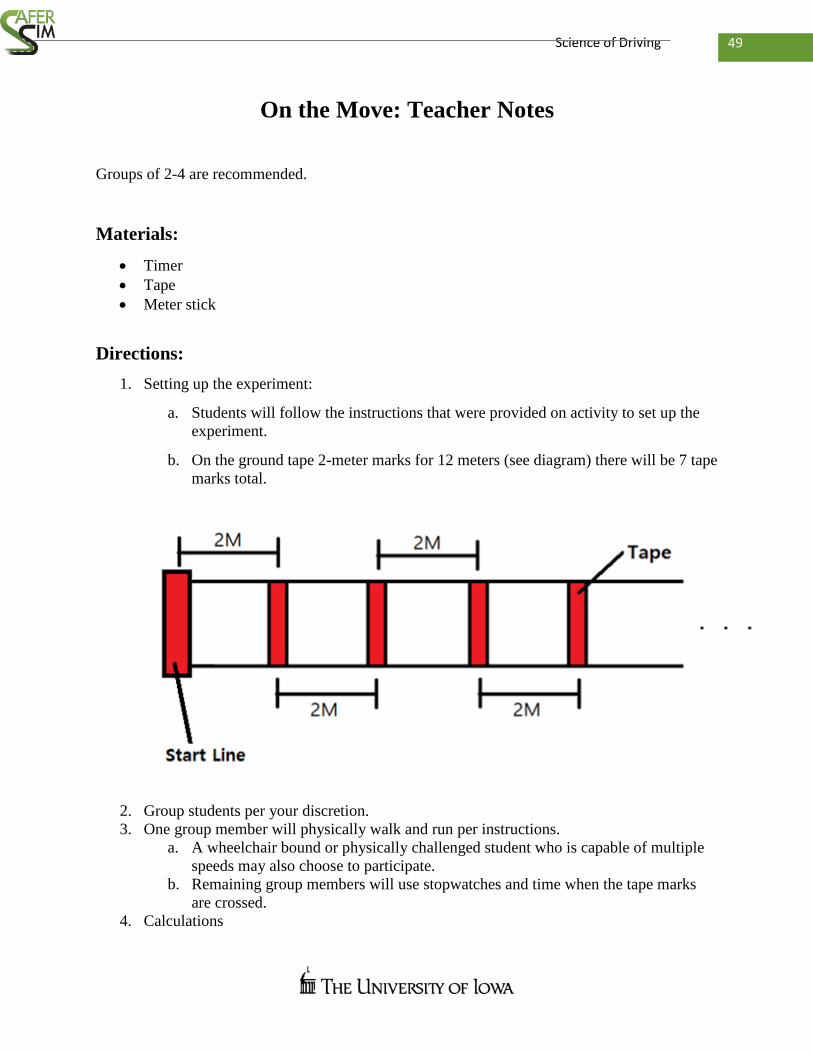
b. On the ground tape 2-meter marks for 12 meters (see diagram) there will be 7 tape
marks total.
2. Group students per your discretion.
3. One group member will physically walk and run per instructions.
a. A wheelchair bound or physically challenged student who is capable of multiple
speeds may also choose to participate.
b. Remaining group members will use stopwatches and time when the tape marks
are crossed.
4. Calculations

50 Science of Driving
a. The calculation for velocity is the change in distance (m) over the change in time
(seconds):
1. For this calculation, each distance interval will be 2 meters.
b. The calculation for acceleration is the change in velocity (m/s) over the change in
time (seconds):
1. The velocity interval (in the acceleration calculations and questions
section) should be determined from the calculated velocities in the
previous table.
2. The change in time column for the acceleration table should be calculated
from the change in time column in the velocity table (in the velocity
calculations and questions section), not from the distance table (in the data
section).
5. Graphing
a. When the students graph the distance vs. time data, ensure that each axis is given
a label and units. Students may need some help determining appropriate intervals
for the x-axis (time).
b. When graphing the velocity data, use the velocities calculated in the velocity
calculations and questions section. For the time, use the times in the data section
(distance vs. time collected by the student) starting with the time for 2m.
1. Velocity is in m/s; therefore, the time used for plotting is the end time of
the interval used to calculate the velocity (the time from 0-2m).
c. When graphing the acceleration data, use the acceleration calculated in the
acceleration calculations and questions section. For the time, use the times in the
data section (distance vs. time collected by the student) starting with the time for
4m.
1. Acceleration is in m/s2; therefore, the time used for plotting is the end of
the time interval used to calculate the acceleration (two time intervals: the
times from 0-2m and 2-4m).
d. Have the students discuss what they observed during the experiment and how that
relates to what they see on the graph.
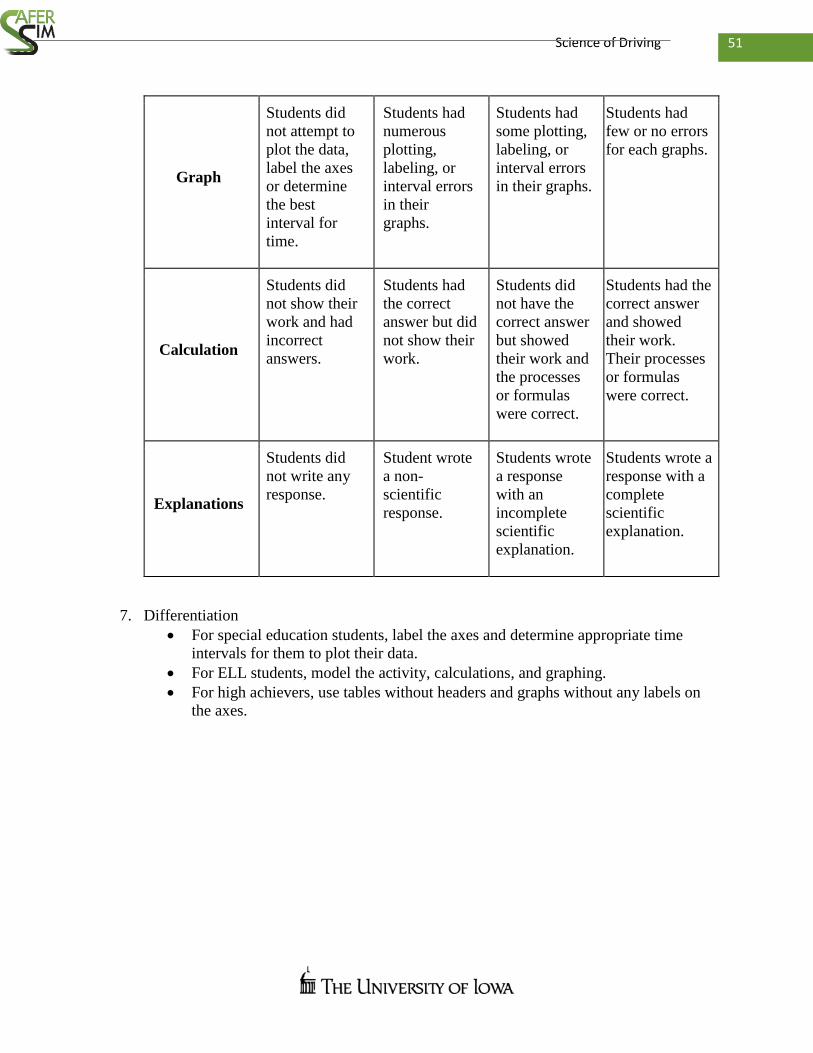
6. Collect filled out worksheet from the students and grade based on the following rubric:
Item/Score 0 1 2 3
51 Science of Driving
Graph
Students did
not attempt to
plot the data,
label the axes
or determine
the best
interval for
time.
Students had
numerous
plotting,
labeling, or
interval errors
in their
graphs.
Students had
some plotting,
labeling, or
interval errors
in their graphs.
Students had
few or no errors
for each graphs.
Calculation
Students did
not show their
work and had
incorrect
answers.
Students had
the correct
answer but did
not show their
work.
Students did
not have the
correct answer
but showed
their work and
the processes
or formulas
were correct.
Students had the
correct answer
and showed
their work.
Their processes
or formulas
were correct.
Explanations
Students did
not write any
response.
Student wrote
a non-
scientific
response.
Students wrote
a response
with an
incomplete
scientific
explanation.
Students wrote a
response with a
complete
scientific
explanation.
7. Differentiation
For special education students, label the axes and determine appropriate time
intervals for them to plot their data.
For ELL students, model the activity, calculations, and graphing.
For high achievers, use tables without headers and graphs without any labels on
the axes.
52 Science of Driving
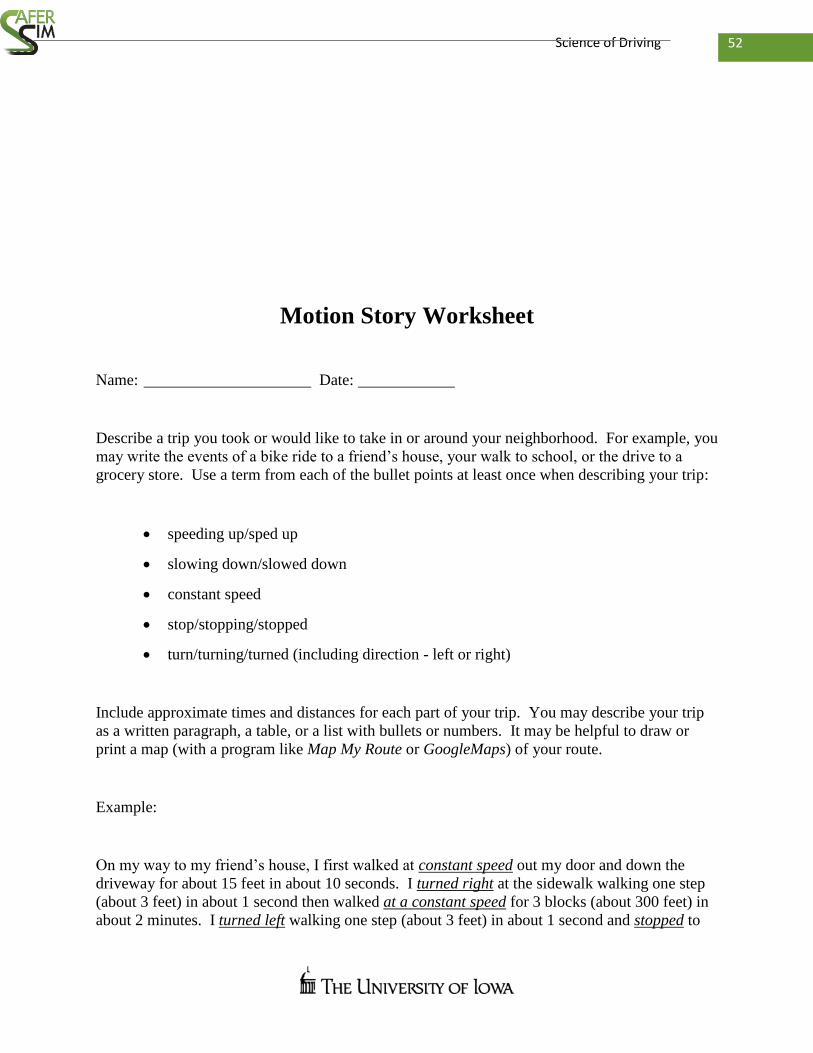
Motion Story Worksheet
Name: Date:
Describe a trip you took or would like to take in or around your neighborhood. For example, you
may write the events of a bike ride to a friend’s house, your walk to school, or the drive to a
grocery store. Use a term from each of the bullet points at least once when describing your trip:
speeding up/sped up
slowing down/slowed down
constant speed
stop/stopping/stopped
turn/turning/turned (including direction - left or right)
Include approximate times and distances for each part of your trip. You may describe your trip
as a written paragraph, a table, or a list with bullets or numbers. It may be helpful to draw or
print a map (with a program like Map My Route or GoogleMaps) of your route.
Example:
On my way to my friend’s house, I first walked at constant speed out my door and down the
driveway for about 15 feet in about 10 seconds. I turned right at the sidewalk walking one step
(about 3 feet) in about 1 second then walked at a constant speed for 3 blocks (about 300 feet) in
about 2 minutes. I turned left walking one step (about 3 feet) in about 1 second and stopped to
53 Science of Driving
wait for about 1 minute for the light to change. I sped up in several steps (about 10 feet) in about
5 seconds and walked at constant speed for 3 blocks (about 300 feet) in about 2 minutes. I
turned left in one step (about 3 feet) toward my friend’s house in about 1 second and slowed
down for about 15 feet in about 10 seconds until I stopped at her door.
Lesson Two: Graphing Complex Motion
Grade level: 6-8
Expected length of lesson: Approximately 45 to 60 minutes
Overview:
For the second day, students use their homework to evaluate position (distance), speed,
acceleration and direction for complex motion. Students analyze the trip they wrote for their
homework from the perspectives of distance, speed, acceleration, and direction to be used to
graph the motion. Teacher asks students to draw a data set consisting of 4 graphs by the end of
class: (1) distance vs. time, (2) speed vs. time, (3) acceleration vs. time, and (4) direction vs.
time. Students are then expected to analyze a data set of a new situation and determine the trip
events in order for complex motion. Students are in groups of 4 and roles for simulator are
assigned.
Standards and/or benchmarks:
NGSS:
54 Science of Driving
Disciplinary Core Ideas:
Forces and Motion
MS-PS2-2:
o All positions of objects and the directions of forces and motions must be described in
an arbitrarily chosen reference frame and arbitrarily chosen units of size. In order to
share information with other people, these choices must also be shared.
Cross-Cutting Concepts:
Scale, Proportion, and Quantity
MS-PS3-1, MS-PS3-4:
o Proportional relationships (e.g. speed as the ratio of distance traveled to time taken)
among different types of quantities provide information about the magnitude of
properties and processes.
Science and Engineering Practices:
Planning and Carrying Out Investigations
MS-PS3-4:
o Plan an investigation individually and collaboratively, and in the design: identify
independent and dependent variables and controls, what tools are needed to do the
gathering, how measurements will be recorded, and how many data are needed to
support a claim.
Analyzing and Interpreting Data
MS-PS3-1:
o Construct and interpret graphical displays of data to identify linear and nonlinear
relationships.
Iowa Core:
S.6–8.PS.3
o The motion of an object can be described by its position, direction of motion, and
speed. That motion can be measured and represented on a graph.
Learning Goals:
Students will understand:
Graphs depicting motion are related: (1) distance vs. time, (2) speed vs. time, (3)
acceleration vs. time, and (4) direction vs. time.
55 Science of Driving
The relation of variables to time graphically.
Graphs depicting complex motion are more complex.
Multiple graphs are used to depict complex motion.
Learning Performances:
Students will be able to:
Write their trip from the perspective of (1) distance, (2) speed, (3) acceleration, and (4)
direction.
Use the write up their trip from each perspective to generate a graph for each (a data set).
Find missing events of the trip in one graph that are represented in another graph.
Analyze a new data set to determine the motion.
Materials:
Completed homework assignment
Homework teacher notes
Graph paper
Project data set
Safety:
NA
Critical Thinking Question:
What story are the graphs telling us?
Student Ideas:
Allow student to write the stories in whatever way makes the most sense to them (paragraph,
bullets, numbered list, tabular, etc.).
Main Lesson:
1. Instruct students to take out their homework assignments.
56 Science of Driving
a. If students’ assignments are incomplete or less detailed, provide additional help in
the next steps.
b. If students did not complete the homework, pair them with an appropriate student
who has finished the assignment.
2. Ask students where they went and how many drew maps to help them.
a. If students have similarities on the type of trip they wrote about, grouping may be
used for the next steps to allow students to help each other.
3. Instruct students to identify their starting and ending points on a new piece of paper.
4. Instruct students to write their trip from 4 different perspectives:
a. distance from the starting point
b. speed
c. acceleration
d. direction from the starting point
5. Provide instructions for writing each perspective from the starting point to the ending point.
a. Chunk the instructions for each perspective.
b. Consider how students organize the information (table format, bullets, or
numbering the steps).
c. Either use an example or one of the students’ trips to model how to write the trip
from each perspective. An example is provided in the teacher notes accompanying
the homework.
d. Monitor while students are writing their trips from each perspective to ensure that
all the necessary details are included.
6. Explain to students how to make each graph after the story is written from each
perspective.
a. As a whole class, ask students to determine the variables in each perspective. They
need to identify time as one variable in each.
b. As a whole class, ask students to identify where each variable goes on the graph.
Ask them to explain their thinking. Students may not use the terms dependent and
independent variable, but they should be able to reason that time goes on the bottom
from instruction the day before.
c. Chunk the instructions and model how to generate a graph for each perspective.
Use an example or one of the students’ trips.
d. Emphasize the shape over exact values at this time.
e. Monitor while students graph their trip from each perspective.
7. Pair students to review each other's work.
a. Have the students compare the originally written trip to the graphs. It is not
necessary to read the trip from each perspective.
b. Allow students to change and improve their graphs.
8. After students are satisfied with their graphs, have a short discussion.
a. Ask students if the graphs look how they expected them to.
b. Ask students if there are any parts missing from the trip in one of the graphs (a
change in direction is not seen in the other graphs, etc.).
c. Ask students if all the graphs are necessary. It may help to ask if it is easy to
determine the acceleration in the distance graph.
9. Have students turn in their paperwork (the homework, the four perspectives, and graphs).
57 Science of Driving
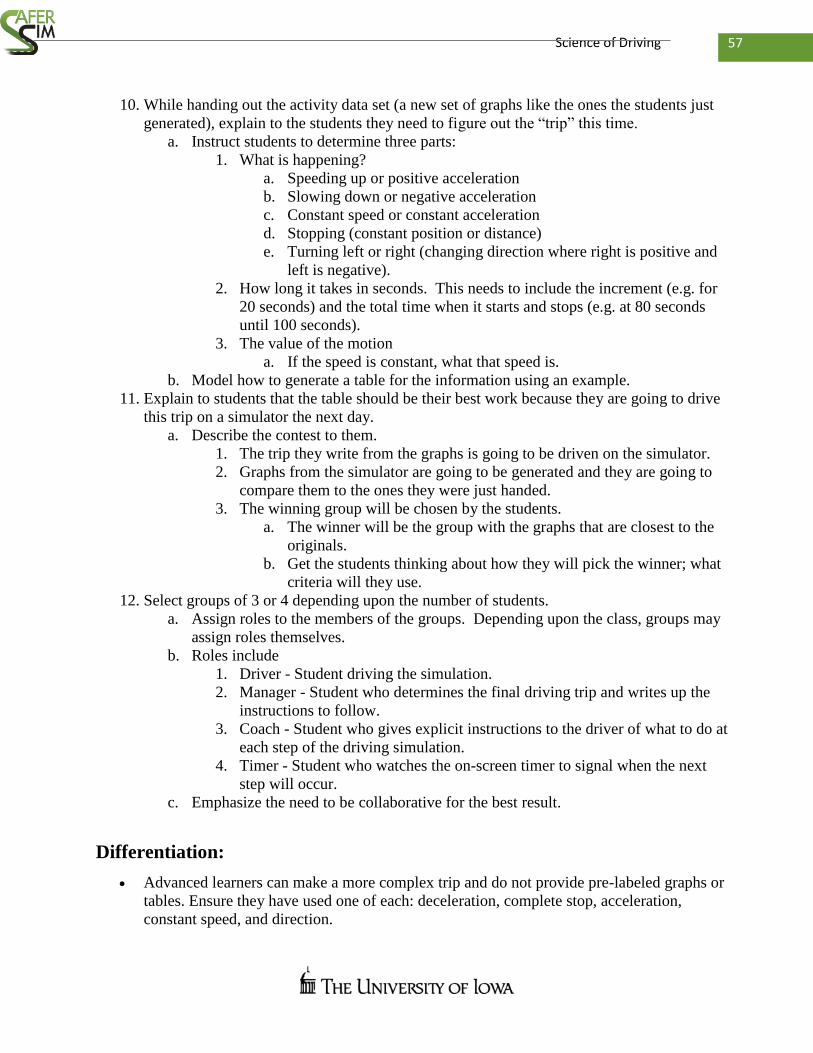
10. While handing out the activity data set (a new set of graphs like the ones the students just
generated), explain to the students they need to figure out the “trip” this time.
a. Instruct students to determine three parts:
1. What is happening?
a. Speeding up or positive acceleration
b. Slowing down or negative acceleration
c. Constant speed or constant acceleration
d. Stopping (constant position or distance)
e. Turning left or right (changing direction where right is positive and
left is negative).
2. How long it takes in seconds. This needs to include the increment (e.g. for
20 seconds) and the total time when it starts and stops (e.g. at 80 seconds
until 100 seconds).
3. The value of the motion
a. If the speed is constant, what that speed is.
b. Model how to generate a table for the information using an example.
11. Explain to students that the table should be their best work because they are going to drive
this trip on a simulator the next day.
a. Describe the contest to them.
1. The trip they write from the graphs is going to be driven on the simulator.
2. Graphs from the simulator are going to be generated and they are going to
compare them to the ones they were just handed.
3. The winning group will be chosen by the students.
a. The winner will be the group with the graphs that are closest to the
originals.
b. Get the students thinking about how they will pick the winner; what
criteria will they use.
12. Select groups of 3 or 4 depending upon the number of students.
a. Assign roles to the members of the groups. Depending upon the class, groups may
assign roles themselves.
b. Roles include
1. Driver - Student driving the simulation.
2. Manager - Student who determines the final driving trip and writes up the
instructions to follow.
3. Coach - Student who gives explicit instructions to the driver of what to do at
each step of the driving simulation.
4. Timer - Student who watches the on-screen timer to signal when the next
step will occur.
c. Emphasize the need to be collaborative for the best result.
Differentiation:
Advanced learners can make a more complex trip and do not provide pre-labeled graphs or
tables. Ensure they have used one of each: deceleration, complete stop, acceleration,
constant speed, and direction.
58 Science of Driving
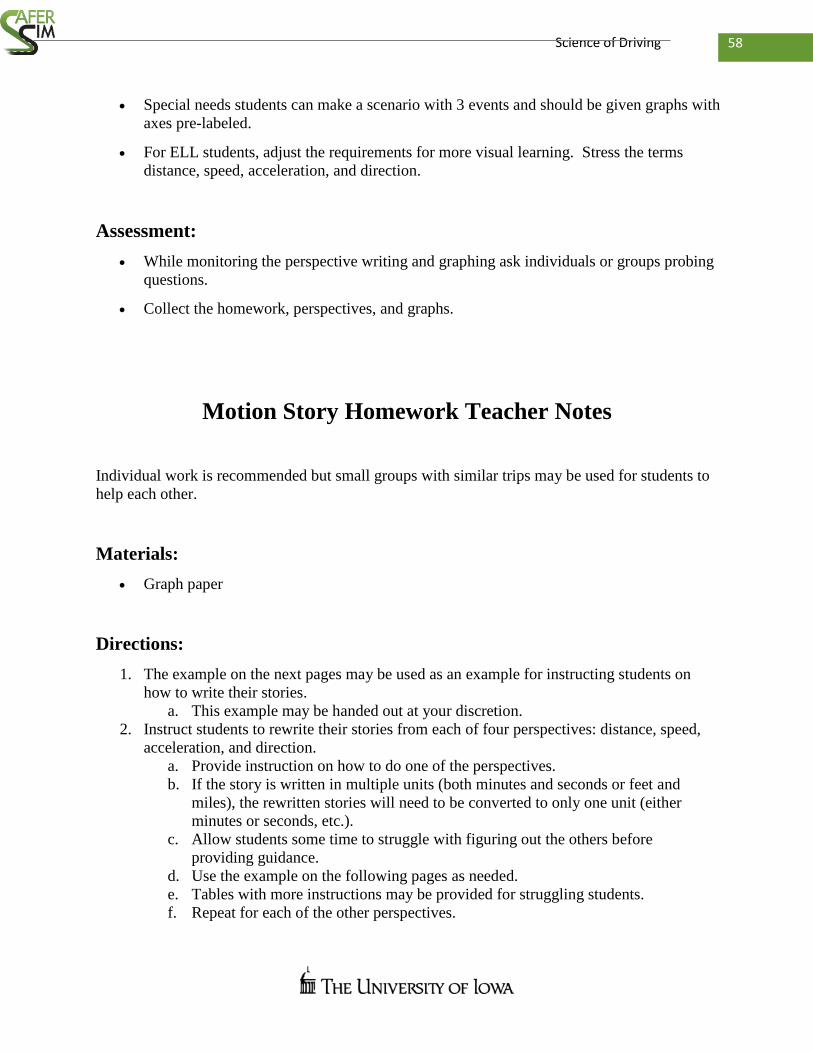
Special needs students can make a scenario with 3 events and should be given graphs with
axes pre-labeled.
For ELL students, adjust the requirements for more visual learning. Stress the terms
distance, speed, acceleration, and direction.
Assessment:
While monitoring the perspective writing and graphing ask individuals or groups probing
questions.
Collect the homework, perspectives, and graphs.
Motion Story Homework Teacher Notes
Individual work is recommended but small groups with similar trips may be used for students to
help each other.
Materials:
Graph paper
Directions:
1. The example on the next pages may be used as an example for instructing students on
how to write their stories.
a. This example may be handed out at your discretion.
2. Instruct students to rewrite their stories from each of four perspectives: distance, speed,
acceleration, and direction.
a. Provide instruction on how to do one of the perspectives.
b. If the story is written in multiple units (both minutes and seconds or feet and
miles), the rewritten stories will need to be converted to only one unit (either
minutes or seconds, etc.).
c. Allow students some time to struggle with figuring out the others before
providing guidance.
d. Use the example on the following pages as needed.
e. Tables with more instructions may be provided for struggling students.
f. Repeat for each of the other perspectives.
59 Science of Driving
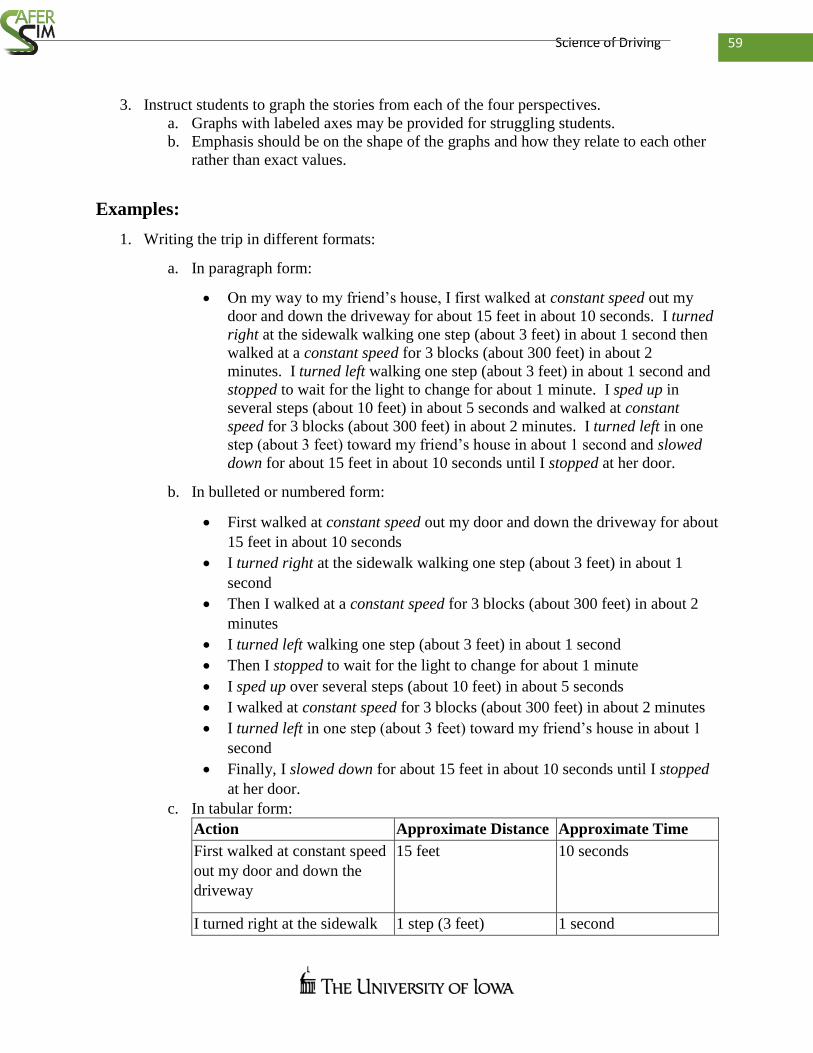
3. Instruct students to graph the stories from each of the four perspectives.
a. Graphs with labeled axes may be provided for struggling students.
b. Emphasis should be on the shape of the graphs and how they relate to each other
rather than exact values.
Examples:
1. Writing the trip in different formats:
a. In paragraph form:
On my way to my friend’s house, I first walked at constant speed out my
door and down the driveway for about 15 feet in about 10 seconds. I turned
right at the sidewalk walking one step (about 3 feet) in about 1 second then
walked at a constant speed for 3 blocks (about 300 feet) in about 2
minutes. I turned left walking one step (about 3 feet) in about 1 second and
stopped to wait for the light to change for about 1 minute. I sped up in
several steps (about 10 feet) in about 5 seconds and walked at constant
speed for 3 blocks (about 300 feet) in about 2 minutes. I turned left in one
step (about 3 feet) toward my friend’s house in about 1 second and slowed
down for about 15 feet in about 10 seconds until I stopped at her door.
b. In bulleted or numbered form:
First walked at constant speed out my door and down the driveway for about
15 feet in about 10 seconds
I turned right at the sidewalk walking one step (about 3 feet) in about 1
second
Then I walked at a constant speed for 3 blocks (about 300 feet) in about 2
minutes
I turned left walking one step (about 3 feet) in about 1 second
Then I stopped to wait for the light to change for about 1 minute
I sped up over several steps (about 10 feet) in about 5 seconds
I walked at constant speed for 3 blocks (about 300 feet) in about 2 minutes
I turned left in one step (about 3 feet) toward my friend’s house in about 1
second
Finally, I slowed down for about 15 feet in about 10 seconds until I stopped
at her door.
c. In tabular form:
Action Approximate Distance Approximate Time
First walked at constant speed
out my door and down the
driveway
15 feet 10 seconds
I turned right at the sidewalk 1 step (3 feet) 1 second
60 Science of Driving
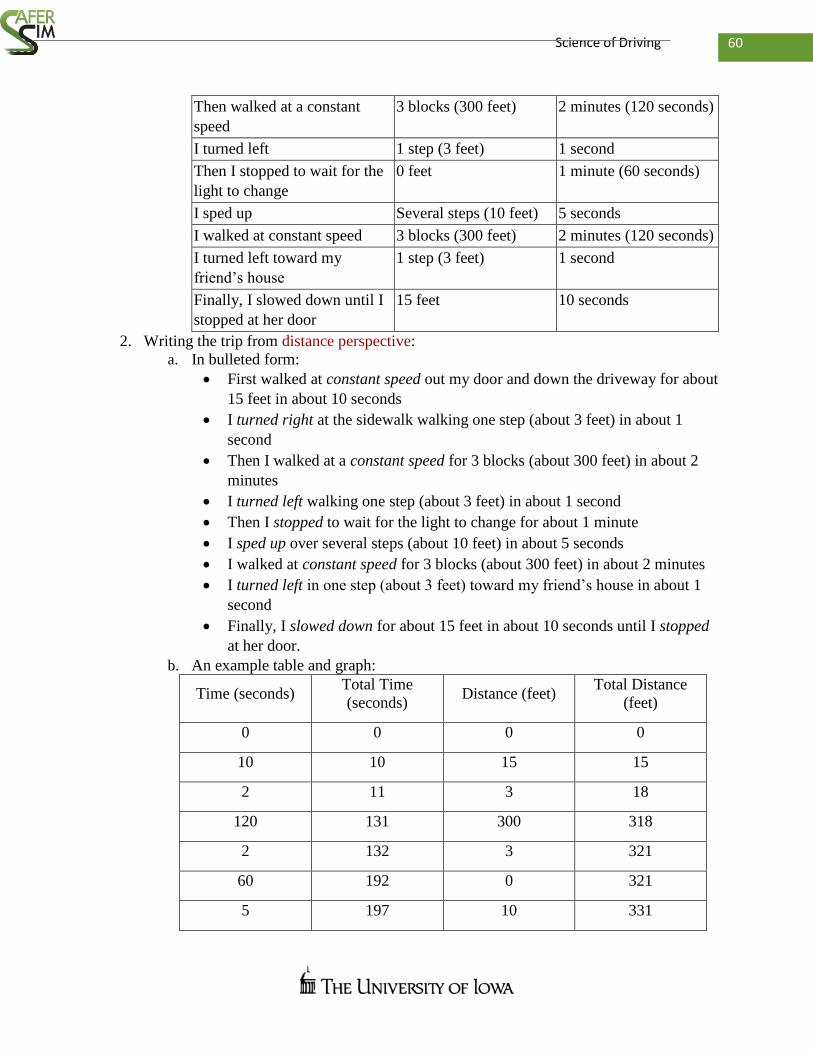
Then walked at a constant
speed
3 blocks (300 feet) 2 minutes (120 seconds)
I turned left 1 step (3 feet) 1 second
Then I stopped to wait for the
light to change
0 feet 1 minute (60 seconds)
I sped up Several steps (10 feet) 5 seconds
I walked at constant speed 3 blocks (300 feet) 2 minutes (120 seconds)
I turned left toward my
friend’s house
1 step (3 feet) 1 second
Finally, I slowed down until I
stopped at her door
15 feet 10 seconds
2. Writing the trip from distance perspective:
a. In bulleted form:
First walked at constant speed out my door and down the driveway for about
15 feet in about 10 seconds
I turned right at the sidewalk walking one step (about 3 feet) in about 1
second
Then I walked at a constant speed for 3 blocks (about 300 feet) in about 2
minutes
I turned left walking one step (about 3 feet) in about 1 second
Then I stopped to wait for the light to change for about 1 minute
I sped up over several steps (about 10 feet) in about 5 seconds
I walked at constant speed for 3 blocks (about 300 feet) in about 2 minutes
I turned left in one step (about 3 feet) toward my friend’s house in about 1
second
Finally, I slowed down for about 15 feet in about 10 seconds until I stopped
at her door.
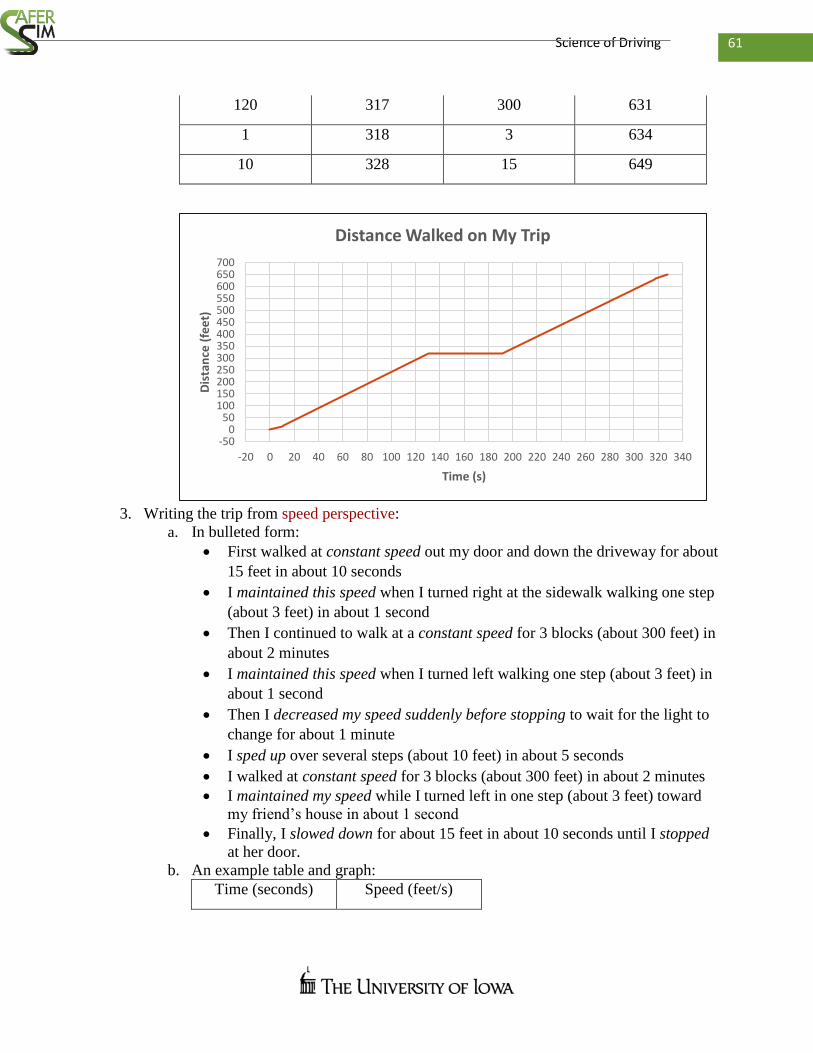
b. An example table and graph:
Time (seconds) Total Time
(seconds) Distance (feet)
Total Distance
(feet)
0 0 0 0
10 10 15 15
2 11 3 18
120 131 300 318
2 132 3 321
60 192 0 321
5 197 10 331
61 Science of Driving
120 317 300 631
1 318 3 634
10 328 15 649
1
1
3. Writing the trip from speed perspective:
a. In bulleted form:
First walked at constant speed out my door and down the driveway for about
15 feet in about 10 seconds
I maintained this speed when I turned right at the sidewalk walking one step
(about 3 feet) in about 1 second
Then I continued to walk at a constant speed for 3 blocks (about 300 feet) in
about 2 minutes
I maintained this speed when I turned left walking one step (about 3 feet) in
about 1 second
Then I decreased my speed suddenly before stopping to wait for the light to
change for about 1 minute
I sped up over several steps (about 10 feet) in about 5 seconds
I walked at constant speed for 3 blocks (about 300 feet) in about 2 minutes
I maintained my speed while I turned left in one step (about 3 feet) toward
my friend’s house in about 1 second
Finally, I slowed down for about 15 feet in about 10 seconds until I stopped
at her door.
b. An example table and graph:
Time (seconds) Speed (feet/s)
-500
50100150200250300350400450500550600650700
-20 0 20 40 60 80 100 120 140 160 180 200 220 240 260 280 300 320 340
Dis
tan
ce (
fee
t)
Time (s)
Distance Walked on My Trip

62 Science of Driving
0 0
0-10 1.5
10-11 3
11-131 2.5
131-132 3
132-192 0
192-197 2
197-317 2.5
317-318 3
318-328 1.5
1
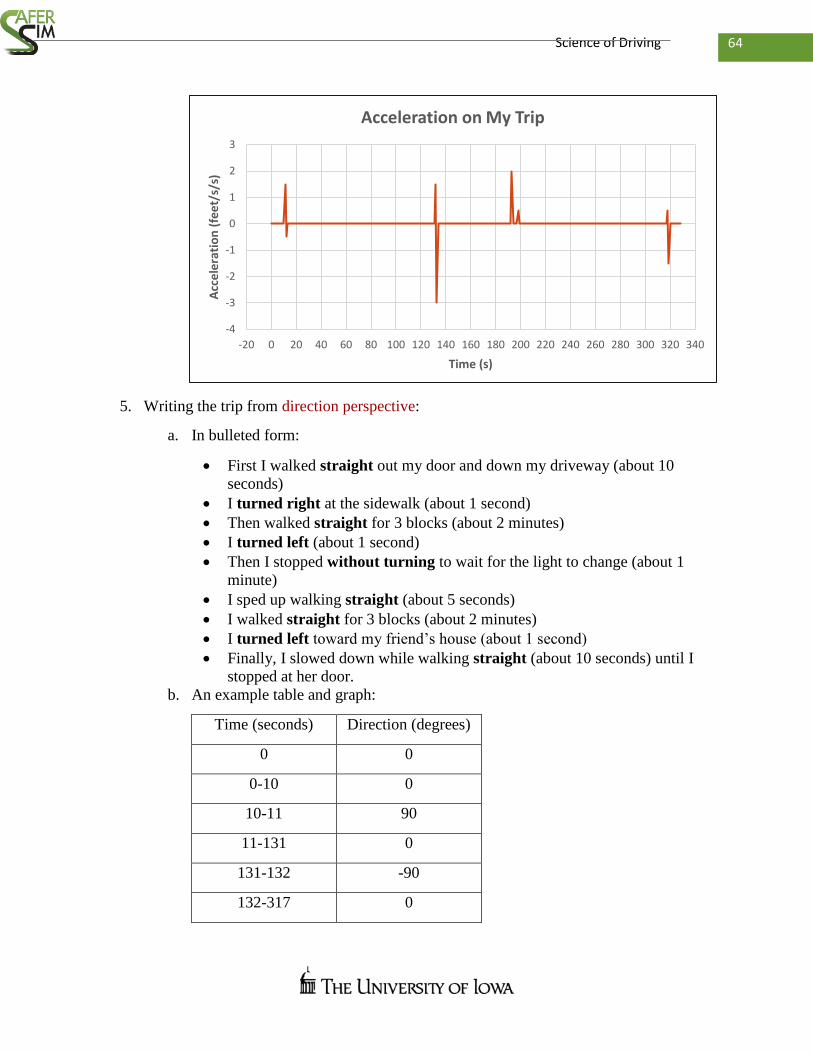
4. Writing the story from acceleration perspective:
a. In bulleted form:
First I walked with no acceleration out my door and down my driveway
(about 10 seconds)
I turned right while accelerating slightly at the sidewalk (about 1 second)
Then walked with no change in acceleration for about 3 blocks (about 2
minutes)
I turned left while accelerating slightly (about 1 second)
Then I quickly decelerated (about 2 seconds) to a stop (about 1 minute)
I accelerated to reach constant walking speed (about 5 seconds)
I walked with no acceleration for about 3 blocks (about 2 minutes)
-0.5
0
0.5
1
1.5
2
2.5
3
3.5
-20 0 20 40 60 80 100 120 140 160 180 200 220 240 260 280 300 320 340
Spe
ed
(fe
et/
s)
Time (s)
Speed Walked on My Trip

63 Science of Driving
I turned left while accelerating slightly (about 1 second)
Finally, I decelerated slowly (about 10 seconds) until I stopped at her door.
b. An example table and graph:
Time (seconds) Acceleration
(feet/s/s)
0 0
0-10 0
10-11 1.5
11-12 -0.5
12-131 0
131-132 1.5
132-133 -3
133-192 0
192-193 2
193-197 0
197-198 0.5
198-317 0
317-318 0.5
318-319 -1.5
319-328 0
64 Science of Driving
1
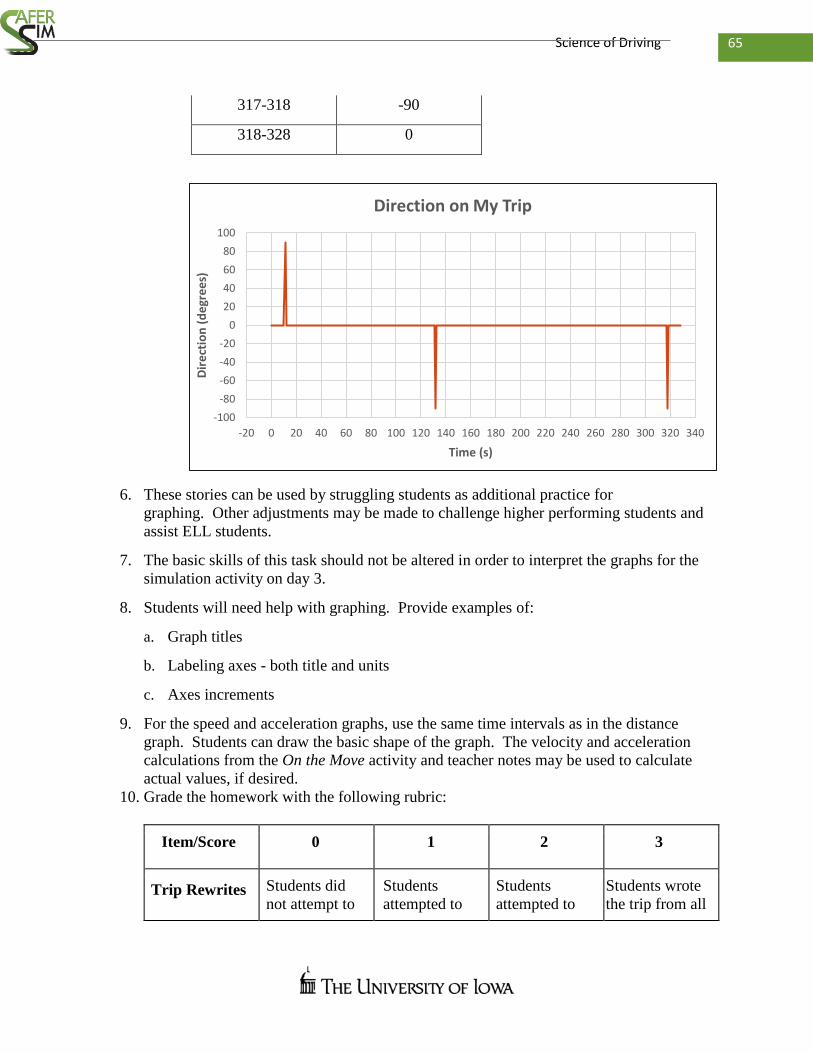
5. Writing the trip from direction perspective:
a. In bulleted form:
First I walked straight out my door and down my driveway (about 10
seconds)
I turned right at the sidewalk (about 1 second)
Then walked straight for 3 blocks (about 2 minutes)
I turned left (about 1 second)
Then I stopped without turning to wait for the light to change (about 1
minute)
I sped up walking straight (about 5 seconds)
I walked straight for 3 blocks (about 2 minutes)
I turned left toward my friend’s house (about 1 second)
Finally, I slowed down while walking straight (about 10 seconds) until I
stopped at her door.
b. An example table and graph:
Time (seconds) Direction (degrees)
0 0
0-10 0
10-11 90
11-131 0
131-132 -90
132-317 0
-4
-3
-2
-1
0
1
2
3
-20 0 20 40 60 80 100 120 140 160 180 200 220 240 260 280 300 320 340
Acc
ele
rati
on
(fe
et/
s/s)
Time (s)
Acceleration on My Trip
65 Science of Driving
317-318 -90
318-328 0
1
6. These stories can be used by struggling students as additional practice for
graphing. Other adjustments may be made to challenge higher performing students and
assist ELL students.
7. The basic skills of this task should not be altered in order to interpret the graphs for the
simulation activity on day 3.
8. Students will need help with graphing. Provide examples of:
a. Graph titles
b. Labeling axes - both title and units
c. Axes increments
9. For the speed and acceleration graphs, use the same time intervals as in the distance
graph. Students can draw the basic shape of the graph. The velocity and acceleration
calculations from the On the Move activity and teacher notes may be used to calculate
actual values, if desired.
10. Grade the homework with the following rubric:
Item/Score 0 1 2 3
Trip Rewrites Students did
not attempt to
Students
attempted to
Students
attempted to
Students wrote
the trip from all
-100
-80
-60
-40
-20
0
20
40
60
80
100
-20 0 20 40 60 80 100 120 140 160 180 200 220 240 260 280 300 320 340
Dir
ect
ion
(d
egr
ee
s)
Time (s)
Direction on My Trip
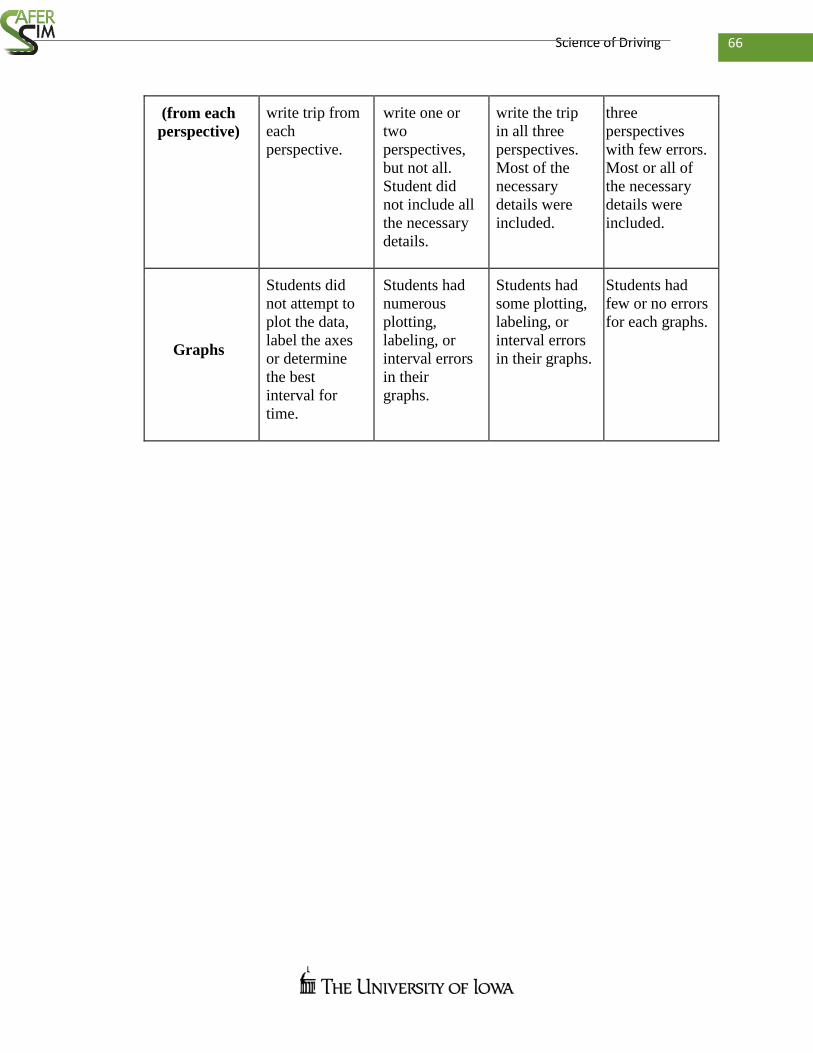
66 Science of Driving
(from each
perspective)
write trip from
each
perspective.
write one or
two
perspectives,
but not all.
Student did
not include all
the necessary
details.
write the trip
in all three
perspectives.
Most of the
necessary
details were
included.
three
perspectives
with few errors.
Most or all of
the necessary
details were
included.
Graphs
Students did
not attempt to
plot the data,
label the axes
or determine
the best
interval for
time.
Students had
numerous
plotting,
labeling, or
interval errors
in their
graphs.
Students had
some plotting,
labeling, or
interval errors
in their graphs.
Students had
few or no errors
for each graphs.
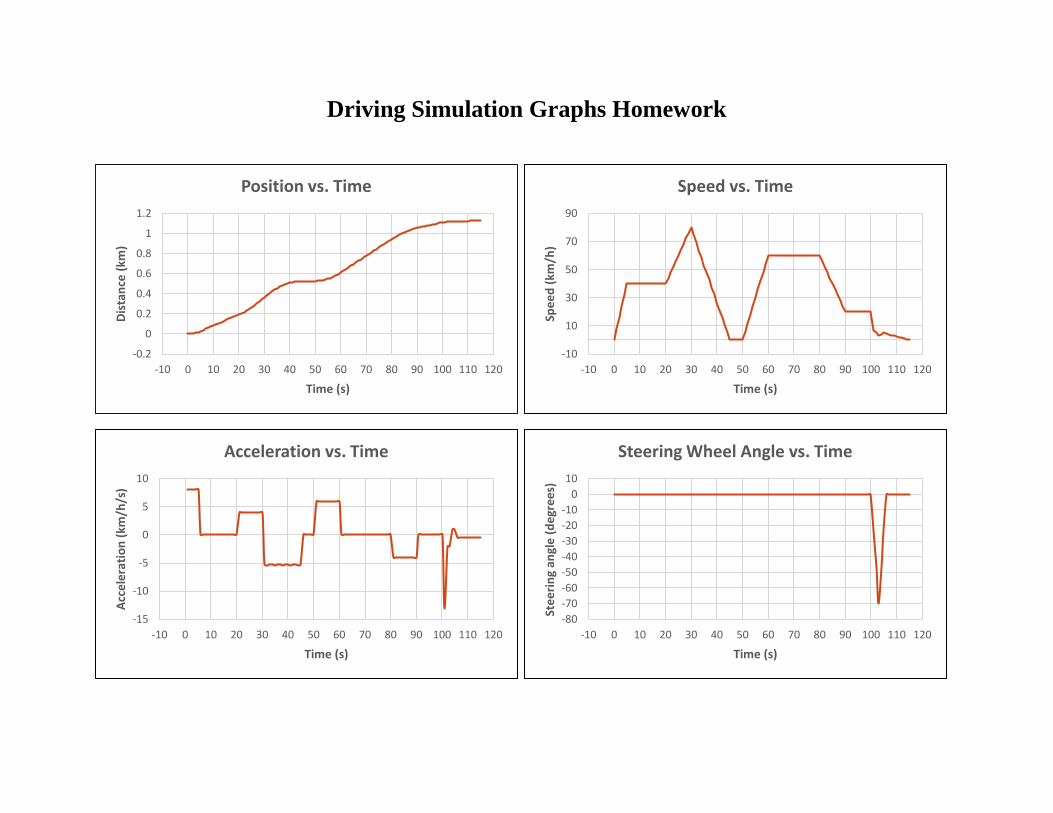
Driving Simulation Graphs Homework
-0.2
0
0.2
0.4
0.6
0.8
1
1.2
-10 0 10 20 30 40 50 60 70 80 90 100 110 120
Dis
tan
ce (
km)
Time (s)
Position vs. Time
-10
10
30
50
70
90
-10 0 10 20 30 40 50 60 70 80 90 100 110 120
Spe
ed
(km
/h)
Time (s)
Speed vs. Time
-15
-10
-5
0
5
10
-10 0 10 20 30 40 50 60 70 80 90 100 110 120
Acc
ele
rati
on
(km
/h/s
)
Time (s)
Acceleration vs. Time
-80
-70
-60
-50
-40
-30
-20
-10
0
10
-10 0 10 20 30 40 50 60 70 80 90 100 110 120
Ste
eri
ng
angl
e (
de
gre
es)
Time (s)
Steering Wheel Angle vs. Time
68 Science of Driving
Write out a driving plan that describes the motion of the car that is represented in the above graphs. Compare your plan with your
group members and decide on a final plan to use with the simulator.

Lesson Three: Simulation Driving Day
Grade level: 6-8
Expected length of lesson: Two days, approximately 90 minutes
Overview:
On the third day, groups should finalize their driving plan before driving the simulator to
replicate the graphs given to them the prior day. Afterwards, NADS generated graphs are
compared to the homework graphs. An assessment will follow the NADS simulation and
graph comparison.
Standards and/or benchmarks:
NGSS:
Disciplinary Core Idea:
Forces and Motion
MS-PS2-2:
o All positions of objects and the directions of forces and motions must be
described in an arbitrarily chosen reference frame and arbitrarily chosen units
of size. In order to share information with other people, these choices must
also be shared.
Cross-Cutting Concepts:
MS-PS3-1, MS-PS3-4:
o Proportional relationships (e.g. speed as the ratio of distance traveled to time
taken) among different types of quantities provide information about the
magnitude of properties and processes.
Science and Engineering Practices:
Planning and Carrying Out Investigations
MS-PS2-2:
o Plan an investigation individually and collaboratively, and in the design:
identify independent and dependent variables and controls, what tools are
needed to do the gathering, how measurements will be recorded, and how
many data are needed to support a claim.
MS-PS2-5:
70 Science of Driving
o Conduct an investigation and evaluate the experimental design to produce data
to serve as the basis for evidence that can meet the goals of the investigation.
Iowa Core:
S.6–8.PS.3
o Essential Concept and/or Skill: Understand and apply knowledge of motions
and forces.
The motion of an object can be described by its position, direction of
motion, and speed. That motion can be measured and represented on a
graph.
Learning Goals:
Students will understand:
How position vs time, speed vs time, acceleration vs time and steering (or
direction) vs time are related
Multiple graphs are necessary to know the whole story of complex motions.
Learning Performances:
Students will be able to:
Generate a driving plan from the 4 graphs provided.
Compare simulation graphs to activity graphs.
Compare simulation graphs between groups.
Decide the criteria to pick a winner of the driving contest.
Materials:
Activity graphs
NADS simulator
Describing Motion and Position Using Graphs (Assessment Activity)
Assessment Key and Rubrics
Safety:
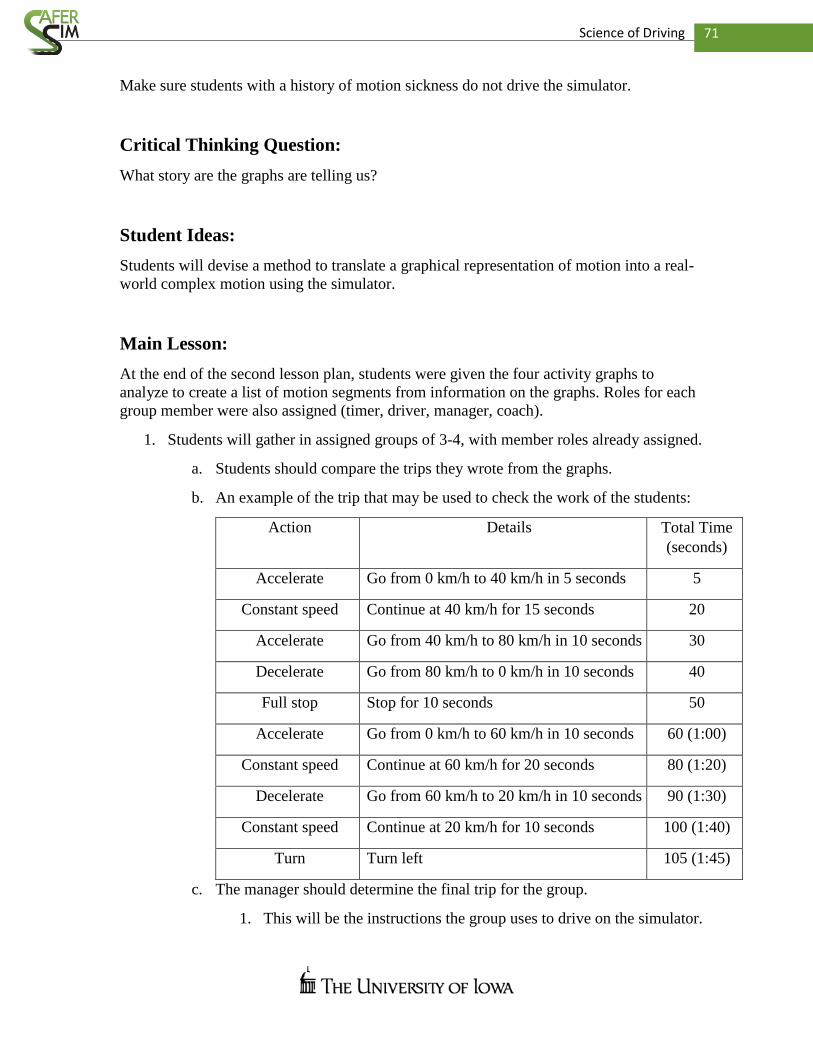
71 Science of Driving
Make sure students with a history of motion sickness do not drive the simulator.
Critical Thinking Question:
What story are the graphs are telling us?
Student Ideas:
Students will devise a method to translate a graphical representation of motion into a real-
world complex motion using the simulator.
Main Lesson:
At the end of the second lesson plan, students were given the four activity graphs to
analyze to create a list of motion segments from information on the graphs. Roles for each
group member were also assigned (timer, driver, manager, coach).
1. Students will gather in assigned groups of 3-4, with member roles already assigned.
a. Students should compare the trips they wrote from the graphs.
b. An example of the trip that may be used to check the work of the students:
Action Details Total Time
(seconds)
Accelerate Go from 0 km/h to 40 km/h in 5 seconds 5
Constant speed Continue at 40 km/h for 15 seconds 20
Accelerate Go from 40 km/h to 80 km/h in 10 seconds 30
Decelerate Go from 80 km/h to 0 km/h in 10 seconds 40
Full stop Stop for 10 seconds 50
Accelerate Go from 0 km/h to 60 km/h in 10 seconds 60 (1:00)
Constant speed Continue at 60 km/h for 20 seconds 80 (1:20)
Decelerate Go from 60 km/h to 20 km/h in 10 seconds 90 (1:30)
Constant speed Continue at 20 km/h for 10 seconds 100 (1:40)
Turn Turn left 105 (1:45)
c. The manager should determine the final trip for the group.
1. This will be the instructions the group uses to drive on the simulator.
72 Science of Driving
2. When the trips are finalized, have the class decide the criteria that will determine
the winner.
a. Examples of criteria include: accelerating at the right times, accelerating at
the correct rate, maintaining correct speeds, turning the correct direction,
etc.
3. Explain that each group will have one attempt to drive the simulation to generate
graphs as close to the given activity graphs as possible.
a. If time permits, groups may have the ability to drive more than once.
4. Choose how to decide the order of groups.
a. Groups should not be allowed to watch others drive the simulator.
5. Graphs will be generated by the simulation program after all groups have finished
their simulation.
a. The ideal graphs (from the homework) will be the black line on the graph.
b. Each graph will contain all of the trials from the groups in different colors.
c. Groups will not know what color they are until after the winner is decided.
d. Winners will be given prizes brought by NADS (pencils, highlighters, etc.).
6. Based on the criteria chosen above (in step 2), the class chooses which color is the
winner.
a. Each group’s color will then be revealed.
7. A whole class discussion will facilitate a comparison of the graphs between groups
and given activity graphs.
a. Discuss what they could have done differently to create graphs closer to the
graphs given to them.
b. Discuss why their graphs are not identical to the graphs given to them.
Differentiation:
ELL: Put them in groups with stronger students who will assist them in
understanding.
TAG: Have them create their own scenario and their own graph for the Describing
Motion and Position Using Graphs Worksheet.
Special Education: Provide the labels on graphs axes for the Describing Motion
and Position Using Graphs Worksheet.
Assessment:

73 Science of Driving
Use the Describing Motion and Position Using Graphs assessment worksheet to check for
understanding at the end of the progression:
Graph axes may be filled in for students with special needs.
ELL students may be allowed to use verbal descriptions to answer the questions.
Assessment: Describing Motion and Position Worksheet
Name: Date:
1. How does velocity relate to acceleration? From 2-4 seconds, did Jamie or Frank
accelerate faster? Explain why.
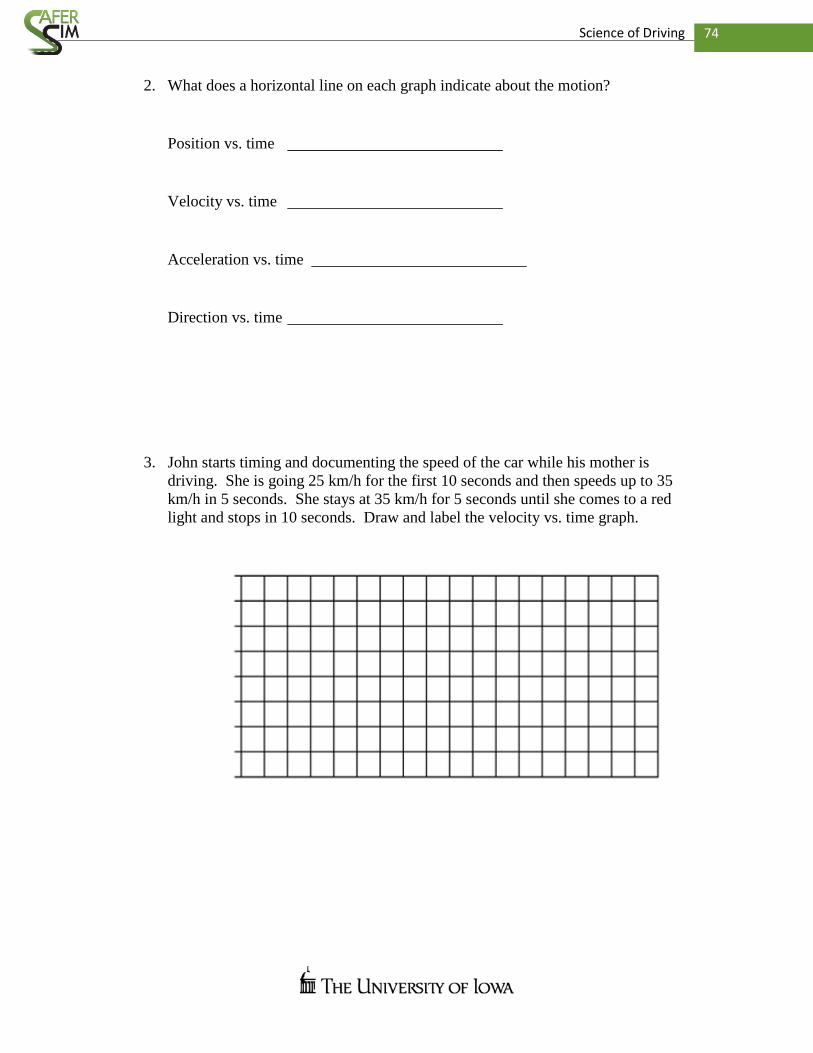
74 Science of Driving
2. What does a horizontal line on each graph indicate about the motion?
Position vs. time
Velocity vs. time
Acceleration vs. time
Direction vs. time
3. John starts timing and documenting the speed of the car while his mother is
driving. She is going 25 km/h for the first 10 seconds and then speeds up to 35
km/h in 5 seconds. She stays at 35 km/h for 5 seconds until she comes to a red
light and stops in 10 seconds. Draw and label the velocity vs. time graph.
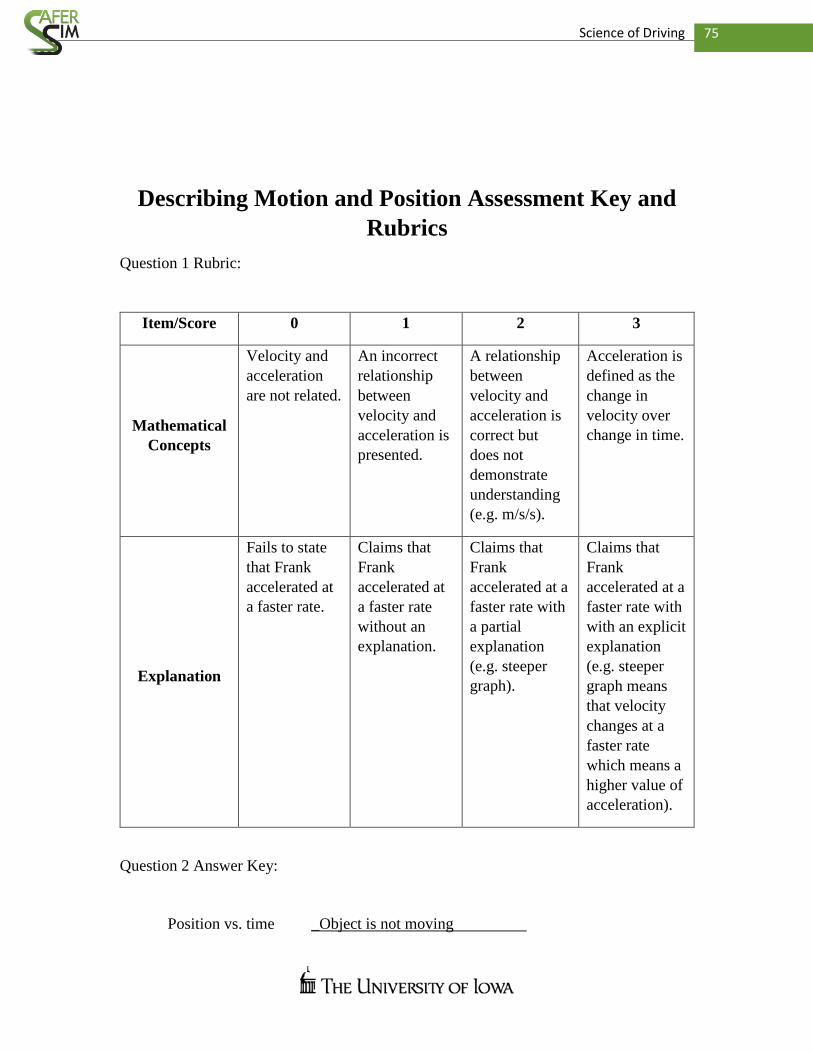
75 Science of Driving
Describing Motion and Position Assessment Key and
Rubrics
Question 1 Rubric:
Item/Score 0 1 2 3
Mathematical
Concepts
Velocity and
acceleration
are not related.
An incorrect
relationship
between
velocity and
acceleration is
presented.
A relationship
between
velocity and
acceleration is
correct but
does not
demonstrate
understanding
(e.g. m/s/s).
Acceleration is
defined as the
change in
velocity over
change in time.
Explanation
Fails to state
that Frank
accelerated at
a faster rate.
Claims that
Frank
accelerated at
a faster rate
without an
explanation.
Claims that
Frank
accelerated at a
faster rate with
a partial
explanation
(e.g. steeper
graph).
Claims that
Frank
accelerated at a
faster rate with
with an explicit
explanation
(e.g. steeper
graph means
that velocity
changes at a
faster rate
which means a
higher value of
acceleration).
Question 2 Answer Key:
Position vs. time _Object is not moving
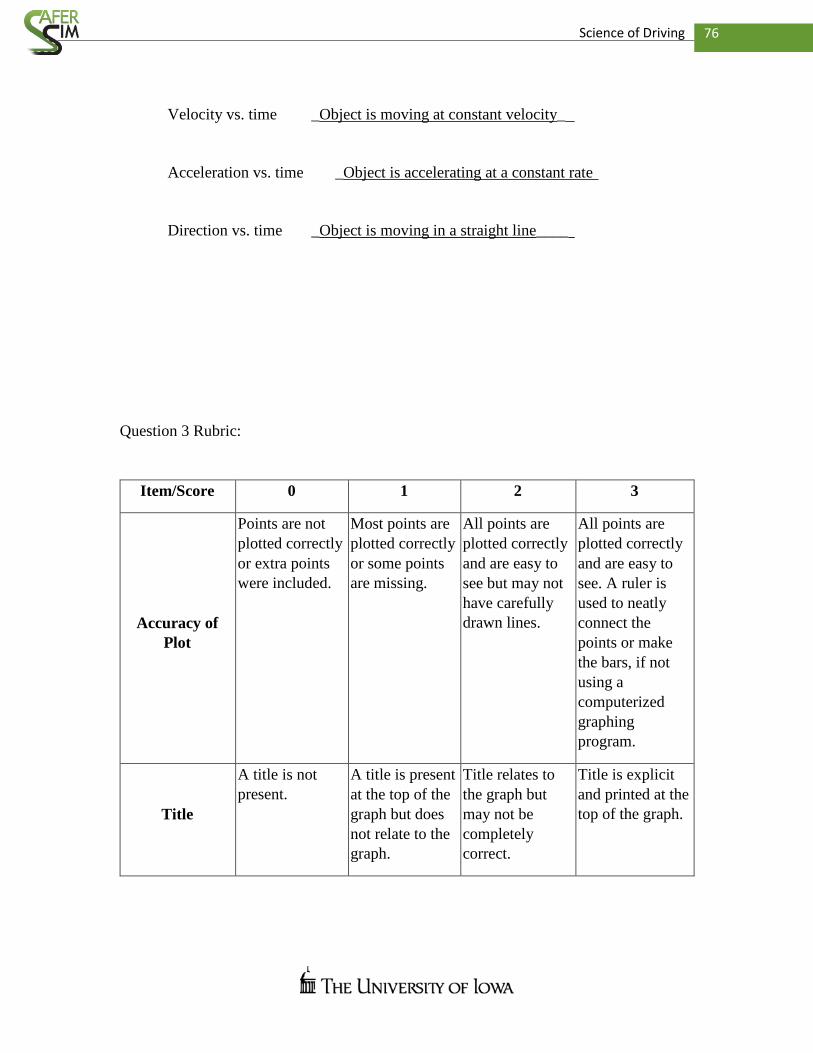
76 Science of Driving
Velocity vs. time _Object is moving at constant velocity_
Acceleration vs. time _Object is accelerating at a constant rate
Direction vs. time _Object is moving in a straight line____
Question 3 Rubric:
Item/Score 0 1 2 3
Accuracy of
Plot
Points are not
plotted correctly
or extra points
were included.
Most points are
plotted correctly
or some points
are missing.
All points are
plotted correctly
and are easy to
see but may not
have carefully
drawn lines.
All points are
plotted correctly
and are easy to
see. A ruler is
used to neatly
connect the
points or make
the bars, if not
using a
computerized
graphing
program.
Title
A title is not
present.
A title is present
at the top of the
graph but does
not relate to the
graph.
Title relates to
the graph but
may not be
completely
correct.
Title is explicit
and printed at the
top of the graph.

77 Science of Driving
Labeling of X-
Axis
The X axis is
not labeled.
The X axis has a
label without
units.
The X axis is
labeled with the
units only (e.g.
seconds,
minutes)
The X axis has a
clear, neat label
that includes the
units used for the
independent
variable (e.g,
time).
Labeling of Y-
Axis
The Y axis is
not labeled.
The Y axis has a
label without
units.
The Y axis is
labeled with
units only (e.g,
m/s, meters).
The Y axis has a
clear, neat label
that includes the
units for the
dependent
variable (e.g,
velocity,
acceleration,
distance,
direction).
78 Science of Driving
Unit 2
Unit 2: A World with Friction
Goals:
To educate middle school students about friction and how it affects
driving. Students will understand that there are forces and factors that
influence motion, including mass, velocity, and friction.
Justification:
Middle school students have many misconceptions about physics,
particularly friction. These misconceptions are as follows:
Friction is caused by surface roughness (there are many times when
this is indeed true, but others where a surface may not be as rough
but still have more friction, ex: the sticky side of tape is less rough
than sandpaper but has more friction)
An object doesn’t stop because of a presence of a force; it stops
because of an absence of a force
Objects at rest have no forces acting on them
Moving objects come to a stop even when there is no friction
Friction only occurs between solids
There are tiny bumps that cause friction (the use of sandpaper)
Friction always hinders motion; reducing friction is always desired
The science teacher should identify where these misconceptions come
from, and provide experiences for students to address these ideas to
construct scientifically accepted understandings.
79 Science of Driving
Lesson One: Factors that Affect Motion
Grade level: 6-8
Expected length of lesson: 45-90 Minutes
Overview:
This lesson will serve as an in introduction to the driving simulator activity. Students
will collect data and draw conclusions about how different variables such as mass,
velocity, and friction affect motion. Students will then be introduced to the stopping
distance calculation that they will use in the driving simulation activity.
Standards and Benchmarks:
NGSS:
Performance Expectations:
MS-PS3-5:
o Construct, use, and present arguments to support the claim that when the
kinetic energy of an object changes, energy is transferred to or from the
object.
Disciplinary Core Ideas:
MS-PS3-1:
o Motion energy is properly called kinetic energy; it is proportional to the mass
of the moving object and grows with the square of its speed.
80 Science of Driving
MS-PS3-5:
o When the motion energy of an object changes, there is inevitably some other
change in energy at the same time.
Cross-Cutting Concepts:
MS-PS2-1, MS-PS2-1:
o Models can be used to represent systems and their interactions—such as
inputs, processes and outputs—and energy and matter flows within systems.
Science and Engineering Practices:
MS-PS2-4:
o Construct and present oral and written arguments supported by empirical
evidence and scientific reasoning to support or refute an explanation or a
model for a phenomenon or a solution to a problem.
MS-PS2-5:
o Conduct an investigation and evaluate the experimental design to produce data
to serve as the basis for evidence that can meet the goals of the investigation.
Iowa Core
Science:
S.6-8.PS.3:
o Understand and apply knowledge of motions and forces.

81 Science of Driving
Mathematics:
6.EE.C.9:
o Use variables to represent two quantities in a real–world problem that change
in relationship to one another; write an equation to express one quantity,
thought of as the dependent variable, in terms of the other quantity, thought of
as the independent variable. Analyze the relationship between the dependent
and independent variables using graphs and tables, and relate these to the
equation.
6.EE.B.6:
o Use variables to represent numbers and write expressions when solving a
real–world or mathematical problem; understand that a variable can represent
an unknown number, or, depending on the purpose at hand, any number in a
specified set.
Literacy:
WHST.6-8.1:
o Write arguments focused on discipline–specific content.
WHST.6-8.10:
o Write routinely over extended time frames (time for reflection and revision)
and shorter time frames (a single sitting or a day or two) for a range of
discipline–specific tasks, purposes, and audiences.
Learning Goals:
Students will understand that:
There are many forces and factors that influence motion, including mass, velocity,
and friction.
Friction is a force that opposes motion.
Velocity is a measure of distance traveled during a certain time.
Mass is what is pulled on by gravity to determine weight.
Stopping distance varies with road surface conditions (friction), mass of the
vehicle, and velocity of the vehicle.
Learning Performances:
Students will be able to:
Solve the stopping distance equation:
82 Science of Driving
Describe the effects that velocity, friction, and mass have on the motion of an
object.
Materials:
Friction Probe #17 Uncovering Student Ideas in Physical Science 2010 (by Page
Keeley)
3 small model cars
3 ramps
Weight to attach to car (to increase mass of car)
Towel or other material (to increase friction)
Textbooks to elevate ramps (for control experiment and to increase velocity)
Students’ Ideas:
Students may think there is no friction between stationary objects.
Students may not know terms such as mass, velocity, and friction.
Students may not realize what factors affect stopping distance.
Critical Thinking Questions:
What factors affect motion?
What factors affect stopping distance of a vehicle?
Main Lesson:
The teacher gives a brief outline of the simulation project and shows a video of the
simulator being driven so students know what to expect. This engages students and
prepares them for driving the simulator, as they do not have driving experience.
1. The teacher administers the Friction Probe to elicit students’ current
understanding/misconceptions about friction and forces. The teacher passes out the
friction probe, or projects it and students will have 5 minutes to complete it or write
their answers in their science notebooks. The teacher collects the probe to see what
misconceptions students have about friction and tallies the responses on the board.
2. Students are broken into groups of 3 (Simulation Groups). Within each group,
students decide which area of expertise to join, either mass, friction, or velocity
(Expert Groups). If there need to be 4 students in a Simulation Group, two students
should join Expert Group 2: Friction.
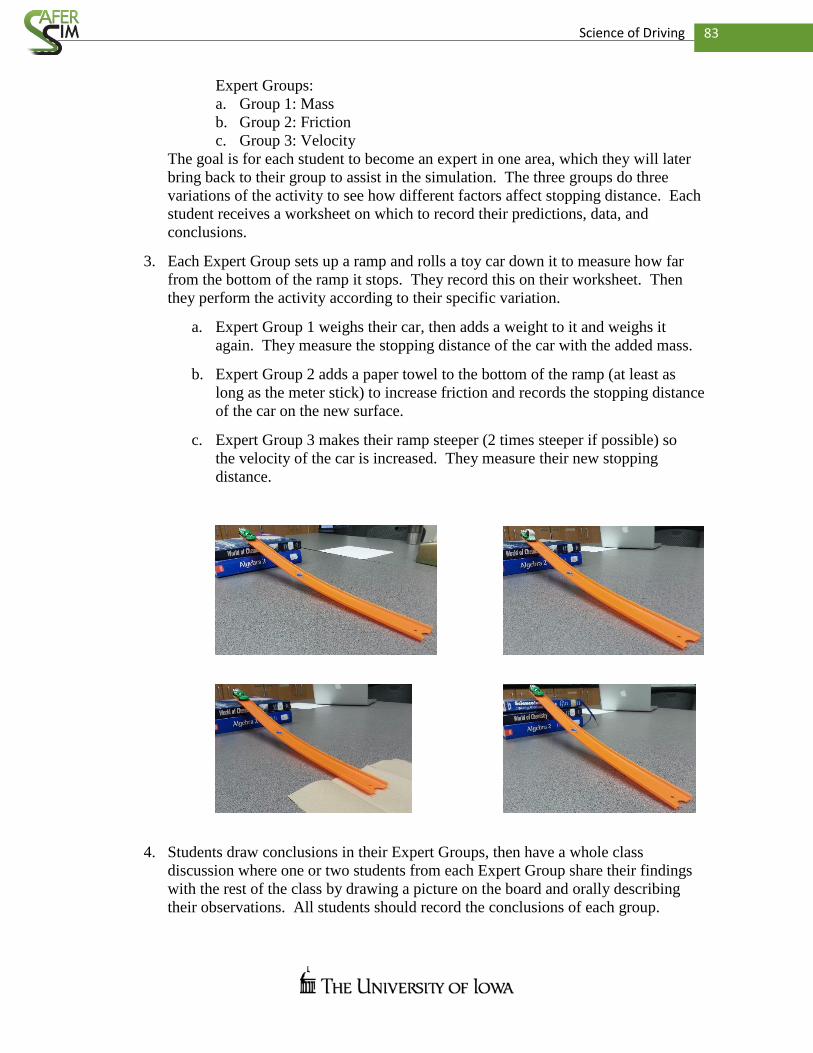
83 Science of Driving
Expert Groups:
a. Group 1: Mass
b. Group 2: Friction
c. Group 3: Velocity
The goal is for each student to become an expert in one area, which they will later
bring back to their group to assist in the simulation. The three groups do three
variations of the activity to see how different factors affect stopping distance. Each
student receives a worksheet on which to record their predictions, data, and
conclusions.
3. Each Expert Group sets up a ramp and rolls a toy car down it to measure how far
from the bottom of the ramp it stops. They record this on their worksheet. Then
they perform the activity according to their specific variation.
a. Expert Group 1 weighs their car, then adds a weight to it and weighs it
again. They measure the stopping distance of the car with the added mass.
b. Expert Group 2 adds a paper towel to the bottom of the ramp (at least as
long as the meter stick) to increase friction and records the stopping distance
of the car on the new surface.
c. Expert Group 3 makes their ramp steeper (2 times steeper if possible) so
the velocity of the car is increased. They measure their new stopping
distance.
4. Students draw conclusions in their Expert Groups, then have a whole class
discussion where one or two students from each Expert Group share their findings
with the rest of the class by drawing a picture on the board and orally describing
their observations. All students should record the conclusions of each group.
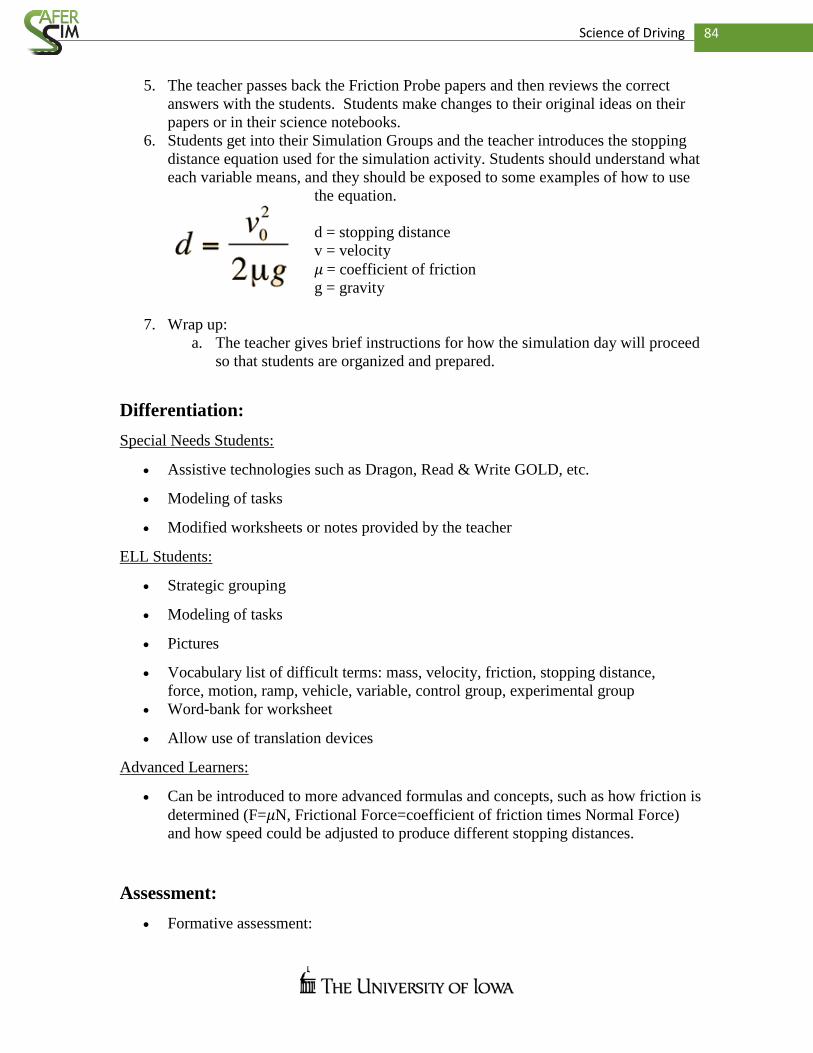
84 Science of Driving
5. The teacher passes back the Friction Probe papers and then reviews the correct
answers with the students. Students make changes to their original ideas on their
papers or in their science notebooks.
6. Students get into their Simulation Groups and the teacher introduces the stopping
distance equation used for the simulation activity. Students should understand what
each variable means, and they should be exposed to some examples of how to use
the equation.
d = stopping distance
v = velocity
𝜇 = coefficient of friction
g = gravity
7. Wrap up:
a. The teacher gives brief instructions for how the simulation day will proceed
so that students are organized and prepared.
Differentiation:
Special Needs Students:
Assistive technologies such as Dragon, Read & Write GOLD, etc.
Modeling of tasks
Modified worksheets or notes provided by the teacher
ELL Students:
Strategic grouping
Modeling of tasks
Pictures
Vocabulary list of difficult terms: mass, velocity, friction, stopping distance,
force, motion, ramp, vehicle, variable, control group, experimental group
Word-bank for worksheet
Allow use of translation devices
Advanced Learners:
Can be introduced to more advanced formulas and concepts, such as how friction is
determined (F=𝜇N, Frictional Force=coefficient of friction times Normal Force)
and how speed could be adjusted to produce different stopping distances.
Assessment:
Formative assessment:
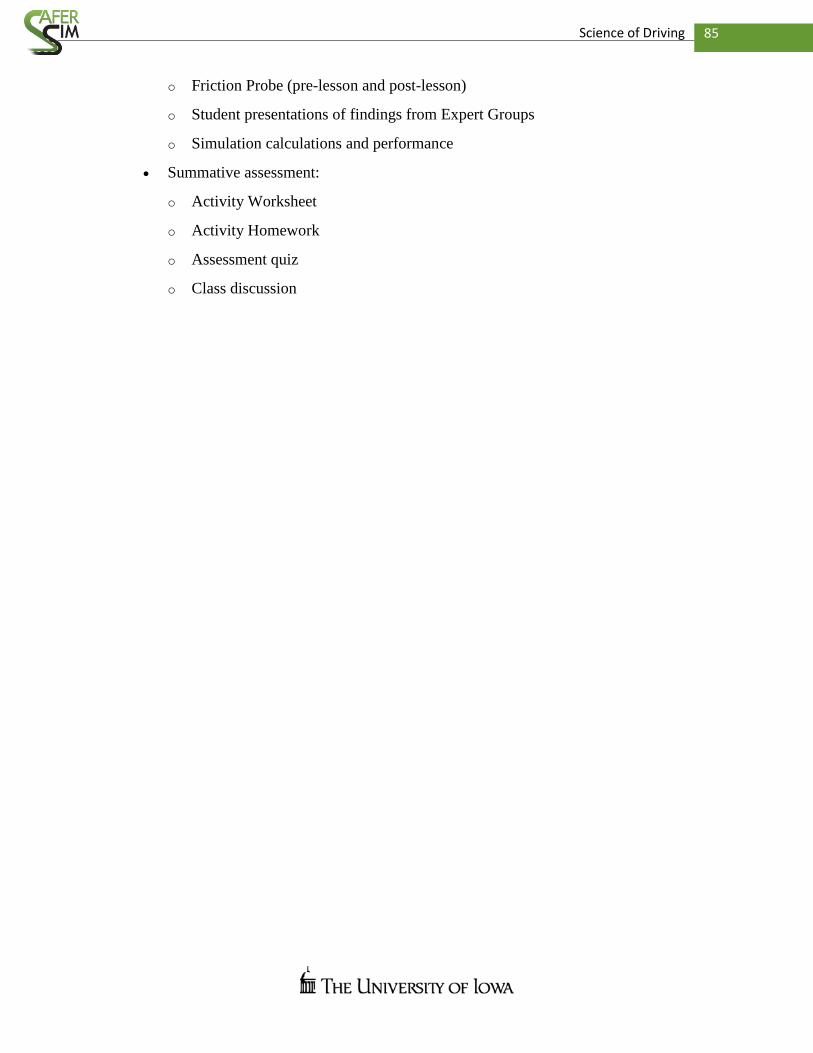
85 Science of Driving
o Friction Probe (pre-lesson and post-lesson)
o Student presentations of findings from Expert Groups
o Simulation calculations and performance
Summative assessment:
o Activity Worksheet
o Activity Homework
o Assessment quiz
o Class discussion
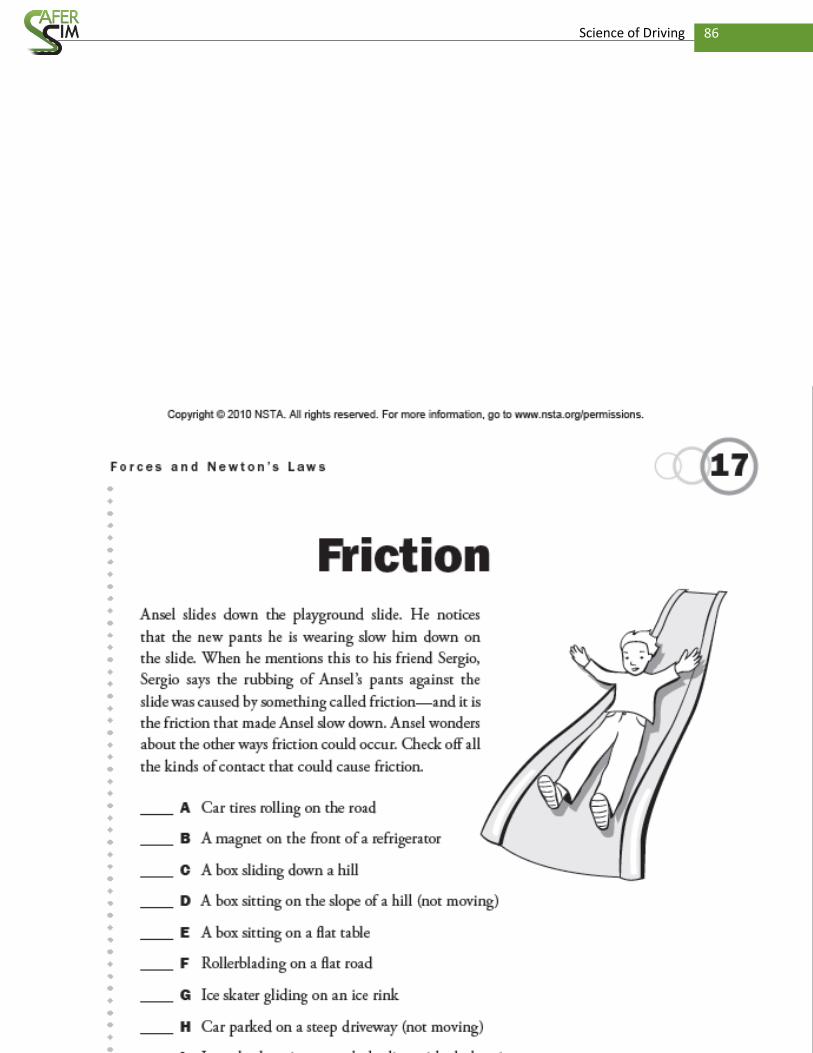
86 Science of Driving
Friction Probe

87 Science of Driving
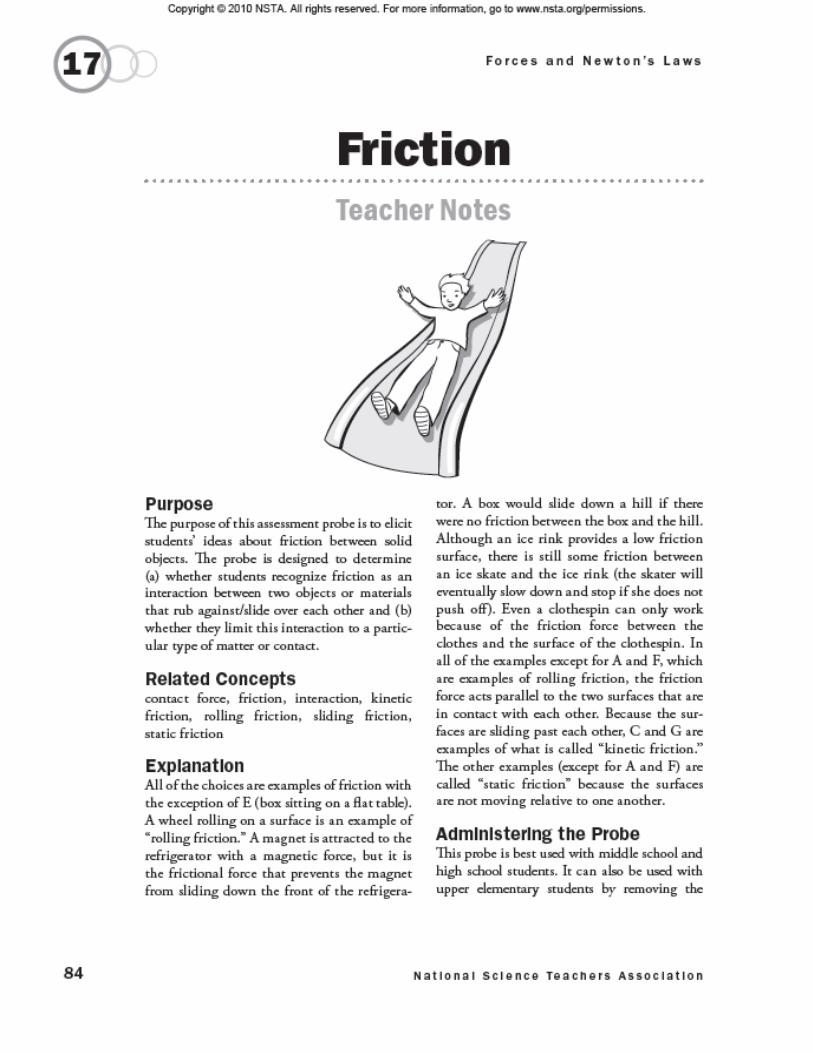
88 Science of Driving
Friction Probe Teacher Notes
89 Science of Driving

90 Science of Driving

91 Science of Driving
Experiment Data: Add your data found in the experiment to the chart below
Control Group Experimental Group
Trial 1 Stopping Distance
Trial 2 Stopping Distance
Trial 3 Stopping Distance
Average Stopping Distance
Conclusion: Use the space below to answer the questions in complete sentences.
1. Based on the data that you have collected through this experiment, what can you
conclude about your Expert Group Variable?
2. How can you use math to compute the stopping distance if given all the variables?
Activity Continued
1. Return to your Simulation Group.

92 Science of Driving
2. In your Simulation Group, explain to the other members what data you found in
your Expert Group.
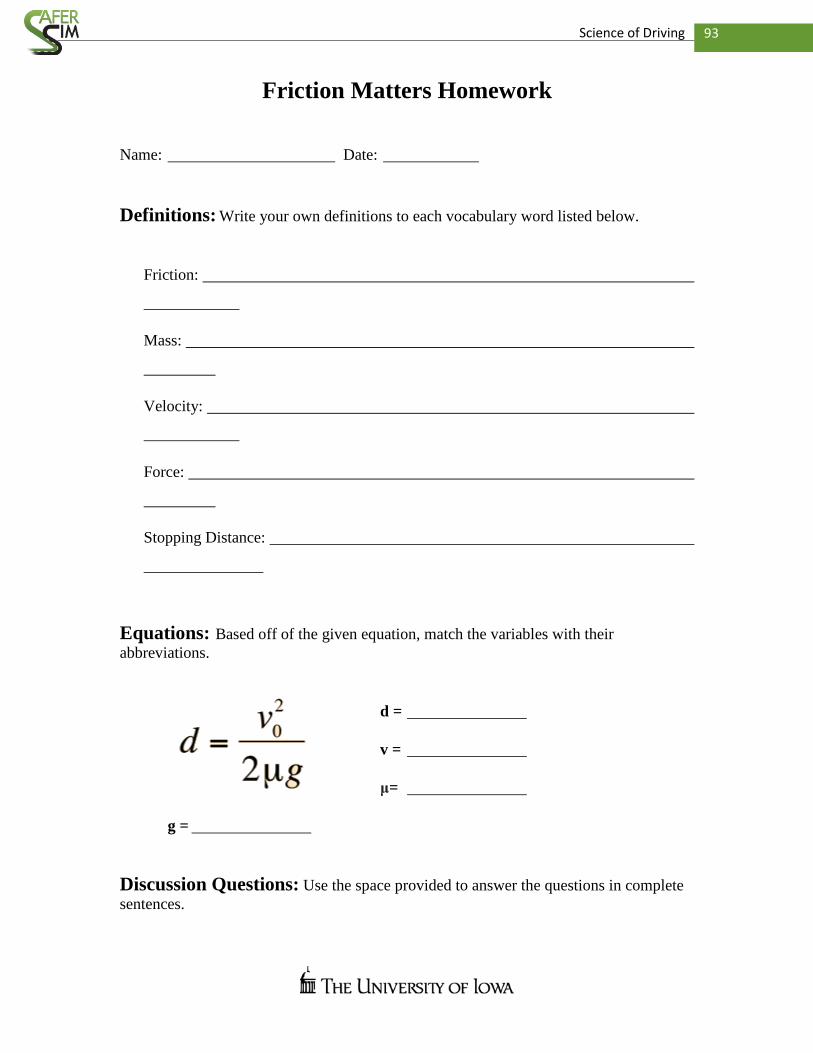
93 Science of Driving
Friction Matters Homework
Name: Date:
Definitions: Write your own definitions to each vocabulary word listed below.
Friction:
Mass:
Velocity:
Force:
Stopping Distance:
Equations: Based off of the given equation, match the variables with their
abbreviations.
d =
v =
μ=
g =
Discussion Questions: Use the space provided to answer the questions in complete
sentences.
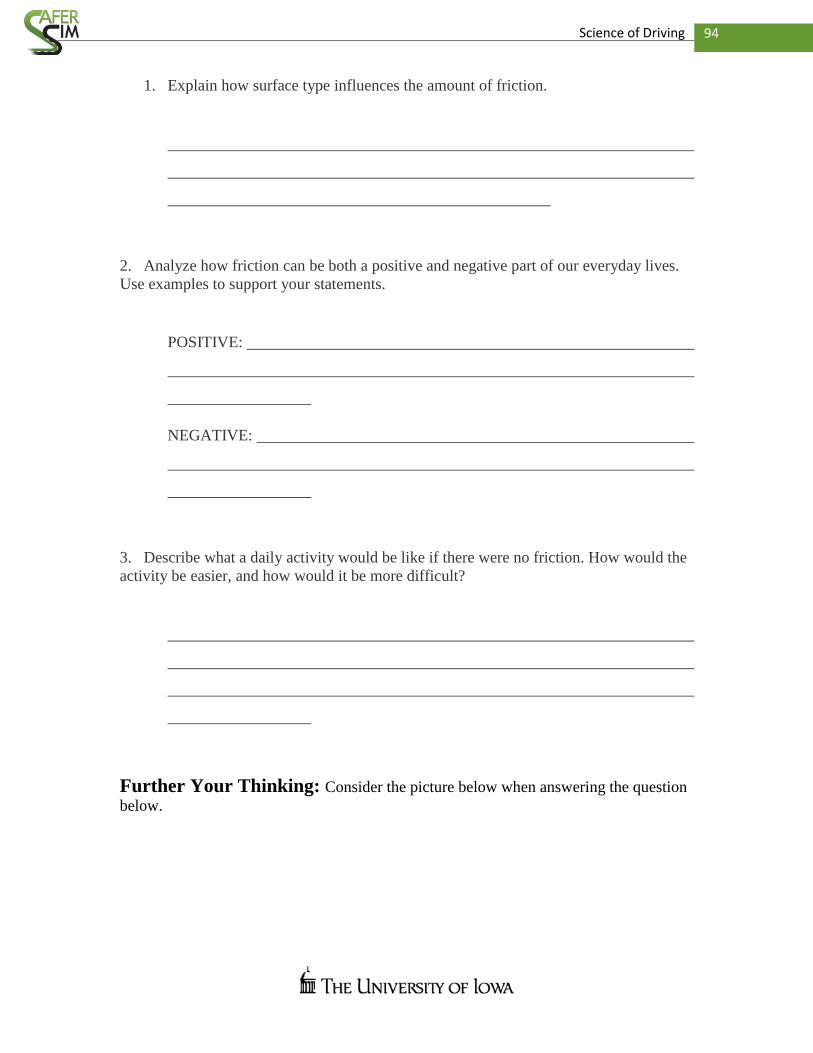
94 Science of Driving
1. Explain how surface type influences the amount of friction.
2. Analyze how friction can be both a positive and negative part of our everyday lives.
Use examples to support your statements.
POSITIVE:
NEGATIVE:
3. Describe what a daily activity would be like if there were no friction. How would the
activity be easier, and how would it be more difficult?
Further Your Thinking: Consider the picture below when answering the question
below.

95 Science of Driving
1. How might reaction time influence your stopping distance?
Fiction Matters Homework Teacher Key
Definitions: Write your own definitions to each vocabulary word listed below
Friction: The resistance of motion when one object rubs against another
Mass: A measure of a numbers of atoms in an object
Velocity: The speed and direction of an object

96 Science of Driving
Force: Strength or energy that causes a physical action or motion
Stopping Distance: Measured amount of space it requires to become stationary
Equations: Based off of the given equation, match the variables with their
abbreviations.
d = stopping distance
v = velocity
μ= coefficient of friction
g = gravity
Discussion Questions: Use the space provided to answer the questions in
complete sentences.
1. Explain how surface type influences the amount of friction.
Answers may vary. Generally, a rougher surface causes there to be more
friction and a smoother surfaces causes less friction.
2. Analyze how friction can be both a positive and negative part of our everyday lives.
Use examples to support your statements.
POSITIVE: Answers may vary. Friction allows you to travel, play sports, write
with your pencil and many more things. Without friction we would always be
moving unless stopped by an outside force.
97 Science of Driving
NEGATIVE: Answers may vary. Friction causes you to lose energy while
traveling, playing sports and writing with your pencil. Without a stronger
opposing force friction would always slow you down.
3. Hypothesize what a daily activity would be like if there were no friction. How would
the activity be easier, and how would it be more difficult?
Answers may vary. When going to school without friction you would have to
accurately aim and push off from your front door. You’d have to hope to not hit
any objects that may change your route. This would make getting to school
faster as long as you didn’t run into any objects but would make it much more
difficult overall and probably painful.
Further Your Thinking: Consider the picture below when answering the question
below.
Photo from The Department of Transportation Highway Code
1. How does reaction time and distance change when your vehicle goes faster?
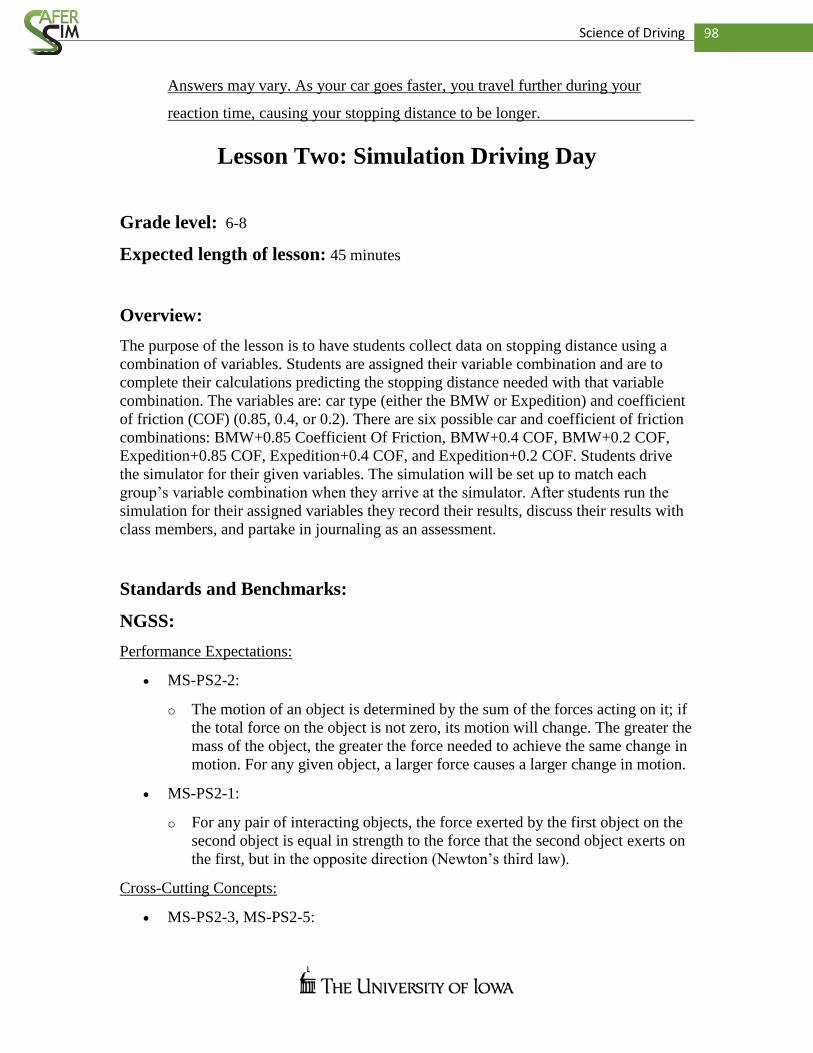
98 Science of Driving
Answers may vary. As your car goes faster, you travel further during your
reaction time, causing your stopping distance to be longer.
Lesson Two: Simulation Driving Day
Grade level: 6-8
Expected length of lesson: 45 minutes
Overview:
The purpose of the lesson is to have students collect data on stopping distance using a
combination of variables. Students are assigned their variable combination and are to
complete their calculations predicting the stopping distance needed with that variable
combination. The variables are: car type (either the BMW or Expedition) and coefficient
of friction (COF) (0.85, 0.4, or 0.2). There are six possible car and coefficient of friction
combinations: BMW+0.85 Coefficient Of Friction, BMW+0.4 COF, BMW+0.2 COF,
Expedition+0.85 COF, Expedition+0.4 COF, and Expedition+0.2 COF. Students drive
the simulator for their given variables. The simulation will be set up to match each
group’s variable combination when they arrive at the simulator. After students run the
simulation for their assigned variables they record their results, discuss their results with
class members, and partake in journaling as an assessment.
Standards and Benchmarks:
NGSS:
Performance Expectations:
MS-PS2-2:
o The motion of an object is determined by the sum of the forces acting on it; if
the total force on the object is not zero, its motion will change. The greater the
mass of the object, the greater the force needed to achieve the same change in
motion. For any given object, a larger force causes a larger change in motion.
MS-PS2-1:
o For any pair of interacting objects, the force exerted by the first object on the
second object is equal in strength to the force that the second object exerts on
the first, but in the opposite direction (Newton’s third law).
Cross-Cutting Concepts:
MS-PS2-3, MS-PS2-5:
99 Science of Driving
o Cause and effect relationships may be used to predict phenomena in natural or
designed systems.
MS-PS2-1, MS-PS2-4:
o Models can be used to represent systems and their interactions such as inputs
processes and outputs and energy and matter flows within systems.
MS-PS2-2:
o Explanations of stability and change in natural or designed systems can be
constructed by examining the changes over time and forces at different scales.
Science and Engineering Practices:
MS-PS2-4:
o Construct and present oral and written arguments supported by empirical
evidence and scientific reasoning to support or refute an explanation or a
model for a phenomenon or a solution to a problem.
MS-PS2-2, MS-PS2-4:
o Science knowledge is based upon logical and conceptual connections between
evidence and explanations.
Iowa Core
Science:
S.6–8.PS.3:
o Essential Concept and/or Skill: Understand and apply knowledge of motions
and forces. The motion of an object can be described by its position, direction
of motion, and speed. That motion can be measured and represented on a
graph.
Comprehension and Collaboration:
SL.8.1: o Engage effectively in a range of collaborative discussions (one–on–one, in
groups, and teacher–led) with diverse partners on grade 8 topics, texts, and
issues, building on others’ ideas and expressing their own clearly. SL.8.2:
o Analyze the purpose of information presented in diverse media and formats
(e.g., visually, quantitatively, orally) and evaluate the motives (e.g., social,
commercial, political) behind its presentation. SL.8.3:
100 Science of Driving
o Delineate a speaker’s argument and specific claims, evaluating the soundness
of the reasoning and relevance and sufficiency of the evidence and identifying
when irrelevant evidence is introduced. Presentation of Knowledge and Ideas:
SL.8.4: o Present claims and findings, emphasizing salient points in a focused, coherent
manner with relevant evidence, sound valid reasoning, and well–chosen
details; use appropriate eye contact, adequate volume, and clear
pronunciation.
Learning Goals:
Students will understand:
Motion is dependent on the forces acting on it. In our simulation, the motion of
the car is dependent on the amount of friction of the pavement.
The relationship between friction and stopping distance.
How a simulation can be used to demonstrate a topic in a novel and real-world
way.
Learning Performances:
Students will be able to:
Properly calculate stopping distance given the variables: car type and coefficient
of friction.
Understand how friction and stopping distance are related by understanding that
an increase in friction means a decrease in stopping distance (higher friction
(closer to 1.0) means less time required to stop).
Materials:
Calculations from the previous day
Their science journals or notebooks to write down observations and discoveries
The MiniSim Simulator provided by the National Advanced Driving Simulator
Safety:
Safety guidelines for simulation use from NADS:
101 Science of Driving
Do not use if you have motion sickness
Do not use if you have any medical condition that would make your participation
unsafe for you (heart condition, etc.)
Students’ Ideas:
There are two different aspects that students should know before the day of the
simulation. The first idea is the definition of friction and how friction impacts everyday
life. If students do not know what friction is they will not understand why there is a
difference between pavement conditions. The second idea that students should know is
how to do the mathematical calculation needed to figure out stopping distance. If students
do not know how to use this calculation they will be unable to predict stopping distance
for their given variables. Students will come into this topic with some misconceptions
that need to be addressed and will hopefully be corrected during this lesson. The
misconceptions that students may have are:
Friction is caused by surface roughness (there are many times when this is indeed
true, but others where a surface may not be as rough but still have more friction,
ex: the sticky side of tape is less rough than sandpaper but has more friction)
An object doesn’t stop because of a presence of a force; it stops because of an
absence of a force
Objects at rest have no forces acting on them
Moving objects come to a stop even when there is no friction
Friction only occurs between solids
There are tiny bumps that cause friction (the use of sandpaper)
Friction always hinders motion; reducing friction is always desired
Critical Thinking Questions:
How much stopping distance does each vehicle require to stop safely at different
driving conditions?
Which vehicle will stop in a shorter distance? Why do you think that?
What other factors might affect stopping distance?
Why might your calculations have been off?
How is the simulator different than the real world?
Main Lesson:
Introduction:
Because these students are at a particular age when driving begins to be relevant to their
lives, the simulation assists in their understanding of the concept of friction in a way that
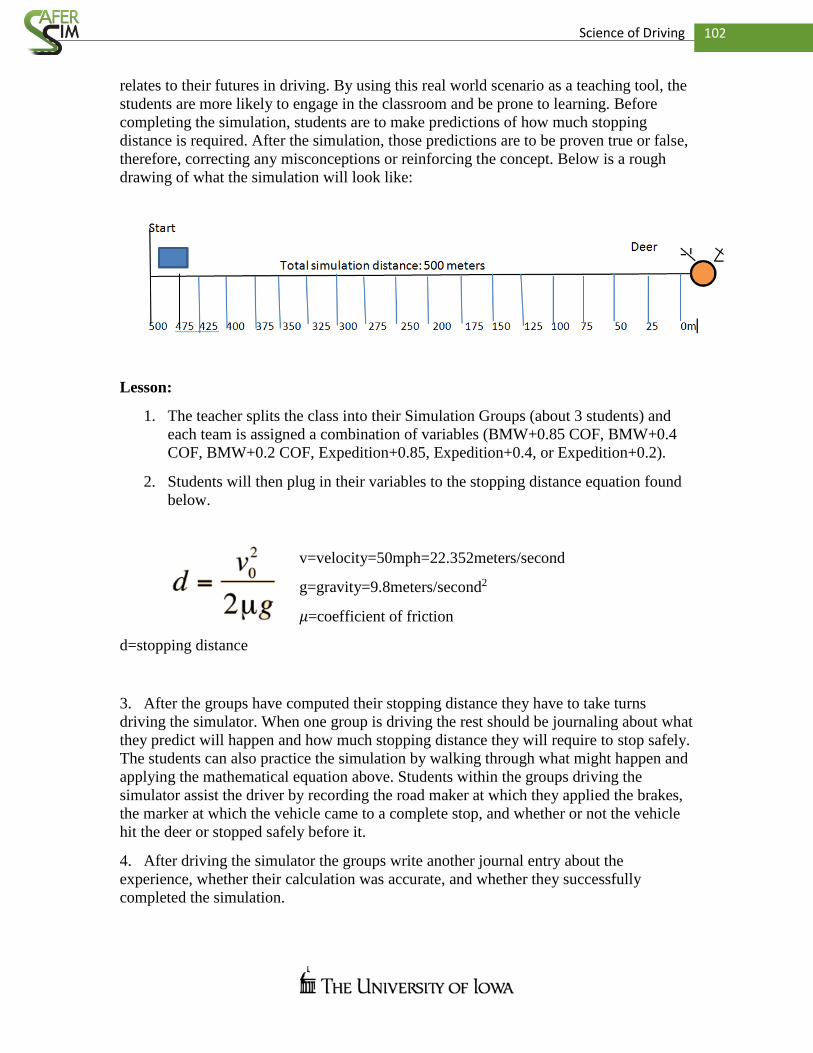
102 Science of Driving
relates to their futures in driving. By using this real world scenario as a teaching tool, the
students are more likely to engage in the classroom and be prone to learning. Before
completing the simulation, students are to make predictions of how much stopping
distance is required. After the simulation, those predictions are to be proven true or false,
therefore, correcting any misconceptions or reinforcing the concept. Below is a rough
drawing of what the simulation will look like:
Lesson:
1. The teacher splits the class into their Simulation Groups (about 3 students) and
each team is assigned a combination of variables (BMW+0.85 COF, BMW+0.4
COF, BMW+0.2 COF, Expedition+0.85, Expedition+0.4, or Expedition+0.2).
2. Students will then plug in their variables to the stopping distance equation found
below.
v=velocity=50mph=22.352meters/second
g=gravity=9.8meters/second2
𝜇=coefficient of friction
d=stopping distance
3. After the groups have computed their stopping distance they have to take turns
driving the simulator. When one group is driving the rest should be journaling about what
they predict will happen and how much stopping distance they will require to stop safely.
The students can also practice the simulation by walking through what might happen and
applying the mathematical equation above. Students within the groups driving the
simulator assist the driver by recording the road maker at which they applied the brakes,
the marker at which the vehicle came to a complete stop, and whether or not the vehicle
hit the deer or stopped safely before it.
4. After driving the simulator the groups write another journal entry about the
experience, whether their calculation was accurate, and whether they successfully
completed the simulation.
103 Science of Driving
5. When all groups have finished the simulation and journaling any remaining class time
is to be used to discuss the results. The following class time will focus on these results
and use official graphs from the simulation to interpret which team did a better job at
stopping under each condition.
6. After completing the simulation students journal about their findings and defend or
reevaluate their predictions from day one. If remaining class time allows, the entire class
can discuss what each group’s results were and whether or not they correlate with the
mathematical calculations.
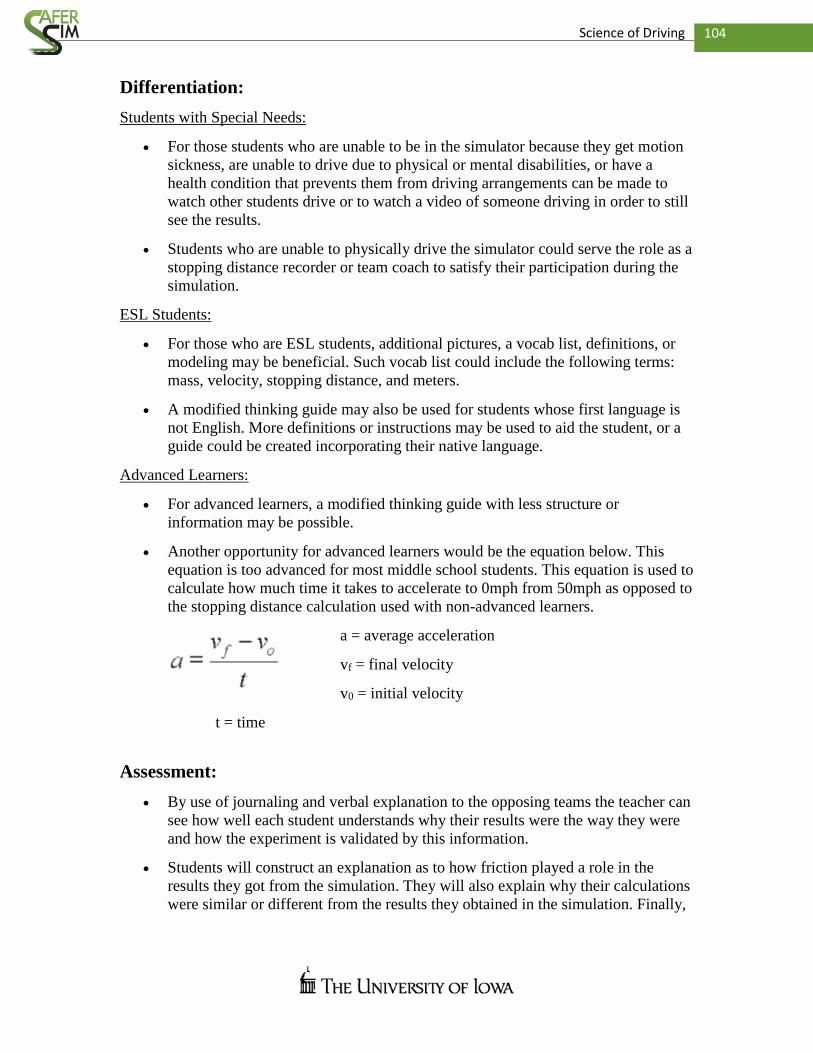
104 Science of Driving
Differentiation:
Students with Special Needs:
For those students who are unable to be in the simulator because they get motion
sickness, are unable to drive due to physical or mental disabilities, or have a
health condition that prevents them from driving arrangements can be made to
watch other students drive or to watch a video of someone driving in order to still
see the results.
Students who are unable to physically drive the simulator could serve the role as a
stopping distance recorder or team coach to satisfy their participation during the
simulation.
ESL Students:
For those who are ESL students, additional pictures, a vocab list, definitions, or
modeling may be beneficial. Such vocab list could include the following terms:
mass, velocity, stopping distance, and meters.
A modified thinking guide may also be used for students whose first language is
not English. More definitions or instructions may be used to aid the student, or a
guide could be created incorporating their native language.
Advanced Learners:
For advanced learners, a modified thinking guide with less structure or
information may be possible.
Another opportunity for advanced learners would be the equation below. This
equation is too advanced for most middle school students. This equation is used to
calculate how much time it takes to accelerate to 0mph from 50mph as opposed to
the stopping distance calculation used with non-advanced learners.
a = average acceleration
vf = final velocity
v0 = initial velocity
t = time
Assessment:
By use of journaling and verbal explanation to the opposing teams the teacher can
see how well each student understands why their results were the way they were
and how the experiment is validated by this information.
Students will construct an explanation as to how friction played a role in the
results they got from the simulation. They will also explain why their calculations
were similar or different from the results they obtained in the simulation. Finally,
105 Science of Driving
students will explain how differing masses and coefficients of friction would
change how much stopping distance is required.
After each group records their results from the simulation students will give a
verbal explanation defending or refuting the results that they received.
Driving With Friction Worksheet
Name: Date:
Materials: Use the following materials to complete the activity stated below.
MiniSim Simulator
Science Journals or Notebooks
Calculations from the previous day
Activity Step by Step: Use the following steps to complete the activity and in
complete sentences answer the questions below.
1. In your groups of three you will be assigned a combination of variables.
YOUR ASSIGNED VARIABLES ARE: _________________________
2. Plug in your variables into the stopping distance equation.
d = stopping distance
v = velocity = 50 mph = 22.352 meters/second
𝜇 = coefficient of friction
g = gravity = 9.8 meters/second2
106 Science of Driving
YOUR REQUIRED STOPPING DISTANCE: ____________________
3. When driving the simulator one student within your groups will be the driver, one
will be the recorder, and the other will be the driving assistant.
YOUR ASSIGNED JOB IS: ___________________________________
o Driver: drive the simulation according to your calculations
o Driving Assistant: help the driver by accurately counting the meter
markers and preparing them to stop safely
o Recorder: record your data found during the simulation.
4. If another group is using the simulator use this time to journal about your
predictions. You can also practice the simulation by walking through what might
happen and applying the equation.
5. After computing your stopping distance required to safely stop while driving the
MiniSim, complete the simulation within your group.
6. After completing the number of trials of the simulation assigned to your group,
record your data and your conclusion in your lab journals and answer the
questions found below in complete sentences.
7. When all groups have finished the simulation and journal entries, discuss with the
class your individual findings and interpretations of the data.
Predictions: Use the space below to answer the questions in complete sentences.
1. Based off of what you know about friction from previous activities completed in
class, predict what you think will happen when your assigned variables are
applied to the simulation.
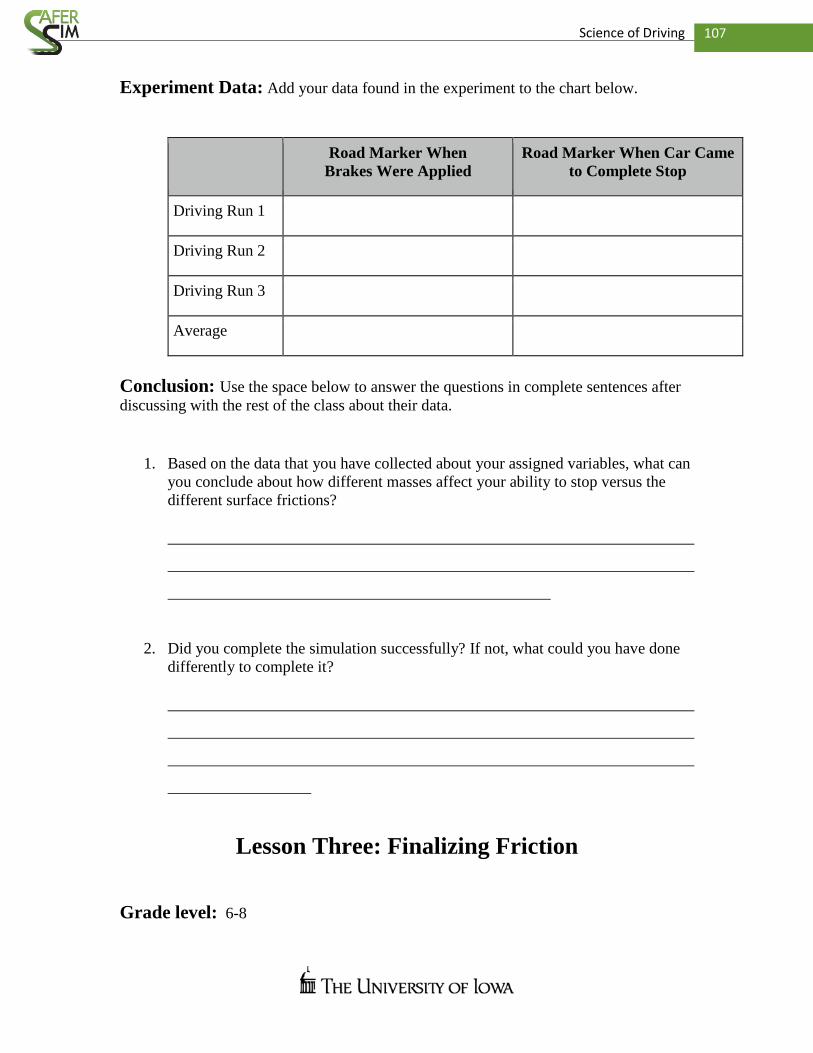
107 Science of Driving
Experiment Data: Add your data found in the experiment to the chart below.
Road Marker When
Brakes Were Applied
Road Marker When Car Came
to Complete Stop
Driving Run 1
Driving Run 2
Driving Run 3
Average
Conclusion: Use the space below to answer the questions in complete sentences after
discussing with the rest of the class about their data.
1. Based on the data that you have collected about your assigned variables, what can
you conclude about how different masses affect your ability to stop versus the
different surface frictions?
2. Did you complete the simulation successfully? If not, what could you have done
differently to complete it?
Lesson Three: Finalizing Friction
Grade level: 6-8
108 Science of Driving
Expected length of Lesson: 45 minutes
Overview:
Students will be given the Finalizing Friction Quiz to assess their understanding of the
concepts that are used in the previous lessons. After the quiz students engage in either an
open or guided discussion of the simulation activity and/or discuss the concepts
themselves, clearing up any misconceptions that still persist. There may also be
opportunity for further journaling.
Standards and Benchmarks:
NGSS:
Performance Expectations:
The motion of an object is determined by the sum of the forces acting on it; if the
total force on the object is not zero, its motion will change. The greater the mass
of the object, the greater the force needed to achieve the same change in motion.
For any given object, a larger force causes a larger change in motion. (MS-PS2-2)
For any pair of interacting objects, the force exerted by the first object on the
second object is equal in strength to the force that the second object exerts on the
first, but in the opposite direction (Newton’s third law). (MS-PS2-1)
Cross-Cutting Concepts:
Cause and effect relationships may be used to predict phenomena in natural or
designed systems. (MS-PS2-3),(MS-PS2-5)
Models can be used to represent systems and their interactions such as inputs
processes and outputs and energy and matter flows within systems. (MS-PS2-
1),(MS-PS2-4)
Explanations of stability and change in natural or designed systems can be
constructed by examining the changes over time and forces at different scales.
(MS-PS2-2)
Science and Engineering Practices:
Construct and present oral and written arguments supported by empirical evidence
and scientific reasoning to support or refute an explanation or a model for a
phenomenon or a solution to a problem. (MS-PS2-4)
Science knowledge is based upon logical and conceptual connections between
evidence and explanations. (MS-PS2-2),(MS-PS2-4)
Iowa Core:
Science:

109 Science of Driving
S.6–8.PS.3: Essential Concept and/or Skill: Understand and apply knowledge of
motions and forces.The motion of an object can be described by its position,
direction of motion, and speed. That motion can be measured and represented on
a graph.
Comprehension and Collaboration:
SL.8.1: Engage effectively in a range of collaborative discussions (one–on–one,
in groups, and teacher–led) with diverse partners on grade 8 topics, texts, and
issues, building on others’ ideas and expressing their own clearly.
SL.8.2: Analyze the purpose of information presented in diverse media and
formats (e.g., visually, quantitatively, orally) and evaluate the motives (e.g.,
social, commercial, political) behind its presentation.
SL.8.3: Delineate a speaker’s argument and specific claims, evaluating the
soundness of the reasoning and relevance and sufficiency of the evidence and
identifying when irrelevant evidence is introduced. Presentation of Knowledge and Ideas:
SL.8.4: Present claims and findings, emphasizing salient points in a focused,
coherent manner with relevant evidence, sound valid reasoning, and well–chosen
details; use appropriate eye contact, adequate volume, and clear pronunciation.
Learning Goals:
Students will have an understanding of motion in how it relates to friction and
mass.
Students will engage in discussion using their newfound understandings of motion
and friction expanding and challenging those ideas when prompted.
Learning Performances:
Students will be given a quiz, discussion prompts, and journaling prompts to show
their understanding of the material.
Materials:
Finalizing Friction Quiz
Discussion prompts (Main Lesson)
Journaling prompts (Main Lesson)
Students’ Ideas:
By engaging in the Friction and Simulation lessons students have a more complete
understanding of how friction and mass affect the motions, and ultimately stopping
distance, of a vehicle. Students use what they know about friction and apply it to other
real world examples. There may be some misconceptions of what friction is because it
110 Science of Driving
can be more abstract than tires on pavement. The purpose of this lesson is to draw out
what misconceptions may be lingering and to correct them.
Critical Thinking Questions:
What could you do next time to improve your results?
How has your understanding of friction changed after the simulation?
What are some other real world examples that apply the ideas of friction and
motion?
Main Lesson:
1. The quiz can be given at the beginning or the end of the lesson, be sure to allow a
minimum of 10 minutes for the students to finish the quiz. The quiz is provided
with this document.
2. The journaling portion of this lesson is optional, but encouraged. There should be
at least three distinct prompts written on the board for the students to choose
from. Encourage them to write as much as possible about one before writing
about another. The students should be given 15 minutes to write. If they do not
have a separate journal for the entire class this could be turned in for a completion
grade, or used just as a prompt for the discussion. Here are some suggested
journal prompts, but feel free to come up with unique ones to suit the classroom.
a. Journal Prompts:
1. What would the world be like if there was no friction?
2. What are some reasons people try to increase (or decrease) friction
as much as possible?
3. What are some unique ways that car makers could make stopping
distance even shorter?
4. How would you teach a class about friction?
3. There are two ways to do the discussion portion of this lesson, teacher led or
student led. It is encouraged to have this discussion at the end so any extra time
from the other activities can be utilized here.
a. Discussion Prompts/Suggestions
1. The teacher led discussion has the teacher asking specific question
and asking students to engage with their own unique experiences
or insight. The overall goal is to get the students to challenge their
understanding of friction and motion. They realize that even
though it is the end of the lesson that these concepts are much
larger than they think. This hopefully sparks intrigue into the
subject matter and promotes further independent learning. Here are
some suggested discussion prompts.
a. If there is any disagreement over the quiz questions now is
a good time to go over any of those.
111 Science of Driving
b. The journal prompts can serve as good discussion topics
since the students have already formed thoughts about
those topics.
c. Ask for any comments or opinions about the unit.
d. Find a short video that uses friction in interesting or
counterintuitive ways. Then have the students talk out what
they think is happening.
2. The student led discussion is only encouraged for classrooms that
are very task oriented and maybe towards the higher end of the
suggested age range. The goal of this discussion method for the
teacher is to create civil disagreement among the students. In this
debate style atmosphere students are forced to refine and articulate
their beliefs to their peers. Many times this leads to realizations
about the topic and further help solidify their understanding of the
topic. Here are some ideas that will help to promote this type of
discussion, remember to allow the last 5 minutes to clear up any
misconceptions that presented during the discussion.
a. If there are any major disagreements over the quiz
questions a good way to start off is to have the students
take a side and discuss/defend their way of thinking.
b. Other more thought provoking questions can also be
instituted here. Such as, “Is a magnet holding a piece of
paper on a refrigerator utilizing friction?” The best way to
go about this method of discussion is to prompt the class,
see where there is any disagreement, and then let the two
sides discuss. Playing the devil’s advocate may be
necessary for this.
Differentiation:
Special Needs Students:
Students may need extended time for the quiz or take the quiz orally with the
teacher or an aid. If they are uncomfortable speaking in a group setting, they
could extend the journaling or have a more private discussion session.
ELS Students:
English language learners could benefit from a word bank or more illustrations to
help them understand the tasks. If there is another student in the class that is fluent
in both languages, have them work together.
Advanced Learners:
Advanced learners could benefit from incorporating more calculations (options
will be provided on the quiz) or more advanced concepts, such as energy
conservation. The student led discussion is also a good option for more advanced
students to engage and challenge one another.
112 Science of Driving
Assessment:
This entire day will serve as an assessment for the previous lessons. The quiz will provide
quantitative assessment while the journaling and discussion will help to show
comprehensive understand of friction and motion concepts.
Assessment: Finalizing Friction Quiz
Name: Date:
Short Answer Instructions: Answer the following questions in complete
sentences.
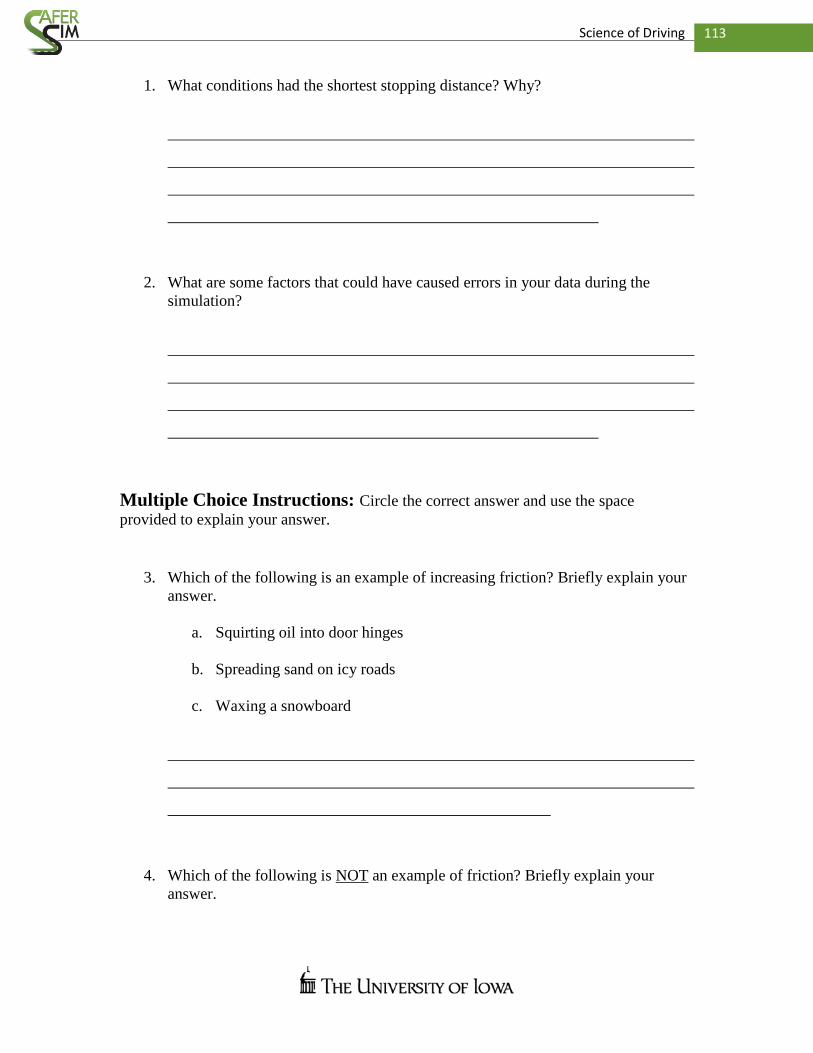
113 Science of Driving
1. What conditions had the shortest stopping distance? Why?
2. What are some factors that could have caused errors in your data during the
simulation?
Multiple Choice Instructions: Circle the correct answer and use the space
provided to explain your answer.
3. Which of the following is an example of increasing friction? Briefly explain your
answer.
a. Squirting oil into door hinges
b. Spreading sand on icy roads
c. Waxing a snowboard
4. Which of the following is NOT an example of friction? Briefly explain your
answer.
114 Science of Driving
a. A baseball traveling through the air
b. A box sitting on a flat table
c. A boat floating across a lake
Further Your Thinking: Use the equation below to answer the questions.
F = m x a
5. A car starts out traveling at 22.4 m/s (about 50 mph) and has a mass of 2722
kilograms. The driver sees a deer in the distance and slams on the brakes causing
a force of 1500 newtons. Using the equation provided, what is the acceleration of
the vehicle?
6. What does this acceleration mean?
115 Science of Driving
Finalizing Friction Quiz Teacher Key
Short Answer Instructions: Answer the following questions in complete sentences.
1. What conditions had the shortest stopping distance? Why?
The BMW with completely dry pavement theoretically has the shortest stopping
distance.
2. What are some factors that could have caused errors in your data during the
simulation?
Reaction time, how hard the brake is being pressed, not traveling in a straight line
should be the most common answers.
116 Science of Driving
Multiple Choice Instructions: Circle the correct answer and use the space
provided to explain your answer.
3. Which of the following is an example of increasing friction? Briefly explain your
answer.
a. Squirting oil into door hinges
b. Spreading sand on icy roads
c. Waxing a snowboard
Answers B should be circled. Explanations may vary. B: Spreading sand on icy
roads. The sand will increase surface friction by creating a courser surface.
4. Which of the following is NOT an example of friction? Briefly explain your
answer.
a. A baseball traveling through the air
b. A box sitting on a flat table
c. A boat floating across a lake
Answer B should be circled. Explanations may vary. B: The only force acting on
the box is gravity and friction requires two objects to be sliding past one another
or trying to.
Further Your Thinking: Use the equation below to answer the questions.
117 Science of Driving
F = m x a
5. A car starts out traveling at 22.4 m/s (about 50 mph) and has a mass of 2722
kilograms. The driver sees a deer in the distance and slams on the brakes causing
a force of 1500 newtons. Using the equation provided, what is the acceleration of
the vehicle?
Answer: 0.55 m/s2
6. What does this acceleration mean?
This means that every second the vehicle will be slowing down by 0.55 meters per
second, until the vehicle comes to a complete stop.
Appendix
List of Contributors:
University of Iowa, College of Education:
Dr. Leslie Flynn
Richard Beckley
118 Science of Driving
Jacob Byers
Eve Doyle
Tayler Foster
Jenna Glaza
Cody Haugen
Sophia Klingenberger
Kate Moon
Mandi Niebes Lueck
Lauren Yuen
National Advanced Driving Simulator:
Dr. Tim Brown
Dr. Chris Schwartz
Dawn Marshall
Alec LaVelle

Appendix B Curriculum Materials for Driver Distraction
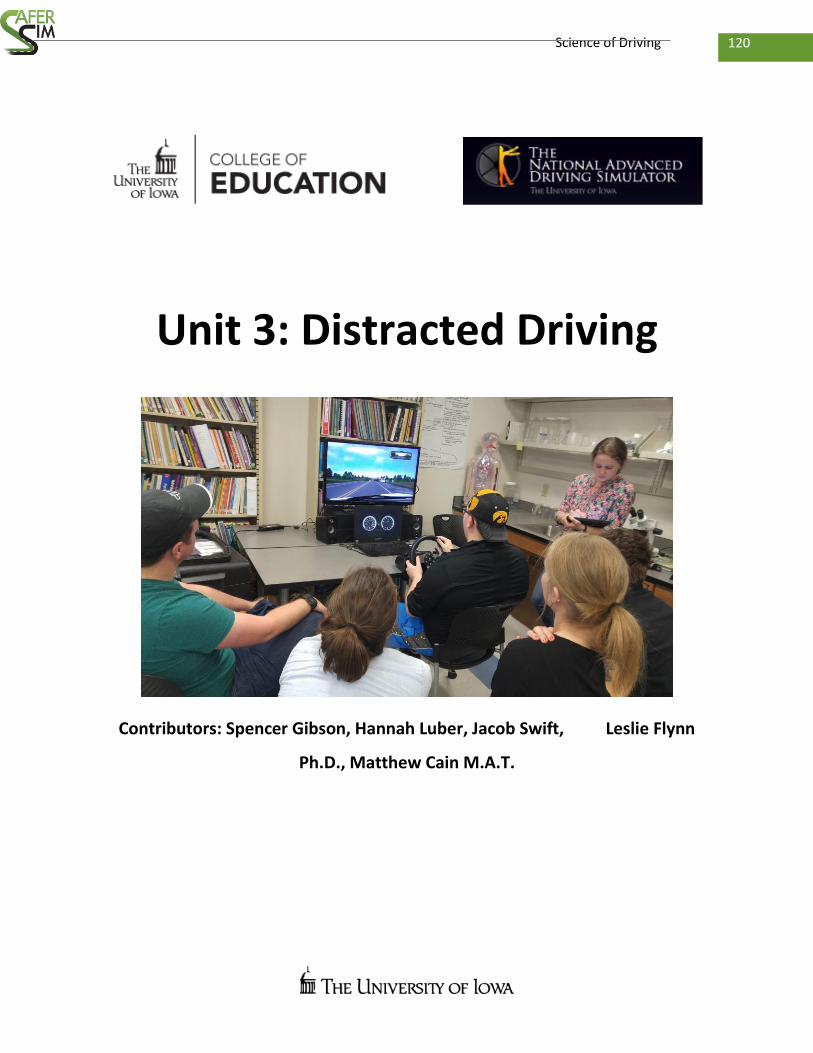
120 Science of Driving
Unit 3: Distracted Driving
Contributors: Spencer Gibson, Hannah Luber, Jacob Swift, Leslie Flynn
Ph.D., Matthew Cain M.A.T.
121 Science of Driving
Introduction
The following lesson plan concerning distracted driving is the third unit of a three unit
curriculum developed in cooperation with the National Advanced Driving Simulator (NADS). The
content of the curriculum is aligned with the Next Generation Science Standards at the middle
school level. All units in the curriculum integrate miniSim technology supplied by NADS. The
following unit (Unit 3: Distracted Driving) is composed of three individual lessons in which
students learn physics concepts and develop data analysis skills while being exposed to the dangers
of distracted driving.
Partners
University of Iowa College of Education
Leslie Flynn, PhD: Lead partner- Curriculum design, Innovator of STEM initiatives
Matthew Cain, M.A.T: Field Consultant, High school physical science teacher and STEM instructor
(West Branch)
Jacob Swift: M.A.T candidate (physics), Partner communication, Curriculum design
Hannah Luber: B.S Science Education (physics), Data analysis, Curriculum design
Spencer Gibson: M.A.T student (physics), Survey, Curriculum design
122 Science of Driving
National Advanced Driving Simulator
Dr. Chris Schwarz: Research scientist, Project consultant on Explore the Science of Driving Project for
SAFER-Sim.
Dr. Tim Brown: Research scientist, Co-Principle investigator for Explore the Science of Driving project
for SAFER-Sim.
Dawn Marshall: Director of the SAFER-Sim University Transportation Center grant, Research Manager
at NADS, Provides overall direction to the project from the center’s perspective.
Alec LaVelle: Research assistant, Simulation creator (coder), Outreach support (miniSim)
Jacob Heiden: Research assistant, Outreach support (miniSim), Administrative Support
Overview
Unit 3: Distracted Driving
Lesson 1: Distracted Viewing
Students are split into two groups and watch a short video, then attempt to
answer follow up questions.
One group watches the video without distractions while the other group
watched the video with distractions.
Lesson 2: Texting While Driving (miniSim driving day)
Drivers receive text while driving MiniSim.
Students compile class data on swerving due to distracted driving.

123 Science of Driving
Data graphed similarly to compare texting and driving to the distracted viewing
activity.
Lesson 3: Egg Crash
Students engineer model cars designed to keep an egg safe during a collision
by increasing impact time.
Lesson One: Distracted Viewing Activity
1. Grade Level: 6-8
2. Science Topic: The effects of distraction on attention.
3. Time Requirement: 40 minutes
4. Objectives: i. Inquiry:
iii. To encourage students to connect distractions to decreased performances.
iv. To introduce students to the National Advanced Driving Simulator.
v. To obtain data that will be compared with data gathered during the second lesson.
j. Content addressed:
iii. Next Generation Science Standards
1. Crosscutting concepts
a. Cause and Effect
b. Patterns
2. Science and Engineering Practices
a. Asking Questions
b. Analyzing and Interpreting Data
c. Engaging in Argument from Evidence
d. Using mathematics
e. Using Models
k. Possible Misconceptions:
iii. Multitasking does not decrease performance.
iv. Distractions only affect some individuals who have not had enough practice with them.
l. Possible Application:
iii. Students will be more informed about the effects of distraction on completion of any
activity.
1. Students may use this information when they are studying for exams in college.
5. Assessment: i. Students may analyze data and/ or visually represent the statistics as homework for this lesson.
6. Materials:

124 Science of Driving
i. Electronic device that can be used to play videos
iii. This device may also be used for data collection/ analysis.
j. Note cards for student responses
k. Optional:
iii. Teacher can choose a relevant video and prepare questions for that video.
1. Can use video to tie in other concepts.
7. Teacher Preparation: i. Teacher must choose a relevant video and compose questions about the video for students to
answer.
iii. Questions should have a range of difficulty, so “distracted” students will be able to
acquire a few answers.
8. Safety/Management issues and special needs adaptations: i. Epileptic students may experience seizures when some movies are played.
j. Subtitles should be used for students with limited hearing abilities.
9. Differentiation: i. Can alter questions for video to require more or less attention to the video.
j. Choose videos with closed captioning for students who have trouble interpreting speech.
k. Teacher can allow less advanced students to record questions before video commences, or give
students copies of questions for video.
10. Lesson Progression: i. Teacher led discussion concerning the National Advanced Driving Simulator (NADS).
iii. This will give students context for when the simulator is brought to the school.
iv. The teacher may ask the following example questions about NADS. The questions are
accompanied by their answers.
1. What is NADS?
a. Answer: NADS is a University of Iowa research facility that houses the
most advanced (highest fidelity) public driving simulator on the earth.
The only other comparable simulator is owned by Toyota. The
research facility was constructed using public funds, but it is currently
operated on public and private research contracts.
2. How much did the large simulator cost in order to build?
a. Answer: The large simulator costs 80 million dollars to build
3. Why would someone build such a simulator?
a. Answer: The simulator is used in a variety of different research projects
that involve driving. The contracts range from testing the effects of
various pharmaceuticals on a person’s ability to drive to testing the
reactions of people to self-driving cars.
4. How much does the electricity cost to run the simulator for one hour?
a. Answer: $1,000- The teacher may compare this cost to the cost of
driving a normal car for one hour.
j. Teacher led discussion about the effects of distraction on attention.
iii. Possible discussion questions
1. Does anyone consider themselves to be good at multi-tasking?
2. Is it harder to do homework while watching television?
3. Can anyone rub their stomach while patting their head?
k. Instructions for distracted watching activity.
iii. Teacher should divide students into teams.
1. One team will be the “distracted” team.
2. The other team will be the “non-distracted” team.
iv. Instructions for the “distracted” team.
125 Science of Driving
1. Students will watch video while trying to maintain a conversation.
2. Teacher may designate a few students on the team to be “distractors.”
v. Instructions for the “non-distracted” team.
1. Students will focus exclusively on the video.
l. Student Prediction
iii. Teacher should ask students which group of students will be able to answer more
questions accurately and solicit explanations.
1. Possible questions:
a. Which group will answer questions accurately?
b. What individual students will be able to answer the most questions
accurately?
c. How many more questions will be answered accurately by the team
who answers the most questions correctly?
m. Exposure to Questions
iii. Teacher may choose to expose students to questions before watching the video.
1. Teacher may also choose to allow recording of the questions.
iv. Teacher should ensure that all students understand questions.
1. Students can be asked to explain questions to less advanced peers.
n. Viewing of Video
iii. Teacher may choose to separate groups while viewing the video.
1. Can send one team out of room, or put teams on opposite ends of room.
2. The “distracted” team should be told once again that they are to carry on a
conversation while viewing the video.
3. Teacher may choose to sit with this group during the video in order to aide in
distracting them by facilitating a discussion.
iv. Teacher may choose to compose their own questions and show a video of their choosing.
Teachers may also use the following suggested video concerning STEM Careers.
1. Suggested Video Title: I Am A Scientist - STEM Education and Life Science
Careers
a. URL:
https://www.youtube.com/watch?v=HtBll53jMcM&feature=youtu.be
v. Teacher may also choose to not allow students to discuss questions or video in order to
gather more data points in the subsequent section.
o. Student Assessment After Video
iii. Students may answer questions about video alone, or as a group.
1. Can have students answer on note cards.
2. Having students answer questions alone allows for more data to be gathered and
subsequently analyzed.
iv. Teacher may use the suggested questions, or questions of their own creation.
1. Suggested Questions for Suggested Video:
a. What's the name of the school that's primarily represented in this
video?
b. What state is represented in the video?
c. Name at least three STEM careers/areas mentioned.
d. What's the name of the video?
e. What was “step one” shown in the video?
v. Teacher should gather student answers, or have students record how many questions they
answered correctly and what group they were in.
p. Data Analysis
iii. Teacher should have students collect data and store it in a table.
1. Example Data Table
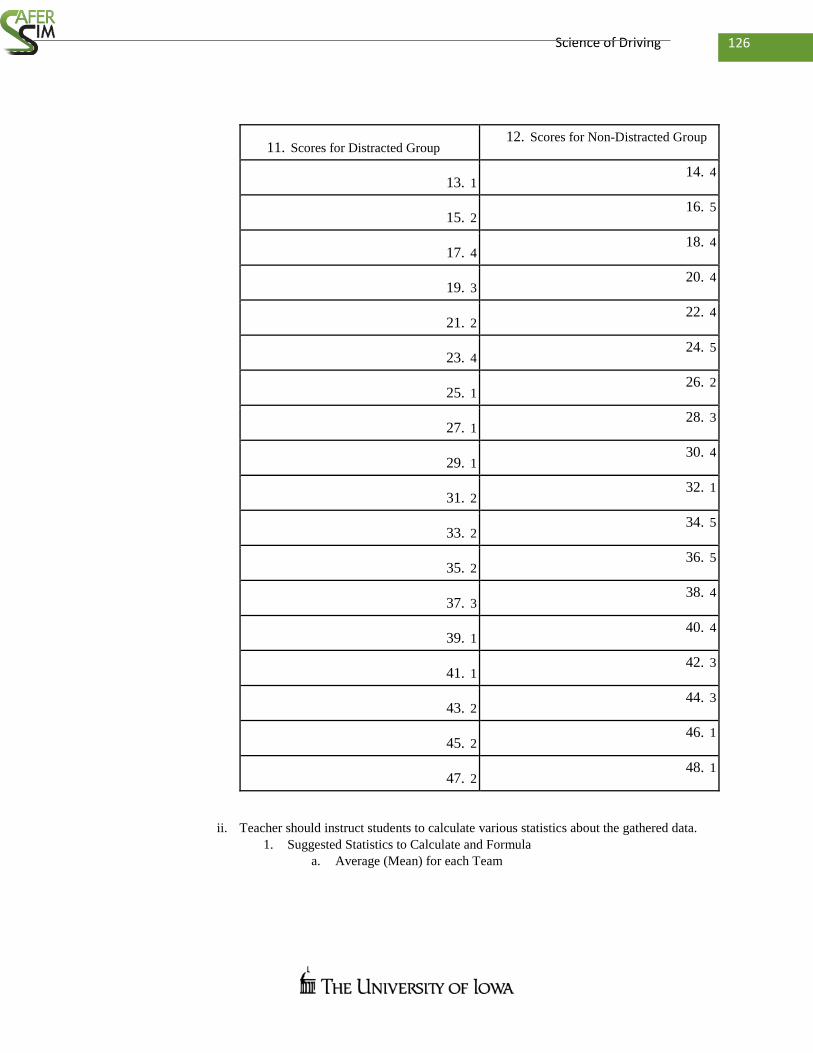
126 Science of Driving
11. Scores for Distracted Group 12. Scores for Non-Distracted Group
13. 1 14. 4
15. 2 16. 5
17. 4 18. 4
19. 3 20. 4
21. 2 22. 4
23. 4 24. 5
25. 1 26. 2
27. 1 28. 3
29. 1 30. 4
31. 2 32. 1
33. 2 34. 5
35. 2 36. 5
37. 3 38. 4
39. 1 40. 4
41. 1 42. 3
43. 2 44. 3
45. 2 46. 1
47. 2 48. 1
ii. Teacher should instruct students to calculate various statistics about the gathered data.
1. Suggested Statistics to Calculate and Formula
a. Average (Mean) for each Team
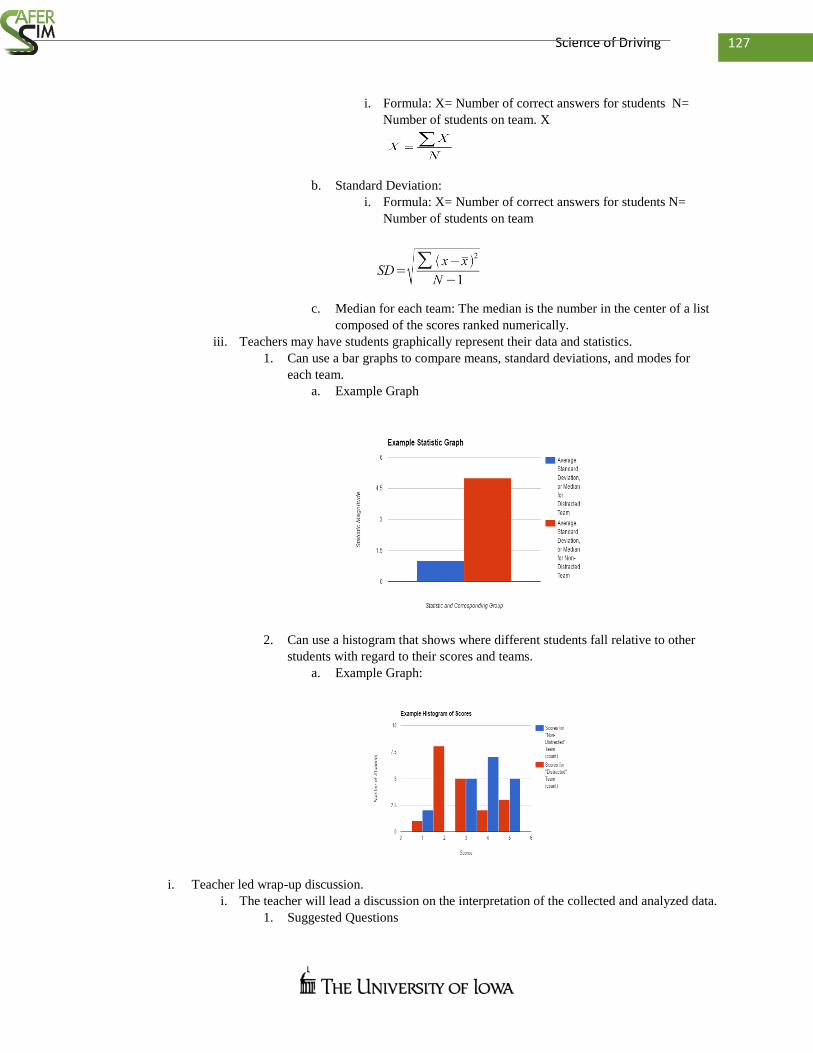
127 Science of Driving
i. Formula: X= Number of correct answers for students N=
Number of students on team. X
b. Standard Deviation:
i. Formula: X= Number of correct answers for students N=
Number of students on team
c. Median for each team: The median is the number in the center of a list
composed of the scores ranked numerically.
iii. Teachers may have students graphically represent their data and statistics.
1. Can use a bar graphs to compare means, standard deviations, and modes for
each team.
a. Example Graph
2. Can use a histogram that shows where different students fall relative to other
students with regard to their scores and teams.
a. Example Graph:
i. Teacher led wrap-up discussion.
i. The teacher will lead a discussion on the interpretation of the collected and analyzed data.
1. Suggested Questions

128 Science of Driving
a. What do the statistics tell us about distraction?
b. Why would distraction impair performance?
i. What organ systems are involved?
c. Where is multitasking common in society?
129 Science of Driving
Lesson Two: Texting While Driving (miniSim driving day)
1. Grade Level: 6-8
2. Science Topic: The effects of distraction on attention.
3. Time Requirement: 80 minutes, two 40 minute class periods
4. Objectives: c. Inquiry:
i. To encourage students to construct an answer to the question, “How dangerous is
distracted driving?”
ii. To promote student understanding of statistics.
iii. To encourage students to consider different factors that affect the level to which texting
and driving is dangerous.
d. Content addressed:
i. Next Generation Science Standards
1. Crosscutting Concepts
a. Patterns
b. Cause and Effect
ii. Science and Engineering Practices
a. Asking Questions
b. Analyzing and Interpreting Data
c. Engaging in Argument from Evidence
d. Using mathematics and computational thinking.
e. Obtaining, evaluating, and communicating information.
f. Constructing Explanations
e. Possible Misconceptions:
i. Texting and other distractions do not have significant effects on attention.
ii. Multi-tasking does not decrease performance on either task.
iii. Texting and driving is only dangerous for people who are slow texters.
f. Possible Application:
i. Students will see how texting affects their driving ability. This may discourage texting
and driving in the students’ futures.
5. Assessment: c. Students may analyze data collected from the miniSim simulator as an assessment for this lesson.
6. Materials: c. MiniSim Simulator (Supplied by NADS)
d. Computer/ device for data analysis.
7. Teacher Preparation: c. Briefly introduce miniSim technology
d. What students will be expected to do
e. How students are expected to behave
f. Setup area in classroom for miniSim
8. Safety/Management issues and special needs adaptations: c. Possible nausea from the simulator.
d. Damage to miniSim if improperly handled
e. Pedals may be controlled by teacher for students with limited leg/foot mobility
9. Differentiation: c. Teachers may provide an electronic form that analyzes the data as it is collected.
i. This form could also graphically represent the data for a student.

130 Science of Driving
d. Teachers may assign more difficult graphic representations to more advanced students, or assign
easier graphic representations to less advanced students.
10. Lesson Progression: c. Discussion of Texting and Driving/ Instructions for Simulator
i. Instructor asks students probing questions about distracted driving.
1. Suggested Questions:
a. How dangerous is texting and driving?
b. Have you ever seen anyone text and drive?
c. Is texting more dangerous than completing other tasks while driving?
ii. Instructor asks students to make prediction about results obtained from the simulator.
1. Will students swerve more when texting? Why?
2. Which students will be able to safely text while driving?
iii. NADS personnel give instructions to students about what to do while driving the
simulator.
d. Simulator Driving
i. Students drive the simulator.
1. Teacher should foster discussion about the different statistics that are produced
by the simulation.
2. Students should discuss the accuracy of the simulation.
a. Is it similar to driving in the real-world?
b. How might results differ if the same exercise was completed with a real
car?
ii. Students should gather data generated by the simulation.
1. Data will be analyzed in the same fashion as the previous activity.
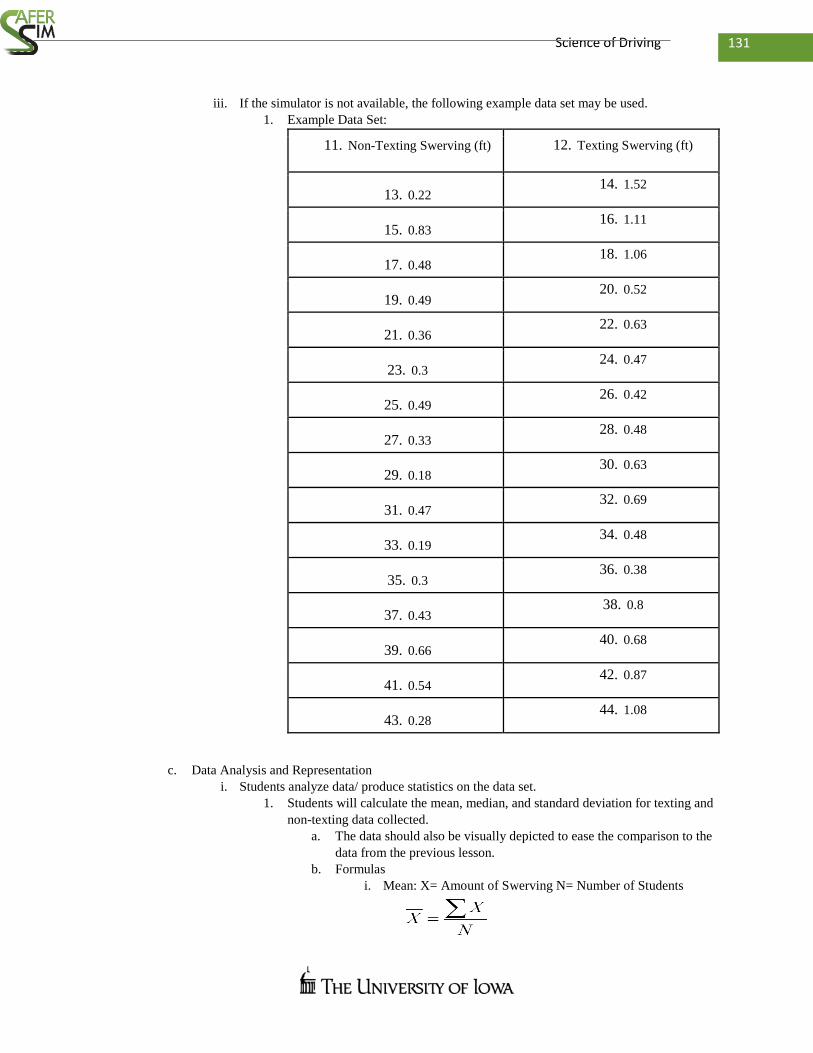
131 Science of Driving
iii. If the simulator is not available, the following example data set may be used.
1. Example Data Set:
11. Non-Texting Swerving (ft) 12. Texting Swerving (ft)
13. 0.22 14. 1.52
15. 0.83 16. 1.11
17. 0.48 18. 1.06
19. 0.49 20. 0.52
21. 0.36 22. 0.63
23. 0.3 24. 0.47
25. 0.49 26. 0.42
27. 0.33 28. 0.48
29. 0.18 30. 0.63
31. 0.47 32. 0.69
33. 0.19 34. 0.48
35. 0.3 36. 0.38
37. 0.43 38. 0.8
39. 0.66 40. 0.68
41. 0.54 42. 0.87
43. 0.28 44. 1.08
c. Data Analysis and Representation
i. Students analyze data/ produce statistics on the data set.
1. Students will calculate the mean, median, and standard deviation for texting and
non-texting data collected.
a. The data should also be visually depicted to ease the comparison to the
data from the previous lesson.
b. Formulas
i. Mean: X= Amount of Swerving N= Number of Students

132 Science of Driving
ii. Standard Deviation: X= Amount of Swerving N= Number of
Students
iii. Median: The median is the number in the center of the data set
when it is arranged by size.
2. Teacher should encourage students to identify any trends that are present.
a. Students will be able to see distraction has negative effects on attention
regardless of the task being completed.
3. Example Statistics and Visual Representations
a. Example Means: Texting: 0.74 ft Non- Texting: 0.41 ft
i. Example Graphic Representation:
b. Example Standard Deviations: Texting: 0.32 ft Non-Texting: 0.18 ft
i. Example Graphic Representation:
c. Example Medians: Texting: 0.655 ft Non- Texting: 0.395 ft
i. Example Graphic Representation:
d. Discussion of Analyzed Data
i. Class discussion about the implications of the data gathered and analyzed.
1. Guiding Questions:
133 Science of Driving
a. Can students identify any patterns?
b. Would students ban texting and driving based on the data collected?
c. How dangerous is texting and driving?
d. Would students ride in a car driven by any of their texting classmates
based on individual results?
e. Reflective Discussion
i. Reflection on Process
1. The teacher may lead a discussion about the following questions.
a. Are there any problems with the gathered data?
b. Is there strong enough evidence to warrant legislation on distracted
driving?
c. Is it personally dangerous for me to text and drive?
2. Students may also answer the aforementioned questions in essay form as
homework for this activity.

134 Science of Driving
Lesson Three: Egg Crash
1. Grade Level: 5th-9th
2. Science Topic: Newton’s First Law
3. Time Requirement: 120 minutes, three 40 minute class periods
4. Objectives: a. Inquiry:
i. Students will be able to comprehend and apply fundamental concepts in physics and
engineering including crashworthiness, resilience, mass, and momentum by designing,
building, and testing crash test cars.
ii. Students will be able to direct their own learning by implementing the process of
experiential education, which will promote the development of investigative problem
solving, outside-of-the-box solutions, group decision making, and teamwork skills
b. Content addressed:
i. Next Generation Science Standard
1. Performance Expectations:
a. MS-PS2-1. Apply Newton’s Third Law to design a solution to a
problem involving the motion of two colliding objects
b. MS-PS2-2.Plan an investigation to provide evidence that the change in
an object’s motion depends on the sum of the forces on the object and
the mass of the object.
2. Disciplinary Core Idea
a. PS2.A Force and Motion
i. The motion of an object is determined by the sum of the forces
acting on it; if the total force on the object is not zero, its
motion will change. The greater the mass of the object, the
greater the force needed to achieve the same change in
motion. For any given object, a larger force causes a larger
change in motion.
ii. All positions of objects and the directions of forces and
motions must be described in an arbitrarily chosen reference
frame and arbitrarily chosen units of size. In order to share
information with other people, these choices must also be
shared.
3. Crosscutting Concepts
a. Data collection
b. Stability and Change
c. Cause and Effect
c. Possible Misconceptions:
i. Students may regard objects at rest as being a natural state in which no forces are acting
on the object.
ii. Students may believe moving objects come to a stop when there is no friction.
d. Possible Applications:
i. Students understand how to reduce damage from any impact.
ii. Students better understand safety features of vehicles
5. Assessment: a. Students will present their cars and design features, and demonstrate their cars’ efficacy.
i. Guiding Questions/ Suggested Instructions
1. What features keep the egg safe?
2. Will your car keep the egg safe for more than one crash?
135 Science of Driving
3. Describe the effects of the design features in terms of forces and motion.
6. Materials: (for each student/lab group 4) a. 4-8 Wheels
b. 4-8 Skewers with 1/8" diameter
c. 4-8 Milkshake straws
d. 4-8 Craft Sticks
e. 4-8 Wood cubes
f. 4-8 Rubber bands
g. 2 Small sample cups
h. 1 Hot glue
i. 1 piece of cardboard to protect work surface
j. 2-3 Plastic eggs
k. 2-3 Hard boiled eggs
l. 1 Downhill ramp (must be controlled across groups)
7. Safety/Management issues and special needs adaptations: a. Car bases can be prepared in advance of activity for students who require extra time for activity
b. Skin abrasions from mishandling materials.
8. Differentiation: a. Consider having TAG students create a table figuring out the Force of the crash by finding the
acceleration and the mass.
b. More advanced students can build a car intended to withstand multiple crashes.
c. For students who have LD consider having the base of the car made and simulating the activity
and data.
9. Lesson Progression: a. Day One
i. Discussion of what makes cars safe.
1. Suggested Questions
a. Why do cars have airbags?
b. Has anyone been in a car accident?
c. How fast must a car be going in order for a collision to be fatal?
d. What features of cars keep drivers and passengers safe?
ii. Introduce activity
1. Building a car which will keep egg from cracking upon collision
2. Specify ramp dimensions with which cars will be tested
iii. Discuss mobility requirements of car
1. Must roll down ramp unassisted
2. Must remain composed as it rolls
iv. Split students into groups of four.
1. Each group will eventually produce one car
v. Groups plan the design of their car.
1. Brainstorm ideas
2. Prototype with materials in class (dependent on availability)
3. Sketch multiple designs
vi. Each group turns in one sketch for their design.
1. Teach now has estimate of materials to provide for Day One
b. Day Two
i. Teacher introduces available materials.
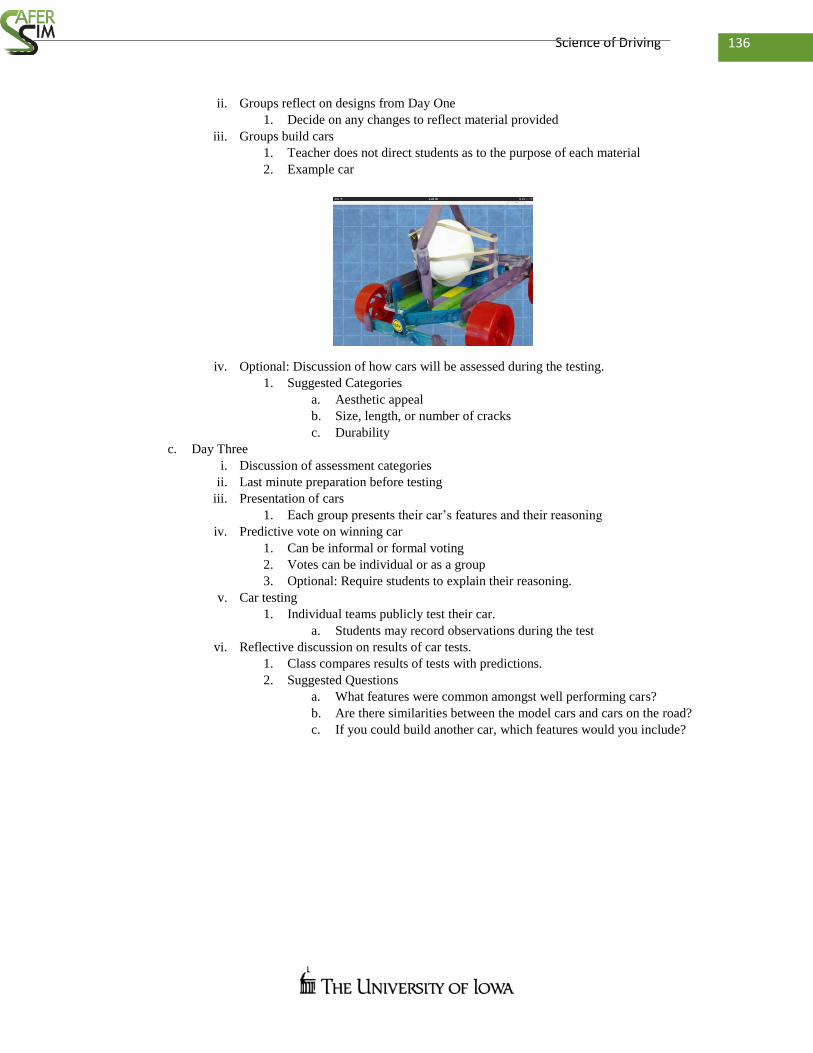
136 Science of Driving
ii. Groups reflect on designs from Day One
1. Decide on any changes to reflect material provided
iii. Groups build cars
1. Teacher does not direct students as to the purpose of each material
2. Example car
iv. Optional: Discussion of how cars will be assessed during the testing.
1. Suggested Categories
a. Aesthetic appeal
b. Size, length, or number of cracks
c. Durability
c. Day Three
i. Discussion of assessment categories
ii. Last minute preparation before testing
iii. Presentation of cars
1. Each group presents their car’s features and their reasoning
iv. Predictive vote on winning car
1. Can be informal or formal voting
2. Votes can be individual or as a group
3. Optional: Require students to explain their reasoning.
v. Car testing
1. Individual teams publicly test their car.
a. Students may record observations during the test
vi. Reflective discussion on results of car tests.
1. Class compares results of tests with predictions.
2. Suggested Questions
a. What features were common amongst well performing cars?
b. Are there similarities between the model cars and cars on the road?
c. If you could build another car, which features would you include?