scottish industry science partnership (sisp) - · pdf filescottish industry science...
TRANSCRIPT

Scottish Industry Science Partnership (SISP)
Project:
Technical Measures to Enhance Selectivity in Pelagic Fisheries
Final Report – March 2008.
Technical Report
Report on Sea Trials
Project Partners:
NAFC Marine Centre Seafish Swan Net-Gundry Ltd Antares Fishing (Whalsay) Company Ltd. Zephyr Fishing Co. Ltd Charisma Fishing Company Ltd Research Fishing Co. Ltd

2
Contents
1. Project Overview ....................................................................................... 3
Project design ............................................................................................... 3
Factors affecting the project design .............................................................. 3
2. General Summary of Results .................................................................... 4
3. Technical Report ....................................................................................... 6
4. Sea Trials ................................................................................................ 10
General summary of October 2007 season. ............................................... 10
Summary of trips undertaken by pair trawlers ......................................... 11
Summary of trips undertaken by single trawlers ..................................... 11
Comparison of Pair Trawlers ...................................................................... 12
Average size and weight of mackerel ..................................................... 12
Length and weight distributions of mackerel ........................................... 12
Discards .................................................................................................. 12
Coverbag samples .................................................................................. 13
Smoother analysis .................................................................................. 19
Comparison of Single Trawlers .................................................................. 21
Data collected from hauls on MFV Charisma .......................................... 21
Data collected from hauls on MFV Research.......................................... 21
Herring bycatch ....................................................................................... 22
Smoother analysis .................................................................................. 28
Underwater Video Footage ........................................................................ 29
Video recording system .......................................................................... 29
Video Analysis ........................................................................................ 30
Patterns in fish density passing under the grid .................................... 31
Herring Scales ..................................................................................... 32
Fish escapes and masking .................................................................. 34
Observed escapes through the grid ................................................. 35
Observations from 15 x 5 port & starboard observation areas ......... 35
Escapes out with field of view .......................................................... 37
Fish behaviour ................................................................................. 38
Other species .................................................................................. 39
5. Discussion .............................................................................................. 40
6. References ............................................................................................. 42

3
1. Project Overview At present ICES considers that mackerel are harvested unsustainably (Anon., 2007) and in recent years pelagic fishers have seen available quotas reduce for both North Sea mackerel (Scomber scombrus) and herring (Clupea harengus). A combination of the concerns over pelagic stocks, more restrictive quotas and the restrictions on bycatch levels, have brought the desire for technical measures to increase selectivity into focus.
During the autumn 2006 mackerel season a prototype selectivity grid was trialled on the Zephyr LK394 and the crew reported that both the average size of mackerel increased and the bycatch percentages of herring were reduced when compared to catches by its pair trawler the Antares LK419.
Following these initial observations the fishers that were involved recognised the need for independent observation and analysis of results. This led to the current project being proposed and subsequently receiving funding through the Scottish Industry Science Partnership fund (SISP). The project was undertaken during the autumn 2007 mackerel season with the pair trawlers Zephyr LK394 and Antares LK419 and the single trawlers Research LK62 and Charisma LK362 being involved. Grids were designed and manufactured by Swan Net-Gundry Ltd. NAFC Marine Centre and Seafish provided the scientific input and FRS undertook some of the data analysis.
As this project represents a partnership between fishermen and scientists this report has been written with the readership of both in mind. It was the intention to produce a report that, while containing the necessary scientific detail in terms of statistical analysis, was in a format that could be generally understood by a reader without a scientific background. As a result the structure of the report deviates somewhat from the standard scientific format.
Project design It was planned that the selectivity grid to be developed and manufactured by Swan Net-Gundry would first be trialled on the single trawler Research, with the catches of the single trawler Charisma being sampled for comparative purposes. The grid was then to be transferred to the pair trawler Zephyr later in the season with the catches of pair vessel Antares sampled for comparative purposes. Under this project design, catches of each vessel trialling the grid could be sampled both with and without the grid.
Factors affecting the project design Prior to the project starting an additional, identical grid was purchased and fitted into the net of the Research. This resulted in both ‘trial’ vessels each using a grid over the whole season.
Licences for the fishery were issued as normal from the 1st October 2007. Due to the capacities of available pelagic fish processing facilities, it is normal that some of the vessels start fishing when the season opens with others delaying their start dates. This both extends the duration of the season and helps to
4
reduce queuing and waiting times to unload catches. On 1st October 2007 the Norwegian pelagic fleet reportedly had more than 100 000 t of their quota remaining. At that time and under those circumstances the skippers of the vessels in the Shetland fleet viewed it as beneficial, in terms of both the availability of alternative processing plant and potential prices, to delay the start of their fishing season. The initial voluntary delay in the start of the season until the 5th October resulted in the desired staggering of the start dates being almost absent in 2007.
2. General Summary of Results It is considered that the size of mackerel encountered during the October 2007 season, together with the low bycatch levels that characterised the season, have resulted in the full potential of the selectivity grids not being realised. A further development within the fleet was the widespread adoption of sampling identified shoals of mackerel for size using handline or automated jigging machines, prior to a decision being made on whether or not to shoot and target that shoal. This resulted in the avoidance of shoals that were, based on sampling, expected to result in a catch of mackerel with a smaller than desirable average weight (grams). However, it would have been these shoals where the effectiveness of the grid could have been best determined.
Mackerel shoals were found to be plentiful and so quotas were caught in a short space of time and in relatively few hauls and trips. The short duration of the season limited the amount of data that could be collected and the occurrence of foul hauls and gear damage further limited the amount of data available for analysis.
It has been confirmed, from both underwater video footage and from obtaining samples in coverbags over the grids that both herring and mackerel were escaping through the grids. However an analysis of the available data suggests that the numbers of fish escaping were insufficient to significantly affect the retained catches of the vessel using the grid compared to the catches of the pair vessel. A smoother analysis indicated that the grids did not have any statistically significant effect on catch rates at any weight between the pair trawlers; however the low number of paired hauls meant that the comparison had little statistical power. Catches generally had very low bycatch levels during the season and no statistically significant difference in discard rates was found between the two pair vessels.
During the trip where video footage was obtained, only one of the hauls occurred during daylight hours and hence escapes through the grid on the bottom panel are yet to be verified. Shoaling behaviour was observed almost immediately in mackerel that escaped through the grid. Escaping mackerel can also be described as showing strong swimming behaviour after they escaped. Mackerel sampled from the coverbags were significantly smaller than those retained in the codend.
It is concluded that although small mackerel and herring can and do escape through the grids, the data that was available from the October 2007 season did not show that there was a statistically significant difference in average

5
sizes and weights in catches retained in the codends of vessels using the grid compared to control vessels. It is therefore not possible at this stage to assess the cost effectiveness of the grids. It is recommended that catches should be monitored over a longer period of time, and in both the autumn and spring seasons, before the true effectiveness of the grids can be fully ascertained.

6
3. Technical Report
The selection grids that were designed and trialled during the autumn 2007 mackerel season were a development from a prototype used in 2006. The grids were supplied in a complete section which was fitted between the bottom of the trawl and above the brailer (Fig. 1). The grid section consisted of standard side panels, an angled grid in the bottom panel and an angled grid in the top panel. The section was constructed such that the grids were at approximately 14° from horizontal when the trawl wa s shot and settled. The angle of each grid would decrease as fish built in the codend and at around 400 t the angle would have decreased to approximately 8° from horizontal.
Each grid was covered by an open panel. The original design had the grids tapering along their length, from a wide fore end, but this was modified by the manufacturer prior to the 2007 trials so that on each grid the fore end was squared off. There was still a taper on the section of netting which extended from the grid at the end nearest the cod-end. The original grid design is shown in Fig. 1 and a model of the grid section in Fig. 2.
The lower grid was 6.6 m long and 4.44 m wide with a netting section extending for 3.6 m and tapering to a width of 3.9 m. The upper grid was 7.9 m long and 3.1 m wide, with a netting section extending for 4.3 m and tapering to a width of 2.5 m.
The grid consisted of vertical bars made from nylon piping (diam. 20 mm), which were threaded onto polysteel rope. Nylon piping was used as it is less brittle in cold water than the material used in the prototype grid in 2006. The bars were spaced with openings 40 mm wide (60 mm centres apart). Bars were 300 mm long. The horizontals of the grid were constructed with 12 mm Dynex (Fig. 3). An “open” panel above the grid was constructed with 12 mm Nylex twine.
The design of this grid system, where the bars are threaded onto twine, is an approach aimed towards making the grid system as physically flexible as possible. In 2006 there had been an issue with some of the materials used. It was reported that the material used to construct the bars became brittle after being submerged in cold water during fishing and this resulted in bar breakages when the grid was wound back onto the net drum. The nylon piping that was used for the bars of the grid designed for these trials appeared to eliminate this problem. Neither of the crews reported problems with bars being brittle or breaking when the grids were wound back onto the net drums (Fig. 4).

7
Swan Net-Gundry LTD
Fig. 1 Diagram of original design of the section wi th upper and lower grids. NB the taper was removed from both grids making the bottom grid 4440 mm wide and 6600 mm long and the top grid 3100 mm wide and 7900 mm l ong.
Netting
Netting

8
Fig. 2 Model of grid section (Photo: Swan Net-Gundr y Ltd).
Fig. 3 Grid construction showing nylon vertical bar s and horizontal polysteel ropes (Photo: Swan Net-Gundry Ltd).

9
Fig. 4 Grid section over the net-drum during shooti ng, illustrating flexibility. Open meshes constructed with 12 mm Nylex twine (red).

10
4. Sea Trials
General summary of October 2007 season. The general impression of the fishers involved in this project was that the mackerel appeared to be abundant, more so than observed in recent autumn seasons. Skippers commented that they had observed some changes in the patterns of distribution over the last few years.
When fishing started, from around the 7th October, large shoals were identified close to the north and north-east of Shetland, and further shoals were identified around 100 miles east of Shetland. As the season progressed fishing activity generally moved between these areas. The statistical rectangles where fishing activity was recorded are shown in Fig. 5
The general perception was that mackerel were of a good average size and that shoals were ‘clean’, resulting in particularly low bycatches. The fishers suggested that the size of mackerel that was present would result in only a very low proportion of fish in the catches being of a size that could escape through the selectivity grids.
A further development within the Shetland fleet during 2007 was the use of hand-lining or automated jigging to sample a shoal for fish size before deciding whether or not to shoot on it. From observing this practice, occasions were recorded when shoals were identified and sampled by hook and line, but due to the size of mackerel in the samples the shoal was not targeted and the vessel was moved to another location where searching continued. It was observed that sample weights taken by hook and line gave a good indication of the average weight of a shoal that was subsequently fished. This practice also had the effect that shoals containing smaller fish, where the effects of the grid may have been more significant, were not targeted.

11
-4°E -2°E 0°E 2°E 4°E58°N
59°N
60°N
61°N
62°N
63°N
50
48
46
52
E6 E8 F0 F2 F4
Fig. 5 Shaded areas represent statistical rectangle s where fishing activity was recorded.
Summary of trips undertaken by pair trawlers
During the 2007 season, the pair trawlers Zephyr LK394 and Antares LK419 left port on the 7th October and caught their available quota in only five trips, during which only fourteen hauls were undertaken (seven hauls by each vessel). As a result of a number of hauls where gear was fouled which then led to incomplete pairs of hauls there were only four pairs of comparative hauls. Due to a foul haul resulting in net damage no comparative analysis is available from the first trip. Comparative hauls were obtained from trips 2-5. On trips four and five only weight data were recorded from samples on the Zephyr so comparative analysis is further restricted. The pair trawlers made their last catches on the 27th October.
Summary of trips undertaken by single trawlers
The quota of the vessel fitted with the grid (Research LK62) was caught between the 7th and 23rd October in five landings. Observer data was collected during three of the trips (five hauls) between the 16th and 23rd October. Cover-bags were put over sections of the upper and lower grids. The bags each covered 12 x 3 openings, 0.72 m2. No fish were caught in the cover on the lower grid.

12
The comparative vessel (Charisma LK362) caught their quota between the 5th and 14th October in only four trips. Observer coverage was over one trip from the 13th – 14th October.
Comparison of Pair Trawlers
Average size and weight of mackerel
Average size of mackerel, by length and weight, in paired comparative hauls that were sampled ranged from 35.5 – 36.4 cm and 430.6 – 486.6 g on the Zephyr and 34.9 – 36.2 cm and 445.1 – 499.6 g on the Antares. Average lengths and weights of mackerel in comparative hauls are detailed in Table 1. Length data were available for two paired haul comparisons and in both, the average length of mackerel sampled from the catch of the Zephyr was significantly greater than that using the control net of the Antares (ANOVA, P < 0.05).
Weight data was available for four paired haul comparisons. Samples indicated that average weights were significantly different in three of the four paired haul comparisons; with average weights being significantly heavier in two of the paired hauls sampled from the Zephyr and in one of the paired hauls sampled from the Antares.
Length and weight distributions of mackerel
Although the average lengths were significantly different in both paired haul comparisons, the length frequency distributions in the samples were only significantly different in the first of the two paired haul comparisons (Table 1).
The weight frequency distributions (Table 1) were only significantly different in two of the four paired haul comparisons (those from trips four and five).
Length and weight distributions of comparative hauls are shown in Fig. 6 and Fig. 7.
The proportions by weight in each size grade were determined from the samples taken and are shown in Table 2. The proportion in the smaller size grade of the catches by the Zephyr was lower in only two of the four comparative hauls that were sampled.
Discards
During the observer trips it was noted that discard percentages were low and samples obtained from some of the hauls contained no discards making meaningful analysis and comparison impossible. Therefore the discard percentages for each landing were obtained and are compared. Discard percentages ranged between 0.08 and 0.70% in the landings from the Zephyr and between 0.42 and 0.74% in the landings from the Antares. Two of the five landings from the Antares contained some fish that had been caught using the net of the Zephyr. From the remaining three landings an analysis of deviance

13
from generalised linear model assuming over dispersed binomial errors indicated that there was no statistically significant difference in discard percentages between the two vessels (F = 0.27, df = 1,2 , P = 0.66).
Coverbag samples
The requirement for coverbags had been discussed with the manufacturer but after delivery it was discovered that coverbags had not been provided. A coverbag covering 7 x 2 grid spacings was constructed by the crew of the Zephyr and attached to the upper grid. However, mackerel were only present in the coverbag in the first of the seven hauls. Lengths and weights are compared in Table 1 and Table 3 respectively where it is shown that mackerel sampled from the coverbag were significantly smaller than those retained in the codend. The mackerel retained in the coverbag ranged from 29 to 39 cm and from 214 to 585 g indicating that relatively large mackerel were escaping through the grid. It should be noted that the selectivity of the codend is unknown so theoretically some fish that escaped through the grid could have escaped through the codend had they reached it.
The coverbag was attached towards the outer end of the upper grid. After the first trip (two hauls, in which fish were in the coverbag on only the first haul) the cover was moved and attached at the middle of the grid as it was believed that this would result in samples being obtained from it, however no fish were retained in it on subsequent hauls. It was concluded that fish may have been avoiding the part of the grid with the coverbag due to the white mesh that it was constructed from. A much larger coverbag constructed from a darker material may have resulted in more samples being obtained. Length and weight distributions of mackerel in the codend and cover over the grid are shown in Fig. 8.

14
Table 1 ANOVA tests for differences in mean length (cm) and mean weight (g) and Kolmogornov-Smirnov te sts for differences in length and weight distributions of mackerel in comparative shots from the Zephyr and Antares.
Zephyr Antares ANOVA KS test Mean Length
(cm) N S.D. Mean Length
(cm) N S.D. Difference
(cm) Analysis P-value KS P-value
T2 36.4 204 2.54 35.5 329 2.31 0.9 F(1, 634) = 22.49 <0.001 2.154 <0.001 T3 35.5 182 2.40 35.0 200 2.56 0.5 F(1, 380) = 5.26 0.022 0.939 0.342
Mean Weight
(g) N S.D. Mean Weight
(g) N S.D. Difference
(g) Analysis P-value KS P-value
T2 486.6 307 105.88 478.19 329 107.68 8.41 F(1, 634) = 0.997 0.32 0.744 0.638 T3 480.1 182 102.55 458.45 200 100.57 21.65 F(1, 380) = 4.34 0.038 0.906 0.384 T4 467.0 542 110.26 445.09 759 111.46 21.91 F(1, 1505) = 9.24 0.002 1.527 0.019 T5 430.6 555 105.26 469.48 200 109.54 -38.86 F(1, 753) = 19.61 <0.001 1.907 0.001

15
Fig. 6 Length distributions from codend samples fro m comparative hauls during trips 2 and 3 (Distributions from Antares shown in blue, Zephyr in red).

16
0 200 400 600 800 1000Weight (g)
0
4
8
12
16
20F
requ
ency
T2A1
0 200 400 600 800 1000Weight (g)
0
4
8
12
Fre
quen
cy
T3A1
0 200 400 600 800 1000Weight (g)
0
4
8
12
16
20
Fre
quen
cy
T2Z1
0 200 400 600 800 1000Weight (g)
0
4
8
12
Fre
quen
cy
T3Z1
0 200 400 600 800 1000Weight (g)
0
10
20
30
40
Fre
quen
cy
T4A2
0 200 400 600 800 1000Weight (g)
0
4
8
12
16
Fre
quen
cy
T5A1
0 200 400 600 800 1000Weight (g)
0
10
20
30
40
Fre
quen
cy
T4Z2
0 200 400 600 800 1000Weight (g)
0
10
20
30
40
Fre
quen
cy
T5Z1
Fig. 7 Weight distributions from codend samples fro m comparative hauls during trips 2 – 5 (Distributions from Antares shown in blue, Zephyr in red).

17
Table 2 Percentage in each size grade in each compa rative haul estimated from catch samples. Trip Zephyr Antares Difference G4- G4-6 G6+ G4- G4-6 G6+ G4- G4-6 G6+ T2 19.5 68.1 12.4 23.4 66.3 10.3 -3.9 1.8 2.1 T3 19.8 70.9 9.3 27.5 67.5 5.0 -7.7 3.4 4.3 T4 39.2 56.7 4.1 34.5 59.2 6.3 4.7 -2.5 -2.2 T5 37.7 57.7 4.7 25.5 65.5 9.0 12.2 -7.8 -4.3
Table 3 ANOVA tests for differences in mean length (cm) and mean weight (g) and Kolmogornov-Smirnov te sts for differences in length and weight distributions of mackerel in the codend and cover o ver the grid on the Zephyr. Haul Codend Cover over grid ANOVA KS test
Mean Length (cm)
N S.D. Mean Length (cm)
N S.D. Difference (cm)
Analysis P-value KS P-value
T2Z1 36.4 307 2.54 34.2 20 2.20 2.2 F(1, 325) = 12.78 0.004 1.627 0.010 Mean Weight
(g) N S.D. Mean Weight
(g) N S.D. Difference
(g) Analysis P-value KS P-value
T2Z1 486.6 307 105.88 396.0 20 88.20 90.6 F(1, 325) = 14.01 0.0002 1.994 0.001

18
Fig. 8 Length and weight distributions of mackerel sampled from the codend and the cover over the grid during Trip 2.

19
Smoother analysis
Length and weight based comparisons of the catches of the Zephyr and the Antares were made using the smoother-based techniques described by Fryer et al. (2003). The relative catch rate of the two cod-ends in each paired haul was modelled as a smooth non-parametric function of length or weight. The relative catch rates were then combined over paired hauls to estimate the mean relative catch rate. The latter analysis could only be done on a weight basis, as there were only two paired hauls with length measurements.
The fits of the smoothers to the individual haul data are shown in Fig. 9. The mean catch rate of the Zephyr relative to the Antares is shown in Fig. 10. The grid had no statistically significant effect on catch rates at any weight. However, this is not surprising since, with only four paired hauls, the comparison had little statistical power.
0.0
0.5
1.0
30 35 40 45
2
30 35 40 45
3
length (cm)
prop
ortio
n in
Zep
hyr
0.0
0.5
1.0
250 500 750 1000
2
250 500 750 1000
3
250 500 750 1000
4
250 500 750 1000
5
weight (g)
prop
ortio
n in
Zep
hyr
Fig. 9 The proportion of mackerel retained in the Zephyr relative to those retained by both the Zephyr and the Antares (filled circles), with fitted smoothers (solid lin es) and pointwise 95% confidence bands (grey shaded areas), for each paired haul. (There was one paired haul per trip, so the panel gives the tr ip number.) The dotted horizontal line corresponds to a relative catch rate of unity.

20
0.0
0.5
1.0
1.5
2.0
2.5
200 300 400 500 600 700
weight (g)
rela
tive
catc
h ra
te
Fig. 10 The mean catch rate of the Zephyr relative to the Antares (solid line) with pointwise 95% confidence bands. The confidence band s include the dotted horizontal line of unity, so the grid had no statistically sig nificant effect on catch rates.

21
Comparison of Single Trawlers
Data collected from hauls on MFV Charisma
The commercial reality of the mackerel season meant that the Charisma finished its available quota on the 14th October. The quota was caught in four trips. The crew had been provided with instructions for self-sampling of the catch on trips where observers were unavailable but this was not undertaken. The routine weight samples taken by the crew from the catch during the haul in trip three was available. Observer coverage was on the last trip during which two hauls were sampled. The first of these hauls was foul and the estimated 2-5 t that was in the codend on hauling was discarded. Those discards consisted of a mix of mainly small mackerel, herring, squid, saithe and pipefish. The second haul was estimated to be 800 t and completed the available quota. Available data is summarised in Table 4. The mean lengths and weights of the samples from the two retained hauls are within the ranges observed in samples obtained from the MFV Research.
Table 4 Summary of data collected from hauls on Charisma
Haul Number Date Codend
Mean length (cm)
Mean weight (g)
C1H1 11/10/2007 - 474.3 C2H1(discarded) 14/10/2007 30.5 253.4 C2H2 14/10/2007 34.8 432.1
Data collected from hauls on MFV Research
As was the case with the Charisma, fish sample data had not been retained by the crew for the trips prior to when observer coverage started. Observer coverage was provided for the three trips between the 15th and 23rd of October during which seven hauls were made - two in the first trip, three in the second and two in the last trip.
The average size of mackerel per haul was between 32.6 and 35.8 cm and between 348.8 and 474.4 g in the codend, and between 30.1 and 31.9 cm and 267.5 – 306.6 g in the cover-bag over the grid. Overall, the mackerel sampled from the codend were between 24 and 44 cm and 131 and 809 g. From the cover-bag there was a more limited range in sizes at between 24 and 36 cm and 126 and 594 g.
An ANOVA indicated that there were significant differences between hauls in the average lengths (F6, 1537 = 42.47, P<0.001) and in average weights (F6, 1537 = 35.13, P<0.001) of mackerel retained in the codend. Post-hoc Tukey tests indicated that by length, there were three homogeneous sub-sets consisting of both hauls from the first trip; hauls two and three from the second trip and the third group consisting of hauls one and three from the second trip together with both hauls from the third trip. The average length of fish in each haul

22
generally increased as the season progressed. Post-hoc Tukey tests indicated that the average weight of mackerel from the first haul on the first trip was significantly less than on other hauls. Five homogeneous subsets were identified.
There were also significant between haul variation in both the lengths (F3, 335 = 10.77, P<0.001) and weights (F3, 335 = 8.49, P<0.001) of mackerel which had escaped through the grid and those that were retained in the codend. Post-hoc Tukey tests indicated that both the mean lengths and mean weights from the first haul of the first trip were less than those in the next three hauls, which were all similar.
Kolmogorov-Smirnov tests indicated that the length and weight distributions of mackerel sampled from the cover-bag over the grid were significantly different to those sampled from the codend (P<0.001 in each case). Over the four hauls, where mackerel were obtained in the cover-bag, the mean lengths and mean weights were less than those from the codend by 1.9 – 3.6 cm and 56.2 – 144.7 g respectively. Again, it should be noted that the selectivity of the codend is not known so care should be taken to avoid over interpreting this result. Length and weight distributions of samples taken from the codend and cover over the grid are shown in Fig. 12 and Fig. 13.
Weights of mackerel samples are grouped as follows: <200 g, 200 - <400 g, 400 - <600 g and 600+ g and are shown from the cover over the grid and from the codend in Fig. 11. In each of these hauls between 6.9 and 20.8 % of mackerel that were sampled that had escaped through the grid were less than 200 g in weight, higher percentages than the 0.8 – 4.2 % of those retained in the codend which were in this weight category. Of the largest size category (600+ g), up to 12.2 % of the retained catches that were sampled were in this category while none were recorded amongst those sampled that had escaped through the grid.
Herring bycatch
Herring bycatch was only recorded amongst samples from the codend on two of the seven hauls. Herring were not recorded in either the codend or coverbag samples in either of the hauls during the first trip. During the second trip, no herring were recorded in the codend of the first haul while 14.2 % of the contents of the coverbag from that haul were herring. Similarly, during the second haul, herring constituted 1.68 % by weight of the codend sample and 28.3 % of the contents of the coverbag. During the remaining three hauls no samples were obtained from the coverbag. Herring were recorded in codend samples from only one of those three hauls and on that occasion they represented 1.39 %. Although these data are limited, they suggest that the grid may have a significant effect on reducing herring bycatch however further investigation, including the selectivity of other sections of the net and codend, would be required to confirm this.
In the haul where herring were in samples from both the codend and coverbag there were no significant differences in sizes between the samples (t-tests, P > 0.05 in both cases). The average lengths and weights were 29.9 cm and

23
212.7 g in samples from the codend, and 29.8 cm and 214.5 g from the coverbag samples.
0
20
40
60
80
100
<200 200-<400 400-<600 600+
%
R1H1
0
20
40
60
80
100
<200 200-<400 400-<600 600+
%
R1H2
0
20
40
60
80
100
<200 200-<400 400-<600 600+
%
R2H1
0
20
40
60
80
100
<200 200-<400 400-<600 600+
%
R2H2
0
10
20
30
40
50
60
70
80
<200 200-<400 400-<600 600+
%
R1H1
0
10
20
30
40
50
60
<200 200-<400 400-<600 600+
%
R1H2
0
10
20
30
40
50
60
70
<200 200-<400 400-<600 600+
%
R2H1
0
10
20
30
40
50
60
<200 200-<400 400-<600 600+
%
R2H2
Fig. 14Fig. 11 Distribution of sampled catches by s ize grade from the four hauls where mackerel samples were obtained from the cover over the grid (left, in red) and from the codend (right, in blue).

24
Fig. 12 Percentage length distributions of mackerel sampled from the codend and from the cover over the grid during the four hauls where samples were obtained from the coverbag.

25
0
5
10
0 200 400 600 800 1000
0
5
Trip 1, Haul 1(R1H1)
Codend
Coverbag
0
5
10
0 200 400 600 800 1000
0
5
Trip 1, Haul 2(R1H2)
Codend
Coverbag
0
5
10
0 200 400 600 800 1000
0
5
Trip 2, Haul 1(R2H1)
Codend
Coverbag
0
5
10
0 200 400 600 800 1000
0
5
Trip 2, Haul 2(R2H1)
Codend
Coverbag
Fig. 13 Percentage weight distributions of mackerel sampled from the codend and from the cover over the grid.

26
0
20
40
60
80
100
<200 200-<400 400-<600 600+
%
R1H1
0
20
40
60
80
100
<200 200-<400 400-<600 600+
%
R1H2
0
20
40
60
80
100
<200 200-<400 400-<600 600+
%
R2H1
0
20
40
60
80
100
<200 200-<400 400-<600 600+
%
R2H2
0
10
20
30
40
50
60
70
80
<200 200-<400 400-<600 600+
%
R1H1
0
10
20
30
40
50
60
<200 200-<400 400-<600 600+
%
R1H2
0
10
20
30
40
50
60
70
<200 200-<400 400-<600 600+
%
R2H1
0
10
20
30
40
50
60
<200 200-<400 400-<600 600+
%
R2H2
Fig. 14 Percentage weight distributions of mackerel sampled from the cover over the grid (left) and from the codend (right) are shown g rouped by weight grades.
27
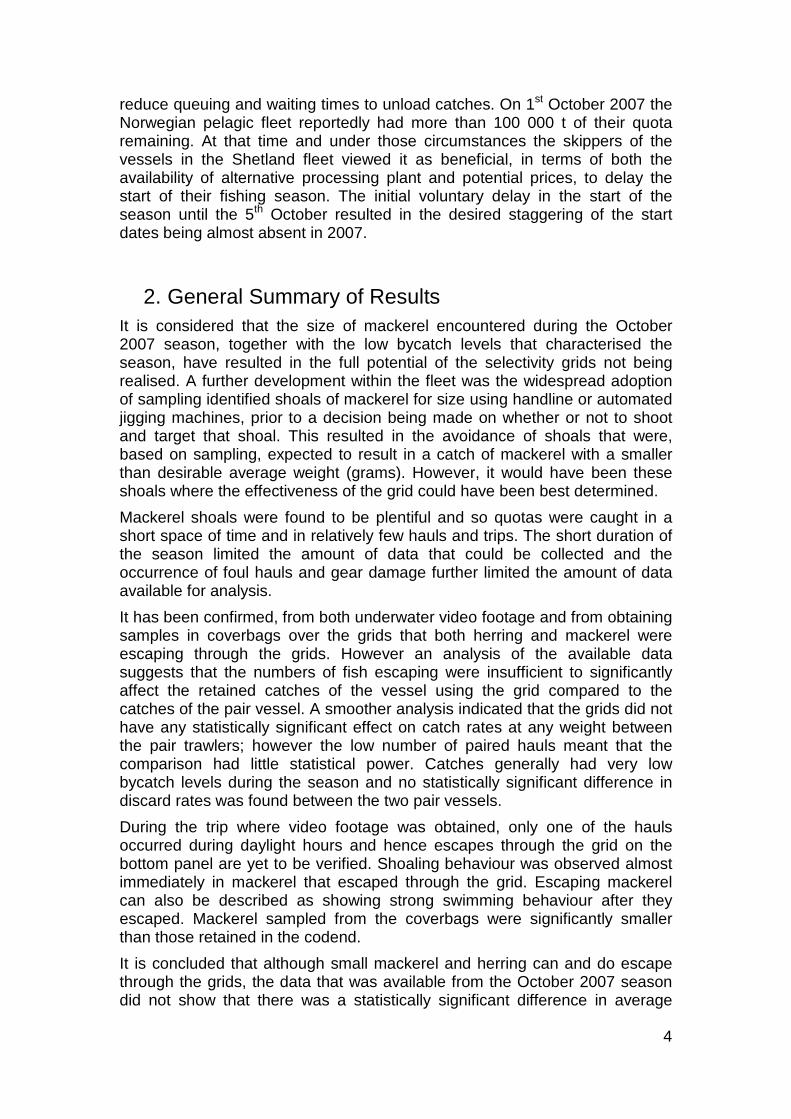
Table 5 Summary of mean lengths and weights of mack erel caught during hauls observed on the MFV Research.
Haul Number Date
Codend Grid cover Difference Estimated escapes through upper grid as % of catch in codend
(by weight) Mean length
(cm) Mean weight
(g) Mean length
(cm) Mean
weight (g) Mean length
(cm) Mean weight
(g) R1H1 16/10/07 32.6 348.8 30.1 267.5 2.5 81.3 3.56 R1H2 16/10/07 33.3 381.8 31.4 325.6 1.9 56.2 0.34 R2H1 18/10/07 35.5 459.3 31.9 314.6 3.6 144.7 1.63 R2H2 18/10/07 35.0 434.0 31.9 306.6 3.1 127.4 0.57 R2H3 19/10/07 34.4 412.0 * * * R3H1 23/10/07 35.1 450.6 * * * R3H2 23/10/07 35.8 474.4 * * *
*No samples obtained from grid coverbag.

28
Smoother analysis
The numbers of mackerel at length in the cover over the grid in the Research were compared to the numbers at length in the cod-end using the same smoother-based techniques (Fig. 15). It was assumed that the numbers of mackerel escaping through the portion of the grid with the cover were representative of escapes through the grid as a whole. The proportion of escapees was very low. However, it is difficult to interpret the graphs further. The proportions of mackerel in the cover reduce as length increases, but the rate of decline will depend on the retention curves of both the grid and the cod-end, and it is not possible to disentangle the two effects. Given the low proportions and the difficulties of interpretation, a mean relative catch rate was not considered.
0.0000
0.0025
0.0050
25 30 35 40
R1H1
25 30 35 40
R1H2
25 30 35 40
R2H1
25 30 35 40
R2H2
length (cm)
prop
ortio
n in
cov
er
Fig. 15 The proportion of mackerel retained in the cover over the grid of the Research relative to those retained by both the cover and th e cod-end (filled circles), with fitted smoothers (solid lines) and pointwise 95% confidenc e bands (grey shaded areas), for each haul. A couple of points, where one mackerel at a given length was caught in the cover, giving a proportion of 100%, have been omitt ed to avoid distorting the scale of the plots.

29
Underwater Video Footage Video recording system
A deep sea video recording system (Fig. 16) was used to observe separator grid activity during the first trip of the season on the Zephyr. Video footage was captured using a low light level ‘Navigator’ camera (0.00034 lux (faceplate sensitivity), 0.5" CCD, 6061 anodised aluminium, monochrome, PAL system, 3000 m depth-rated, operating temperature -5 ˚C to 50 ˚C in water). Footage was stored by means of a digital video recorder comprising of a Flashback2 Compact Flash recorder by Ovation systems (Video system MPEG2 720x576 SD PAL). The DSVR housing and chassis consisted of 6082 T6 aluminium alloy pressure housing. The chassis lid was secured by a 3-start 120° hard anodised thread. Four external securing b rackets welded to the housing allowed for installation on fishing gear. The DSVR housing was rated to a maximum operating depth of 500 m sea water at a temperature range of 5 °C – 40 °C.
Fig. 16 Deep sea video recording system (DSVR). a) DSVR housing, low light sensitive camera and connecting cables; b) fully assembled DS VR with camera mounted in protective housing.
The camera and recording unit were tested on board the Zephyr prior to the camera unit being fitted inside a protective housing and positioned in the centre of the top sheet of netting approximately 15 to 20 cm from the fore end of the upper sorting grid with the camera looking down the length of the grid. The cable connecting the camera and the control unit extended from the camera towards the mouth of the net for approximately 2 metres where the control unit was clipped into position directly in line with the camera. An 8 Gb flash card was inserted with a 4 hour capacity.
A delay of twenty minutes was set on the recording unit prior to inserting it into the deep water pressure housing and attaching the unit to the trawl. The delay was set to allow for the time required for the trawl to be shot and to start fishing. Video footage was captured during a tow on the 8th October 2007.

30
The net was shot at position 61º05.57’N 00º22.56’E at 17:00 UTC and hauling commenced at position 61º06.13’N 00º10.43’E at 18:20 UTC (Fig. 17). The total amount of fish retained in the catch was estimated to be 420 tonnes.
Data was retrieved and downloaded once the gear had been hauled and the DVSR was accessed and detached from the trawl.
Fig. 17 Shooting and hauling position of video capt ure tow to the north east of Shetland.
Video Analysis
A total of 109 minutes of video footage were recorded. Footage was analysed using the Corel® Intervideo WinDVD® 8 video playback software package with the playback speed slowed to 20% of the original speed.
Video footage was examined with the aim of observing escape behaviour through the grid, determining escape rates during the tow, levels of masking and observing the relative abundances of fish passing under the grid towards the codend.
Due to the time of day when the footage was recorded the levels of daylight were decreasing. Visibility was sufficient to allow accurate observations and

31
counts to be made on the first 66 minutes of footage but there was too little daylight to allow this on the remaining 36 minutes of footage. At 54 minutes the angle of the camera changed making accurate counts of escaping fish difficult and so the amount of footage where analysis could be made was further limited (Fig. 18).
Fig. 18 Comparative shots illustrating visibility a nd field of view at the start of the footage (left) and at 54 minutes (right).
Patterns in fish density passing under the grid
The relative volumes of fish passing under the grid were categorised into five levels which are detailed in Table 6.
Table 6 Categories used to describe relative densit ies of fish passing under the separator grid.
Level Fish passing under grid 0 No fish 1 Occasional fish 2 Steady but scattered stream of fish 3 Steady, more dense stream of fish 4 Solid mass of fish
A small number of fish were visible under the grid after the camera had been recording for 6 minutes. The camera was set with a 20 minute delay, therefore approximately 26 minutes had passed between the time the net entered the water and the first fish were visible under the grid. There was a steady increase in the density of fish passing under the grid which reached a peak at 22 minutes. This peak in density can be described as a solid, steady mass of fish passing under the grid and it continued for 3 minutes. The density of fish passing under the grid then decreased before a second solid, steady mass of fish were observed at between 31 and 37 minutes. The density passing under the grid then steadily decreased over the following 10 minutes and no fish were visible under the grid at 48 minutes into the recording. The relative densities passing under the grid during the first 54 minutes of footage were scored on the categories given in Table 6 are illustrated in Fig. 19.

32
Fig. 19 Observed fish densities passing under the u pper separator grid. Scale: 0) no fish; 1) occasional fish; 2) steady but scattered s tream of fish; 3) steady, dense stream of fish; 4) solid mass of fish.
Herring Scales
Herring scales were observed on the footage and occurred at differing intensities. The densities of herring scales that were observed were described using the four categories detailed in Table 7 and illustrated in Fig. 20.
Table 7 Categories used to describe relative densit ies of herring scale observations. Level Herring scale observations
0 No scales 1 Occasional scales 2 Steady scattering of scales 3 Dense flurries of scales
Fig. 20 Illustrations of typical examples in the fo ur categories used to describe different densities of herring scale observations.
On some occasions scale loss was observed to occur as an individual herring passed through the grid. An example of this is shown in the sequence in Fig. 21.
The majority of herring scales that were observed came into the field of view of the camera from the periphery. This indicated that the camera was being towed through them and suggests that they had been lost further up the trawl, either from contact with the net or possibly from herring escaping through the grid in the bottom panel.
The densities of the observations of scales were greatest towards the beginning of the tow, at between 9 and 25 minutes into the footage (Fig. 22). Small numbers of scales were observed as the first fish were seen to be
0 1 2 3

33
passing under the grid (at 6 minutes). The density of scales increased between 7 and 9 minutes then a steady scattering of scales continued to be observed until 14 minutes into the footage. After 16 minutes there was a rapid increase in the density of scales present in the water column, peaking at 18 minutes. Scale density then decreased steadily until 26 minutes, after which there were only occasional scales observed in the water. Although the first peak in the densities of fish passing under the grid coincided with increased observations of herring scales, this did not occur during the second peak of fish density passing under the grid (at 31 to 37 minutes) and observations of scales remained relatively low.
Fig. 21 Sequence of a herring escaping from upper s election grid (time 9:54). Circled areas in image 5 and 6 highlight scale loss as fish passes through bars.

34
Fig. 22 Observed herring scale density around upper separator grid. Categories: 0 - no scales; 1 - occasional scales; 2 - consistent scatt ering of scales; 3 - dense flurries of scales.
Fish escapes and masking
Due to the size of the grid, the angle of the camera and diminishing day light during the tow it was not possible to undertake a count of fish escapes over the whole grid area. It was possible to count the total number of fish escaping from each of the port and starboard sides of the grid from the top of the grid to a distance 18 meshes along the grid (each 1.53 metres wide x 5.94 metres long), however due to the angle of the camera to the grid, it was not possible to make an accurate count of the numbers of fish meshing as they tried to escape over this area. The numbers of fish that escaped or became meshed were counted from a more restricted area 1.8 m wide and 1.65 m long. This area was split into two equal observation areas (each 15 x 5 grid openings, 0.9 x 1.65 m). The positions of these areas are illustrated in Fig. 23.
Fig. 23 Still image taken from the video with the p erimeters of the 15 x 5 mesh areas added to illustrate where counts were made of fish either meshing or escaping.

35
Observed escapes through the grid
A total of 5,339 fish were observed escaping from a 51 x 18 mesh (1.53 x 5.94 m) area of the upper grid during 54 minutes of footage. The upper grid had a total area of 3.1 x 7.9 m so it is estimated that 14,387 fish escaped through the upper grid. The haul yielded 408 t with an average weight of 486.6 g which equates to approximately 838,471. The number escaping through the upper grid was therefore only 1.7 % of that remaining in the codend.
Over the 51 x 18 mesh area there was no bias towards either side with 2,663 observed escapes from the port and 2,676 escapes from the starboard side of the grid. During the 54 minutes there were three main peaks of occurrences of escapes (Fig. 24). The first peak, 154 fish per minute, was recorded at 18 minutes into the footage. This coincided with an increase to a steady stream of fish being observed under the grid (Fig. 19). The peak in the observed occurrences of scales in the surrounding water also occurred at this time (Fig. 22).
The second peak in the numbers escaping occurred between 23 and 29 minutes with a maximum at 24 minutes of 331 fish per minute escaping (through the 51 x 18 mesh area). This equates to 892 per minute from the upper grid as a whole. At this time a solid mass of fish were observed to be passing under the grid (Fig. 19).
The third and largest peak occurred between 31 and 39 minutes and corresponded with to the second peak in fish density under the grid. Three modes in numbers escaping were recorded with between 364 and 514 fish per minute escaping at 32, 34 and 36 minutes. For the remainder of the time series the numbers of fish passing through the grid were relatively low. The maximum at 36 minutes of 514 fish per minute through the 51 x 18 mesh area equates to 1385 fish per minute over the upper grid as a whole.
Fig. 24 Number of fish observed escaping from a 51 mesh x 18 mesh area of the upper selection grid.
Observations from 15 x 5 port & starboard observation areas
Escapes
From the two 15 x 5 grid opening areas, from which both escapes and masking could accurately be counted, a total of 413 fish were observed to
36
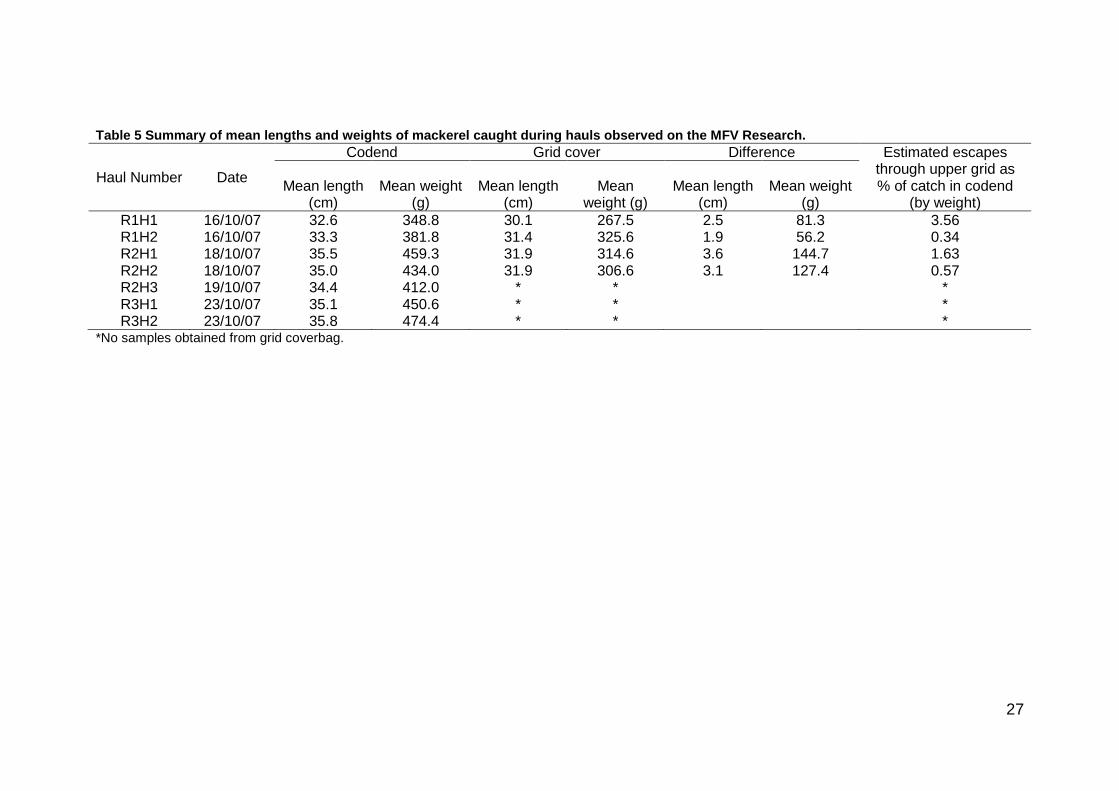
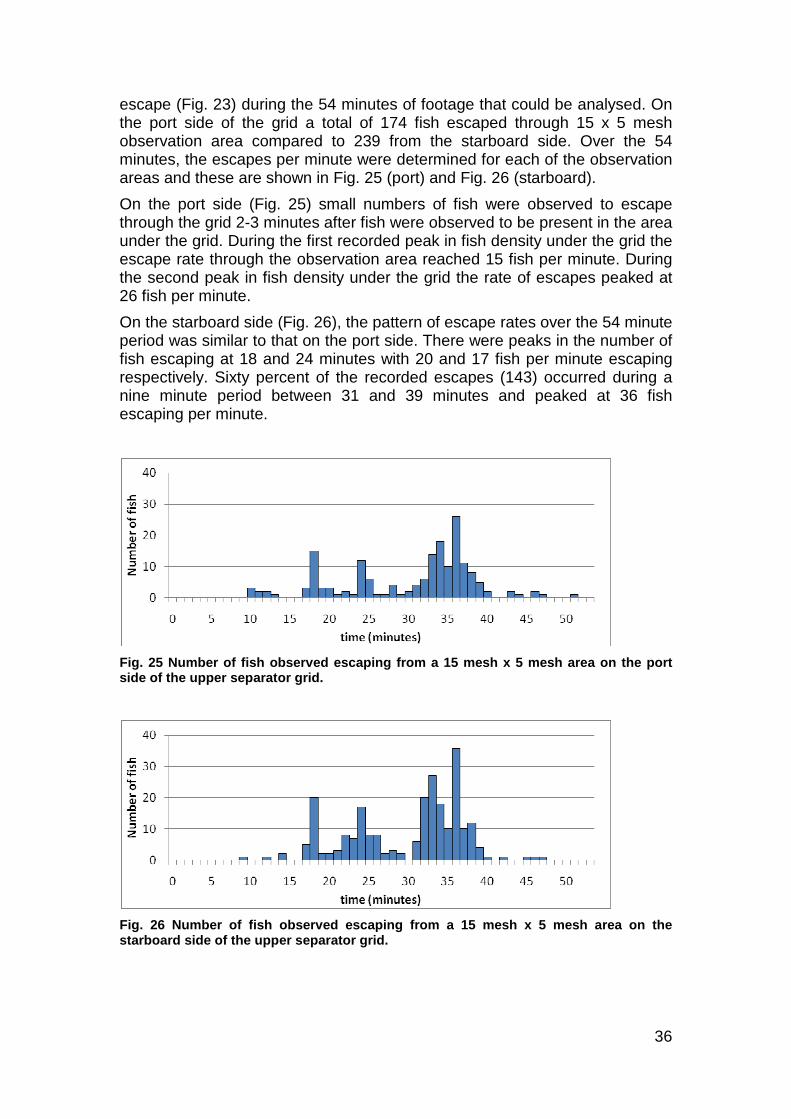
escape (Fig. 23) during the 54 minutes of footage that could be analysed. On the port side of the grid a total of 174 fish escaped through 15 x 5 mesh observation area compared to 239 from the starboard side. Over the 54 minutes, the escapes per minute were determined for each of the observation areas and these are shown in Fig. 25 (port) and Fig. 26 (starboard).
On the port side (Fig. 25) small numbers of fish were observed to escape through the grid 2-3 minutes after fish were observed to be present in the area under the grid. During the first recorded peak in fish density under the grid the escape rate through the observation area reached 15 fish per minute. During the second peak in fish density under the grid the rate of escapes peaked at 26 fish per minute.
On the starboard side (Fig. 26), the pattern of escape rates over the 54 minute period was similar to that on the port side. There were peaks in the number of fish escaping at 18 and 24 minutes with 20 and 17 fish per minute escaping respectively. Sixty percent of the recorded escapes (143) occurred during a nine minute period between 31 and 39 minutes and peaked at 36 fish escaping per minute.
Fig. 25 Number of fish observed escaping from a 15 mesh x 5 mesh area on the port side of the upper separator grid.
Fig. 26 Number of fish observed escaping from a 15 mesh x 5 mesh area on the starboard side of the upper separator grid.

37
Masking
Over the two 15 x 5 areas, a total of 21 fish were observed to mask during the 54 minutes of analysed footage. Nine fish masked on the port side (Fig. 27) and 12 on the starboard side (Fig. 28). On both sides the majority of masking coincided with the peak rates of fish escapes.
Fig. 27 Number of fish observed masking in a 15 mes h x 5 mesh area of the port side of the upper separator grid.
Fig. 28 Number of fish observed masking in a 15 mes h x 5 mesh area of the starboard side of the upper separator grid.
Escapes out with field of view
During the footage, observations were recorded of numbers of fish appearing within the field of view at the outsides of the side panels. These fish were swimming in an upwards direction and it is believed that there is a high probability that they had escaped through the bottom grid. Counts of these fish, on each side of the net, were made.
The numbers of fish swimming upwards and appearing at the side of the net were counted for both the port and starboard sides of the trawl. The total number of fish observed to appear on the starboard side was 157 while only 15 fish were counted on the port side. On the port side the majority of fish appeared during periods of moderate or high activity within the net (Fig. 29) and, while the appearance of fish on the starboard side was also evident

38
during periods of high activity under the grid, fish continued to be seen when the densities under the grid had subsided (Fig. 30).
Fig. 29 Number of fish appearing at the port side o f the net.
Fig. 30 Number of fish appearing at the starboard s ide of the net.
Fish behaviour
Fish escaping through the separator grid exhibited similar behavioural patterns. In general, after a fish passed through the grid it swam forwards with the net and therefore towards the camera but also in a diagonal direction towards one of the sides of the net. During periods with large numbers of fish escaping from the grid, shoaling behaviour was evident almost immediately after fish passed through the grid. This resulted in escaping fish grouping together and moving in one general direction rather than scattering randomly after escaping through the grid. Fig. 31 illustrates fish that had escaped through the grid and were swimming in a diagonal course upwards and away from the grid towards the starboard side of the net (left side of the images).

39
Fig. 31 Fish escaping from upper selection grid exh ibiting shoaling behaviour.
The clearest observations of fish behaviour in the net occurred during the first 25 minutes of footage and relate to the area closest to the camera and just under the fore-end of the upper grid. In general the fish that were observed under the grid appeared to be orientated towards the camera and were therefore swimming in the direction in which the net was being towed. Although there were observations of individuals that managed to keep pace with the net for a few seconds or made short bursts and moved closer towards the camera, as a general rule, the fish were swimming slower than the towing speed and were being moved down towards the codend. It is a general observation that even during times when there was a low density of fish under the grid very few appeared to attempt to escape through it. A high proportion of those that were observed to escape appeared to be falling back, rather than actively swimming with the net and that it was coming into contact with the grid that caused an escape response.
Other species
Several observations were made of squid escaping through the grid (Fig. 32) and on several occasions clouds of squid ink were observed to be present in the water which were probably due to squid escaping, or trying to escape in the area of the net ahead of the upper grid. The majority of observations of squid were within the first 15 minutes of the footage.
Fig. 32 Left image: an escaping squid releasing ink as it passed through the grid (time 10:24 minutes); and right image: a cloud of squid i nk (time 9:48 minutes).
During almost all hauls during the mackerel season pipefish were observed to be entangled in the net when it was hauled. There has been a dramatic and

40
apparently widespread increase in abundances of pipefish since around 2003. Before then they were rarely seen. In the video footage pipefish were observed either as they came into view above the grid, indicating that they may have escaped through the net ahead of the grid, or they were observed escaping through the grid. Some of those escaping through the grid became entangled for varying periods of time, up to several minutes in some cases before they escaped. Most ‘entanglements’ appeared to be as a result of the pipefish wrapping their tail around the grid. An example of pipefish observations is shown in Fig. 33.
Fig. 33 A pipefish escaping through the grid and a pipefish entangled in grid/ netting seam (time: 3 minutes).
5. Discussion The data gathered during the October 2007 mackerel season has shown that both mackerel and herring did escape through the selection grids. However, the overall conclusion on the comparison of the pair vessels is that the volumes that were escaping were insufficient to significantly affect the average size of the mackerel retained in the cod-end of the trial vessel compared to that of the control.
During the October 2007 season the average weights in landings of mackerel from the four vessels were between 431 and 490 g. If the mackerel in the targeted shoals had been smaller then a higher proportion of those mackerel would have been of a size that could escape and a significant effect may have been recorded. It is concluded that longer term monitoring of the size distributions of catches and monitoring over both the Q4 and Q1 seasons would be required in order to determine the effectiveness of the grid.
The majority of mackerel that escaped through the grid were in the 200 – 400 g size range and those in the coverbag samples were significantly smaller than those retained in the codend. However, mackerel up to 594 g were recorded amongst escaped fish and this was a larger size than the fishermen expected. It is suggested that the flexibility of the piping in the grid is such that relatively large fish can force their way through.

41
The bycatch levels were low during the season, with landings containing mostly below 3% bycatch from the single trawlers and up to only 0.74% from the pair trawlers. A comparison of bycatch percentages of landings found no statistically significant difference between the pair trawlers. It is not known if a statistically significant effect would have been found if the shoals had had a higher bycatch percentage. However, on the Research, of the hauls where herring were present in samples, herring constituted higher percentages in samples from the coverbag compared to the codend but the number of samples was too low to draw any firm conclusions from. Further data collection and/ or comparison of future landings data would be required before any firm conclusions can be made on the effectiveness of the grid in terms of reducing discards in either the single or pair trawlers.
The video footage indicated that the periods when there were significant numbers of fish escaping through the grid tended to coincide with periods when a solid mass of fish were passing under the grid. However, from the observations that were made, it is considered that when the fish under the grid appeared as a solid mass, the density of fish would have been such that most would not have seen the grid or have been in a position to attempt to escape through it.
It was a general observation that even when fish density was low only a very small proportion of fish appeared to try to escape through the grid. Fish were generally observed to be orientated so that they were swimming with the net as it was towed, but due to the towing speed they were being moved towards the codend. Because fish were trying to swim in the direction of the net they were not facing the grid as they approached it and would therefore probably not have seen it as an escape route. The importance of an understanding of fish behaviour in the net and their reactions to, or interactions with, selectivity devices is highlighted as a consequence of the observations made. There are obviously further research questions in relation to both the behaviour of the fish and the optimum angles for the grids, particularly for the grid in the bottom panel as no video footage was obtained of it during a tow.
To conclude, although the volumes of mackerel that were escaping were not large enough to result in statistically significant differences in the average weights of landed mackerel between pair vessels, the selection grid was seen to let some herring and mackerel escape. The vessels involved in the project have continued to use the grids into the first quarter 2008 season when the mackerel encountered are often of a smaller size. Data would need to be collected over a longer period of time before the effectiveness of the grids can be assessed in relation to shoals of different size and species compositions. Numerous different selectivity devices have been designed and trialled for use in the demersal whitefish trawl and each design is inevitably modified a number of times. The grid design that was trialled in this project was a modification of an earlier prototype and should the pelagic industry decide to adopt the use of selection grids then it is almost inevitable that over time there will be further modifications or different systems trialled however it should be emphasised that there may be an insufficient number of hauls in one season to determine the effectiveness of such devices.
42
6. References Anon. 2007. "9.4.2 Northeast Atlantic Mackerel (combined Southern,
Western, and North Sea spawning components)." ICES Advice 2007, Book 9: 39-52.
Fryer, R. J., Zuur, A. F., and Graham, N. 2003. Using mixed models to combine smooth size-selection and catch-comparison curves over hauls. Canadian Journal of Fisheries an Aquatic Science, 60: 448-459.