screening and management of obesity ray plodkowski, md chief endocrinology and metabolism va sierra...
TRANSCRIPT

Screening and Management of Screening and Management of ObesityObesity
Ray Plodkowski, MD
Chief Endocrinology and Metabolism
VA Sierra Nevada Health Care System, Reno and
Medical Director: University of Nevada School of Medicine
Division of Endocrinology, Nutrition, and Metabolism Weight Loss Clinic
(775)848-4206

Body Mass Index (BMI)Body Mass Index (BMI)
The clinical standard for
weight-for-height estimations
Body wt (in kg) / [Ht (in meters)]2
or
Body Wt (in lb) / [Ht (in in]2 X 703.1

WHAT IS YOUR BODY MASS INDEX?
Chart from CDC: For Adults, aged 20 years and older

BMI Clinical GuidelinesBMI Clinical Guidelines**BMI Clinical GuidelinesBMI Clinical Guidelines**Classification BMI (kg/m2)
Underweight < 18.5
Normal Weight 19 - 24.9
Overweight 25 - 29.9
Class I Obesity (Mild) 30 -34.9
Class II Obesity (Moderate) 35 - 39.9
Class III Obesity (Extreme) 40 _______________________________________
*NHLBI /NIDDK, NIH. Clinical Guidelines on the Identification, Evaluation, and Treatment of Overweight and Obesity in Adults. The Evidence Report. NIH Publication No. 98-4083, Sept. 1998

Why Body Mass Index (BMI)?Why Body Mass Index (BMI)?Wt (kg)/Ht (mWt (kg)/Ht (m22))
• New definitions for overweight and obesity• Related to health risk (morbidity & mortality)• Simple, inexpensive, noninvasive• Nomograms available

Limitations of BMILimitations of BMI Does not distinguish between high weights due to large muscle
mass or edema Can misclassify muscular persons as being overly fat Does not reveal differences in fat distribution (visceral vs.
subcutaneous) Does not differentiate between men and women Is not accurate when height is compromised (kyphosis, scoliosis) Should not be used for children < 2 years of age Clinical judgment needed (frail elderly, etc.)

Obesity Trends* Among U.S. AdultsObesity Trends* Among U.S. AdultsBRFSS, 1985BRFSS, 1985
(*BMI ≥30, or ~ 30 lbs. overweight for 5’ 4” person)
No Data <10% 10%–14%

Obesity Trends* Among U.S. AdultsObesity Trends* Among U.S. AdultsBRFSS, 1986BRFSS, 1986
(*BMI ≥30, or ~ 30 lbs. overweight for 5’ 4” person)
No Data <10% 10%–14%

Obesity Trends* Among U.S. AdultsObesity Trends* Among U.S. AdultsBRFSS, 1987BRFSS, 1987
(*BMI ≥30, or ~ 30 lbs. overweight for 5’ 4” person)
No Data <10% 10%–14%

Obesity Trends* Among U.S. AdultsObesity Trends* Among U.S. AdultsBRFSS, 1988BRFSS, 1988
(*BMI ≥30, or ~ 30 lbs. overweight for 5’ 4” person)
No Data <10% 10%–14%

Obesity Trends* Among U.S. AdultsObesity Trends* Among U.S. AdultsBRFSS, 1989BRFSS, 1989
(*BMI ≥30, or ~ 30 lbs. overweight for 5’ 4” person)
No Data <10% 10%–14%

Obesity Trends* Among U.S. AdultsObesity Trends* Among U.S. AdultsBRFSS, 1990BRFSS, 1990
(*BMI ≥30, or ~ 30 lbs. overweight for 5’ 4” person)
No Data <10% 10%–14%
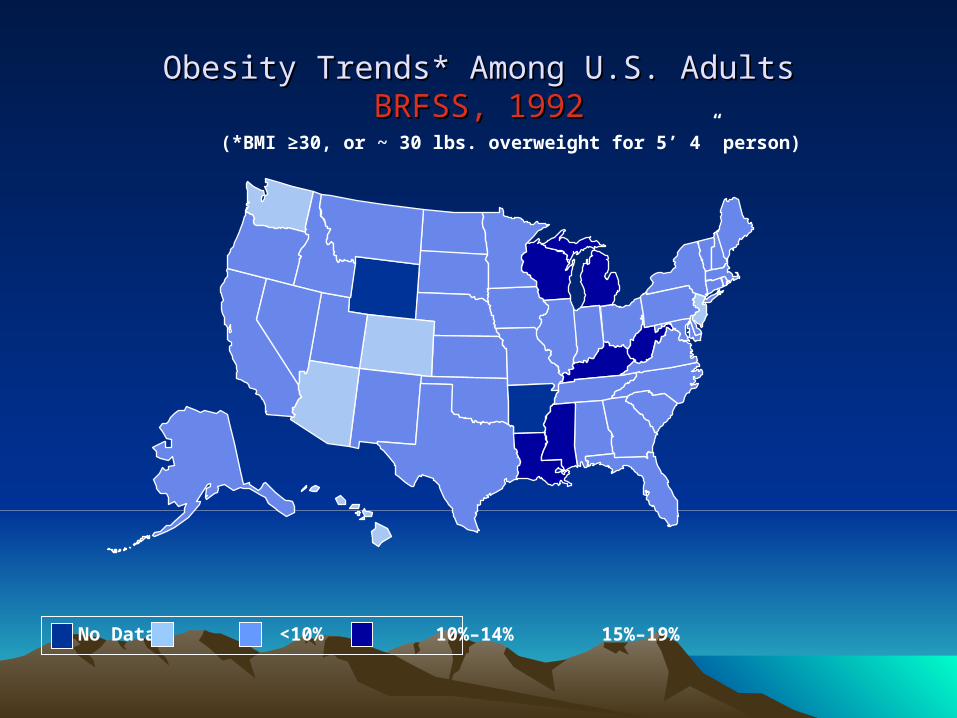
Obesity Trends* Among U.S. AdultsObesity Trends* Among U.S. AdultsBRFSS, 1992BRFSS, 1992
(*BMI ≥30, or ~ 30 lbs. overweight for 5’ 4” person)
No Data <10% 10%–14% 15%–19%

Obesity Trends* Among U.S. AdultsObesity Trends* Among U.S. AdultsBRFSS, 1993BRFSS, 1993
(*BMI ≥30, or ~ 30 lbs. overweight for 5’ 4” person)
No Data <10% 10%–14% 15%–19%
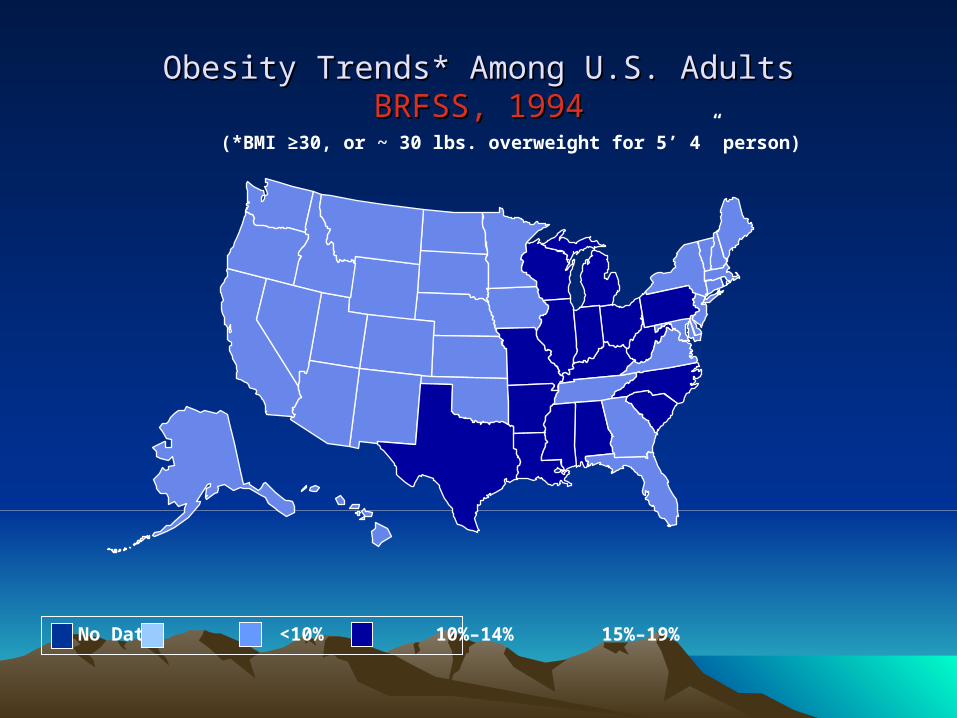
Obesity Trends* Among U.S. AdultsObesity Trends* Among U.S. AdultsBRFSS, 1994BRFSS, 1994
(*BMI ≥30, or ~ 30 lbs. overweight for 5’ 4” person)
No Data <10% 10%–14% 15%–19%
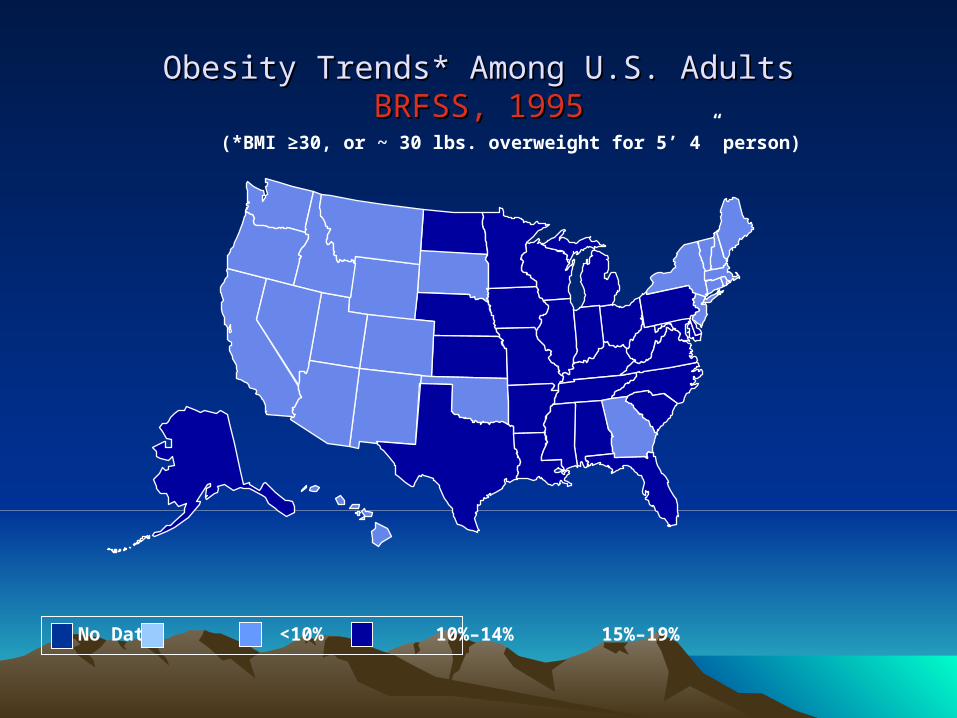
Obesity Trends* Among U.S. AdultsObesity Trends* Among U.S. AdultsBRFSS, 1995BRFSS, 1995
(*BMI ≥30, or ~ 30 lbs. overweight for 5’ 4” person)
No Data <10% 10%–14% 15%–19%

Obesity Trends* Among U.S. AdultsObesity Trends* Among U.S. AdultsBRFSS, 1996BRFSS, 1996
(*BMI ≥30, or ~ 30 lbs. overweight for 5’ 4” person)
No Data <10% 10%–14% 15%–19%

Obesity Trends* Among U.S. AdultsObesity Trends* Among U.S. AdultsBRFSS, 1997BRFSS, 1997
(*BMI ≥30, or ~ 30 lbs. overweight for 5’ 4” person)
No Data <10% 10%–14% 15%–19% ≥20%
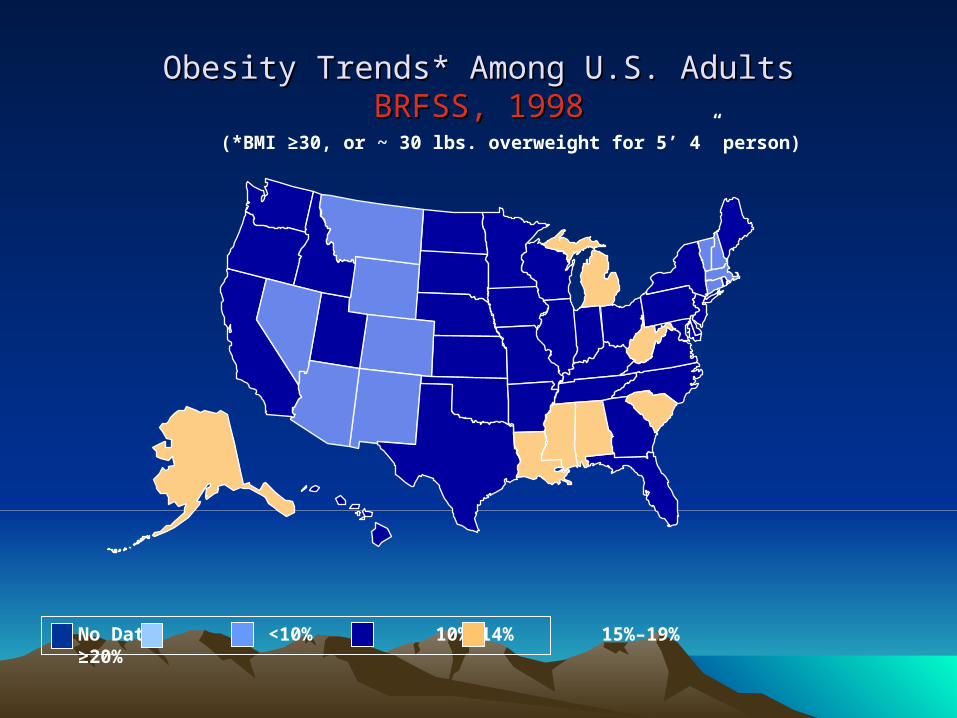
Obesity Trends* Among U.S. AdultsObesity Trends* Among U.S. AdultsBRFSS, 1998BRFSS, 1998
(*BMI ≥30, or ~ 30 lbs. overweight for 5’ 4” person)
No Data <10% 10%–14% 15%–19% ≥20%

Obesity Trends* Among U.S. AdultsObesity Trends* Among U.S. AdultsBRFSS, 1999BRFSS, 1999
(*BMI ≥30, or ~ 30 lbs. overweight for 5’ 4” person)
No Data <10% 10%–14% 15%–19% ≥20%

Obesity Trends* Among U.S. AdultsObesity Trends* Among U.S. AdultsBRFSS, 2000BRFSS, 2000
(*BMI ≥30, or ~ 30 lbs. overweight for 5’ 4” person)
No Data <10% 10%–14% 15%–19% ≥20%
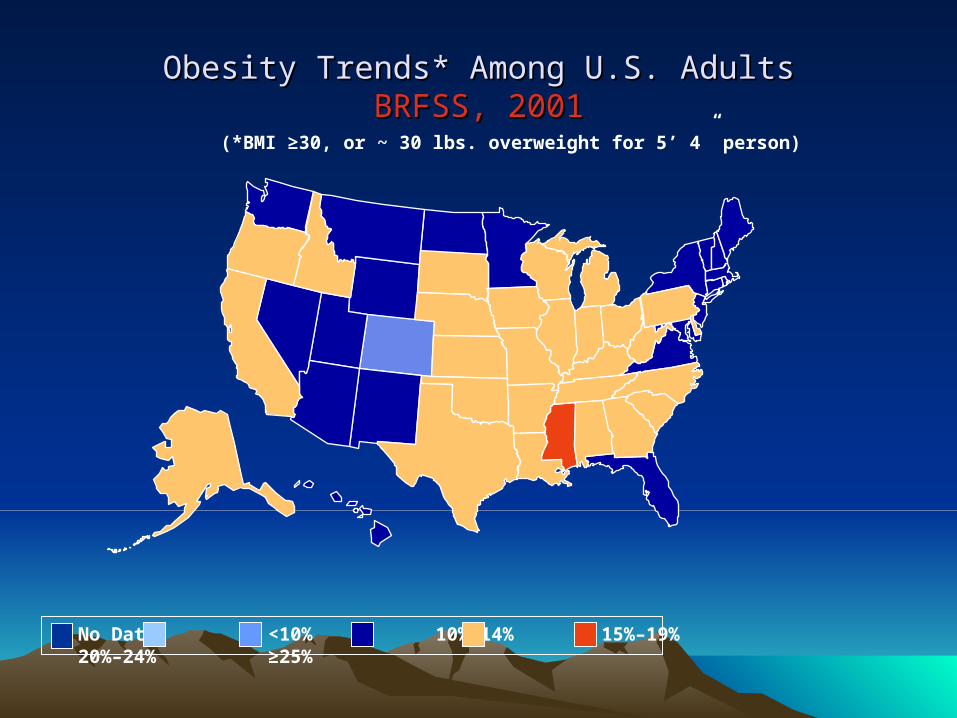
Obesity Trends* Among U.S. AdultsObesity Trends* Among U.S. AdultsBRFSS, 2001BRFSS, 2001
(*BMI ≥30, or ~ 30 lbs. overweight for 5’ 4” person)
No Data <10% 10%–14% 15%–19% 20%–24% ≥25%

(*BMI ≥30, or ~ 30 lbs. overweight for 5’ 4” person)
Obesity Trends* Among U.S. AdultsBRFSS, 2002
No Data <10% 10%–14% 15%–19% 20%–24% ≥25%

Obesity Trends* Among U.S. AdultsObesity Trends* Among U.S. AdultsBRFSS, 2003BRFSS, 2003
(*BMI ≥30, or ~ 30 lbs. overweight for 5’ 4” person)
No Data <10% 10%–14% 15%–19% 20%–24% ≥25%

Obesity Trends* Among U.S. AdultsObesity Trends* Among U.S. AdultsBRFSS, 2004BRFSS, 2004
(*BMI ≥30, or ~ 30 lbs. overweight for 5’ 4” person)
No Data <10% 10%–14% 15%–19% 20%–24% ≥25%

Obesity Trends* Among U.S. AdultsObesity Trends* Among U.S. AdultsBRFSS, 2005BRFSS, 2005
(*BMI ≥30, or ~ 30 lbs. overweight for 5’ 4” person)
No Data <10% 10%–14% 15%–19% 20%–24% 25%–29% ≥30%

Obesity Trends* Among U.S. AdultsObesity Trends* Among U.S. AdultsBRFSS, 2006BRFSS, 2006
(*BMI ≥30, or ~ 30 lbs. overweight for 5’ 4” person)
No Data <10% 10%–14% 15%–19% 20%–24% 25%–29% ≥30%
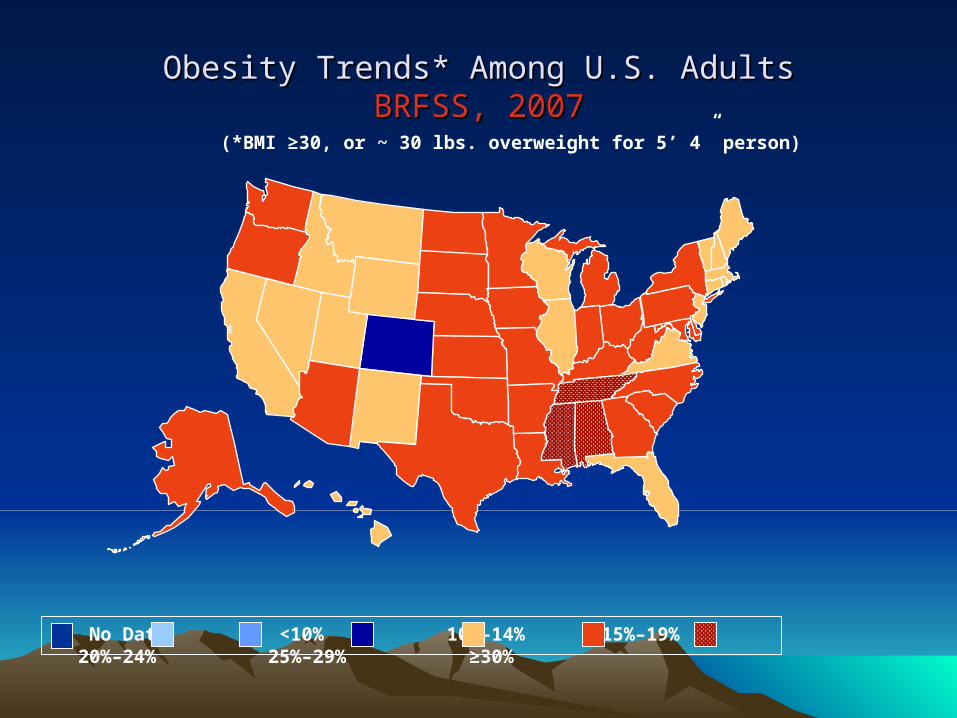
Obesity Trends* Among U.S. AdultsObesity Trends* Among U.S. AdultsBRFSS, 2007BRFSS, 2007
(*BMI ≥30, or ~ 30 lbs. overweight for 5’ 4” person)
No Data <10% 10%–14% 15%–19% 20%–24% 25%–29% ≥30%

Obesity Trends* Among U.S. AdultsObesity Trends* Among U.S. AdultsBRFSS, 2008BRFSS, 2008
(*BMI ≥30, or ~ 30 lbs. overweight for 5’ 4” person)
No Data <10% 10%–14% 15%–19% 20%–24% 25%–29% ≥30%

Age-adjusted percentage of adults aged ≥20 years who are obese, 2007
MMWR 58:1259-1263, 2009

Age-adjusted percentage of adults aged ≥20 years with diagnosed diabetes, 2007
MMWR 58:1259-1263, 2009

Why is the Epidemic Occurring?Why is the Epidemic Occurring?
• Energy Balance: Intake vs. Output
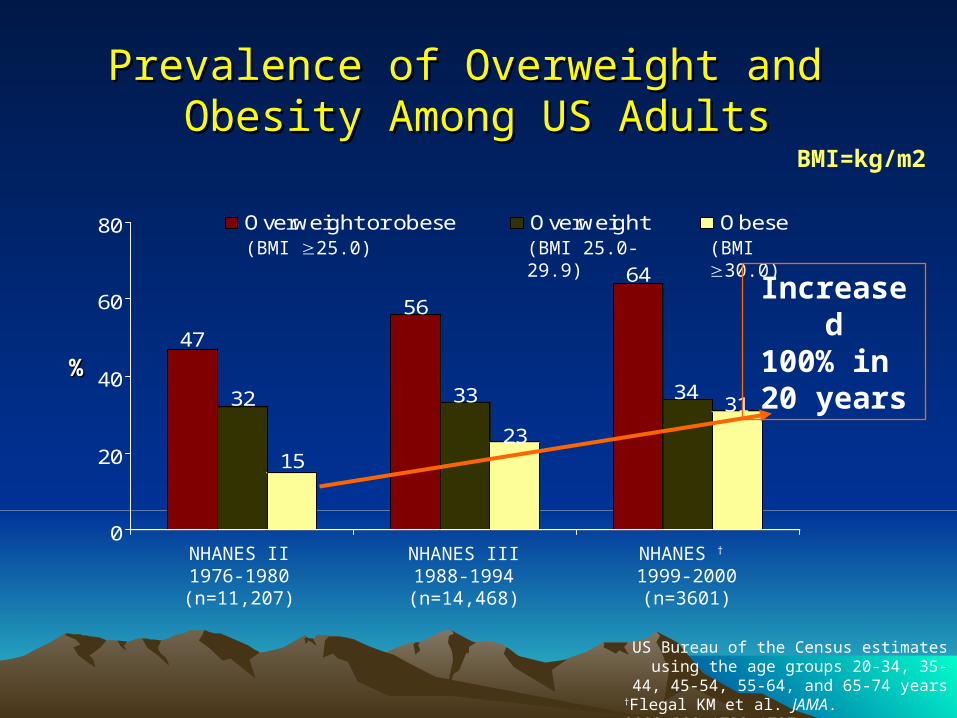
Prevalence of Overweight and Prevalence of Overweight and Obesity Among US AdultsObesity Among US Adults
47
32
15
56
33
23
64
3431
0
20
40
60
80 Overweight or obese Overweight Obese(BMI 25.0) (BMI 25.0-29.9) (BMI 30.0)
Increased100% in 20 years%%
NHANES II1976-1980(n=11,207)
NHANES † 1999-2000(n=3601)
NHANES III1988-1994(n=14,468)
US Bureau of the Census estimates using the age groups 20-34, 35-44, 45-54, 55-64, and
65-74 years†Flegal KM et al. JAMA. 2002;288:1723-1727.
BMI=kg/m2

EnvironmentEnvironment• Abundance of palatable, calorie-dense food
• Number of calories expended in physical activity is insufficient to offset consumption – Mechanization limits physical activity– Sedentary daily routines consisting of:
• sitting at work• sitting in traffic• sitting in front of a television or a computer monitor for
most of their waking hours

BAGELBAGEL 20 Years Ago Today
140 calories 3-inch diameter
How many calories are in this bagel?

140 calories 3-inch diameter
Calorie Difference: 210 calories
350 calories 6-inch diameter
BAGELBAGEL 20 Years Ago Today
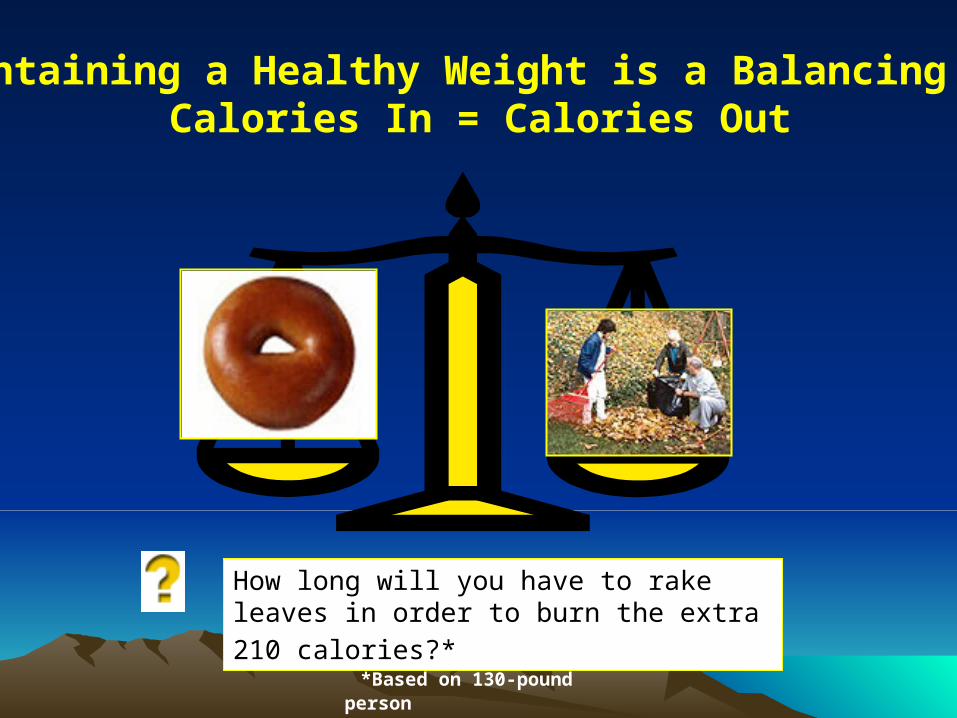
How long will you have to rake leaves in
order to burn the extra 210 calories?*
*Based on 130-pound person
Maintaining a Healthy Weight is a Balancing ActCalories In = Calories Out

If you rake the leaves for 50 minutes you will burn the extra 210 calories.*
*Based on 130-pound person
Calories In = Calories Out

SPAGHETTI AND MEATBALLS20 Years Ago Today
500 calories1 cup spaghetti with sauce and 3 small meatballs
How many calories do you think are in today's portion of spaghetti and meatballs?

Calorie Difference: 525 calories
1,025 calories 2 cups of pasta with sauce and 3 large meatballs
20 Years Ago Today
500 calories1 cup spaghetti with sauce and 3 small meatballs
SPAGHETTI AND MEATBALLS

How long will you have to houseclean in order to burn the extra 525 calories?*
*Based on 130-pound person
Maintaining a Healthy Weight is a Balancing ActCalories In = Calories Out

*Based on 130-pound person
If you houseclean for 2 hours and 35 minutes, you will burn approximately 525 calories.*
Calories In = Calories Out

Intake vs OutputIntake vs Output• Walking = 5 kcal/minute• 100 kcalories = a mile (walking at 3 MPH)
• Burger King Whopper = 640 calories(kcal)To walk off a Whopper 640/5 = 128 minutes (6 miles)
• Subway 6” Turkey Sub (no cheese, no mayo) = 289 kcalTo walk off a Turkey Sub 289/5 = 57 minutes (3 miles)

Calorie Dense FoodCalorie Dense FoodBreakfast:
Blackberry Green Tea Frappuccino® 560 (kcal)12 Grain Bran Muffin 400 (Kcal)
Lunch:Double Quarter-Pounder with Cheese 760 (kcal)Chocolate Shake 32 fl. oz. 1150 (kcal)Super Size Fries 610 (kcal)
Dinner:¼ white meat chicken (breast and thigh) 330 (kcal)Mashed Potatoes (8oz) 210 (kcal)Coca-Cola 140 (kcal)
Total: 3600 (kcal)
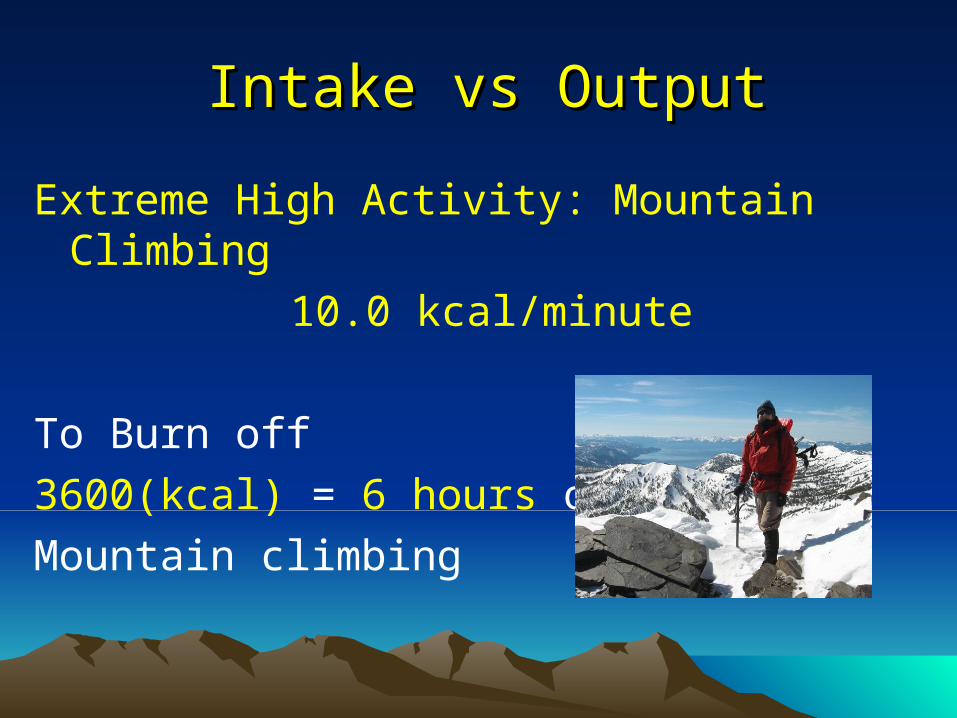
Intake vs Output Intake vs Output
Extreme High Activity: Mountain Climbing
10.0 kcal/minute
To Burn off
3600(kcal) = 6 hours of
Mountain climbing

Intake vs Output Intake vs Output
Extreme High Activity: Mountain Climbing
10.0 kcal/minute
To Burn off “Super-sized”
meal: 3600(kcal)
= 6 hours of
mountain climbing(or 36 miles of walking!!)

Health Risks of ObesityHealth Risks of Obesity
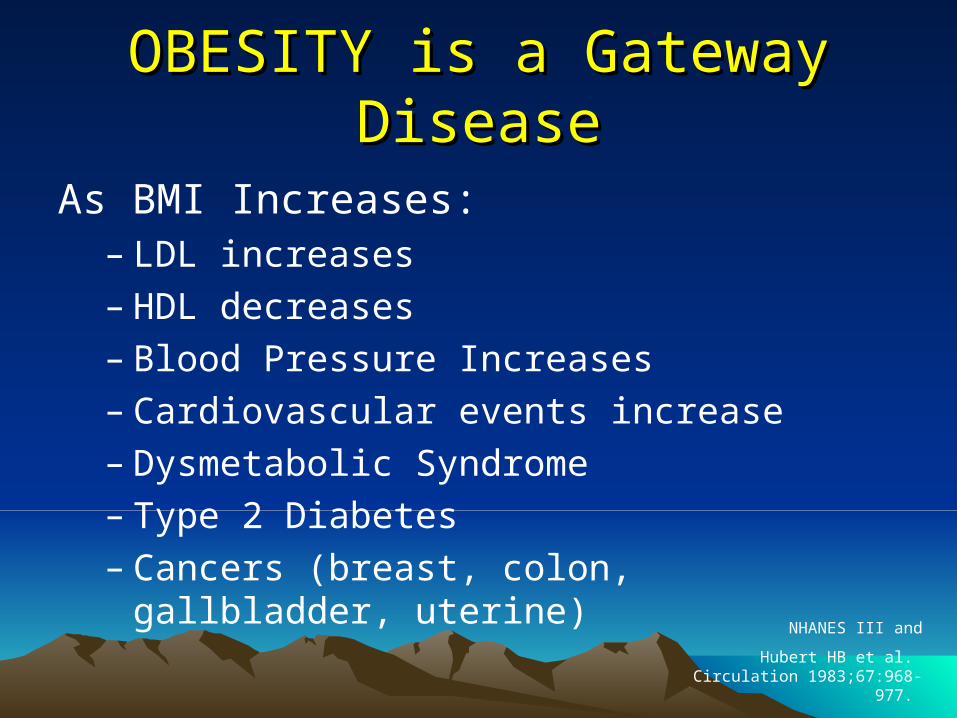
OBESITY is a Gateway DiseaseOBESITY is a Gateway Disease
As BMI Increases:– LDL increases– HDL decreases– Blood Pressure Increases– Cardiovascular events increase– Dysmetabolic Syndrome– Type 2 Diabetes– Cancers (breast, colon, gallbladder, uterine)
NHANES III and
Hubert HB et al. Circulation 1983;67:968-977.

14.9 15.2
22.1
27.727
32.7
41.937.8
0
10
20
30
40
50
Men Women
BMI <25 BMI 25-<27 BMI 27-<30 BMI >30
NHANES III Prevalence of Hypertension* NHANES III Prevalence of Hypertension* According to BMIAccording to BMI
*Defined as mean systolic blood pressure 140 mm Hg, mean diastolic 90 mm Hg, or currently taking antihypertensive medication.
Brown C et al. Body Mass Index and the Prevalence of Hypertension and Dyslipidemia. Obes Res. 2000; 8:605-619.
Per
cen
t

26 -Year Incidence of Coronary Heart Disease 26 -Year Incidence of Coronary Heart Disease in Menin Men
177
255
350333366
440
0
100
200
300
400
500
600
<25 25-<30 30+
<50 years 50+ years
Inci
den
ce/1
,000
BMI LevelsAdapted from Hubert HB et al. Circulation 1983;67:968-977. Metropolitan Relative Weight of 110 is a BMI of approximately 25.
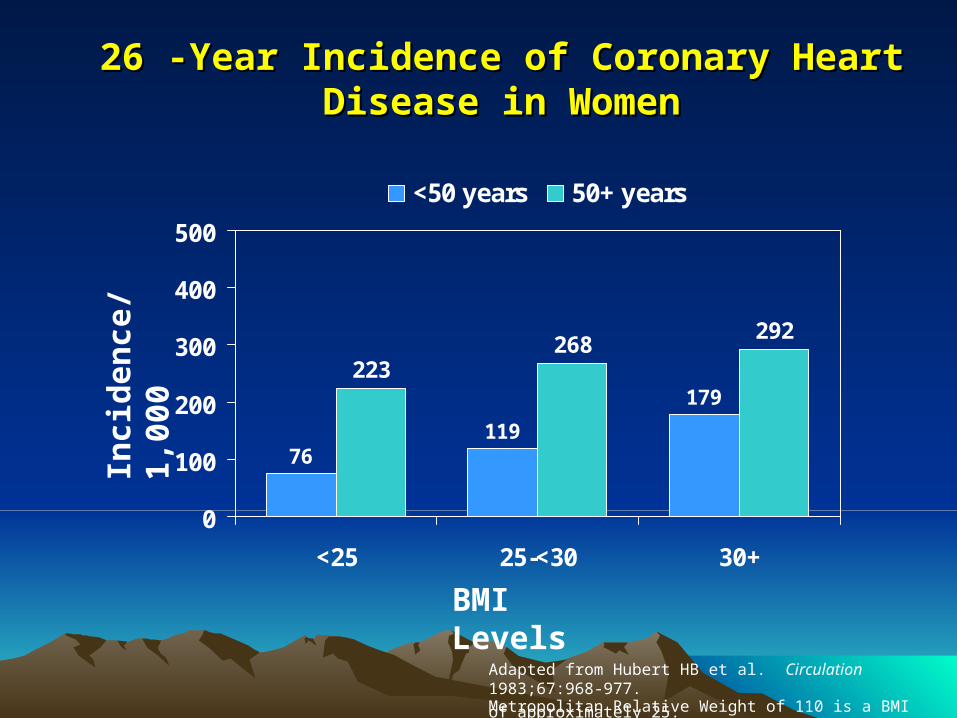
26 -Year Incidence of Coronary Heart Disease in 26 -Year Incidence of Coronary Heart Disease in WomenWomen
76119
179223
268292
0
100
200
300
400
500
<25 25-<30 30+
<50 years 50+ years
Inci
den
ce/1
,000
BMI Levels
Adapted from Hubert HB et al. Circulation 1983;67:968-977. Metropolitan Relative Weight of 110 is a BMI of approximately 25.

Obesity and Diabetes RiskObesity and Diabetes Risk
0
20
40
60
80
100
<20 20-25 25-30 30-35 35-40 >40
BMI Levels
Inci
den
ce o
f N
ew C
ases
pe
r 1,
000
Per
son-
Yea
rs
Knowler WC et al. Am J Epidemiol 1981;113:144-156.
BMI
Per
cen
tag
e
20 25 30 35 40
5
10
15
25
20
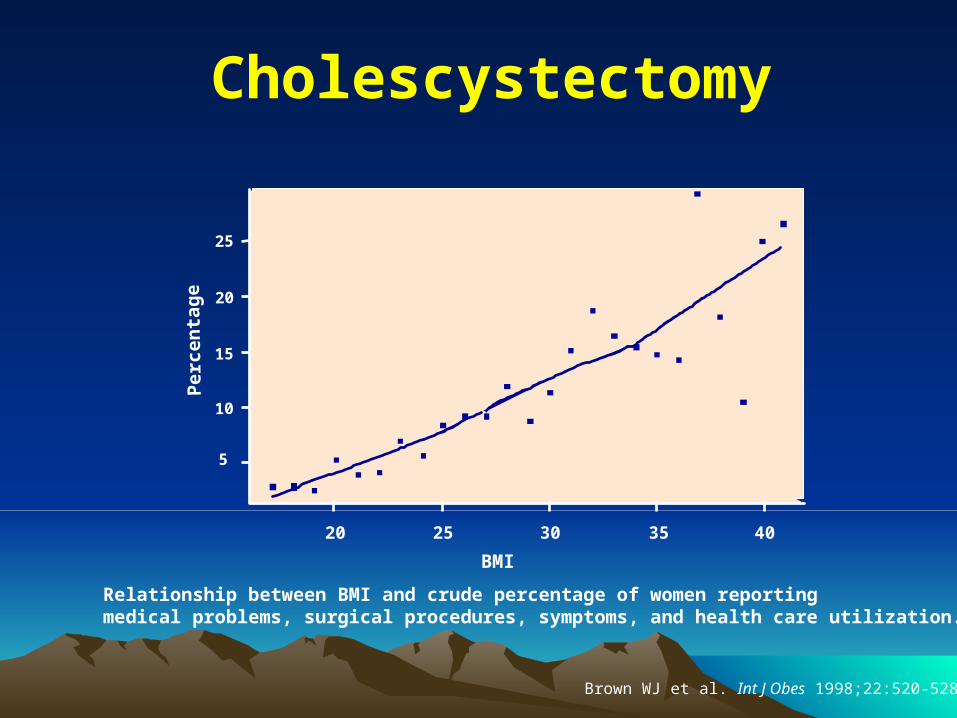
Cholescystectomy
Relationship between BMI and crude percentage of women reporting medical problems, surgical procedures, symptoms, and health care utilization.
Brown WJ et al. Int J Obes 1998;22:520-528.

BMI
Per
cen
tag
e
20 25 30 35 40
20
15
25
35
30
40
Hysterectomy
Brown WJ et al. Int J Obes 1998;22:520-528.

BMI
Per
cen
tag
e
20 25 30 35 40
20
15
30
25
35
Back Pain
Brown WJ et al. Int J Obes 1998;22:520-528.

BMI
Per
cen
tag
e
20 25 30 35 40
20
15
30
25
35
Constant Tiredness
Brown WJ et al. Int J Obes 1998;22:520-528.

Other RisksOther Risks
• Congestive Heart Failure
• Stroke
• Osteoarthritis
• Sleep Apnea• Cancer (Colon, Breast, Endometrial,
Gallbladder)

Primary Care Obesity Evaluation

Appropriate Office Environment Appropriate Office Environment for Obese Patientsfor Obese Patients
• Waiting room chairs without arms or a larger bench seat with arms
• Step stools next to examination tables
• Large gowns and blood pressure cuffs
• Scale that can weigh extremely obese patients, located in a private area
• Appropriate obesity educational materials, handouts, and treatment protocols
• Empathetic, respectful, and supportive office staff
Slide Source:Obesityonline.org

Medical History Medical History
Elicit risk factors and symptoms of the manifestations of obesity:
• Dysmetabolic syndrome
• Type 2 diabetes
• Cardiovascular disease (and angina)
• Sleep apnea
• Gallstones
• Potential Pregnancy

Family and Social HistoriesFamily and Social Histories
• Identify support networks and cultural factors – May influence the patient’s ability to participate in a
weight management program
• Other household members with obesity– May impact the ability for the patient to modify his or
her lifestyle and diet.
• Dietary changes– Easier to implement if the other members of the
family also adopt healthier nutrition habits.

Assessing Weight Loss ReadinessAssessing Weight Loss Readiness
• Motivation:Motivation:• Stress level:Stress level:• Psychiatric issues:Psychiatric issues:
• Time availability:Time availability:
Patient seeks weight reductionPatient seeks weight reduction
Free of major life crisesFree of major life crises
Free of severe depression, substance Free of severe depression, substance abuse, bulimia nervosaabuse, bulimia nervosa
Patient can devote 15-30 min/d to weight Patient can devote 15-30 min/d to weight control for next 26 weekscontrol for next 26 weeks
Patient Ready?Patient Ready?Patient Ready?Patient Ready?YESYES
Initiate weight loss Initiate weight loss therapytherapy
NONO
Prevent weight gain Prevent weight gain and explore barriers to and explore barriers to
weight reductionweight reductionSlide Source:
Obesityonline.org

Medical Causes of ObesityMedical Causes of Obesity
• Hypothyroidism
• Cushing's syndrome
• Depression (Beck’s depression inventory)
Beck AT. The Beck Depression Inventory. San Antonio, TX: The Psychological Corporation; 1987.Beck AT, Steer RA, Garbin MG. Psychometric properties of the Beck Inventory: Twenty-five years of evaluation. Clin Psychol Rev. 1988;8:77-100.
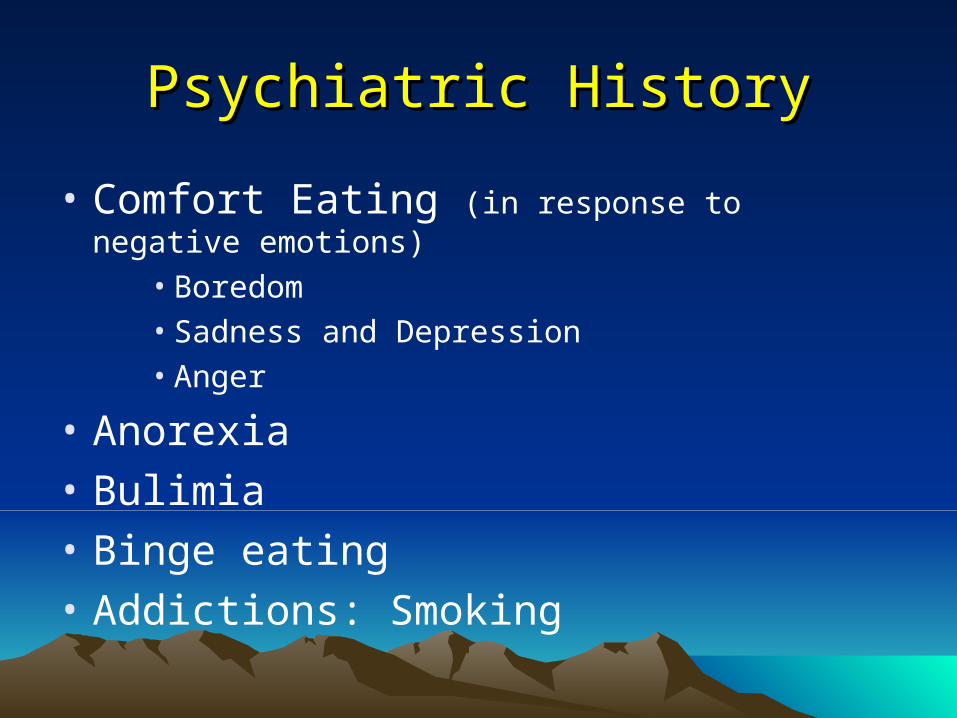
Psychiatric HistoryPsychiatric History
• Comfort Eating (in response to negative emotions)
• Boredom• Sadness and Depression • Anger
• Anorexia
• Bulimia
• Binge eating
• Addictions: Smoking

Selected Medications That Can Selected Medications That Can Cause Weight GainCause Weight Gain
Diabetes medications
– Insulin
– Sulfonylureas
– Thiazolidinediones
Highly active antiretroviral therapy
Tamoxifen
Steroid hormones
– Glucocorticoids
– Progestational steroids

Selected Medications That Can Selected Medications That Can Cause Weight GainCause Weight Gain
• Psychotropic medications
– Tricyclic antidepressants
– Monoamine oxidase
inhibitors
– Specific SSRIs
– Atypical antipsychotics
– Lithium
– Specific anticonvulsants -adrenergic receptor blockers
clozapine (Clozaril) 4.4 kg gain*olanzapine (Zyprexa) 4.2 kg*
risperidone (Resperdal) 2.1 kg*Paxil, Prozac
*Allison DB et al. Am J Psychiatry 1999 Nov;156(11):1686-96

Exercise HistoryExercise History
• Exercise habits
• Physical activity patterns
• Limitations
• Preferences

Physical Exam andPhysical Exam andMeasurementsMeasurements
– Blood Pressure– Waist circumference (Non-Stretchable Tape)– Height (wall-mounted stadiometer)– Weight (Balance Beam Scale)– Calculate BMI: weight (kg)/height (m2)– Body Composition (by bio-impedence)– Attention to gallbladder– “The Usual”
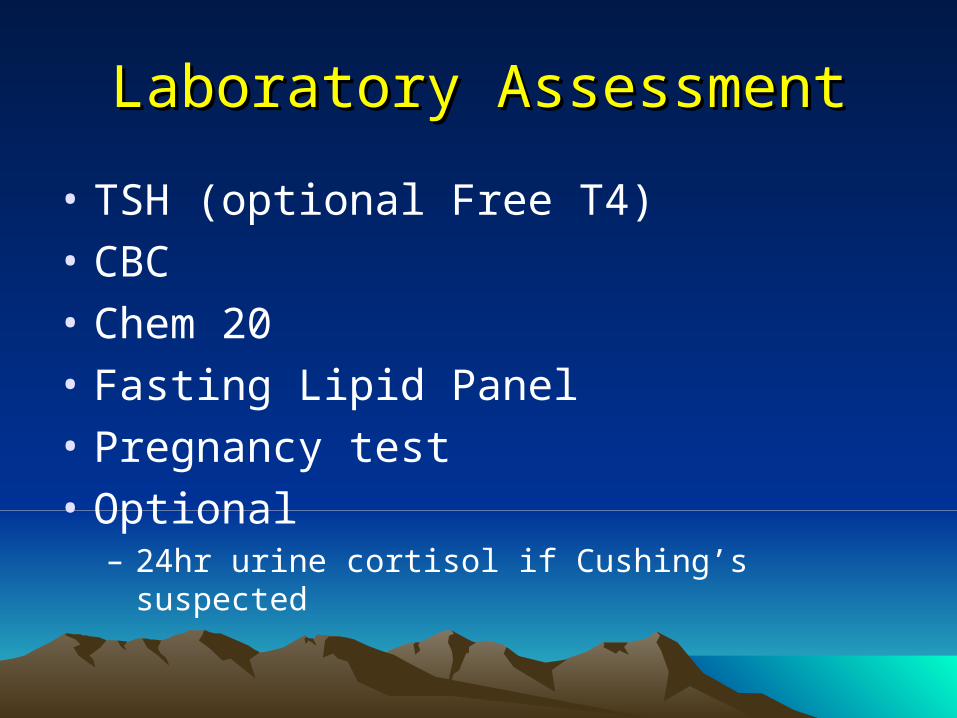
Laboratory AssessmentLaboratory Assessment
• TSH (optional Free T4)
• CBC
• Chem 20
• Fasting Lipid Panel
• Pregnancy test
• Optional – 24hr urine cortisol if Cushing’s suspected

Obesity Treatment
Lifestyle therapy(diet, physical activity, and behavioral
therapy)is the cornerstone of obesity
treatment

NIH Guide to Selecting Obesity Treatment
Treatment
BMI Category
25-26.9 27-29.9 30-34.9 35-39.9 >40
Lifestyle Therapy*
With
Comorbid.
With
Comorbid.YES YES YES
Pharmaco
therapy
With
Comorbid.YES YES YES
Surgery With
Comorbid.YES
*Lifestyle therapy: diet, physical activity, and behavioral therapy.•Consider pharmacotherapy only if a patient has not lost 1 pound per week after 6 months of combined lifestyle therapy.

Goals of Weight Goals of Weight Management/TreatmentManagement/Treatment
• Prevent further weight gain (minimum goal).
• Reduce body weight.• Maintain a lower body weight
over long term.

Target Weight: Realistic Goals• Substitute “healthier weight” for ideal or
landmark weight.
• Accept slow, incremental progress to goal.
— Short-term goal: 5 to 10 percent loss, 1 to 2 lb per week.
— Interim goal: Maintenance.
— Long-term goal: Additional weight loss, if desired, and long-term weight maintenance.

Increase Physical ActivityIncrease Physical Activity
• Most important in preventing weight regain
• Health benefits independent of weight loss
• Start slowly and increase gradually
— Can be single session or intermittent
— Start with walking 30 minutes 3 days/week
— Increase to 45 minutes 5 or more days/week
— Encourage increased “lifestyle” activities

Behavior TherapyBehavior Therapy
Implementation of strategies, based on learning principles, that provide tools for overcoming barriers to compliance with diet or physical activity changes:
• Self-monitoring• Stress management• Stimulus control• Problem-solving• Contingency management• Cognitive restructuring• Social support
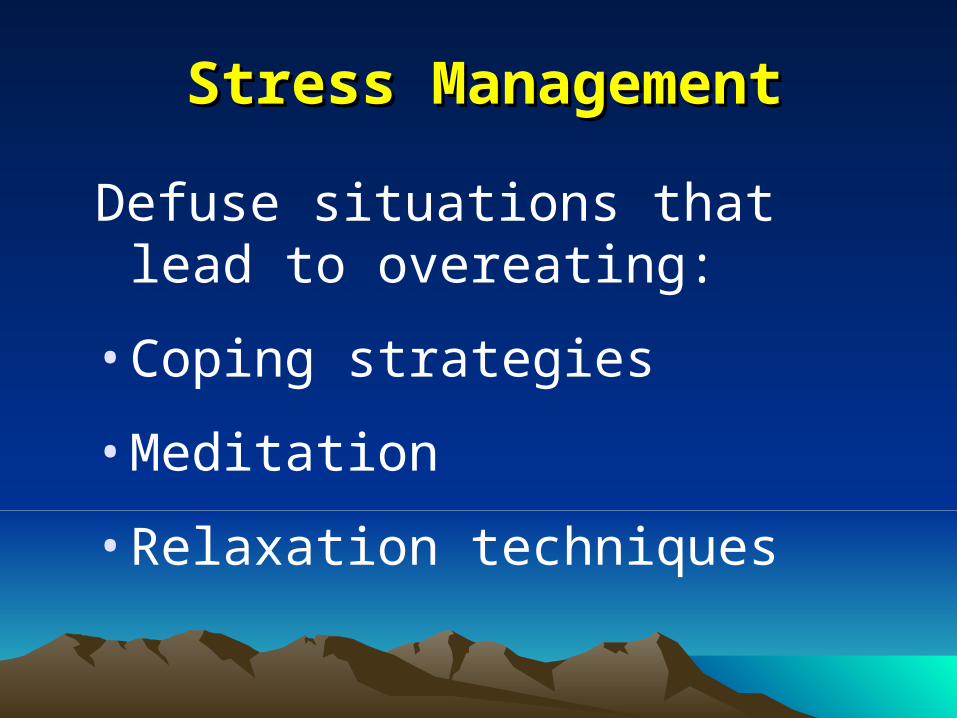
Stress ManagementStress Management
Defuse situations that lead to overeating:
• Coping strategies
• Meditation
• Relaxation techniques

Stimulus ControlStimulus Control
Behavior change techniques:
• Learn to shop for healthy foods.
• Keep high-calorie foods out of the home.
• Limit the times and places of eating.

Cognitive RestructuringCognitive RestructuringRational thoughts designed to replace negative
thoughts:
Instead of. . . “I blew my diet this morning by eating
that doughnut.”
Use. . . “Well, I ate the doughnut, but I can still
eat in a healthy manner the rest of the day.”

Determining Daily Calorie GoalsDetermining Daily Calorie Goalsfor a Weight Loss Dietfor a Weight Loss Diet
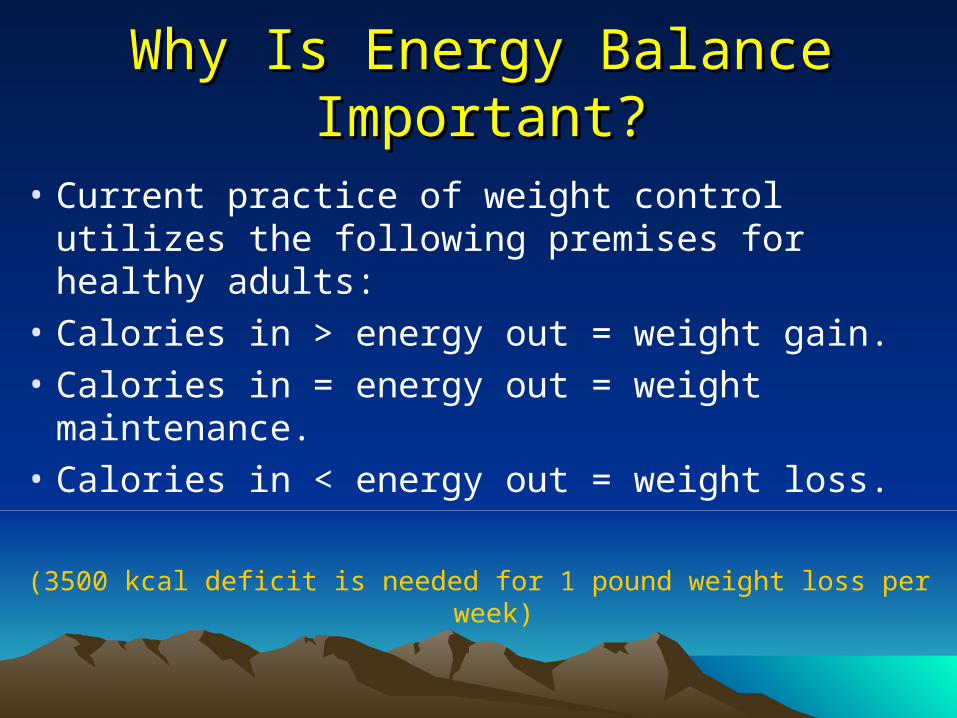
Why Is Energy Balance Important?Why Is Energy Balance Important?
• Current practice of weight control utilizes the following premises for healthy adults:
• Calories in > energy out = weight gain.
• Calories in = energy out = weight maintenance.
• Calories in < energy out = weight loss.
(3500 kcal deficit is needed for 1 pound weight loss per week)

What is REE?What is REE?
• Resting energy expenditure (REE)=“burn rate”• The number of calories the body uses each day
for maintenance of homeostasis.• Can measure directly or use formulas
– Females: 10 Wt (kg) + 6.25 Ht (cm) - 5 age (y) –161
– Males: 10 Wt (kg) +6.25 Ht (cm) - 5 age (y) +5
*Mifflin-St. Jeor ST et al. Am J Clin Nutr 1990;51-241-7

Case Study
Patient: • Female • Age 50 years • Height = 60”• Weight= 180 lbs. • BMI=35

Intake:3 or 7 Day Food Record shows 2100 kcal/day average intake. +2100 kcal/d
Output:
1. REE : - 1400 kcal/d
2. Physical Activity Factor (Intentional Physical Activity or exercise/wk)
140 min walking (20 min X 7 days) X 5 kcal/min = 700 kcal/week
700 kcal/7 days= - 100 kcal/day average
3. TEE = REE (1400) X 1.3 = 1800 + Intentional PA (100) = ~1900 kcal/d. -1900 kcal/d
__________________________________________________________________________________Total +200
kcal/d

Recommendation for WEIGHT MAINTENANCE (kcal/d): To maintain current weight this patient must decrease intake by -200 kcal/day from the current intake of 2100 kcal/d yielding a 1900 kcal/day diet.
Recommendation for WEIGHT REDUCTION (kcal/d): To lose 1 pound per week, a 500 kcal per day deficit is needed In this patient: (-200 kcal/day deficit to maintain weight) + (-500 kcal/day deficit to lose 1 pound per week)___________________________________________ = -700 kcal/day total deficit needed to lose 1 lb/week Decrease 2100 KCAL/D intake by -700 kcal/d. = 1400 kcal/d dietary intake

Questions?Questions?
Division of Endocrinology, Nutrition, and Metabolism Weight Loss Clinic
(775)848-4206