searching for sand reservoirs using 3c-3d seismic data, horizontal well logs, and vsp agl update...
TRANSCRIPT
Searching for sand reservoirs using 3C-3D seismic data, horizontal well
logs, and VSP
AGL Update Meeting
Houston, Texas May 2nd, 2012
Robert R. Stewart University of HoustonChuandong (Richard) Xu Oxy Petroleum, California
Arnim Haase University of Calgary

Introduction◦Ross Lake, northern Williston Basin◦Motivation – delineate reservoirs & find new
ones Geology - Stratigraphy & incised valley targets Data - 3C-3D surface seismic and VSP Analysis - Interpretation of PP & PS data
◦ Time structure, time thickness, Vp/Vs Results - Horizontal well logs
◦ new targets
Outline

Geological SettingC
reta
ceo
us
Jura
ssic
Man
nvi
lle
Gp
Van
gu
ard
Gp
Pense Fm
Cantuar Fm
Success Fm
Roseray Fm
Rush Lake Fm
Shaunavon Fm
Target: Sandbars in Dimmock Creek Member of the Cantuar Formation of Mannville Group, L. Cretaceous
(from Christopher, 1974)

(Data from National Energy Board, 2001)
30 million barrel pool to be found
Motivation for continued & improved exploration in the area
Numerous 10 million barrel pools

Crossplot of Vs and Vp from 4 regional wells
Regression: Vp=1.416*Vs+1070
Vp/Vs=1.5 Vp/Vs=2.0
Vp/Vs=3.0
Mudrock: Vp=1.16*Vs+1360

25
Inline
Xline
After processing, NS Inline 1-132, EW Xline 1-91, about 7.5 km2
3C-3D seismic survey to locate horizontal well
Shot by CGGVeritas Dynamite source, 3C VectorSeis® receivers Record length: 5000 ms @ 2 ms sample rate

Why are PS sections often lower frequency than PP sections?…. AttenuationQ type
Spect.ratio
Drift Empir Conv/WE
Inst. Amp.
Average
Qp 67 39 57 82 44 58Qs 23 37? 11 - 28 25From Best et al., 1994 and Calderon-Macias et al., 2004
* Q values from Ross Lake
VSP

PS VSP (700m offset)
PP time, applied 5/10-50/60 bandpass filter
PP data PS data, Vp/Vs=2.35 AND bulk shift UP 125ms
PP VSP (700m offset)

PS synthetic (PS time)PP synthetic & section (PP time)

PP time thickness RushLake-IHACM PS time thickness RushLake-IHACM
1*2
/
Tpp
TpsVsVp
Map of average Vp/Vs between RushLake and IHACM

Zoom of Vp/Vs map (IHACM to Rush-Lake)
MD:1240 m
MD:1570 m

S-impedance from sparse-spike inversion

Vp/Vs from time-thickness (isochron) ratios
Vp/Vs from impedance ratios
Comparison of traveltime and impedance Vp/Vs


Horizontal well design on Vp/Vs
Proposed horizontal well

PP time thickness indicates channels & sand bar shape VSP and synthetic seismograms assist in PP-PS correlation. Vp/Vs from time thickness & inversions indicate reservoir
sands Combining and PS data provides another reservoir delineator &
additional targets
Summary & Acknowledgements
Husky Energy Inc. – especially, Larry Mewhort, Kenneth Hedlin and Angela Ricci
Schlumberger – in particular, Mike Jones CGGVeritas Hampson-Russell Software Services
Ltd. Allied Geophysical Lab, & the CREWES Project

Ground Penetrating Radar (GPR) and Total Station Survey in Robertson Stadium, University
of Houston Suleyman Coskun
Geophysical Data Acquisition Term Project Presentation
26 April 2012

Outline Introduction Methods Data Acquisition Data Processing Results Conclusion

Introduction The Robertson Stadium is a football stadium
located in University of Houston Main Campus.
Most of the stadiums have a pipeline distribution below the field in order to prevent flooding or freezing.
Our 1st objective: To map the pipeline if the Robertson Stadium has one and define its spacing and top depth.
Our 2nd objective: To map the topography of the field using Total Station

MethodsGround Penetrating Radar
• GPR is an electromagnetic system that emits time-varying wave pulses from the surface and receives the reflections which are created by any discontinuities encountered underground.
• The fundamental basis for using GPR to determine the subsurface is the relationship between the wave velocity and material’s electrical property (permittivity).
• The unit of Electromagnetic travel time is nanosecond (10-9 sec)
• Penetration and Resolution depend on center frequency of system antenna.
Total Station
• Total station is a modern surveying technique that uses electronic/optical distance measuring device and reflector.
• Total station system can determine the coordinate and elevation information of a point by using simple trigonometry and triangulation equations.
• It has has very high accuracy (~1.5mm).

Data acquisition
• GPR System : Noggin 250 MHz
• Grid Line Spacing: 3 ft.• Number of stack: 32• Y line: 54 – X Line: 51• Total Line length: 16,290
ft.
• Trimble Total Station System
• Point Spacing: • 5 yards in X direction• 10 yards in Y direction
• 190 data point in total
• Dimension of the field: 300x160 ft.• Data acquired from half of the field

DATA PROCESSING

DATA PROCESSING

results
0.4-0.5 feet depth slice 1.7 – 1.75 feet depth slice
results
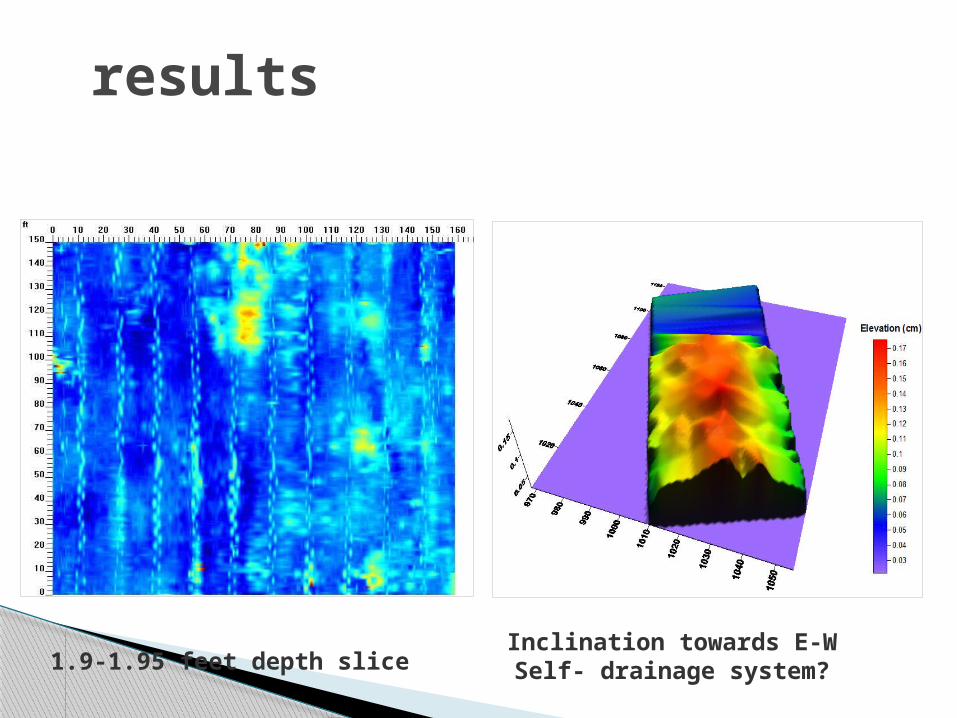
1.9-1.95 feet depth slice Inclination towards E-W Self- drainage system?

conclusion
Some geotechnical and topographic features of the Robertson Stadium at University of Houston are determined by ground penetrating radar and total station systems
The drainage pipeline separation is 15 ft and the pipeline distribution has a very clear image in processed GPR data.
Also GPR data indicates a shallow lineament in the East side on the study area but the source of this anomaly remains unknown.
Topographic data indicates that the stadium is inclined towards East and West directions. This inclination is interpreted as a self-drainage system that provides water to be drained from the center to the corners for preventing a flooding.

Thank You Dr. Robert Stewart (Director of Allied
Geophysical Laboratories) Jeremy McDonald (Director of facilities and
operations - Department of Athletics) Susan Green, Ady Geda, Emrah Pacal and
Anoop Williams (AGL) Ozbil Yapar, Omer Akbas, Kenan Yazan and
Tuna Altay Sansal (Acquisition Crew)