seasonal changes in fish assemblages in the river minho ... · government), concerning the frieira...
TRANSCRIPT

Seasonal changes in fish assemblages in the River Minho tidalfreshwater wetlands, NW of the Iberian Peninsula
Micaela Mota1*, Ronaldo Sousa1,2, Ana Bio1, Jorge Araujo1, Catarina Braga1
and Carlos Antunes1,3,4
1 Interdisciplinary Centre of Marine and Environmental Research (CIIMAR/CIMAR), University of Porto, Rua dos Bragas 289,P 4050-123 Porto, Portugal
2 CBMA – Centre of Molecular and Environmental Biology, Department of Biology, University of Minho, Campus de Gualtar,4710-057 Braga, Portugal
3 Aquamuseu do Rio Minho, Parque do Castelinho, 4920-290 Vila Nova de Cerveira, Portugal4 ESG – Gallaecia University School, Largo das Oliveiras, 4920-275 Vila Nova de Cerveira, Portugal
Received 14 August 2013; Accepted 9 April 2014
Abstract – The ichthyofauna of the River Minho tidal freshwater wetlands (TFWs) was studied in a semi-enclosed area, between June 2007 and May 2010, to determine temporal patterns of abundance, biomass andspecies composition. Fish catches, standardized by the number of fyke nets and by the fishing effort, were
analysed and related to river flow, water temperature and precipitation. In total, 21 fish species were identifiedincluding six non-indigenous species (NIS) which represented 15% of the total captures (yet 43% of the bio-mass). Regarding ecological guilds, 82% were freshwater species (61% of the biomass) which included all
NIS, whereas 13% of the catches were catadromous species (31% biomass) corresponding to eels. Only 4%were estuarine species (1% biomass) and together marine estuarine opportunists and anadromous species ac-complished 1% (2 and 6% biomass, respectively). The fish assemblage showed seasonal patterns with a cleardistinction between autumn/winter and spring/summer periods. Significant differences in abundance and bio-
mass were also detected between autumn/winter of 2007/2008 and 2008/2009, i.e., inter-annual variations,with the latter period with lower catches yet higher dominance of NIS. Besides, higher water temperature hada significant negative effect on the observed number of species, but a positive effect on the abundance and
biomass of NIS. More attention has to be given to TFWs and their role in structuring fish assemblages, be-cause this information is vital for a sound management, conservation and restoration of estuarine areas.
Key words: abiotic factors / assemblage / ichthyofauna / Minho estuary / non-indigenous species
Introduction
Estuaries are well-recognized areas of high productiv-ity that support a diversity of species, being alsoresponsible for important ecological functions and services(Little, 2000; Vasconcelos et al., 2007). However, theyhave been subjected to a great variety of human impacts(e.g., pollution, overexploitation, loss of habitat andclimate change), which have caused depletion of numerousformerly important species, destroyed or fragmentedimportant estuarine habitats, such as seagrasses, oysterreefs and marshes, degraded water quality and introducedseveral non-indigenous species (NIS) (Kappel, 2005; Lotzeet al., 2006).
In recent years, there have been numerous studies onestuarine areas, addressing a multitude of ecological sub-disciplines and focusing on a great variety of organisms(Attrill, 2002; Attrill and Rundle, 2002; Sousa et al.,2008a). Most of these studies focused on the lowerestuarine areas, subjected to brackish water conditions,almost ignoring those upstream estuarine areas that stillcontinue to be influenced by tides but are subjected tofreshwater conditions. These tidal freshwater wetlands(TFWs) constitute a particular estuarine habitat wherecharacteristic plant and animal species occur, reflectingthe unique biological, chemical and physical conditions.Productivity of TFWs is similar to that of salt marshes butplant and macrofaunal diversity are higher. Additionally,TFWs provide areas with low tidal influence and essentialpassages for commercially and conservationally important*Corresponding author: [email protected]
Article published by EDP Sciences
Ann. Limnol. - Int. J. Lim. 50 (2014) 185–198 Available online at:� EDP Sciences, 2014 www.limnology-journal.orgDOI: 10.1051/limn/2014012

migratory fish species and offer nursery conditions orrefuges from predators for juvenile fish, molluscs andcrustaceans, provide essential feeding and drinkinggrounds for birds and constitute ideal habitats fornumerous other vertebrate and invertebrate species(Sousa et al., 2008a; Barendregt et al., 2009; Kraus andJones, 2012).
One of the most important faunal groups colonizingestuaries is fishes. In the particular case of TFWs, theseareas may be colonized by estuarine and marine specieswith physiological capacities to tolerate changes insalinity, migratory fish species use TFWs as a passage toupstream areas, and true freshwater species that usuallycolonize upstream estuarine areas (Schuchardt et al., 1993;Roegner et al., 2010). Despite the ecological importance offish species colonizing TFWs, there are still few data andlittle knowledge about the major factors driving spatialand temporal fluctuations in their abundance, biomassand species composition, and the contribution of theseTFWs to the ichthyofauna of the whole estuary or basin.Recognizing this gap in knowledge and consideringthat TFWs have suffered water and habitat degradation,enhanced understanding of the factors that influencespecies distribution are needed. In theory, this informationwill then assist better management, restoration or pro-tection of natural resources and ecosystems (Buisson et al.,2008).
Therefore, the aim of this study was to increase theexisting knowledge about the ichthyofauna from Iberianestuarine TFWs, using the River Minho as a case study. Inrecent years, several studies have investigated the fauna ofthe Minho estuary, namely macroinvertebrates (Sousaet al., 2008b), epibenthos (Costa-Dias et al., 2010) andfishes (Antunes and Rodrigues, 2004). However, these
studies were mostly focused on the lower estuary, andthose regarding fish species were centred on few species(mostly related with professional fishing) and have notconsidered temporal changes; thus River Minho TFWsare currently poorly known. The temporal (seasonal andinter-annual) variation of fish species was analysed, withspecies classified according to their origin (endemic, nativeor non-indigenous), and their ecological and feedingguilds. Observations were further related to water tem-perature, river flow and precipitation, as potentiallyrelevant environmental factors structuring the fishassemblage.
Materials and methods
Study area
The River Minho is an international water body. Thelast 77 km, from its total length of approximately 300 km,are part of the northwestern boundary between Portugaland Spain (Fig. 1). Its drainage basin covers 17 080 km2,and drains to the Atlantic Ocean. The Minho estuary,located on the northwest coast of the Iberian Peninsula(IP), has a total area of 23 km2, a length of about 40 kmand a maximum width of just over 2 km near the mouth.It is a mesotidal estuary with a mean tidal range of 2 m.Salt intrusion extends on average 11.3 km and up to16.8 km inland during higher spring tides (September).Water movements are highly dynamic and the direction ofriver water flow is strongly dependent on the freshwatervolume.
Rainfall in the River Minho basin exhibits strongseasonal and inter-annual variability which is also
Fig. 1. Map of the River Minho estuary (Caminha-Valenca) and the study area showing the TFW semi-enclosed samplinglocation (arrow).
M. Mota et al.: Ann. Limnol. - Int. J. Lim. 50 (2014) 185–198186

reflected in high variability in the discharge regime (Fig. 2).River flow increases usually in autumn or early winter,with a gradual decline during late spring and summer, atypical pattern for Iberian rivers. The annual meanfreshwater flow is 300 m3.sx1 (Ferreira et al., 2003).
The study was conducted in a relatively shallow (depthsranging from 1.5 to 3.0 m), semi-enclosed area located14 km upstream from the mouth of the river (Fig. 1) thatsuffers slight saline influence (<1), especially duringhigher spring tides in the summer/early autumn. This areacovers approximately 0.05 km2 and it is greatly hetero-geneous, with parts covered with submerged vegetation,parts with fine sediments and others with clean sands. Thisheterogeneity at a small scale makes this semi-enclosedarea particularly suitable for the study of temporalchanges in abundance, biomass and diversity of fishspecies.
Sampling strategy
From June 2007 to May 2010, fyke nets were used tocapture fish. These nets have been successfully deployed inmany river conditions, capturing juveniles and adults ofthe large-bodied species and most of the smaller-bodiedspecies (Humphries et al., 2008; Sousa et al., 2013). Thefyke nets (10 mmmesh size, 0.7 m mouth diameter and 7 mlong, 3.5 m central wing) were placed facing downstream,inside the semi-enclosed area and trying to cover max-imum habitat heterogeneity (i.e., sites with submergedvegetation, without submerged vegetation and with fine,medium and coarse sediments). The content of at leastthree fyke nets (the content of five fyke nets was collectedin approximately 65% of deployments) was collected andconserved in a 40 L portable tank which was previouslyfilled with water. The empty nets were placed again inthe water after content removal until next collection.Samplings took place in a weekly basis (7.8¡0.4 days
between samplings, mean¡SE, n=141). Fish total weightwas measured in situ to the nearest 1 g using a digital Kern440-53N (maximum 6000 g) scale or to the nearest 0.01 gusing a digital Sartorius (maximum 420 g) scale, depend-ing on the fish size. Every fish was identified to the specieslevel.
Water temperature and salinity were measured everytime the fyke nets content were collected (see above), usinga multiparametrical sea gauge YSI 6820.
Discharge data for the Minho River were supplied bythe Confederacion Hidrografica del Mino-Sil (Ministeriode Medio Ambiente y Medio Rural y Marino – SpainGovernment), concerning the Frieira dam discharge andare presented in cubic decameters (dam3).
Precipitation data were obtained from the availableinternet data set of the Monte Aloia (Galicia, Spain)meteorological station.
Data analysis
Temporal variation was assessed in terms of abun-dance, biomass, diversity and richness, distinguishingendemic, native and NIS.
Each fish species was assigned to one of the followingecological guilds (adapted from Thiel and Potter, 2001):marine stragglers (MS; species that are typically foundirregularly and in small numbers in estuaries and usuallyin areas of high salinity); marine estuarine opportunists(MO; species that are often abundant in estuariesparticularly as juveniles); marine opportunistic residents(OR, species that are often abundant in estuaries but thatcan also reach and spend relative long periods in fresh-water); estuarine species (ES; species which can completethe whole life cycle in estuaries); diadromous species, beingeither catadromous (CA; species which spawn at sea andfeed mainly in freshwater) or anadromous (AN; specieswhich spawn in fresh water and feed mainly in marine
0
50
100
150
200
0
100
200
300
400
Jan Feb Mar Apr May Jun Jul Aug Sep Oct Nov Dec
river
flow
(104
dam
3 )
prec
ipita
tion
(mm
)
precipitation
river flow
Fig. 2. Two-decades (1990–2009) discharges and precipitation patterns of the River Minho.
M. Mota et al.: Ann. Limnol. - Int. J. Lim. 50 (2014) 185–198 187

waters), and freshwater species (FW; which are typicallylimited to rivers, but occasionally can enter estuariesduring heavy freshwater flooding or are able to inhabit theTFWs).
Food preferences of each species were classified in ninefeeding guilds adapted from Elliott and Dewailly (1995)and Elliott and Hemingway (2002). Guilds include speciesfeeding on plankton (P), invertebrates (I), plants (V),invertebrates and fishes (IF), or detritus (D); parasiticspecies (PS; i.e., feeding on other fish); carnivorousspecies (CS); species that are partly herbivorous, partlycarnivorous but not omnivorous (HC); and omnivorousspecies (OV).
Analyses were based on monthly mean fish abundanceand biomass, with fish catches standardized by dividingfish abundance and biomass by the number of fyke netsand number of days fishing (ind per fyke-net per day andg per fyke-net per day). Univariate analyses include alsoShannon–Wiener (H’) and Pielou’s evenness (J’) indicesusing the PRIMER v5 package (Clarke and Warwick,2001). The overall comparisons of variables (abundance,biomass, type and ecological guild, equitability, diversity,
water temperature, precipitation and river flow) betweenyears were performed with the STATISTICA v12 (StatsoftInc.) software using the non-parametric Kruskal–Walliscomparison of mean ranks of groups. Possible effects oftemperature, river flow or precipitation on fish abundanceand biomass, type of fish and ecological guilds wereanalysed with simple linear regressions. Multivariateanalyses were used to study variations in the fishassemblage. Non-metric Multidimensional Scaling(NMDS), based on Bray Curtis distances, was applied tolog-transformed monthly mean abundance (Field et al.,1982). These data were subsequently plotted to show fishspecies distribution in the ordination space. They werefurther analysed with hierarchical agglomerative cluster-ing, usingWard’s minimum variance method (Ward, 1963;Becker et al., 1988). An analysis of similarity (ANOSIM)was applied to the groups defined by the Cluster analysis,and the similarities percentages procedure (SIMPER) wasused to assess the species contributing most to similaritywithin groups with PRIMER v5 package (Clarke andWarwick, 2001). Other analyses were performed in R(R Development Core Team, 2009; Oksanen et al., 2010).
0
5
10
15
20
25
Apr
-07
Jul-0
7
Oct
-07
Jan-
08
Apr
-08
Jul-0
8
Oct
-08
Jan-
09
Apr
-09
Jul-0
9
Oct
-09
Jan-
10
Apr
-10
tem
pera
ture
(°C
)
0
50
100
150
200
0
100
200
300
400
Apr
-07
Jul-0
7
Oct
-07
Jan-
08
Apr
-08
Jul-0
8
Oct
-08
Jan-
09
Apr
-09
Jul-0
9
Oct
-09
Jan-
10
Apr
-10
river
flow
(104
dam
3 )
prec
ipita
tion
(mm
)
precipitation
river flow
A
B
Fig. 3.Water temperatures measured at the TFW (A) and the River Minho discharge from Frieira dam and precipitation measured atMonte Aloia (Galicia, Spain) (B).
M. Mota et al.: Ann. Limnol. - Int. J. Lim. 50 (2014) 185–198188

Table 1. List of species catalogued for the Minho estuary (Antunes and Rodrigues, 2004; Costa-Dias et al., 2010) and their presence
in different estuarine habitats.
Scientific name Type Ecological guild Feeding guild
Presence
Lower estuary TFWsFamily AmmodytidaeAmmodytes tobianus N MS P X
Family AnguillidaeAnguilla anguilla N CA IF X X
Family AtherinidaeAtherina boyeri N ES I,P X X
Family BalistidaePseudobalistes flavimarginatus N MS I X
Family BelonidaeBelone belone N MS IF X
Family BothidaeArnoglossus laterna N MS IF X
Family CallionymidaeCallionymus lyra N MS I X
Family CarangidaeTrachurus trachurus N MS IF X
Family CentrarchidaeLepomis gibbosusa NIS FW I,P XMicropterus salmoides NIS FW CS,I X
Family ClupeidaeAlosa alosa N AN P X Xb
Alosa fallax N AN P X Xb
Sardina pilchardus N MS P XFamily CobitidaeCobitis paludica N FW I,V X
Family CyprinidaeAchondrostoma arcasii E FW I,P XCarassius auratus NIS FW HC XCyprinus carpio NIS FW OV XGobio lozanoi NIS FW I XPseudochondrostoma duriense E FW I,V XSqualius carolitertii E FW CS XTinca tinca NIS FW OV X
Family GasterosteidaeGasterosteus gymnurus N FW I X X
Family GobiidaeAphia minuta N MS I,P XGobius niger N MS I,P XPomatoschistus lozanoi N MS I,P XPomatoschistus microps N ES I,P XPomatoschistus minutus N MO I,P XPomatoschistus pictus N MS I,P X
Family LotidaeCiliata mustela N MO IF X
Family MoronidaeDicentrarchus labrax N MO IF X XDicentrarchus puntactus
Family Mugilidae N MS IF XChelon labrosus N MO I,D,V X Xb
Liza aurata N MO P,V X XLiza ramada N OR D,P,V X XMugil cephalus N MO P,V X X
Family PetromyzontidaePetromyzon marinus N AN Ps X X
Family PleuronectidaePlatichthys flesus N OR I X X
Family PoeciliidaeGambusia holbrooki NIS ES I,D,P X Xb
M. Mota et al.: Ann. Limnol. - Int. J. Lim. 50 (2014) 185–198 189

Results
Water temperature showed a seasonal pattern, withmonthly means oscillating between 9.3 and 23.8 xC and amean value for the 3 years of sampling at 15.9 xC(Fig. 3(A)). Rainfall and river flow varied considerably,with peaks between late autumn and spring (Fig. 3(B)).Monthly mean precipitation ranged from 3 to 443 mm,with a mean of 154 mm, and river discharge from 91281 to1829 908 dam3, with a mean of 641 599 dam3.
A total of 13 229 fish were collected during thestudy period, representing 11 families and 21 species(Table 1). Six of these species were NIS, although for thespecies Lepomis gibbosus (Linnaeus, 1758) just oneindividual was captured, which is the first report ofthe species in the Minho estuary. Approximately half ofthe fish species described in River Minho are also presentin the TFWs.
In terms of species contribution for each ecologicalguild, 82.3% (61.1% biomass) were freshwater species,which included all the NIS, 13.2% were catadromous(30.5% biomass), 3.6% were estuarine (0.7% biomass),0.7% were anadromous (5.9% biomass) and 0.2%were marine estuarine opportunist (1.8% biomass)(Table 1).
Concerning the feeding guilds, most of the species fedat least on invertebrates (12 species, including three NIS).Additionally, six of those species complemented their dietwith plankton or fish (three species each, Table 1).
The mean abundance was usually higher in spring andsummer (Fig. 4(A)) and number of species tended to behigher in winter, with a maximum monthly mean value of12 species in January 2009. The Shannon–Wiener diversityindex and Pielou’s evenness index were usually higherin autumn although a great variability was observed in thelast sampling year (Fig. 5). The most frequently capturedspecies were Cobitis paludica (de Buen, 1930) (34.4% ofthe total abundance), Gasterosteus gymnurus (Cuvier,1829) (15.6%), Achondrostoma arcasii (Steindachner,1866) (11.8%) and Anguilla anguilla (Linnaeus, 1758)(8.5%), all native or endemic.
NIS comprised 15.3% of all fish caught, includingCyprinus carpio (Linnaeus, 1758) and Tinca tinca(Linnaeus, 1758) (4.7% each), followed by Gobio lozanoi(Doadrio and Madeira, 2004) (3.3%) and Micropterussalmoides (Lacepede, 1802) (2.5%). Regarding biomass,T. tinca was the dominant species (35.4% of total biomass)followed by A. anguilla (24.0%), C. carpio (8.0%) andC. paludica (7.4%).
Considering the three sampling years separately(each from June to May of the following year) there seemsto be a general downward trend in fish abundance andbiomass (Table 2). The biomass of the first sampled year(2007/2008) was exceptionally high comparing to the twofollowing years (Fig. 4(B)). The proportion and overallbiomass of NIS was relatively stable during the studyperiod, except for T. tinca which in the first year wasfairly higher than in the other two years (the mean
Table 1. (Contd)
Scientific name Type Ecological guild Feeding guild
Presence
Lower estuary TFWsFamily SalmonidaeSalmo salar N AN CS X Xb
Salmo trutta fario N FW IF XSalmo trutta trutta N AN CS X X
Family ScophthalmidaeScophthalmus rhombus N MS IF X
Family SparidaeDiplodus sargus N MS OV X
Family SoleidaeSolea solea N MO I X
Family SygnathidaeNerophis lumbriciformis N MO IF XSyngnathus abaster N MS I XSyngnathus acus N MO IF XSyngnathus typhle N MS IF X
Family TrachinidaeEchiichthys vipera N MS IF X
Family TriglidaeChelidonichthys lucerna N MS IF X
Type (N: native; E: endemic; NIS: non-indigenous species), Ecological Guild (modified from Thiel and Potter, 2001; MS: marinestragglers; MO: marine estuarine opportunist; OR: marine opportunistic resident; AN: anadromous; CA: catadromous; ES: estuarineand FW: freshwater fish), Feeding Guild (adapted from Elliott and Dewailly, 1995 and Elliott and Hemingway, 2002) P: feeding onplankton; I: invertebrates; IF: invertebrates and fish; V: plants; D: detritivorous fish; Ps: parasitic fish; CS: carnivorous fish; HC: partlyherbivorous, partly carnivorous but not omnivorous and OV: omnivorous fish).aSpecies not established.bSpecies present in the TFWs, but not sampled in this study (authors’ unpublished data).
M. Mota et al.: Ann. Limnol. - Int. J. Lim. 50 (2014) 185–198190

monthly biomass were 41.7, 23.6, 17.9% of the totalbiomass for each year). The 2007/2008 biomass valueswere highly influenced by T. tinca and A. anguilla (themean monthly biomass were 56.2¡19.5 and 32.4¡10.5 gper fyke-net per day mean¡SE, respectively). In thefollowing year, mean biomass of these species were13.1¡6.5 and 12.0¡2.2 g/fyke-net dx1, and in the thirdyear were 8.3¡7.0 and 11.8¡2.6 g per fyke-net per day,respectively.
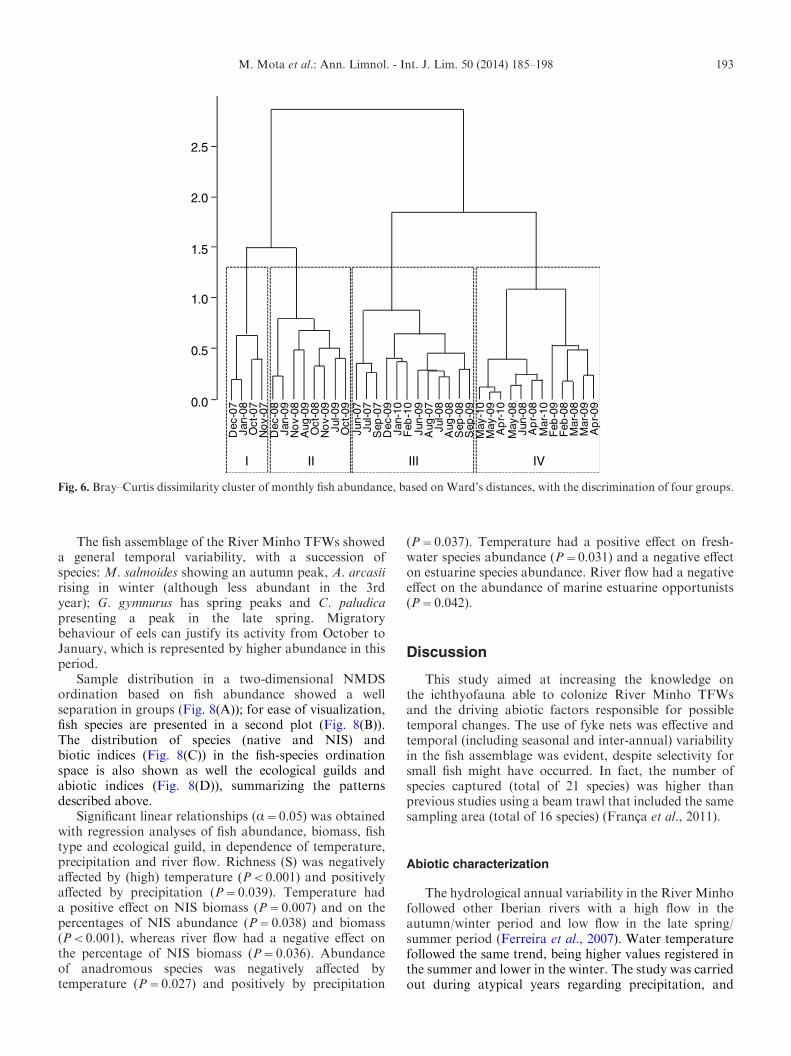
Cluster analysis based on the Bray–Curtis similaritymatrix of abundance revealed four groups (Fig. 6).Group I contains the samples from October 2007 toJanuary 2008; Group II contains samples from October2008 to January 2009 and from July 2009 to November2009 (except September 2009); Group III contains
samples from the 2007, 2008 and 2009 summers (exceptJuly and August 2009) and from the 2010 winter;and Group IV contains samples from the three springperiods. According to the ANOSIM analysis, these groupswere distinct (global R=0.745, P<0.001; pair-wise tests0.565jRj0.950, 0.001jPj0.003). The species contri-buting most to the within-group similarities were, forGroup I, A. anguilla (contributing 20.8%), A. arcasii(19.7%), G. lozanoi (13.8%), Atherina boyeri Risso,1810 (10.9%) and Platichthys flesus (Linnaeus, 1758)(10.8%); for Group II, C. paludica (22.4%), C. carpio(20.1%), A. anguilla (14.3%) and M. salmoides (13.2%);for Group III, C. paludica (52.0%), A. anguilla (11.6%)and C. carpio (10.1%); and for Group IV, C. paludica(46.8%) and G. gymnurus (31.4%). Groups were
0
3
6
9
12
0
2
4
6
8
Apr
-07
Jul-0
7
Oct
-07
Jan-
08
Apr
-08
Jul-0
8
Oct
-08
Jan-
09
Apr
-09
Jul-0
9
Oct
-09
Jan-
10
Apr
-10
nu
mbe
r of f
ish
spe
cies
abu
nda
nce
(ind/
fyke
-net
s/da
ys)
all
native
NIS
S
0
100
200
300
400
Apr
-07
Jul-0
7
Oct
-07
Jan-
08
Apr
-08
Jul-0
8
Oct
-08
Jan-
09
Apr
-09
Jul-0
9
Oct
-09
Jan-
10
Apr
-10
biom
ass
(g/fy
ke-n
ets/
days
)
all
native
NIS
A
B
Fig. 4. Monthly mean fish abundance (A) and biomass (B), considering all species (All), native (native) and NIS (NIS) separately, and
mean number of species (S) (plot A, right axis).
M. Mota et al.: Ann. Limnol. - Int. J. Lim. 50 (2014) 185–198 191

characterized by different temperatures and river flow(Fig. 7). Group II (i.e., the second winter, summerand autumn observations) had the lowest fishabundance and biomass; Group I (the first winter)
higher biomass and Group IV (spring samples) highabundance and number of species, with higher river flow.Group IV had also clearly less NIS, both in abundanceand biomass.
0
1
2
3
4
0.00
0.25
0.50
0.75
1.00
Apr
-07
Jul-0
7
Oct
-07
Jan-
08
Apr
-08
Jul-0
8
Oct
-08
Jan-
09
Apr
-09
Jul-0
9
Oct
-09
Jan-
10
Apr
-10
Div
ersi
ty in
dex
Equ
itabi
lity
J
H
Fig. 5. Equitability (J) and Shannon-Wiener (H) indices of the River Minho TFWs fish assemblage.
Table 2. Inter-annual differences in fish abundance (ind per fyke-net per day) and biomass (g per fyke-net per day), type andecological guild, equitability, diversity, water temperature, precipitation and river flow.
Sampling year Kruskal–Wallis ANOVA
2007/2008 2008/2009 2009/2010 H Pn 68 33 40
Abundance All 3.51¡0.22c 3.09¡0.40 2.5¡0.32a 9.86 0.007Native 2.89¡0.22 2.64¡0.40 2.24¡0.34 5.66 –NIS 0.62¡0.06c 0.45¡0.07 0.26¡0.04a 20.20 0.000MO 0.01¡0.00 0.00¡0.00 0.00¡0.00 5.19 –CA 0.69¡0.06b,c 0.31¡0.03a 0.22¡0.03a 36.19 0.000AN 0.03¡0.01 0.01¡0.00c 0.03¡0.01b 7.30 0.026ES 0.30¡0.07b,c 0.00¡0.00a 0.06¡0.02a 31.56 0.000FW 2.48¡0.18 2.76¡0.00340 2.19¡0.30 2.42 –
Biomass All 146.7¡18.2b,c 57.6¡6.6a 48.3¡7.3a 34.34 0.000Native 71.3¡7.2b,c 36.4¡3.7a 36.8¡4.4a 18.45 0.000NIS 75.4¡13.2b,c 21.3¡6.4a,c 11.5¡6.4a,b 37.97 0.000MO 2.9¡1.0 1.5¡1.4 0.0¡0.1 5.26 –CA 44.2¡6.2b,c 16.5¡1.9a 16.6¡2.3a 15.90 0.000AN 7.7¡2.2 1.4¡0.5 5.9¡1.4 6.70 –ES 1.3¡0.3b,c 0.0¡0.0a 0.3¡0.1a 33.36 0.000FW 90.6¡13.2b,c 38.2¡5.9a 25.5¡6.5a 30.44 0.000
S 9.3¡0.3c 8.2¡0.4 8¡0.3a 10.04 0.007J 0.75¡0.02c 0.69¡0.02 0.65¡0.03a 11.03 0.004H 1.7¡0.0b,c 1.4¡0.1a 1.3¡0.1a 20.44 0.000Water temperature ( xC) 15.7¡1.2 16.4¡1.3 15.3¡1.5 0.027 –Precipitation (mm) 153¡28 119¡24 191¡42 1.33 –River flow (104 dam3) 52.2¡8.8 66.2¡13.4 74.1¡14.1 1.51 –
n: number of samples; MO, marine estuarine opportunists; CA, catadromous; AN, anadromous; ES, estuarine; FW, freshwaterspecies; J, Pielou’s evenness index; S, number of species; H, Shannon–Wiener diversity index; H, Kruskal–Wallis test value.Mean¡SE. a, b and c indicate the existence of significant differences with 2007/2008, 2008/2009 and 2009/2010 seasons, respectively,for a P value below 0.05.
M. Mota et al.: Ann. Limnol. - Int. J. Lim. 50 (2014) 185–198192
The fish assemblage of the River Minho TFWs showeda general temporal variability, with a succession ofspecies: M. salmoides showing an autumn peak, A. arcasiirising in winter (although less abundant in the 3rdyear); G. gymnurus has spring peaks and C. paludicapresenting a peak in the late spring. Migratorybehaviour of eels can justify its activity from October toJanuary, which is represented by higher abundance in thisperiod.
Sample distribution in a two-dimensional NMDSordination based on fish abundance showed a wellseparation in groups (Fig. 8(A)); for ease of visualization,fish species are presented in a second plot (Fig. 8(B)).The distribution of species (native and NIS) andbiotic indices (Fig. 8(C)) in the fish-species ordinationspace is also shown as well the ecological guilds andabiotic indices (Fig. 8(D)), summarizing the patternsdescribed above.
Significant linear relationships (a=0.05) was obtainedwith regression analyses of fish abundance, biomass, fishtype and ecological guild, in dependence of temperature,precipitation and river flow. Richness (S) was negativelyaffected by (high) temperature (P<0.001) and positivelyaffected by precipitation (P=0.039). Temperature hada positive effect on NIS biomass (P=0.007) and on thepercentages of NIS abundance (P=0.038) and biomass(P<0.001), whereas river flow had a negative effect onthe percentage of NIS biomass (P=0.036). Abundanceof anadromous species was negatively affected bytemperature (P=0.027) and positively by precipitation
(P=0.037). Temperature had a positive effect on fresh-water species abundance (P=0.031) and a negative effecton estuarine species abundance. River flow had a negativeeffect on the abundance of marine estuarine opportunists(P=0.042).
Discussion
This study aimed at increasing the knowledge onthe ichthyofauna able to colonize River Minho TFWsand the driving abiotic factors responsible for possibletemporal changes. The use of fyke nets was effective andtemporal (including seasonal and inter-annual) variabilityin the fish assemblage was evident, despite selectivity forsmall fish might have occurred. In fact, the number ofspecies captured (total of 21 species) was higher thanprevious studies using a beam trawl that included the samesampling area (total of 16 species) (Franca et al., 2011).
Abiotic characterization
The hydrological annual variability in the River Minhofollowed other Iberian rivers with a high flow in theautumn/winter period and low flow in the late spring/summer period (Ferreira et al., 2007). Water temperaturefollowed the same trend, being higher values registered inthe summer and lower in the winter. The study was carriedout during atypical years regarding precipitation, and
2.5
2.0
1.5
1.0
0.5
0.0
Dec
-07
Jan-
08O
ct-0
7N
ov-
07D
ec-0
8Ja
n-09
No
v-08
Aug
-09
Oct
-08
No
v-09
Jul-0
9O
ct-0
9Ju
n-07
Jul-0
7S
ep-0
7D
ec-0
9Ja
n-10
Feb
-10
Jun-
09A
ug-0
7Ju
l-08
Aug
-08
Sep
-08
Sep
-09
May
-10
May
-09
Ap
r-10
May
-08
Jun-
08A
pr-
08M
ar-1
0F
eb-0
9F
eb-0
8M
ar-0
8M
ar-0
9A
pr-
09
I II III IV
Fig. 6. Bray–Curtis dissimilarity cluster of monthly fish abundance, based on Ward’s distances, with the discrimination of four groups.
M. Mota et al.: Ann. Limnol. - Int. J. Lim. 50 (2014) 185–198 193

while the first winter was dry, followed by a normal spring,the second winter was wet followed by a dry spring and thethird autumn was particularly wet. Differences betweenprecipitation and river flow in autumn 2007, spring 2008and autumn 2009 were evident, which seems related withdam operations.
The marked seasonal and inter-annual variability ofprecipitation regime are key factors structuring freshwater
fish assemblages in Mediterranean streams (Magalhaeset al., 2002) which is also evident in Minho TFWs(this work). For example, higher water temperatures hada significant negative effect on the observed numberof species, but a positive effect on the abundance andbiomass of NIS. Although this study just comprises a3 years, it seems that water temperature increase willbenefit the presence of NIS.
I II III IV
10
15
20
I II III IV
0
100
200
300
400
I II III IV
50
100
150
I II III IV
1
2
3
4
5
6
7
I II III IV0.00
0.01
0.02
0.03
0.04
I II III IV
6
7
8
9
10
11
12
I II III IV
0
10
20
30
40
50
60
I II III IV
0
20
40
60
80
Temperature (°C) Precipitation (mm) River flow (104 dam3)
Abundance (ind/fyke net/day) Biomass (g/fyke net/day) No. Species
%NIS Abundance %NIS Biomass
Fig. 7.Monthly data for each of the four groups based on cluster discrimination; boxplots show median values (central line), the rangefrom the first to the third quartile (box), Tuckey whiskers and outliers (dots).
M. Mota et al.: Ann. Limnol. - Int. J. Lim. 50 (2014) 185–198194

Biotic characterization
Forty-three per cent of the total number of fish speciesdescribed previously in the Minho estuary (49 accordingwith Antunes and Rodrigues, 2004 and Costa-Dias et al.,2010) were captured in the TFWs. A strong dominance offreshwater species and the occurrence of four of the fiveendemic species and six of the seven non-indigenous fishspecies previously described in all drainage basin wererecorded. Cyprinidae and Cobitidae were the most com-mon families and followed other studies performed inseveral Iberian streams (e.g., Hernando and Soriguer,1992; Encina et al., 2006).
Three species appeared recently in the River Minhoand their presence should be discussed following theirecological significance: the Southern Iberian spined-loach(C. paludica), the Pyrenean gudgeon (G. lozanoi) andthe Pumpkinseed sunfish (L. gibbosus). The SouthernIberian spined-loach (C. paludica) inhabits several riversin Central and Southern Iberian and is considered
an endemism of IP (Doadrio et al., 2011). However, thepresence of this species in the River Minho basin has beenrecently described for the first time; in the tributary RiverTea by Xunta de Galicia (1996) and in a small pond in aMinho TFW area by Cigona and Ferreira (1996). Thisspecies remained restricted to a small area in the followingyears until the floods of 2000/2001, when its distributionrange increased considerably, and currently it covers RiverMinho TFWs. Owing to the Iberian status of this species,we have assumed it like a IP translocated endemic speciesfrom nearby catchment areas, in agreement with Doadrio(2002). Recent consensus suggests that Adour (France)and Bidasoa (Spain) drainages constitute the native areaof G. lozanoi and this species is known to have beenintroduced in many Iberian drainage basins since 19thcentury mediated by human activities (Leunda et al.,2009). The genus Gobio was only firstly described in the1990s for River Minho TFWs (Antunes and Rodrigues,2004) and in different tributaries of the River Minhoin Galicia (Xunta de Galicia, 2007), thus, we assumed
M. salmoides
A. arcasii
C. carpioA. anguilla
S. carolitertii
G. gymnurus
G. lozanoiA. boyeri
C. auratus
P. flesus
L. ramada
M. cephalus
S. trutta f.
S. trutta t.
C. paludica
Cluster ICluster IICluster IIICluster IV
06/07
07/07
08/07
09/07
10/0711/07
12/0701/08
02/08
03/08
04/08
05/08 06/08
07/0808/08
09/0810/08
11/08
12/08
01/09
02/09
03/09
04/09
05/09 06/09
07/09
08/09
09/0910/09
11/09
12/09
01/10
02/10
03/1004/10
05/10
MOCA
AN
ES
FW
TEMP
PRECFLOW
NativeNIS
S
N
J
H
%NIS
A B
C D
Fig. 8. NMDS ordination of the monthly fish abundance samples with: (A) distribution of the samples marked according to the
identified groups; (B) distribution of the fish species (species occurring in less than 4 months and species with very little effect in theordination were omitted in the plot); (C) distribution native fish and NIS abundance, percentage NIS, evenness and diversity indices inthe ordination space; (D) distribution of ecological guilds (MO, marine estuarine opportunists; ES, estuarine; CA, catadromous; AN,anadromous and FW, freshwater species), water temperature (TEMP), precipitation (PREC) and river flow (FLOW) in the ordination
space.
M. Mota et al.: Ann. Limnol. - Int. J. Lim. 50 (2014) 185–198 195

this species as NIS in this river in the present study.Lepomis gibbosus was also captured and described forthe first time in this study area. Although this species isnot established in the River Minho main channel,according to information provided by Xunta de Galiciathis NIS is already established in the Minho tributariesAvia and Lona (Cachamuina and Castadon dams,respectively).
In the River Minho TFWs, six ecological guilds werepresent (within a total of seven described for the wholeestuary) including freshwater fish which were the highestin number, followed by catadromous, estuarine, anadro-mous and marine estuarine opportunist fish. Data fromMay and July 2006, covering the entire River Minhoestuarine gradient, showed higher proportion of marineseasonal migrants (Franca et al., 2011). Owing to its highsalinity dependence, this group was not present in ourstudy and such differences show the importance to coverall estuarine area when the aim is to study the variability ofthe intra-estuarine fish assemblages assess. The absence ofmarine estuarine opportunist species in TFWs is highlydependent of river flow which in turn positively affects theanadromous fish species.
Invertebrates are crucially important for wetlandsbecause of their central position in food webs (Batzeret al., 1999) and most of the ichthyofauna captured in theRiver Minho TFW fed on those species. Additionally,carnivorous species (one NIS, two migratory and onenative freshwater species) were also captured. In this sense,M. salmoides is one of the oldest introductions in the RiverMinho and before the 1990s colonized the same habitat ofSqualius carolitertii (Doadrio, 1988) in the study area,belonging both to the same feeding guild. After introduc-tion of omnivorous cyprinids both species abundancedecreased and even S. carolitertii has almost disappearedfrom this area (Antunes, personal observation).
Overall, the most important differences between thefish assemblage of the whole Minho estuary and thetypical European estuarine fish assemblage (Elliott andDewailly, 1995) are a smaller number of estuarine residentspecies, a greater percentage of freshwater species and asmaller proportion of benthic species (Table 1).
Ecological significance
Aquatic ecosystems have been subjected to numerousthreats such as loss and/or fragmentation of habitats,pollution, channelization, overexploitation of resourcesand introduction of NIS (Mota et al., 2014). In the RiverMinho TFWs particularly important are the impactsimposed by the construction of dams in upstream areasand the introduction of several NIS (Sousa et al., 2008a).The dams control the river flow in a non-natural way andthis situation may influence the fish assemblage. Althoughnon-indigenous fish species do not reach dramatic num-bers in River Minho as in several Iberian rivers (Elvira andAlmodovar, 2001), they are still matters of concern.Most of these species were recently introduced, and in the
River Minho TFWs, three new NIS are described in thisstudy when comparing with earlier data (Antunes, 1990;Antunes and Weber, 1990), namely C. carpio, and T. tinca,in addition to one specimen of L. gibbosus. The numberof established non-indigenous fish species in IP rangesbetween 28 and 38 (Cobo et al., 2010; Leunda, 2010;Doadrio et al., 2011). Cobo et al. (2010) found delays forintroduction in Galicia (further NW region of IP) up to100 years for species introduced in the IP at the beginningof the 20th century. However, species introduced in the IPafter 1995 are almost immediately present in Galicia. TheMinho drainage basin is almost exclusively located in thisregion which explains that 80% of the NIS present inGalicia are also present in the River Minho. Moreover, itwill be highly likely that the Minho drainage basin willface additional introductions in the future.
The native freshwater fish fauna of IP is characterizedby a low number of families with a great predominanceof species belonging to the Cyprinidae family. However,due to its isolation, orographic and climatic peculiarities,IP is well known for its high degree of biodiversity atthe species level and has the greatest European percentageof endemic freshwater fish fauna (Hernando andSoriguer, 1992; Encina et al., 2006). Our study supportsthese findings and several fish species described in thisstudy are also considered endemic for the IP (e.g.,A. arcasii, Pseudochondrostoma duriense (Coelho, 1985),S. carolitertii and C. paludica).
Conclusion
The results clearly show a temporal dynamics in thefish assemblage present in the River Minho TFWs. Theinformation gathered in this study is very important andtherefore, TFWs should also be considered in futuremanagement plans concerning the River Minho estuary.More attention has to be given to TFWs and their rolestructuring fish assemblages because this information maybe vital for conservation and restoration of estuarineareas. Indeed, the understanding of the relationshipsbetween fish assemblages and environmental variations isof particular relevance for conserving the Iberian ichthyo-fauna biodiversity, which includes a high number ofendemisms.
Acknowledgements. The authors would like to thank RodrigoLopez for the study area map arrangement and EduardoMartinsfor the field work assistance. This research was partially
supported by the European Regional Development Fund(ERDF) through the COMPETE – OperationalCompetitiveness Programme and national funds through FCT– Foundation for Science and Technology, under the project
PEst-/MAR/LA0015/2013.
References
Antunes C., 1990. Abundancia, distribuicao sazonal e diversi-dade da fauna ictiologica do estuario do rio Minho
M. Mota et al.: Ann. Limnol. - Int. J. Lim. 50 (2014) 185–198196
(“Abundance, seasonal distribution and diversity of ichthyo-fauna in River Minho estuary” in Portuguese), InstitutoCiencias Biomedicas Abel Salazar, University of Porto,Portugal, 90 p.
Antunes C. and Rodrigues H., 2004. Guia natural do Rio Minho– Os Peixes (“Natural guide of River Minho – fish”, inPortuguese), Aquamuseu do Rio Minho. Camara Municipalde Vila Nova de Cerveira. Vila Nova de Cerveira, Portugal,84 p.
Antunes J.C. and Weber M., 1990. A pesca profissional noestuario do rio Minho-resultados da pesca experimental(“The professional fisheries in River Minho estuary –experimental fisheries results” in Portuguese). Proceedingsof the 1st Symposium on Protection and Revaluation ofMinho – Liz section, 16–31.
Attrill M.J., 2002. A testable linear model for diversity trends inestuaries. J Anim. Ecol., 71, 262–269.
Attrill M.J. and Rundle S.D., 2002. Ecotone or ecocline:ecological boundaries in estuaries. Estuar. Coast. Shelf S.,55, 929–936.
Barendregt A., Whigham D. and Baldwin A. (eds.), 2009. TidalFreshwater Wetlands, Backhuys Publishers, Leiden, 320 p.
Batzer D.P., Radar R.B. and Wissinger S.A., 1999. Invertebratesin Freshwater Wetlands of North America: Ecology andManagement, John Wiley & Sons, USA.
Becker R.A., Chambers J.M. and Wilks A.R., 1988. The New SLanguage. Wadsworth & Brooks/Cole (S version), PacificGrove, CA, USA.
Buisson L., Blanc L. and Grenouillet G., 2008. Modelling streamfish species distribution in a river network: the relative effectsof temperature versus physical factors. Ecol. Freshw. Fish, 17,244–257.
Cigona E.F. and Ferreira S.G., 1996. Peces desconocidos daGalicia, la lamprehuela iberica Cobitis calderoni en las aguasdel bajo Mino (“Unknown fish of Gallician, Iberian loachCobitis calderoni in Mino estuary waters” in Spanish).Proceedings of the 1st Iberian Symposium of River MinhoHydrological Basin, Portugal, 65–71.
Clarke K.R. and Warwick R.M., 2001. Change in MarineCommunities: an Approach to Statistical Analysis andInterpretation (2nd edn), PRIMER-E Ltd, PlymouthMarine Laboratory, Plymouth.
Cobo F., Vieira-Laneiro R. and Servia M.J., 2010. Temporaltrends in non-indigenous freshwater species records duringthe 20th century: a case study in the Iberian Peninsula.Biodivers. Conserv., 19, 3471–3487.
Costa-Dias S., Freitas V., Sousa R. and Antunes C., 2010.Factors influencing epibenthic assemblages in the Minhoestuary (NW Iberian Peninsula). Mar. Pollut. Bull., 61,240–246.
Doadrio I., 2002. Atlas y Libro Rojo de los Peces Continentalesde Espana (“Atlas and Red Book of Continental fish ofSpain” in Spanish). Direccion General de Conservacion de laNaturaleza/Museo Nacional de Ciencias Naturales-CSIC,Madrid, 364 p.
Doadrio I., Perea S., Garzon-Heydt P., Gonzalez J.L., 2011.Ictiofauna Continental Espanola (“Spanish ContinentalIchthyofauna” in Spanish), DG Medio Natural y PolıticaForesta. MARM, Madrid. ISBN:978-84-491-1158-7.
Elliott M. and Dewailly F., 1995. The structure and componentsof European estuarine fish assemblages. Neth. J. Aquat.Ecol., 29, 397–417.
Elliott M. and Hemingway K.L. (eds.), 2002. Fishes in Estuaries,Blackwell Science, Oxford, 636 p.
Elvira B. and Almodovar A., 2001. Freshwater fish introductionsin Spain: facts and figures at the beginning of the 21stcentury. J. Fish Biol., 59, 323–331.
Encina L., Rodrıguez A. and Granado-Lorencio C., 2006. TheIberian ichthyofauna: ecological contributions. Limnetica,25(1–2), 349–368.
Ferreira J.G., Simas T., Nobre A., Silva M.C., Shifferegger K.and Lencart-Silva J., 2003. Identification of sensitive areasand vulnerable zones in transitional and coastal Portuguesesystems. Application of the United States NationalEstuarine Eutrophication Assessment to the Minho, Lima,Douro, Ria de Aveiro, Mondego, Tagus, Sado, Mira,Ria Formosa and Guadiana systems. INAG/IMAR ISBN972-9412-66-9.
Ferreira M.T., Sousa L., Santos J.M., Reino L., Oliveira J.,Almeida P.R. and Cortes R.V., 2007. Regional and localenvironmental correlates of native Iberian fish fauna. Ecol.Freshwat. Fish, 16, 504–514.
Field J.G., Clarke K.R. and Warwick R.M., 1982. A practicalstrategy for analysing multispecies distribution patterns.Mar. Ecol. Prog. Ser., 8, 37–52.
Franca S., Costa M.J. and Cabral H.N., 2011. Inter- and intra-estuarine fish assemblage variability patterns along thePortuguese coast. Estuar. Coast. Shelf S., 91, 262–271.
Hernando J.A. and Soriguer M.C., 1992. Biogeography ofthe freshwater fish of the Iberian Peninsula. Limnetica, 8,243–253.
Humphries P., Brown P., Douglas J., Pickworth A.,Strongman R., Hall K. and Serafini L., 2008. Flow-relatedpatterns in abundance and composition of the fish fauna ofa degraded Australian lowland river. Freshwat. Biol., 53,789–813.
Kappel C., 2005. Losing pieces of the puzzle: threats to marine,estuarine, and diadromous species. Front. Ecol. Environ., 3,275–282.
Kraus R.T. and Jones R.C., 2012. Fish abundances in shorelinehabitats and submerged aquatic vegetation in a tidal fresh-water embayment of the Potomac River. Environ. Monit.Assess., 184(5), 3341–3357.
Leunda P.M., 2010. Impacts of non-native fishes on Iberianfreshwater ichthyofauna: current knowledge and gaps.Aquat. Invasions, 5(3), 239–262.
Leunda P.M., Elvira B., Ribeiro F., Miranda R., Oscoz J.,Alves M.J., Collares-Pereira M.J., 2009. International stan-dardization of common names for Iberian endemic fresh-water fishes. Limnetica, 28, 189–202.
Little C., 2000. The Biology of Soft Shores and Estuaries, OxfordUniversity Press, New York.
Lotze H., Lenihan H., Bourque B., Bradbury R., Cooke R.,Kay M., Kidwell S., Kirby M., Peterson C. and Jackson J.,2006. Depletion, degradation, and recovery potential ofestuaries and coastal seas. Science, 312, 1806–1809.
Magalhaes M.F., Batalha D.C. and Collares-Pereira M.J., 2002.Gradients in stream fish assemblages across a Mediterraneanlandscape: contributions of environmental factors andspatial structure. Freshwat. Biol., 47, 1015–1031.
Mota M., Sousa R., Araujo J., Braga C. and Antunes C., 2014.Ecology and conservation of freshwater fish: time to act for amore effective management. Ecol. Freshwat. Fish, 23,111–113.
M. Mota et al.: Ann. Limnol. - Int. J. Lim. 50 (2014) 185–198 197

Oksanen J., Blanchet F.G., Kindt R., Legendre P.,O’Hara R.B., Simpson G.L., Solymos P., Stevens M.H. andWagner H., 2010. Community Ecology Package. R packageversion 1, 17–4. WWW Page, http://CRAN.R-project.org/package=vegan.
R Development Core Team, 2009. R: A Language andEnvironment for Statistical Computing, R Foundation forStatistical Computing, Vienna, Austria, WWW Page, http://www.R-project.org.
Roegner G.C., Dawley E.W., Russell M., Whiting A. andTeel D.J., 2010. Juvenile salmonid use of reconnectedtidal freshwater wetlands in Grays River, lowerColumbia River basin. Trans. Am. Fish. Soc., 139,1211–1232.
Schuchardt B., Haesloop U. and Schirmer M., 1993. The tidalfreshwater reach of the Weser estuary: riverine or estuarine?Neth. J. Aquat. Ecol., 27, 215–226.
Sousa R., Dias S., Guilhermino L. and Antunes C., 2008a.Minho River tidal freshwater wetlands: threats to faunalbiodiversity. Aquat. Biol., 3, 237–250.
Sousa R., Dias S., Freitas V. and Antunes C., 2008b. Subtidalmacrozoobenthic assemblages along the River Minhoestuarine gradient (north-west Iberian Peninsula). Aquat.Conserv., 18, 1063–1077.
Sousa R., Freitas F., Nogueira A.J.A., Mota M. and Antunes C.,2013. Invasive dynamics of the crayfish Procambarus clarkii(Girard, 1852) at the international section of the RiverMinho (NW of the Iberian Peninsula). Aquat. Conserv., 23,656–666.
Thiel R. and Potter I.C., 2001. The ichthyofaunal composition ofthe Elbe estuary: an analysis in space and time. Mar. Biol.,138, 603–616.
Vasconcelos R.P., Reis-Santos P., Fonseca V., Maia A.,RuanoM., Franca S., Vinagre C., Costa M.J. and Cabral H.,2007. Assessing anthropogenic pressures on estuarine fishnurseries along the Portuguese coast: a multi-metric indexand conceptual approach. Sci. Total Environ., 374, 199–215.
Ward J.H., 1963. Hierarchical grouping to optimize an objectivefunction. J. Am. Stat. Assoc., 58, 236–244.
Xunta de Galicia, 1996. Inventario piscıcola-1995: cuencas de losrios Mandeo, Eo, Arnoia, Tea, Lerez y Ulla (“Fish inventory– 1995: drainages of Rivers Mandeo, Eo, Arnoia, Tea, Lerezand Ulla” in Spanish). Centro de Investigacions Forestais,Lourizan, Pontevedra, 107 p.
Xunta de Galicia, 2007. Plan de ordenacion dos recursospiscıcolas (“Management plan of fish resources” inSpanish). Conselleria de Medio Ambiente eDesenvolvemento Sostible, Santiago de Compostela.
M. Mota et al.: Ann. Limnol. - Int. J. Lim. 50 (2014) 185–198198