seawater density variations in the north atlantic and the ... density variations in the north...
TRANSCRIPT
Seawater density variations in the North Atlantic and the Atlanticmeridional overturning circulation
Chunzai Wang Æ Shenfu Dong Æ Ernesto Munoz
Received: 17 October 2008 / Accepted: 18 March 2009 / Published online: 8 April 2009
� Springer-Verlag 2009
Abstract Seawater property changes in the North
Atlantic Ocean affect the Atlantic meridional overturning
circulation (AMOC), which transports warm water north-
ward from the upper ocean and contributes to the temperate
climate of Europe, as well as influences climate globally.
Previous observational studies have focused on salinity and
freshwater variability in the sinking region of the North
Atlantic, since it is believed that a freshening North
Atlantic basin can slow down or halt the flow of the
AMOC. Here we use available data to show the importance
of how density patterns over the upper ocean of the North
Atlantic affect the strength of the AMOC. For the long-
term trend, the upper ocean of the subpolar North Atlantic
is becoming cooler and fresher, whereas the subtropical
North Atlantic is becoming warmer and saltier. On a
multidecadal timescale, the upper ocean of the North
Atlantic has generally been warmer and saltier since 1995.
The heat and salt content in the subpolar North Atlantic
lags that in the subtropical North Atlantic by about
8–9 years, suggesting a lower latitude origin for the tem-
perature and salinity anomalies. Because of the opposite
effects of temperature and salinity on density for both long-
term trend and multidecadal timescales, these variations do
not result in a density reduction in the subpolar North
Atlantic for slowing down the AMOC. Indeed, the varia-
tions in the meridional density gradient between the
subpolar and subtropical North Atlantic Ocean suggest that
the AMOC has become stronger over the past five decades.
These observed results are supported by and consistent
with some oceanic reanalysis products.
1 Introduction
The North Atlantic Ocean is a critical region for the
Atlantic meridional overturning circulation (AMOC) since
its variability can change seawater properties in the North
Atlantic regions of deep-water formation and thus affects
the strength of the AMOC. The AMOC, through its
northward transport of warm tropical waters by the Gulf
Stream and North Atlantic Current, effectively contributes
to the temperate climate of Europe, as well as influences
climate globally (e.g., Vellinga and Wood 2002; Dong and
Sutton 2002; Timmermann et al. 2007; Schmittner et al.
2007). In addition, the North Atlantic also hosts a climate
phenomenon known as the Atlantic multidecadal oscilla-
tion (AMO), a fluctuating climate mode wherein the sea
surface temperature (SST) can vary on multidecadal
timescales of 30–80 years with the largest variations cen-
tered in the high latitudes of the North Atlantic (e.g.,
Delworth and Mann 2000; Enfield et al. 2001; Wang et al.
2008a). It is shown that the AMOC is a driving mechanism
for the AMO (e.g., Delworth and Mann 2000; Knight et al.
2005; Dijkstra et al. 2006; Zhang et al. 2007). The SST
variability of the AMO is associated with changes of cli-
mate and extreme weather events such as rainfall and
drought/flood in North America and Atlantic hurricane
activity (e.g., Enfield et al. 2001; McCabe et al. 2004;
Goldenberg et al. 2001; Bell and Chelliah 2006; Wang
et al. 2008a). Thus, improving our understanding of North
C. Wang (&)
Physical Oceanography Division, NOAA Atlantic
Oceanographic and Meteorological Laboratory, 4301
Rickenbacker Causeway, Miami, FL 33149, USA
e-mail: [email protected]
S. Dong � E. Munoz
Cooperative Institute for Marine and Atmospheric Studies,
University of Miami, Miami, FL, USA
123
Clim Dyn (2010) 34:953–968
DOI 10.1007/s00382-009-0560-5

Atlantic variability is very important both scientifically and
socially.
There are many papers in the literature that examine
variability in the North Atlantic Ocean. For observational
studies of the AMO, focuses are mainly on SST variability
probably owing to its relatively long record that is required
for a multidecadal timescale study. For observational
studies related to the AMOC, attentions are paid to salinity
and freshwater variability in the sinking region of the North
Atlantic (e.g., Dickson et al. 2002; Curry et al. 2003; Boyer
et al. 2007), since it is believed that a freshening North
Atlantic basin can slow down or halt the flow of the
AMOC. For example, Dickson et al. (2002) have reported
by using hydrographic records that the high latitudes of the
North Atlantic gradually become fresher during the past
decades. Curry et al. (2003) have examined salinity and
temperature difference between the periods of 1985–1999
and 1955–1969. However, Curry et al.’s approach could
not show the AMO signal since the period of 1985–1999
covers both the positive and negative phases of the AMO.
In addition, we should keep in mind that the ocean
meridional overturning circulation is density-driven. The
density of seawater is determined by both salinity and
temperature. The saltier the denser, and the warmer the
lighter. Saltier water is denser than fresher water because
the dissolved salts fill interstices between water molecules,
resulting in more mass per unit volume. Warmer seawater
expands and is thus less dense than cooler seawater. It thus
seems that the analyses of salinity, temperature and density
variability in the North Atlantic are necessary for us to
understand the AMOC.
The purpose of the present paper is to analyze
available oceanic data in the North Atlantic Ocean dur-
ing the past decades. This paper makes several
contributions. First, we calculate potential density from
the available salinity and temperature data, and then
analyze co-variability of salinity, temperature and density
on timescales of the long-term trend (related to global
warming) and multidecadal variation (i.e., the AMO).
Second, we show different features of North Atlantic
Ocean variability on the long-term trend and multideca-
dal timescales, and quantify the salinity and temperature
contributions to potential density variability in the upper
ocean of the North Atlantic. Third, we show that the
AMO signal can reach deeper than just SST manifesta-
tion (previous observational studies have focused on the
AMO using SST data) and the AMO signal is also
manifested in the upper ocean salinity of the North
Atlantic. Fourth, we observe that the temperature and
salinity anomalies in the subpolar North Atlantic Ocean
lag those in the subtropical North Atlantic Ocean by
about 8–9 years. Fifth, we show with assistance of oce-
anic reanalysis products that the strength of the AMOC
may be related to the meridional density gradient
between the subpolar and subtropical North Atlantic
Ocean, and that the AMOC may have strengthened
during the past decades.
The paper is organized as follows. Section 2 describes
the data sets, oceanic reanalysis products (or oceanic model
data) and methods used in this study. Section 3 shows the
mean states of the North Atlantic Ocean. Sections 4 and 5
show variability of temperature, salinity and density in the
North Atlantic Ocean for the long-term trend and multi-
decadal timescales, respectively. Section 6 discusses the
relationship between the AMOC and the meridional den-
sity gradient between the subpolar and subtropical North
Atlantic Ocean. Section 7 provides a summary and
discussion.
2 Datasets, reanalysis products and methods
The temperature and salinity dataset is the World Ocean
Database 2005 from the National Oceanographic Data
Center (Boyer et al. 2005 and 2006), which contains the
data in the World Ocean Database 2001 (Conkright et al.
2002) plus the data collected afterwards. The temperature
data has two parts: one is the annual mean and the other
one is anomaly. The temperature anomaly is calculated
by subtracting the appropriate monthly temperature cli-
matology from each temperature profile and then
performing an objective mapping and a yearly average.
The yearly temperature data covers the period from 1955
to 2003 and its horizontal resolution is on a 1.0� 9 1.0�latitude–longitude grid. The yearly temperature data is
over the upper ocean from the sea surface to 700 m at
standard depth levels of 0, 10, 20, 30, 50, 75, 100, 125,
150, 200, 250, 300, 400, 500, 600, and 700 m. Due to
the non-uniform vertical grid, a layer thickness weighted
average is performed when data are averaged over
depths of 0–700 m.
The salinity data also has two parts: the annual mean
and anomaly fields. The anomaly is pentadal for the peri-
ods 1955–1959 to 2002–2006. Assigning the time to be the
center of each 5-year window, we can obtain the salinity
anomaly field covering from 1957 to 2004. Both the mean
and anomalous salinity fields are on a 1.0� 9 1.0� latitude–
longitude grid at standard depth levels from the sea surface
to 3,000 m. To consider co-variability of temperature and
salinity fields, we choose the study period from 1957 to
2003 and the upper ocean of the North Atlantic from the
sea surface to 700 m.
Three ocean reanalysis products are also used in this
study: the Simple Ocean Data Assimilation (SODA)
(Carton and Giese 2008), the German Estimating the Cir-
culation and Climate of the Ocean (GECCO) (Kohl et al.
954 C. Wang et al.: Seawater density variations
123

2006), and the Geophysical Fluid Dynamics Laboratory
(GFDL) (Rosati et al. 2004). The SODA uses an ocean
general circulation model to assimilate available tempera-
ture and salinity observations. The product is a gridded
dataset of oceanic variables with monthly values at a
0.5� 9 0.5� latitude–longitude horizontal resolution and 40
vertical levels. The version 2.0.2 of the SODA is used, with
the temperature, salinity and meridional ocean velocity
covering from 1958 to 2005. Since the SODA product
does not have the density field, we use temperature and
salinity fields to calculate potential density relative to the
sea surface. The GECCO is also a monthly product from
1952 to 2001, with a 1.0� 9 1.0� latitude–longitude
horizontal resolution and 23 vertical levels. The GFDL
ocean product is from 1960 to 2004, with a 1.0� 9 1.0�latitude–longitude horizontal resolution (enhanced to
1/3� 9 1/3� in the tropics between 30�S and 30�N) and
50 vertical levels.
Another dataset used in this study is evaporation minus
precipitation (E-P) from the Southampton Oceanography
Center freshwater flux climatology version 1.1. The cli-
matological data is determined from in situ meteorological
reports in the Comprehensive Ocean Atmosphere Dataset
(COAD) covering the period of 1980–1993 (Josey et al.
1998). Both evaporation and precipitation rates are on a
1.0� 9 1.0� latitude–longitude grid.
Given the salinity and temperature data, we can calcu-
late potential density rh. Total (mean ? anomaly) salinity
and temperature data were used to compute potential
density relative to the sea surface at each grid point for the
period 1957–2003. SEAWATER, a computational routine
for calculating potential density, is used to determine total
potential density. The routine is based on Gill (1982) and is
developed by Australia’s Commonwealth Scientific and
Industrial Research Organization. The mean and anoma-
lous potential densities are then calculated based on the
total density from 1957 to 2003.
In this paper, we also estimate the relative contributions
of salinity and temperature fluctuations to potential density
variability. Salinity contributions are calculated by using
the mean temperature and total salinity fields, whereas
temperature contributions are calculated by using the total
temperature and mean salinity fields. Mathematically, we
separate the potential density variability (Drh) into the
contributions made by both salinity (DrhS) and temperature
(DrhT) fluctuations:
Drh ¼ orh=oSð ÞDSþ orh=oTð ÞDT � DrSh þ DrT
h : ð1Þ
As a traditional way to examine the AMOC, we
calculate the streamfunction of the AMOC from ocean
velocity distribution. In this paper, the streamfunction of
the AMOC is calculated from the meridional velocity
v(x,y,z,t) of the ocean reanalysis products as:
Wðy; z; tÞ ¼Z�z
�H
ZXEAST
XWEST
vðx; y; z; tÞdx dz; ð2Þ
where H is the sea bottom, XWEST is the ocean western
boundary, and XEAST is the ocean eastern boundary.
3 Mean states
Before we examine the long-term trend and multidecadal
variations, we first discuss the seawater properties of mean
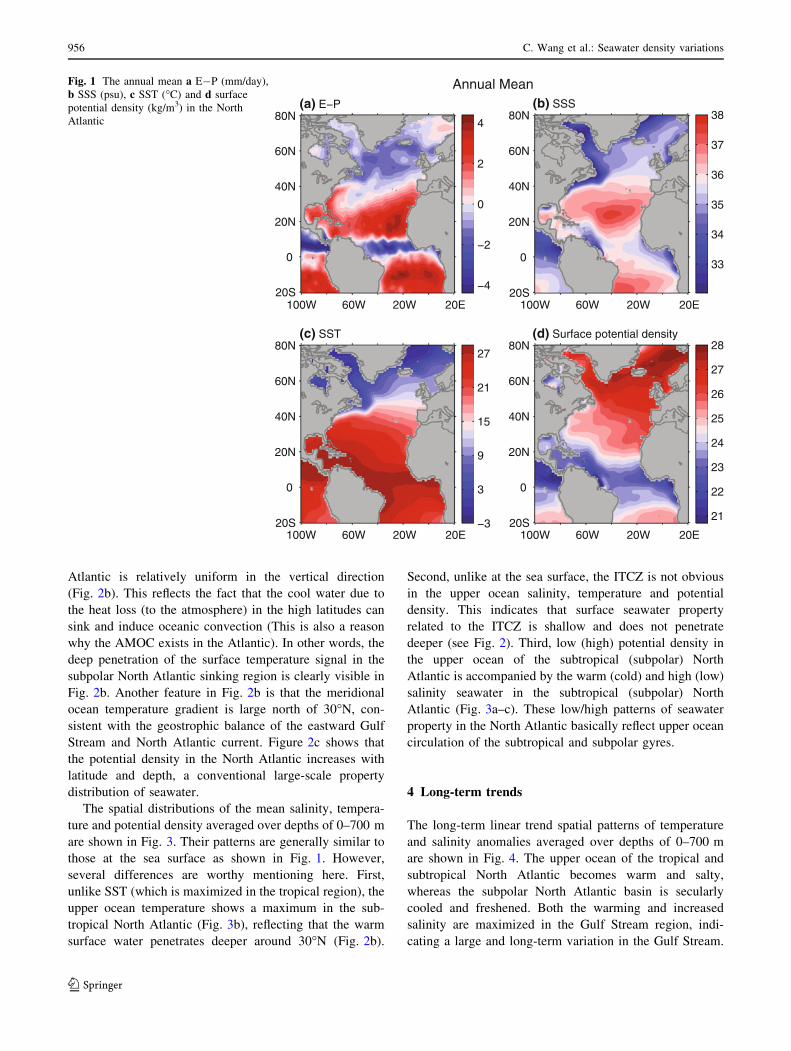
states in the upper ocean of the North Atlantic. Figure 1
shows the annual mean E-P, sea surface salinity (SSS),
SST and surface potential density in the North Atlantic.
Underlying the easterly trade wind belt at the south edge of
the North Atlantic subtropical high, the maximum of E-P
is stretched from the eastern subtropical basin west of the
African continent to the western tropical North Atlantic
and then to the Caribbean Sea, the Gulf of Mexico, and the
U.S. southeastern seaboard. The minimum of E-P is
associated with the Atlantic intertropical convergence zone
(ITCZ) because of a large precipitation and a small wind
speed near the center of the ITCZ. Fresh water is trans-
ported as atmospheric water vapor from the low to high
latitudes where it enters the ocean as precipitation and
continental runoff, and evaporation is decreased poleward.
In consequence, the second minimum of E-P is located in
the high latitudes of the subpolar North Atlantic (Fig. 1a).
Consistent with the maximum of E-P, the maximum SSS
is resided in the subtropical North Atlantic between 15�N
and 40�N (Fig. 1b). The SSS is relatively low in the ITCZ
region and the subpolar North Atlantic. In general, the
surface seawater is warm in the tropical and subtropical
North Atlantic, and cold in the subpolar North Atlantic
because of the poleward decrease in solar radiation. Given
the distribution of SSS and SST in the North Atlantic,
surface potential density is large in the high latitudes and
decreases toward the tropics with a minimum density belt
extended from the eastern ITCZ region to the region of the
Atlantic warm pool (i.e., the western tropical North
Atlantic, the Caribbean Sea and the Gulf of Mexico)
(Fig. 1d).
The above features of salinity, temperature and density
are not limited to the sea surface only. The zonally aver-
aged annual mean salinity, temperature and potential
density as a function of depth and latitude are shown in
Fig. 2. The latitudinal variation of SSS can penetrate
deeply. In particular, the relative maximum salinity in the
subtropical North Atlantic is manifested in the upper layer
of 700 m, despite the maximum value being in the upper
250 m (Fig. 2a). In comparison with that in the tropical
region, the seawater temperature in the subpolar North
C. Wang et al.: Seawater density variations 955
123
Atlantic is relatively uniform in the vertical direction
(Fig. 2b). This reflects the fact that the cool water due to
the heat loss (to the atmosphere) in the high latitudes can
sink and induce oceanic convection (This is also a reason
why the AMOC exists in the Atlantic). In other words, the
deep penetration of the surface temperature signal in the
subpolar North Atlantic sinking region is clearly visible in
Fig. 2b. Another feature in Fig. 2b is that the meridional
ocean temperature gradient is large north of 30�N, con-
sistent with the geostrophic balance of the eastward Gulf
Stream and North Atlantic current. Figure 2c shows that
the potential density in the North Atlantic increases with
latitude and depth, a conventional large-scale property
distribution of seawater.
The spatial distributions of the mean salinity, tempera-
ture and potential density averaged over depths of 0–700 m
are shown in Fig. 3. Their patterns are generally similar to
those at the sea surface as shown in Fig. 1. However,
several differences are worthy mentioning here. First,
unlike SST (which is maximized in the tropical region), the
upper ocean temperature shows a maximum in the sub-
tropical North Atlantic (Fig. 3b), reflecting that the warm
surface water penetrates deeper around 30�N (Fig. 2b).
Second, unlike at the sea surface, the ITCZ is not obvious
in the upper ocean salinity, temperature and potential
density. This indicates that surface seawater property
related to the ITCZ is shallow and does not penetrate
deeper (see Fig. 2). Third, low (high) potential density in
the upper ocean of the subtropical (subpolar) North
Atlantic is accompanied by the warm (cold) and high (low)
salinity seawater in the subtropical (subpolar) North
Atlantic (Fig. 3a–c). These low/high patterns of seawater
property in the North Atlantic basically reflect upper ocean
circulation of the subtropical and subpolar gyres.
4 Long-term trends
The long-term linear trend spatial patterns of temperature
and salinity anomalies averaged over depths of 0–700 m
are shown in Fig. 4. The upper ocean of the tropical and
subtropical North Atlantic becomes warm and salty,
whereas the subpolar North Atlantic basin is secularly
cooled and freshened. Both the warming and increased
salinity are maximized in the Gulf Stream region, indi-
cating a large and long-term variation in the Gulf Stream.
(a) E−P
Annual Mean
100W 60W 20W 20E 20S
0
20N
40N
60N
80N
−4
−2
0
2
4
(b) SSS
100W 60W 20W 20E 20S
0
20N
40N
60N
80N
33
34
35
36
37
38
(c) SST
100W 60W 20W 20E 20S
0
20N
40N
60N
80N
−3
3
9
15
21
27
(d) Surface potential density
100W 60W 20W 20E 20S
0
20N
40N
60N
80N
21
22
23
24
25
26
27
28
Fig. 1 The annual mean a E-P (mm/day),
b SSS (psu), c SST (�C) and d surface
potential density (kg/m3) in the North
Atlantic
956 C. Wang et al.: Seawater density variations
123

Although the mechanisms of the secular warming and
cooling need to be further studied, the warming may be
consistent with expected effects of an increase in green-
house gas concentrations and the cooling may be
suggestive of radiative effects of aerosols and/or oceanic
natural variability (e.g., Santer et al. 2006; Mann and
Emanuel 2006; Hegerl et al. 2007). The salinity trends may
result from many processes such as evaporation, precipi-
tation, ocean circulation and ice melting in the Nordic
Seas. However, the mechanism study of the temperature
and salinity trend patterns in the North Atlantic is beyond
the scope of the present paper.
Given the long-term trend patterns of temperature and
salinity anomalies, Fig. 5a shows the trend of potential
density anomalies averaged over depths of 0–700 m. The
main feature is that the potential density in the subtropical
North Atlantic is secularly decreased (i.e., the seawater
becomes lighter) and the density trend in the subpolar
North Atlantic is relatively small. Since potential density is
determined by both temperature and salinity, we separate
the potential density trend into the contributions by tem-
perature and salinity trends. Figure 5b and c shows that the
potential density trends resulting from the temperature and
salinity trends are opposite. In the subtropical North
Dep
th (
m)
(a) Salinity
Annual Mean
20S 0 20N 40N 60N 80N
−600
−400
−200
0
33
34
35
36
37
Dep
th (
m)
(b) Temperature
20S 0 20N 40N 60N 80N
−600
−400
−200
0
0
6
12
18
24
Dep
th (
m)
(c) Potential density
20S 0 20N 40N 60N 80N
−600
−400
−200
0
<24
25
26
27
28
Fig. 2 The zonally averaged (between 80�W and 20�E) annual mean
a salinity (psu), b temperature (�C), and c potential density (kg/m3) as
a function of depth and latitude
(a) Salinity
Annual Mean
100W 60W 20W 20E 20S
0
20N
40N
60N
80N
34.0
34.5
35.0
35.5
36.0
36.5
(b) Temperature
100W 60W 20W 20E 20S
0
20N
40N
60N
80N
0
5
10
15
20
(c) Potential density
100W 60W 20W 20E 20S
0
20N
40N
60N
80N
25
26
27
28
Fig. 3 The annual mean a salinity (psu), b temperature (�C) and
c potential density (kg/m3) averaged over depths of 0–700 m
C. Wang et al.: Seawater density variations 957
123

Atlantic, warming trend decreases the potential density
(Fig. 5b), whereas greater salinity trend increases the
density (Fig. 5c). Since the warming-induced effect is
larger than that induced by salinity, the net result is a
decrease of the potential density in the subtropical North
Atlantic (Fig. 5a). However, in the subpolar North Atlantic,
cooling trend increases the density and freshening trend
decreases the density. The amplitudes of the increased and
decreased density are in a similar order, thus resulting in a
small value for the potential density trend in the subpolar
North Atlantic (Fig. 5a).
The zonally averaged trends of temperature and salinity
anomalies as a function of depth and latitude are shown in
Fig. 6. The trends do not change sign vertically over almost
all latitudes. The freshening in the subpolar North Atlantic
can reach to a depth of 700 m, whereas increased salinity
in the tropical and subtropical Atlantic is mainly limited to
the upper layer of 200 m (Fig. 6b). This may reflect oce-
anic convective activity in the North Atlantic sinking
region at the higher latitudes. Figure 6a shows an upper
layer warming north of 75�N, indicating that the Nordic
Seas and Arctic Ocean become warmer associated with
global warming. Figure 7 shows the zonally averaged
(a) Temperature
Trend Pattern
100W 60W 20W 20E 20S
0
20N
40N
60N
80N
−0.2
0
0.2
0.4
0.6
(b) Salinity
100W 60W 20W 20E 20S
0
20N
40N
60N
80N
−2
0
2
4
6
Fig. 4 The long-term linear trend patterns of the a temperature
anomalies (�C/decade) and b salinity anomalies (10-2 psu/decade)
averaged over depths of 0–700 m
(a) Potential densityDensity Trend
100W 60W 20W 20E 20S
0
20N
40N
60N
80N
(b) Contribution by temperature
100W 60W 20W 20E 20S
0
20N
40N
60N
80N
(c) Contribution by salinity
100W 60W 20W 20E 20S
0
20N
40N
60N
80N
−0.1 −0.05 0 0.05
Fig. 5 The long-term linear trend patterns of the potential density
anomalies (kg/m3 per decade) averaged over depths of 0–700 m.
Shown are the a total trend of the potential density anomalies,
b potential density trend contributed by temperature trend and
c potential density trend contributed by salinity trend
958 C. Wang et al.: Seawater density variations
123

trends of the potential density anomalies and the potential
density trend contributions by temperature and salinity
trends. The opposite or compensating effect of temperature
and salinity trends on density trend is clearly seen in
Fig. 7b and c. Again, the compensating effect of tempera-
ture and salinity trends on the potential density trend makes
the potential density trend in the subpolar North Atlantic
small. The large decreasing trend of potential density
around 40�N in the upper 700 m reflects the warming-
induced density effect in the regions of the Gulf Stream and
its eastward extension (Figs. 6a, 7b).
5 Multidecadal variability
To clearly show the multidecadal signal, we first remove
the linear trend from the anomaly data at all grids and
depths before the AMO analyses. Previous studies show
that the AMO is an oscillatory mode occurring in the North
Atlantic SST with its largest variation centered in the high
latitudes of the North Atlantic (e.g., Delworth and Mann
2000; Enfield et al. 2001; McCabe et al. 2004; Gray et al.
2004; Wang et al. 2008a). To our knowledge, how the
salinity, density and temperature in the upper ocean of the
North Atlantic vary with the AMO is not documented
previously. Figure 8 shows the time series of temperature,
salinity and potential density anomalies in the subpolar
North Atlantic of 50�N–75�N, 60�W–10�E averaged over
depths of 0–700 m. In addition to SST (as shown
previously, North Atlantic SST is cool during 1970–1994,
and warm before 1970 and after 1995), the AMO signal is
also manifested in the upper ocean temperature of the
subpolar North Atlantic. Interestingly, the salinity anoma-
lies in the upper ocean of the subpolar North Atlantic also
vary with the AMO (Fig. 8a). The upper ocean of the
subpolar North Atlantic is cooler and fresher during the
cool phase of the AMO (1970–1990), whereas it is warmer
and saltier during the warm phases of the AMO (before
1970 and after 1995). These observed features of tempera-
ture and salinity support the hypothesis that the driving
mechanism of the AMO involves fluctuations of the
AMOC (e.g., Delworth and Mann 2000; Knight et al. 2005;
Dijkstra et al. 2006). As the AMOC is enhanced, an
Dep
th (
m)
(a) Temperature
Trend Pattern
20S 0 20N 40N 60N 80N
−600
−400
−200
0
−0.1
0
0.1
0.2
0.3
Dep
th (
m)
(b) Salinity
20S 0 20N 40N 60N 80N
−600
−400
−200
0
<−6
−3
0
3
6
Fig. 6 The zonally averaged (between 80�W and 20�E) long-term
linear trends of the a temperature (�C/decade) and b salinity
anomalies (10-2 psu/decade) as a function of depth and latitude
Dep
th (
m)
(a) Potential densityDensity Trend
20S 0 20N 40N 60N 80N
−600
−400
−200
0
Dep
th (
m)
(b) Contribution by temperature
20S 0 20N 40N 60N 80N
−600
−400
−200
0
Dep
th (
m)
(c) Contribution by salinity
20S 0 20N 40N 60N 80N
−600
−400
−200
0
<−0.06 −0.03 0 0.03 0.06
Fig. 7 The zonally averaged (between 80�W and 20�E) long-term
linear trends of the potential density anomalies (kg/m3 per decade) as
a function of depth and latitude. Shown are the a total linear trend of
potential density anomalies, b potential density trend contributed by
temperature trend and c potential density trend contributed by salinity
trend
C. Wang et al.: Seawater density variations 959
123

increase in heat and salinity occurs in the subpolar ocean
owing to the northward transport of heat and salt from the
subtropical ocean (as shown in the mean states of Figs. 1, 2
and 3, seawater is warm and salty in the subtropical North
Atlantic Ocean). A reduction of the AMOC would result in
the reverse scenario.
However, the potential density anomalies in the upper
ocean of the subpolar North Atlantic do not precisely
coincide with the AMO (Fig. 8b). This occurs because
potential density is dependent on both temperature and
salinity. As shown in Fig. 8c, potential density contribu-
tions from temperature and salinity variations are all
indicative of the AMO signal. Warmer (cooler) ocean
temperature during the warm (cool) phase of the AMO
decreases (increases) potential density, whereas higher
(lower) level of salinity during the warm (cool) phase of
the AMO enhances (reduces) potential density. These
opposite effects determine the variation of the potential
density anomalies in the subpolar North Atlantic. The
competition between temperature and salinity fluctuations
causes the potential density anomalies to differ from the
AMO, although both the temperature and salinity anoma-
lies vary with the AMO. Another feature in Fig. 8 is that
the potential density anomalies follow the contribution by
temperature more closely than that by salinity, indicating
that the density of seawater is more influenced by tem-
perature in the upper ocean of the subpolar North Atlantic.
To examine horizontal and vertical structures in the
upper ocean of the North Atlantic associated with the
AMO, we choose the eight-year period from 1996 to 2003
for the positive AMO phase and the eight-year period from
1976 to 1983 for the negative AMO phase. Figure 9 shows
the temperature and salinity anomaly (averaged over
depths of 0–700 m) difference between the eight years of
positive and negative AMO phases. We also examine the
positive and negative AMO phases separately and find that
their anomaly patterns are basically opposite. As stated
earlier, previous observational studies have focused on the
AMO using SST data (e.g., Delworth and Mann 2000;
Enfield et al. 2001; Gray et al. 2004; Wang et al. 2008a).
Our Fig. 9a shows that the AMO signal can reach deeper
than just SST manifestation: its positive (negative) phase is
associated with a warm (cool) upper ocean in the subpolar
North Atlantic. Along the US east coast and the Gulf
Stream region, the ocean is cool (warm), as the AMO is in
its positive (negative) phase. (Lozier et al. (2008) showed a
warm heat content change in the tropical/subtropical
Atlantic and a cool heat content change in the sub-
polar Atlantic between the periods of 1980–2000 and
1950–1970. However, this does not represent the warming
and cooling of the AMO since these time periods do not
match the positive or negative phases of the AMO). Cor-
responding with the positive (negative) phase of the AMO,
the upper ocean of the subtropical and subpolar North
Atlantic becomes saltier (fresher), except in the Gulf
Stream region where the upper ocean is fresher (saltier)
(Fig. 9b). The differences in temperature and salinity
between the Gulf Stream region and other North Atlantic
regions suggest that the AMO is not a dominant factor in
controlling oceanic temperature and salinity variations in
the Gulf Stream region.
Previous studies have shown that when the AMO is in
its positive (negative) phase, SSTs in the tropical North
Atlantic and Caribbean Sea also become warmer (cooler)
(e.g., Delworth and Mann 2000; Enfield et al. 2001; Gray
et al. 2004; Wang et al. 2008a). However, our Fig. 9a
shows that the upper ocean averaged over depths of
0–700 m in the western tropical North Atlantic and
Caribbean Sea is cool (warm) when the AMO is in its
positive (negative) phase. To investigate why this happens,
we plot the zonally averaged temperature and salinity
1960 1970 1980 1990 2000−0.04
−0.02
0
0.02
0.04
kg m
−3
(b) Potential density
1960 1970 1980 1990 2000
−0.04
−0.02
0
0.02
0.04
kg m
−3
Year
Temperature Contribution Salinity Contribution
(c) Contributions by temperature and salinity
1960 1970 1980 1990 2000
−0.4
−0.2
0
0.2
0.4
Tem
pera
ture
(a) Temperature and salinity
−0.04
−0.02
0
0.02
0.04
Sal
inity
Temperature Salinity
Detrended Anomalies
Fig. 8 The time series of the detrended temperature (�C), salinity
(psu) and potential density (kg/m3) anomalies in the subpolar North
Atlantic Ocean of 50�N–75�N, 60�W–10�E averaged over depths of
0–700 m. Shown are the a temperature (red) and salinity (blue)
anomalies, b potential density anomalies, and c potential density
anomalies contributed by temperature (red) and salinity (blue)
anomalies
960 C. Wang et al.: Seawater density variations
123

anomaly difference between the positive and negative
AMO phases (Fig. 10). Figure 10a shows that the sea
surface and subsurface temperature anomalies in the tropi-
cal region of 5–25�N are out-of-phase; that is, the surface
warming is accompanied by the subsurface cooling. Since
the subsurface cooling effect is larger than the surface
warming, the average temperature over depths of 0–700 m
is cool, as shown in Fig. 9a. The subsurface temperature
cooling in the tropical region associated with the AMO
may result from the AMOC-induced variation through
basin-scale thermocline adjustment by coastal/equatorial
Kelvin and Rossby wave propagations (Zhang 2007).
However, the salinity anomalies do not seem to show an
out-of-phase relationship between the sea surface and
subsurface in the tropical region (Fig. 10b). The positive
(negative) phase of the AMO is accompanied by a fresh
(salty) upper ocean layer in the tropical North Atlantic and
equatorial Atlantic (Fig. 10b).
As discussed earlier, the warmer and/or fresher (cooler
and/or saltier) the seawater, the lighter (denser) its density.
Associated with the AMO, the temperature anomalies in
the upper ocean of the North Atlantic are the same sign as
the salinity anomalies (Fig. 9); that is, the warming
(cooling) is accompanied by an increased (decreased) level
of salinity. This distribution of temperature and salinity
anomaly patterns results in an opposite contribution to the
potential density anomalies by the temperature and salinity
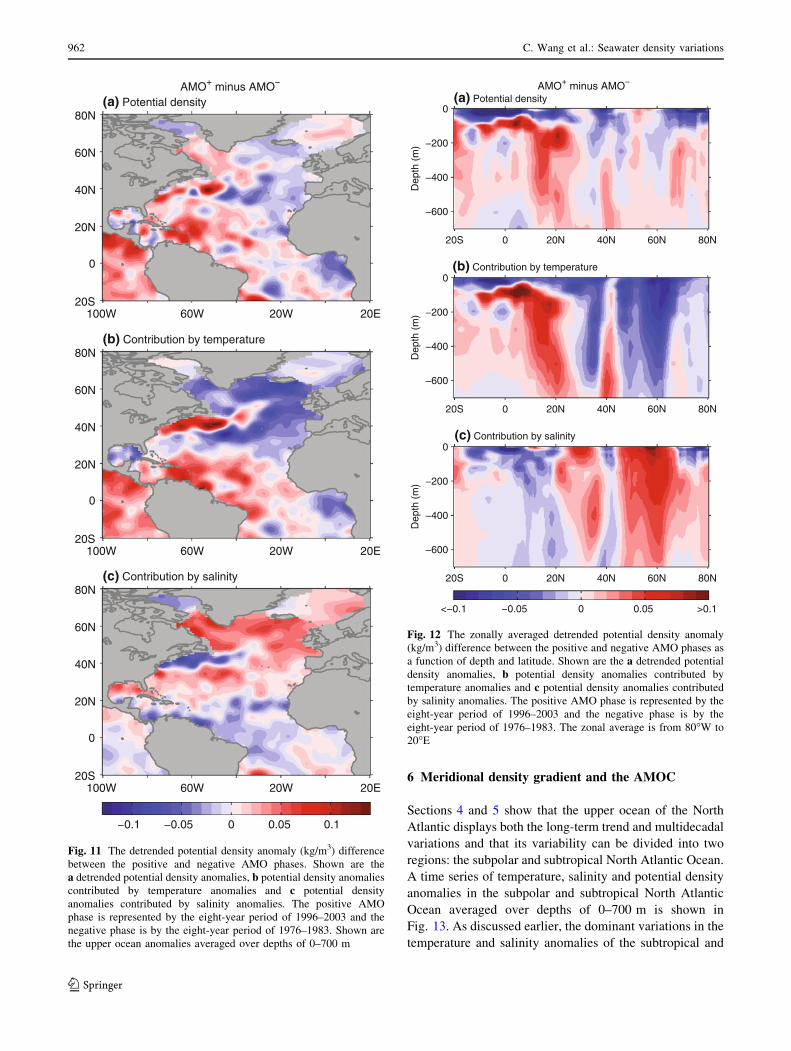
changes, as shown in Fig. 11b and c. It is the competition
between the temperature and salinity effects that determine
the distribution of the potential density anomalies. On
average, the resulting potential density anomalies are
positive in the western part of the North Atlantic and
negative in the eastern part of the subtropical and subpolar
North Atlantic (Fig. 11a).
The zonally averaged potential density anomaly differ-
ence between the eight years of positive and negative AMO
phases and its contributions by temperature and salinity
changes are shown in Fig. 12. Overall, the sea surface of
the North Atlantic is lighter, and the subsurface becomes
denser. The lighter surface water is mainly due to the
surface warming associated with the AMO (Figs. 10a,
12b). The denser subsurface in the tropical North Atlantic
results from the subsurface cooling effect (Figs. 10a, 12b),
whereas the denser subsurface at higher latitudes is mainly
due to the increase in salinity (Figs. 10b, 12c).
(a) Temperature
AMO+ minus AMO−
100W 60W 20W 20E20S
0
20N
40N
60N
80N
−0.8
−0.4
0
0.4
0.8
(b) Salinity
100W 60W 20W 20E20S
0
20N
40N
60N
80N
−0.12
−0.06
0
0.06
0.12
Fig. 9 The detrended a temperature (�C) and b salinity (psu)
anomaly difference between the positive and negative AMO phases.
The positive AMO phase is represented by the eight-year period of
1996–2003 and the negative phase is by the eight-year period of
1976–1983. Shown are the upper ocean anomalies averaged over
depths of 0–700 m
Dep
th (
m)
(a) Temperature
AMO+ minus AMO−
20S 0 20N 40N 60N 80N
−600
−400
−200
0
−0.4
−0.2
0
0.2
0.4
0.6
Dep
th (
m)
(b) Salinity
20S 0 20N 40N 60N 80N
−600
−400
−200
0
<−0.13−0.10
−0.05
0
0.05
0.10
Fig. 10 The zonally averaged detrended a temperature (�C) and
b salinity (psu) anomaly difference between the positive and negative
AMO phases as a function of depth and latitude. The positive AMO
phase is represented by the eight-year period of 1996–2003 and the
negative phase is by the eight-year period of 1976–1983. The zonal
average is from 80�W to 20�E
C. Wang et al.: Seawater density variations 961
123
6 Meridional density gradient and the AMOC
Sections 4 and 5 show that the upper ocean of the North
Atlantic displays both the long-term trend and multidecadal
variations and that its variability can be divided into two
regions: the subpolar and subtropical North Atlantic Ocean.
A time series of temperature, salinity and potential density
anomalies in the subpolar and subtropical North Atlantic
Ocean averaged over depths of 0–700 m is shown in
Fig. 13. As discussed earlier, the dominant variations in the
temperature and salinity anomalies of the subtropical and
(a) Potential densityAMO+ minus AMO−
100W 60W 20W 20E 20S
0
20N
40N
60N
80N
(b) Contribution by temperature
100W 60W 20W 20E 20S
0
20N
40N
60N
80N
(c) Contribution by salinity
100W 60W 20W 20E 20S
0
20N
40N
60N
80N
−0.1 −0.05 0 0.05 0.1
Fig. 11 The detrended potential density anomaly (kg/m3) difference
between the positive and negative AMO phases. Shown are the
a detrended potential density anomalies, b potential density anomalies
contributed by temperature anomalies and c potential density
anomalies contributed by salinity anomalies. The positive AMO
phase is represented by the eight-year period of 1996–2003 and the
negative phase is by the eight-year period of 1976–1983. Shown are
the upper ocean anomalies averaged over depths of 0–700 m
Dep
th (
m)
(a) Potential densityAMO+ minus AMO−
20S 0 20N 40N 60N 80N
−600
−400
−200
0
Dep
th (
m)
(b) Contribution by temperature
20S 0 20N 40N 60N 80N
−600
−400
−200
0
Dep
th (
m)
(c) Contribution by salinity
20S 0 20N 40N 60N 80N
−600
−400
−200
0
<−0.1 −0.05 0 0.05 >0.1
Fig. 12 The zonally averaged detrended potential density anomaly
(kg/m3) difference between the positive and negative AMO phases as
a function of depth and latitude. Shown are the a detrended potential
density anomalies, b potential density anomalies contributed by
temperature anomalies and c potential density anomalies contributed
by salinity anomalies. The positive AMO phase is represented by the
eight-year period of 1996–2003 and the negative phase is by the
eight-year period of 1976–1983. The zonal average is from 80�W to
20�E
962 C. Wang et al.: Seawater density variations
123

subpolar North Atlantic Ocean are the long-term trends and
the AMO signal. A close examination of Figs. 13a and b
shows that the switch time from the AMO cool to warm
phases (i.e., the temperature and salinity curves cross the
zero line) for the subtropical North Atlantic occurs about
8–9 years earlier than that for the subpolar North Atlantic.
This seems to indicate that the temperature and salinity
anomalies in the subpolar North Atlantic lag those in the
subtropical North Atlantic by about 8–9 years, suggesting
that the anomaly signal at the higher latitudes originates
from a lower latitude through oceanic advection. This new
finding provides an observational evidence for previous
1960 1970 1980 1990 2000−0.4
−0.2
0
0.2
0.4(a) Temperature
Subtropical NA
Subpolar NA
1960 1970 1980 1990 2000−0.04
−0.02
0
0.02
0.04(b) Salinity
1960 1970 1980 1990 2000
−0.06
−0.03
0
0.03
0.06
(c) Density
1960 1970 1980 1990 2000
−0.06
−0.03
0
0.03
0.06
(d) Density contributions in subpolar NA
Contribution by temperature Contribution by salinity
1960 1970 1980 1990 2000
−0.06
−0.03
0
0.03
0.06
(e) Density contributions in subtropical NA
1960 1970 1980 1990 2000
−0.06
−0.03
0
0.03
0.06
(f) Meridional density gradient
Fig. 13 The time series of the temperature (�C), salinity (psu) and
potential density (kg/m3) anomalies in the upper ocean (0–700 m) of
the North Atlantic. Shown are a the temperature anomalies in the
subtropical (red) and subpolar (blue) North Atlantic, b the salinity
anomalies in the subtropical (red) and subpolar (blue) North Atlantic,
c the potential density anomalies in the subtropical (red) and subpolar
(blue) North Atlantic, d the potential density anomalies contributed
by temperature (red) and salinity (blue) in the subpolar North
Atlantic, e the potential density anomalies contributed by temperature
(red) and salinity (blue) in the subtropical North Atlantic, and f the
meridional potential density gradient between the subpolar and
subtropical North Atlantic. The straight line in f is the linear trend
which exceeds the 99% significance level. The subpolar and
subtropical North Atlantic are defined in the regions of 50�N–75�N,
60�W–10�E and 25�N–50�N, 60�W–10�E, respectively
C. Wang et al.: Seawater density variations 963
123

numerical model studies that contend that the northward
advection of salinity and temperature anomalies influences
on AMOC’s variability (Latif et al. 2000; Thorpe et al.
2001; Vellinga and Wu 2004; Yin et al. 2006; Krebs and
Timmermann 2007).
Warmer (cooler) ocean temperature decreases (increa-
ses) potential density, whereas higher (lower) level of
salinity enhances (reduces) potential density. The compe-
tition between temperature and salinity fluctuations causes
the potential density anomalies to differ from the AMO,
although both the temperature and salinity anomalies vary
with the AMO. Figure 13c and e also shows that the
potential density anomalies in the subtropical North
Atlantic are dominated by temperature anomaly contribu-
tion, indicating that the density of seawater is less
influenced by salinity when the temperature is warm.
In some cases, the potential density anomalies in the
subpolar North Atlantic Ocean tend to vary out-of-phase
with those in the subtropical North Atlantic Ocean
(Fig. 13c). That is, when the upper ocean density is
increased (decreased) in the subpolar North Atlantic, the
density is approximately decreased (increased) in the sub-
tropical North Atlantic. Regardless of whether the out-of-
phase relationship occurs, a meridional density gradient
between the subpolar and subtropical North Atlantic Ocean
can be formed (Fig. 13f). The meridional density gradient
over the past five decades displays an upward trend with
larger positive values since the 1990s. The upward trend
exceeds the 99% significance level.
Theories and numerical models have been used to sug-
gest that the strength of the meridional overturning
circulation is proportional to the north–south pressure or
density contrast between the Northern and Southern
Hemispheres (e.g., Stommel 1961; Bryan and Cox 1967;
Hughes and Weaver 1994; Park 1999; Scott et al. 1999;
Thorpe et al. 2001; Kuhlbrodt et al. 2007). Based on the
observed patterns presented here, we hypothesize that the
strength of the AMOC is related to the meridional density
gradient between the subpolar and subtropical North
Atlantic Ocean. To test this hypothesis, we used oceanic
reanalysis products to calculate the streamfunction of the
AMOC as shown by Eq. 2. Figure 14 shows the mean
streamfunction from the SODA, GECCO, and GFDL ocean
reanalysis products. Although each product displays dif-
ferent distributions and amplitudes of streamfunction, they
all show a large-scale flow of the AMOC which is repre-
sented by a clockwise circulation cell consisting of an
upper layer northward flow, a sinking flow in the northern
high latitudes, and a southward return flow at depth.
The maximum streamfunction at 30�N is chosen to
represent the AMOC’s strength. The time series of the
AMOC’s strength from three products are shown in
Fig. 15. Over the past decades the AMOC has not slowed
down in all of three products; rather, they all show upward
trends. The result is opposite to that of Bryden et al. (2005)
who claimed that the AMOC has been slowed down. The
linear upward trends in Fig. 15 are all statistically signifi-
cant at the 95% level. The upward trend rate for the
ensemble average of three products is 0.0039 Sv/month or
0.47 Sv/decade (1 Sv = 106 m3/s). That is, the AMOC has
been secularly strengthened since 1950 at an increased rate
of about 0.5 Sv for every decade. However, we should
keep in mind that whether or not the AMOC shows an
upward trend may depend on the time period of oceanic
reanalysis products (e.g., Rabe et al. 2008) and oceanic
reanalysis products used (e.g., Balmaseda et al. 2007).
(a)
(b)
(c)
Fig. 14 The mean streamfunction (Sv) calculated from the a SODA,
b GECCO, and c GFDL ocean reanalysis products. The AMOC is
represented by a clockwise circulation cell consisting of an upper
layer northward flow, a sinking flow in the northern high latitudes and
a southward return flow at depth
964 C. Wang et al.: Seawater density variations
123

To examine the relationship between the AMOC and
meridional density gradient, we use the SODA reanalysis
from 1974 to 2005 (we skip the model data before 1974
since they show unexpected variations of the AMOC and
observations are more after the 1970s) which assimilate
available temperature and salinity observations. Consistent
with the observed result shown in Fig. 13f, the meridional
density gradient between the subpolar and subtropical
North Atlantic from the SODA product also displays an
upward trend with larger positive values in the 1990s (not
shown). Figure 16 shows the scatter plot of the AMOC’s
strength versus the meridional density gradient between the
subpolar and subtropical North Atlantic Ocean. The
AMOC’s strength is strongly related to the meridional
density gradient between the subpolar and subtropical
North Atlantic Ocean, with a correlation coefficient of 0.52
(above the 99% significance level). If the SODA time
series are extended back to 1958, the correlation is still
significant in spite of with a correlation reduction. This
indicates that the meridional density gradient may be a
driving force for the AMOC in the SODA reanalysis
product, consistent with the observed features reported in
this paper.
7 Summary and discussion
The paper uses observational data over the past five deca-
des to analyze variability of temperature, salinity and
density in the upper ocean of the North Atlantic. The
analyses of these observations, along with oceanic
Fig. 15 The time series of the
maximum streamfunction (Sv)
at 30�N from the SODA,
GECCO, and GFDL ocean
reanalysis products. The black
curve is the ensemble average of
three products. The straight
lines are the linear trends that
are fitted to their respective time
series. An 11-month running
mean is applied to the indices
−0.04 −0.02 0 0.02 0.04 0.06 0.0810
11
12
13
14
15
16
17
18
19
Density gradient (kg/m3)
AM
OC
str
engt
h (S
v)
R=0.52
Fig. 16 The scatter plot of the AMOC strength (Sv; 1 Sv = 106 m3/s)
versus the meridional potential density gradient (kg/m3) between the
subpolar and subtropical North Atlantic Ocean, calculated from the
SODA reanalysis from 1974 to 2005. The AMOC strength is measured
by the maximum streamfunction at 30�N. The meridional potential
density gradient is computed by the potential density anomaly (after
removing seasonal cycle) difference between the regions of 60�W–
10�W, 52�N–75�N and 70�W–10�W, 25�N–50�N. An 11-month
running mean is applied to both indices before the scatter plot. The
straight line represents the linear regression
C. Wang et al.: Seawater density variations 965
123

reanalysis products, provide some insights on the Atlantic
meridional overturning circulation (AMOC). The major
results and findings of the present paper can be summarized
as follows:
• For the long-term trend (related to global warming), the
upper ocean of the subpolar North Atlantic is becoming
cooler and fresher, whereas the subtropical North
Atlantic is becoming warmer and saltier. Owing to
opposite contributions by temperature and salinity
trends, the density trend in the subpolar North Atlantic
is small and the density in the subtropical North
Atlantic is secularly decreased.
• On a multidecadal timescale, both the temperature and
salinity anomalies in the upper ocean of the North
Atlantic show the AMO signal with a warmer and saltier
ocean after 1995. However, the density anomalies in the
North Atlantic Ocean do not precisely coincide with the
AMO because of the compensating effect of temperature
and salinity on the potential density.
• These variations do not result in a density reduction in
the subpolar North Atlantic for slowing down the
AMOC. Indeed, the variations in the meridional density
gradient between the subpolar and subtropical North
Atlantic Ocean suggest that the AMOC has become
stronger over the past decades. A further analysis of
some oceanic reanalysis products supports these
observed results.
• The temperature and salinity anomalies in the subpolar
North Atlantic seem to lag those in the subtropical
North Atlantic by about 8–9 years, suggesting that the
anomaly signal at the higher latitudes originates from
the lower latitudes through oceanic advection. This new
finding provides an observational evidence for previous
numerical model studies that contend that the north-
ward advection of salinity and temperature anomalies
influences on AMOC’s variability.
The temperature variation of the North Atlantic Ocean is
very important since it can affect Atlantic hurricane activity
and rainfall in North America (e.g., Goldenberg et al. 2001;
Enfield et al. 2001; McCabe et al. 2004; Wang et al. 2008b).
Both global warming and natural climate variability con-
tribute to the ocean temperature variation in the North
Atlantic. If global warming leads to a substantial weakening
of the AMOC as proposed by Manabe et al. (1991) and
others, the weakening of the AMOC will be associated with a
cooling in the North Atlantic Ocean, which will compensate
partly for the greenhouse warming in the North Atlantic
Ocean. At the same time, the oscillation of the AMO can
either warm or cool the North Atlantic Ocean dependent on
its phases. Here we observe that the upper ocean of the
subpolar North Atlantic is secularly becoming cooler over
the past five decades and has been warmer since 1995 in
association with the positive phase of the AMO. Obviously,
they compete each other for the warming (or cooling) in the
North Atlantic Ocean. The mechanisms of ocean tempera-
ture (also salinity and density) variations in the North
Atlantic need to be further studied.
The relationship of the AMOC with seawater property in
the North Atlantic is worthy discussing. For the long-term
trend (related to global warming), the upper ocean of the
subpolar North Atlantic is observed to become cooler and
fresher, whereas the AMOC has been secularly strengthened.
This seems to be inconsistent with the notion that as the
AMOC is enhanced (reduced), an increase (decrease) in heat
and salinity occurs in the subpolar ocean owing to the
increasing (decreasing) northward transport of heat and salt
from the subtropical ocean. In fact, observations presented in
this paper suggest that the meridional density gradient
between the subpolar and subtropical North Atlantic Ocean
determines the AMOC’s strength for the long-term trend.
Although the cooling and freshening are observed in the
subpolar North Atlantic Ocean, the density gradient between
the subpolar and subtropical North Atlantic Ocean is
increased. This explains why an increase of the AMOC can
be associated with a cooler and fresher subpolar North
Atlantic Ocean.
The yearly temperature data used in this study are only to a
depth of 700 m, as our analyses are focused on the upper
ocean of the North Atlantic. Further studies of the deeper
ocean using numerical models and observations are needed
to investigate the observed features and mechanisms repor-
ted here. The results presented in this study have at least two
implications. First, a protocol for measuring the meridional
density gradient between the subpolar and subtropical North
Atlantic Ocean may be useful for monitoring AMOC vari-
ability. Secondly, how/whether the AMOC is weakened
under future global warming will be probably dependent
upon the density variation patterns occurring in the North
Atlantic basin, determined by the combined fluctuations of
both oceanic temperature and salinity.
Acknowledgments We thank reviewers’ suggestions and comments
on this manuscript. We also thank Tim Boyer who provided us the
updated salinity data before its public release. Gail Derr gave some
editorial comments on an early version of the manuscript. This work
was supported by a grant from National Oceanic and Atmospheric
Administration (NOAA) Climate Program Office and by the base
funding of NOAA Atlantic Oceanographic and Meteorological Labo-
ratory (AOML). The findings and conclusions in this report are those
of the author(s) and do not necessarily represent the views of the
funding agency.
References
Balmaseda MA, Smith GC, Haines K, Anderson D, Palmer TN,
Vidard A (2007) Historical reconstruction of the Atlantic
966 C. Wang et al.: Seawater density variations
123

meridional overturning circulation from the ECMWF operational
ocean reanalysis. Geophys Res Lett 34:L23615. doi:10.1029/
2007GL031645
Bell GD, Chelliah M (2006) Leading tropical modes associated with
interannual and multidecadal fluctuations in north Atlantic
hurricane activity. J Clim 19:590–612
Boyer TP, Levitus S, Antonov JI, Locarnini RA, Garcia HE (2005)
Linear trends in salinity for the World Ocean, 1955–1998.
Geophys Res Lett 32:L01604. doi:10.1029/2004GL021791
Boyer TP et al (2006) World ocean database 2005. In: Levitus S et al
(eds) NOAA atlas NESDIS, vol 60. US Government Printing
Office, Washington DC, 190 pp
Boyer TP et al (2007) Changes in freshwater content in the North
Atlantic Ocean 1955–2006. Geophys Res Lett 34:L16603. doi:
10.1029/2007GL030126
Bryan K, Cox M (1967) A numerical investigation of the oceanic
general circulation. Tellus 19:54–80
Bryden HL, Longworth HL, Cunningham SA (2005) Slowing of the
Atlantic meridional overturning circulation at 25�N. Nature
438:655–657
Carton JA, Giese BS (2008) A reanalysis of ocean climate using
Simple Ocean Data Assimilation (SODA). Mon Weather Rev
136:2999–3017
Conkright ME et al (2002) World Ocean Database 2001. In: Levius S
(eds) NOAA Atlas NESDIS 42, vol 1. US Government Printing
Office, Washington DC, 167 pp
Curry R, Dickson B, Yashayaev I (2003) A change in the freshwater
balance of the Atlantic Ocean over the past four decades. Nature
426:826–829
Delworth TL, Mann ME (2000) Observed and simulated multideca-
dal variability in the Northern Hemisphere. Clim Dyn 16:661–
676
Dickson B et al (2002) Rapid freshening of the deep North Atlantic
Ocean over the past four decades. Nature 416:832–837
Dijkstra HA, te Raa L, Schmeits M, Gerrits J (2006) On the physics of
the Atlantic multidecadal oscillation. Ocean Dyn 56:36–50
Dong BW, Sutton TT (2002) Adjustment of the coupled ocean–
atmosphere system to a sudden change in the thermohaline
circulation. Geophys Res Lett 29:1728. doi:10.1029/
2002GL015229
Enfield DB, Mestas-Nunez AM, Trimble PJ (2001) The Atlantic
Multidecadal Oscillation and its relationship to rainfall and river
flows in the continental US. Geophys Res Lett 28:2077–2080
Gill AE (1982) Atmosphere–ocean dynamics. Academic Press,
New York, p 662
Goldenberg SB, Landsea CW, Maestas-Nunez AM, Gray WM (2001)
The recent increase in Atlantic hurricane activity: causes and
implications. Science 293:474–479
Gray ST, Graumlich JL, Betancourt JL, Pederson GT (2004) A tree-
ring based reconstruction of the Atlantic multidecadal oscillation
since 1567 A.D. Geophys Res Lett 31:L12205. doi:10.1029/
2004GL019932
Hegerl GC et al (2007) Understanding and attributing climate change.
In: Solomon S et al (eds) Climate change 2007: the physical
science basis. Contribution of working group I to the fourth
assessment report of the intergovernmental panel on climate
change. Cambridge University Press, Cambridge and New York
Hughes T, Weaver A (1994) Multiple equilibrium of an asymmetric
two-basin model. J Phys Oceanogr 24:619–637
Josey SA, Kent EC, Taylor PK (1998) The Southampton Oceanog-
raphy Centre (SOC) ocean–atmosphere heat, momentum and
freshwater flux atlas. Southampton Oceanography Centre Report
No. 6, 30 pp
Knight JR, Allan RJ, Folland CK, Vellinga M, Mann ME (2005) A
signature of persistent natural thermohaline circulation cycles in
observed climate. Geophys Res Lett 32:L20708. doi:10.1029/
2005GL024233
Kohl A, Dommenget D, Ueyoshi K, Stammer D (2006) The Global
ECCO 1952 to 2001 ocean synthesis. ECCO Report No. 40
Krebs U, Timmermann A (2007) Tropical air–sea interactions
accelerate the recovery of the Atlantic Meridional Overturning
Circulation after a major shutdown. J Clim 20:4940–4956
Kuhlbrodt T et al (2007) On the driving processes of the Atlantic
meridional overturning circulation. Rev Geophys 45:RG2001.
doi:10.1029/2004RG000166
Latif M, Roeckner E, Mikolajewicz U, Voss R (2000) Tropical
stabilization of the thermohaline circulation in a greenhouse
warming simulation. J Clim 13:1809–1813
Lozier MS, Leadbetter S, Williams RG, Roussenov V, Reed MSC,
Moore NJ (2008) The spatial pattern and mechanisms of heat-
content change in the North Atlantic. Science 319:800–803
Manabe S, Stouffer RJ, Spelman MJ, Bryan K (1991) Transient
response of a coupled ocean–atmosphere model to gradual
changes of atmospheric CO2. Part I: annual mean response.
J Clim 4:785–818
Mann ME, Emanuel KA (2006) Atlantic hurricane trends linked to
climate change. Eos Trans AGU 87:233–244. doi:10.1029/
2006EO240001
McCabe G, Palecki M, Betancourt J (2004) Pacific and Atlantic
Ocean influences on multidecadal drought frequency in the
United States. Proc Natl Acad Sci 101:4136–4141
Park YG (1999) The stability of thermohaline circulation in a two-box
model. J Phys Oceanogr 29:3101–3110
Rabe B, Schott FA, Kohl A (2008) Mean circulation and variability of
the tropical Atlantic during 1952–2001 in the GECCO assim-
ilation fields. J Phys Oceanogr 38:177–192
Rosati A, Harrison M, Wittenberg A, Zhang S (2004) NOAA/
GFDLocean data assimilation activities. CLIVAR Workshop on
Ocean Reanalysis, 9 November 2004. NCAR, Boulder
Santer BD et al (2006) Forced and unforced ocean temperature
changes in Atlantic and Pacific tropical cyclogenesis regions.
Proc Natl Acad Sci 203:13905–13910
Schmittner A, Chiang JCH, Hemming SR (2007) Ocean circulation:
mechanisms and impacts. Geophysical Monograph Series, vol
173. American Geophysical Union, Washington, 392 pp
Scott J, Marotzke J, Stone P (1999) Interhemispheric thermohaline
circulation in a coupled box model. J Phys Oceanogr 29:351–
365
Stommel H (1961) Thermohaline convection with two stable regimes
of flow. Tellus 13:224–230
Thorpe RB, Gregory JM, Johns TC, Wood RA, Mitchell JFB (2001)
Mechanisms determining the Atlantic thermohaline circulation
response to greenhouse gas forcing in a non-flux-adjusted
coupled climate model. J Clim 14:3102–3116
Timmermann A et al (2007) The influence of a weakening of the
Atlantic meridional overturning circulation on ENSO. J Clim
20:4899–4919
Vellinga M, Wood RA (2002) Global climatic impacts of a collapse
of the Atlantic thermohaline circulation. Clim Changes 54:251–
267
Vellinga M, Wu P (2004) Low-latitude freshwater influences on
centennial variability of the Atlantic thermohaline circulation.
J Clim 17:4498–4511
Wang C, Lee SK, Enfield DB (2008a) Atlantic warm pool acting as a
link between Atlantic multidecadal oscillation and Atlantic
tropical cyclone activity. Geochem Geophys Geosyst 9:Q05V03.
doi:10.1029/2007GC001809
Wang C, Lee SK, Enfield DB (2008b) Climate response to
anomalously large and small Atlantic warm pools during the
summer. J Clim 21:2437–2450
C. Wang et al.: Seawater density variations 967
123

Yin J, Schlesinger ME, Andronova NG, Malyshev S, Li B (2006) Is a
shutdown of the thermohaline circulation irreversible? J Geo-
phys Res 111:D12104. doi:10.1029/2005JD006562
Zhang R (2007) Anticorrelated multidecadal variations between
surface and subsurface tropical North Atlantic. Geophys Res Lett
34:L12713. doi:10.1029/2007GL030225
Zhang R, Delworth TL, Held I (2007) Can the Atlantic Ocean drive
the observed multidecadal variability in Northern Hemisphere
mean temperature? Geophys Res Lett 34:L02709. doi:10.1029/
2006GL028683
968 C. Wang et al.: Seawater density variations
123