sec-17a 2009 sec for pdf - rfm corporation€¦ · cabuyao meat processing corporation formerly...
TRANSCRIPT

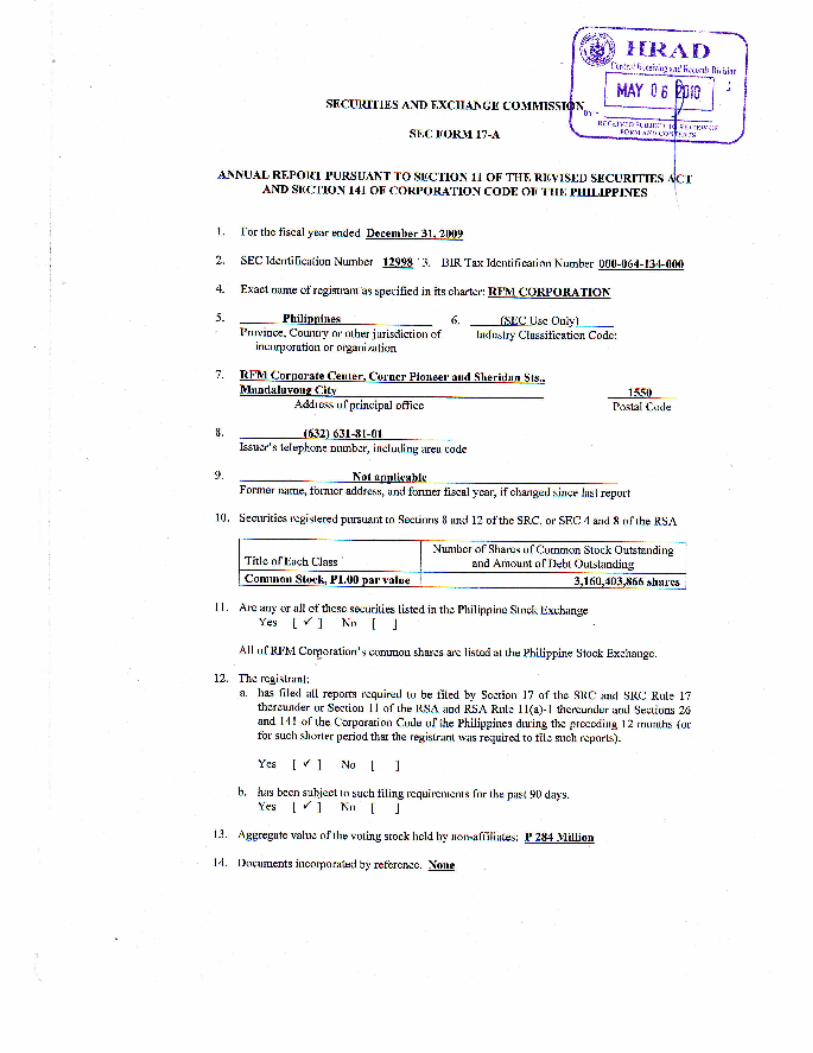
1 2 9 9 8
SEC Registration Number
R F M C O R P O R A T I O � A � D S U B S I D I A R I E S
(Company’s Full Name)
R F M C o r p o r a t e C e n t r e , C o r n e r
P i o n e e r a n d S h e r i d a n S t r e e t s
M a n d a l u y o n g C i t y
(Business Address: No. Street City/Town/Province)
Ramon Lopez 631-8101 (Contact Person) (Company Telephone Number)
1 2 3 1 1 7 - A
Month Day (Form Type) Month Day (Calendar Year) (Annual Meeting)
�ot Applicable
(Secondary License Type, If Applicable)
�ot Applicable
Dept. Requiring this Doc. Amended Articles Number/Section
Total Amount of Borrowings
Total No. of Stockholders Domestic Foreign
To be accomplished by SEC Personnel concerned
File Number LCU
Document ID Cashier
S T A M P S
Remarks: Please use BLACK ink for scanning purposes.
COVER SHEET

PART I – BUSI�ESS A�D GE�ERAL I�FORMATIO�
Item 1 - Business
The RFM Group
RFM Corporation (the “Company”) is a major player in the food and beverage industry in the
Philippines, specifically in the processing and manufacture of flour, flour-based products, milk
and juice drinks, canned and processed meats, ice cream, and bottled mineral water.
The Company also operates non-food businesses, which include barging services (Rizal
Lighterage Corporation) and insurance brokerage (RFM Insurance Brokers, Inc.).
History and Business Development
RFM Corporation was incorporated on August 16, 1957 as Republic Flour Mills, Inc. to
manufacture flour in the Philippines, a country which does not grow wheat, in order to contribute
to the country’s greater self-reliance in basic food. From its original business of flour milling, the
Company diversified into poultry and livestock production and areas of food manufacturing that
includes flour-based products, margarine, milk & juices, canned and processed meat, ice cream,
and bottled mineral water.
After RFM established itself in the flour milling business, the Company, in 1963, commissioned
new plant facilities to produce cooking oil and margarine. This was then followed by the
establishment of a feed mill in 1965 to manufacture poultry and hog feeds, of which key raw
materials - bran and pollard - were by-products of the flour operations.
In the early 1971, RFM integrated forward into hog and poultry breeding. It entered into a
licensing agreement with Peterson Industries and H & N Layers to breed day-old chicks. The
Company, though, divested from the hog operation in 1994, and in the poultry business in 2003 by
way of property dividends to its shareholders.
In 1973, the Company signed an exclusive licensing agreement with Swift and Company of
Illinois (now Armour Swift & Echrich of the ConAgra Group). This move initiated the entry of
RFM into the business of chilled and canned meat processing using the “Swift” brand name. A
continuous meat processing plant, the first in the country, was constructed in 1975. The “Swift”
brand name was eventually purchased by RFM in 1987, allowing the Company the rights to its
exclusive use in the Philippines. Presently, the “Swift” brand name is being shared by RFM and
Swift Foods, Inc. in their production and sale of processed meat and chicken products,
respectively.
From the 1970s to 1980s, RFM concentrated primarily on growing its established core businesses.
It also introduced grocery items, such as cake mixes, hotcake mixes, and ingredient mixes during
this period.
As RFM began to enter the 1990s, it envisioned itself to become a truly diversified Food
Company catering to the Filipino taste. This goal was and continues to be implemented through
two approaches: strategic acquisition of Filipino companies with strong local brands, and
partnerships with internationally-renowned food institutions.
This vision was first manifested in the purchase of Cosmos Bottling Corporation (Cosmos), a
Filipino softdrinks company, in 1989, from the Wong Family. Then in 1990, RFM acquired the
“Selecta” trademark from the Arce Family. RFM invested in new machinery under a new
company, Selecta Dairy Products, Inc. (Selecta), to mass produce the locally famous ice cream
flavors within international health standards. And in 1993, the Company ventured into the
production of ready-to-drink ultra-heat treated (UHT) milk and juices in tetra-packaged format
using the brand names Selecta Moo and Sunkist, respectively.
In 1994, Swift, Selecta, and Cosmos conducted an initial public offering of its shares of stock
through the Philippine Stock Exchange.
A year later, in 1995, the Company incorporated RFM Properties and Holdings, Inc. to consolidate
its real estate assets as well as to break into the land and housing development business. The
company was later renamed Philippine Townships, Inc. In 2008, the company was again renamed
to Philtown Properties, Inc.
RFM continued to expand its businesses as it ventured into noodle manufacturing, tuna
processing, bakeshop business with the acquisition of the Rolling Pin trademark, food franchising
with the use of Little Ceasar’s Pizza brand of the USA, and thrift banking under Consumer Bank.
The Asian Financial Crisis of 1997, however, put a halt to the business expansion of RFM. The
ensuing economic slowdown, more cutthroat market competition, and the dearth of capital
financing weighed heavily on the financial operations of the Company. Furthermore, the
US$83.7M bond, which it obtained in 1996, became due in 2001, and its payment forced RFM to
sell many of its operating subsidiaries, including Consumer Bank which was sold to Philippine
Bank of Communications, and Cosmos which was sold to San Miguel Corporation.
The remaining business, nevertheless, gives RFM the foundation to build on. Within the Parent
Company, the original business of flour making continues; as well as branded food products such
as Swift processed chilled and canned meats like hotdogs, vienna sausage, and corned beef,
Sunkist Juices, Selecta Milk, Fiesta Pasta Noodles, White King Hot Cake, Butterfresh Margarine,
among others.
Philtown Properties, Inc. (formerly Philippine Townships, Inc.), the property company, is
presently owned 19% by RFM as 66% of the outstanding shares were declared as property
dividends in 2008 and 15% in April 2009. The company remains committed in liquidating its
landholdings through the development of middle income housing enclaves. It also builds
condominium projects in saleable areas in Fort Bonifacio, Rockwell, and Taft. The ice cream
business remains profitable and is presently co-owned with Unilever Philippines, under a new
corporate name, Unilever-RFM Ice Cream Inc.

The Group and the Products
Food Businesses
RFM Corporation (Parent Company)
RFM Corporation (the parent company) operates two major business segments:
- Flour-based Group that account for the largest share of sales; and
- Beverage and Meat Group that carries the canned and processed meat, milk and juices.
See table on sales.
Unilever-RFM Ice Cream Inc. (formerly Selecta Wall’s Inc.)
Unilever-RFM Ice Cream Corporation is a joint venture enterprise owned 50%-50% by RFM
Corporation and Unilever Philippines Inc. It is engaged in the business of manufacturing,
marketing, distributing and selling, importing and exporting of ice cream and similar food
products.
Interbake Commissary Corporation
Interbake Commissary Corporation was established in 1998, and operates a high-speed Bun
Production Line. It’s first, and continues to be the biggest customer, is McDonald’s. Interbake
supplies the bun requirements to McDonald’s over 260 stores in Luzon. Through the years,
Interbake has gained an outstanding reputation for delivering world-class quality buns, enabling it
to further expand its customer base which now includes other quick service restaurants such as
Wendy’s and KFC. Since 2007, Interbake’s bread sales volume had an average annual increase of
11%.
RFM Foods Philippines Corporation
Established in 1991 as RFM-Indofood Philippines Corporation, then a joint venture company
between RFM Corporation and Indofood of the Salim Group of Indonesia, the company’s main
product lines were instant noodles of various flavors and packaging. The Company, however,
ceased operations in October 2000 due to operating losses.
The company has been renamed RFM Foods Philippine Corporation, and remains dormant.
FWBC Holdings, Inc.
FWBC Holdings, Inc. is 83.38% owned by RFM Corporation, and organized in 2001 to hold and
manage Filipinas Water Bottling Corporation (FWBC). FWBC is involved in the processing and
distribution of bottled mountain spring water.

�on-Food Businesses
RFM Equities, Inc.
RFM Equities Inc. is a holding company that is 100% owned by RFM. It was organized in 1996
to hold and manage RFM Corporation’s holdings in two small financial services subsidiaries –
Conglomerate Securities and Financing Corporation (CSFC) and RFM Insurance Brokers, Inc.
(RIBI). CSFC provides consumer-financing services mainly to the managers and employees of the
RFM Group. RIBI meanwhile services the insurance needs mainly of the RFM Group, affiliates
and business partners.
Rizal Lighterage Corporation
Rizal Lighterage Corporation (RLC) is a barging company that is 82.98% owned by RFM
Corporation. It transports food commodities like wheat, soya bean and fishmeal via barges along
the Pasig River.
WS Holdings, Inc.
WS Holdings, Inc. is 60% owned by RFM Corporation and 40% owned by Unilever Philippines,
Inc. It was incorporated and registered with the Securities and Exchange Commission in 1999 to
invest in, purchase and own shares of stocks, bonds and other securities of obligations including
real estate and personal property of any foreign or domestic corporation, or partnership, or
association.
Selecta Wall’s Land Corporation
Selecta Wall’s Land Corporation was incorporated in 1999 to acquire, own, use, develop and hold
for investment all kinds of real estate. RFM Corporation owns 35% of this company.
Cabuyao Meat Processing Corporation
Formerly Bringmenow, Inc., the company was renamed into Cabuyao Meat Processing
Corporation (CMPC) in 2005 upon the transfer into it of the meat manufacturing assets. This is
100% owned by RFM Corporation, and its primary possession is the processing plant in Cabuyao,
Laguna, which produces hotdogs, corned beef, hams, and other meat products under the Swift
brand.
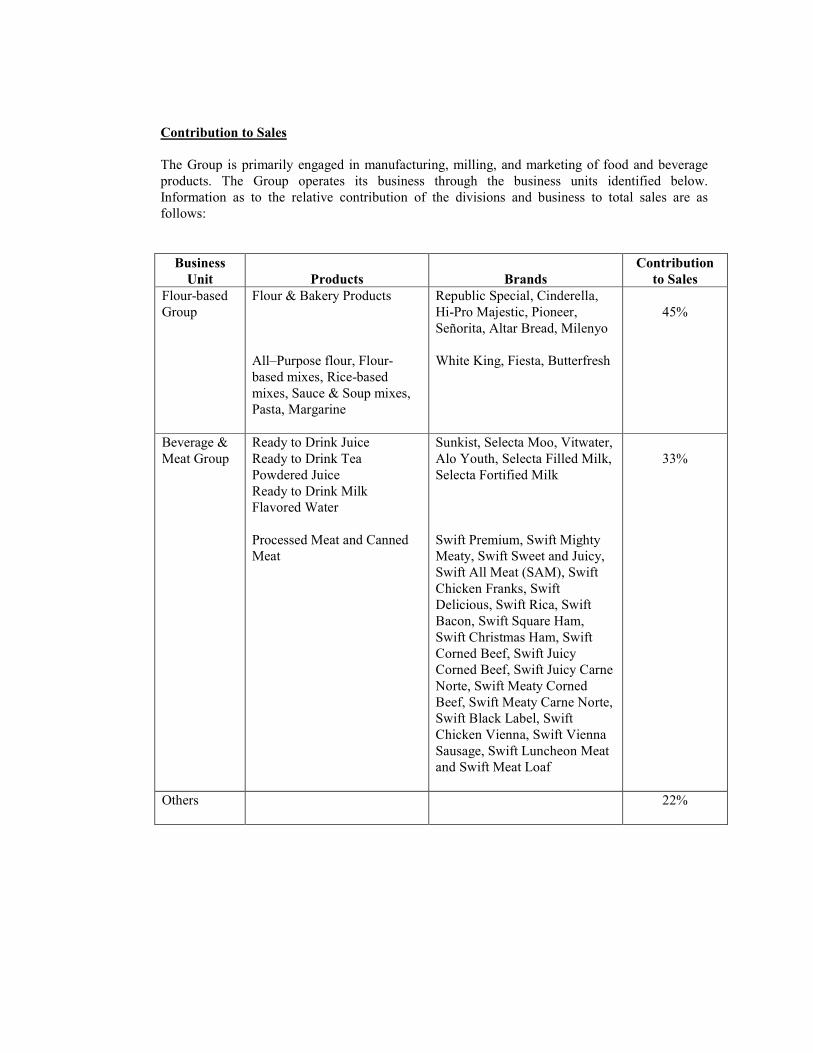
Contribution to Sales
The Group is primarily engaged in manufacturing, milling, and marketing of food and beverage
products. The Group operates its business through the business units identified below.
Information as to the relative contribution of the divisions and business to total sales are as
follows:
Business
Unit
Products
Brands
Contribution
to Sales
Flour-based
Group
Flour & Bakery Products
All–Purpose flour, Flour-
based mixes, Rice-based
mixes, Sauce & Soup mixes,
Pasta, Margarine
Republic Special, Cinderella,
Hi-Pro Majestic, Pioneer,
Señorita, Altar Bread, Milenyo
White King, Fiesta, Butterfresh
45%
Beverage &
Meat Group
Ready to Drink Juice
Ready to Drink Tea
Powdered Juice
Ready to Drink Milk
Flavored Water
Processed Meat and Canned
Meat
Sunkist, Selecta Moo, Vitwater,
Alo Youth, Selecta Filled Milk,
Selecta Fortified Milk
Swift Premium, Swift Mighty
Meaty, Swift Sweet and Juicy,
Swift All Meat (SAM), Swift
Chicken Franks, Swift
Delicious, Swift Rica, Swift
Bacon, Swift Square Ham,
Swift Christmas Ham, Swift
Corned Beef, Swift Juicy
Corned Beef, Swift Juicy Carne
Norte, Swift Meaty Corned
Beef, Swift Meaty Carne Norte,
Swift Black Label, Swift
Chicken Vienna, Swift Vienna
Sausage, Swift Luncheon Meat
and Swift Meat Loaf
33%
Others 22%

Domestic and Export Sales
The amounts of revenue, profitability, and identifiable assets attributable to domestic and export
operations for 2009, 2008 and 2007 in Million Pesos are as follows:
2009 % 2008 % 2007 %
Sales
Domestic 7,968 95.61 7,263 96.19 5,857 96.10
Foreign (Export) 366 4.39 288 3.81 238 3.90
8,334 7,551 6,095
2009 2008 2007
Operating income(loss)
Domestic 440 228 229
Foreign (Export) 86 36 30
526 264 259
Total Assets (All Domestic) 8,927 9,222 10,148
Distribution Methods of the Products or Services
The company engages in different methods of distribution depending on the products/services to
meet the needs of customers.
RFM Corporation sells its products through the following accounts: modern trade accounts,
distributor accounts, secondary accounts, food service, institutional customers, wet market and
Good Values company store. Modern trade and distributor accounts comprised of hypermarkets,
supermarkets, groceries, convenience stores and wholesalers.
Status of any publicly-announced new product or services
The latest publicly-announced addition to the basket of RFM Healthy Beverages is Alo Youth.
Alo Youth is a refreshing new beverage for a healthier and youthful skin. It contains Collagen,
Vitamin E and L-Carnitine. It also has natural aloe vera bits as a source of additional health
benefits. It is available in Lychee, Apple and Mango flavors.
The product is currently being endorsed by basketball icon Chris Tiu and socialite Camille Villar.
Competition
The Food and Beverage industry, to which RFM Corporation belongs to, is a highly saturated and
competitive business. The marketplace is filled with many contending products produced by
domestic and multinational companies. In addition, there are a number of imported products
taking a slice of the market pie.

There are eleven flour millers in the country, and have grouped themselves into two trade
associations – Philippine Association of Flour Millers (PAFMIL) and Chamber of Philippine
Flour Millers Inc (Champflour). RFM Corporation is a member PAFMIL. The Company believes
that it accounts for about 8% to 9% of total industry volume sales. The larger manufacturers are
General Milling Corporation, Universal Robina Corporation, Pilmico Foods Corporation, and San
Miguel Corporation.
After the traditional China flour, Turkey is now the one penetrating the domestic market by
sending cheap, lower quality flour to the Philippines. The Company is addressing this
competition through the introduction of competitively priced flour with higher quality than the
imported one.
In 2008, the total beverage industry is estimated to be about 2.2M liters in volume. It has grown
by 12% from 2007. Majority of the growth originated from Instant Coffee Mix, Energy Drinks
and Ready-to-Drink Tea.
Based on the 2009 Nielsen data, Zest-O Corporation leads the ready-to-drink juice category with
a combined share of 41% from their Big 250 (19%), Zesto (15.6%), Sunglo (2.5%), Ok (2.2%)
and JR (1.7%) brands. It is followed by Del Monte (Fit N’ Right; 15.5%) and Coca Cola (Minute
Maid; 6.4%) respectively
Minute Maid and Del Monte Fit N’ Right holds a significant growth in share with 64% and 35%
respectively. Their growth is attributed to their unique product proposition.
Universal Robina Corporation, on the other hand, leads the ready-to-drink tea category with the
71.2% market share by their C2 brand. It is followed by Coca Cola with their Nestea brand
(10.2%)
Although Sunkist holds a modest share in the market, it continues to grow each year with
innovations and unique proposition for its consumers. It pushes forward with quality products that
cater to the local market.
RFM Corporation’s brand in the liquid milk business is Selecta Moo for flavored milk drinks and
Selecta Fortified Filled Milk for the white milk line. Substantially all players in this category sell
their liquid milk in aseptic tetra pack packaging. Majority import the basic raw material milk in
powder form with several brands importing fresh milk sourced from Australia or New Zealand.
RFM Corporation saw a resurgence of its Milk business via a +5% grown in total milk sales
coming from solid growth of the Selecta Fortified brand which was up +20% vs. previous year.
The strong performance is attributed to maintaining a solid base of consumer through Selecta Moo
and RFM Corporation’s ability to expand milk consumption among low income consumers via
Selecta Fortified Milk which is at least priced 10% to 15% lower than most multinational and
imported brands.
Selecta Milk completed its product portfolio through the launch of Selecta Smoothie and Selecta
Full Cream. Selecta Smoothie is a combination of milk and juice in one drink, first to launch in
the local market. Selecta Full Cream is a value for money product priced 10% to 15% more
affordable than competition, both local and imported brands.

The meat industry in which RFM Corporation competes in is divided into two sub-industries:
chilled processed meat and canned meat. In the chilled processed meat market, RFM Corporation
sells hotdogs, bacons, and hams. On the other hand, the Company sells corned beef, carne norte,
vienna sausages, luncheon meat and meat loaf in the canned meat segment. The Company uses
the brand name Swift for all its meat products.
In processed meat, San Miguel Purefoods Company, Inc. remains to be the market leader with
57% of the market (AC Nielsen, Dec’08). On the other hand, CDO Foodsphere is stable in their
no. 2 position in the market with a 21% market share. Swift grew by 5%, with a market share of
4.2%.
In canned meat, the key player is Pacific Meat Company, Inc. (AC Nielsen, Jun ‘09) via its
Argentina brand owning 33% market share and San Miguel Purefoods with 18% share of market,
which is followed closely by CDO Foodsphere at 17% share. The RFM Swift brand now has
3.4% share in canned meats via active participation in corned beef, Vienna sausages, luncheon
and meat loaves.
RFM achieved better quality processed meat products at lower cost in its Cabuyao Meat Plant as
against using third-party toll processing operators. This allows RFM increased capability to
regain market share in the near future. Production in the Cabuyao factory began in October 2007
after the labor strike was lifted in February 2006. Prior to this, the plant was not operational since
2003.
RFM Corporation, using the brand name Fiesta, is the market leader for spaghetti in the
Philippines with a certified market share of approximately 26% for total year of 2009. For the
year 2009, the Company was able to grow their spaghetti segment by +13% in sales value as
compared to 2008. RFM Corporation has also launched a new product during the last quarter of
2009. The new sku’s, which are Fiesta Salad Macaroni 1 kilo and Fiesta Salad Macaroni
400 grams, have contributed an incremental volume sale of 5% for the year, which helped
increase sales for Fiesta macaroni by 18% and total Fiesta pasta by 9%.
Purchases of Raw Materials and Supplies
RFM Corporation sources raw materials and packaging materials both overseas and domestically.
The company imports from the US (wheat,), New Zealand (anhydrous milk fat), India and
Australia (skimmed milk powder), Switzerland, Spain and other countries.
The payment forms vary for each supplier. It ranges from Letter of Credit, downpayment-drawn
against payment, to a 30-day credit term.
Customers
RFM Corporation has a wide range of products that cater to all socio-economic class and all age
groups.
Its products are sold through hypermarkets, supermarkets, groceries, convenience stores, drug
stores, wholesalers, distributors, institutional customers, food establishments, wet market and the
company store.
RFM Corporation is not dependent on any single or few customers that might have any material
adverse effect on its business, except for the processing and exclusive sale of hamburger buns by
Interbake Commissary Corporation to Golden Arches and WenPhil Corporation. These
hamburger buns account for about 52% of the total sales of Interbake Commissary Corporation in
2009 vs. 54% in 2008.
Related Party Transactions
The Group, in the regular course of business, transact with related parties, which may consist but
not limited to the following:
• Purchase of goods and services.
• Cash advances for working capital purposes.
• Lease of the Company’s main office from a related party. The lease covers a period of
one year renewable for another year upon mutual agreement of the parties concerned.
• The parent company provides management services to RFM Insurance Brokerage, Inc.
and Interbake Commissary Corporation
• Distribution, sale and merchandising of RFM Group products.
Trademark, Royalty and Patents
Trademark is amortized using the straight-line method over 20 years, which is the expected
minimum economic life of the trademark.
A Trademark License Agreement was entered into with Unilever-RFM Ice Cream, Inc. for the
exclusive its right to use the “Selecta” trademarks in its ice cream products and to manufacture,
market, and sell Selecta trademarked products. The agreement shall be co-terminus with the Joint
Venture Agreement between RFM Corporation and Unilever-RFM Ice Cream, Inc. The license is
free from royalty fee and any similar kind of payment. On December 3, 2008, the Trademark
License Agreement was extended for another ten (10) years, or from March 30, 2009 to March 29,
2019.
On 01 January 1995, RFM entered into a Trademark License Agreement with Sunkist Growers,
Inc. (Sunkist). Under the said agreement, Sunkist grants RFM (a) exclusive right, without the
right to sublicense, to use the Sunkist Trademark(s) and related Trade dress approved by Sunkist,
in connection with the marketing, distribution and sale of licensed products in the Philippines; (b)
exclusive right, without the right to sublicense, to use the Know-How within the Philippines for
the production and sale of Licensed Products; (c) the right and privilege to receive technical
assistance regarding the implementation of Know-How; and (d) to make available Base
Ingredients directly or through authorized Base Ingredients Suppliers to enable RFM to
manufacture Licensed Products. For and in consideration of the rights granted above, RFM pays
an annual royalty to Sunkist. The Amendment to the TLA was extended for another five (5) years
or from 01 January 2005 to 31 December 2009. Another Amendment extending the TLA for
another five years will be signed by the Parties on 27 January 2010.
On 13 March 2009, Swift Foods, Inc. (SFI) re-assigned and returned to RFM all its rights and
interests in the well-known Swift trademark. IPO registration of the mark has been transferred
under RFM and a new Certificate of Registration has accordingly been issued to RFM.

�eed for Any Government Approval of Principal Products and Compliance with
Environmental Laws
The Group complies with environmental laws and secures government approval for all its
products. The Company has existing permits from various government agencies that include the
Bureau of Food and Drug (BFAD) and the City Environment and Natural Resources Office. The
Company also complies with the requirements of Laguna Lake Development Authority (LLDA)
for environmental sanitation purposes.
The Company believes that it has complied with all applicable environmental laws and
regulations, and incurred about P718,000.00 and P24,400 during the years 2009 and 2008,
respectively, for payment of annual permits and fees.
The Group has no knowledge of recent or impending legislation, the implementation of which can
result in a material adverse effect on the business or financial condition.
Research and Development Activities
The Company conducts research and development activities to improve existing products and to
create new product lines, as well as to improve production processes, quality control measures,
and packaging to meet the continuing and changing demands of the consumers at the least possible
cost. The Company spent about P14 million and P15 million in the year 2009 and 2008,
respectively, for research and development.
Employees
As of December 31, 2009, the Company and its subsidiaries had approximately 541 employees,
of which 22 are executive and 157 supervisory staff and 362 were non-supervisory staff. The
Company does not anticipate any significant increase in the number of its employees in year 2010.
About 28% of the total employees of the Company and its subsidiaries are members of various
labor unions. The Company and its subsidiaries have collective bargaining agreements with these
unions.
The Company believes that its relationship with its employees is generally good. The Company
has not recently experienced any material interruption of operations due to labor disagreements.
Labor-Management Councils (LCMs) regularly meet to discuss and resolve work-place issues and
production matters.
The employees are covered by retirement plans per division. The plans are trusteed,
noncontributory defined benefit pension plan covering substantially all permanent employees of
the Company. The Company has no stock option plan.
Last year, reduction of personnel in Flour Division and Milk & Juice Division was successfully
implemented. Fourteen (14) employees availed the Early Retirement Program in the Flour
Division. Thirty six (36) employees applied for the Voluntary Retrenchment Program in the Milk
& Juice Division. The Company and its subsidiaries do not expect any significant change in its
existing workforce level within the ensuing twelve (12) months.

Working Capital
The Company funds its working capital requirements through internally-generated funds and from
bank borrowing. The working capital finances the purchase of raw materials, inventory, salaries,
administrative expenses, tax payments, and sales receivables until such sales receivables are
collected into cash.
Major Business Risks
Like any other business, risks are always considered in the ability or inability to achieve the
business objectives and execute strategy effectively. RFM Corporation and its subsidiaries
perceives the following business risks:
Financial Risk Management Objectives and Policies
The Group’s principal financial instruments include non-derivative instruments such as cash and
cash equivalents, available-for-sale investments, short-term and long-term debt and obligations,
and advances from and payable to related parties. The main purpose of these financial
instruments includes raising funds for the Group’s operations and managing identified financial
risks. The Group has various other financial assets and financial liabilities such as trade
receivables, trade and trust receipts payables, which arise directly from its operations. The main
risk arising from the use of financial instruments are interest rate risk, foreign exchange risk,
credit risk and liquidity risk.
Interest rate risk
The Company’s exposure to changes in interest rates relate primarily to the Company’s short-term
and long-term debt obligations.
Management is tasked to minimize interest rate risk through interest rate swaps and options, and
having a mix of variable and fixed interest rates on its loans. To manage this mix in a cost-
efficient manner, the Company enters into interest rate swaps, in which the Company agrees to
exchange, at specified intervals, the difference between fixed and variable interest amounts
calculated by reference to an agreed-upon notional principal amount.
After taking into account the effect of currency and interest rate swaps, 37% of the Group’s long-
term borrowings as of December 31, 2009 are at a fixed rate of interest. The Group’s short-term
and long-term bank loans are market-determined, with the long-term loan interest rates based on
PDST-F-1 plus a certain mark-up.
Foreign exchange risk
The Company’s exposure to foreign exchange risk results from its business transactions and
financing agreements denominated in foreign currencies.
Management is tasked to minimize foreign exchange risk through the natural hedges arising from
its export business and through external currency hedges. Presently, trade importations are
immediately paid or converted into peso obligations as soon as these are negotiated with suppliers.
The Group has not done any external currency hedges in 2009.

Commodity price risk
RFM Corporation is continually exposed to commodity price risk as its basic raw materials (i.e.,
wheat, meat, and milk) are commodities whose prices are driven by world supply and demand.
The Company’s management is tasked to minimize commodity risk through commodity hedging.
This includes forward purchases primarily of wheat and its freight services. The Company has
done opportunistic hedges in the past that contributed positively to the financial performance for
its Flour Division that is better than industry norm. The Company did not enter forward purchases
and commodity hedging arrangements in 2009.
Credit risk
Credit risk arises from the risk of counterparties defaulting. Management is tasked to minimize
credit risk though strict implementation of credit, treasury and financial policies. The Group deals
only with reputable counterparties, financial institutions and customers. To the extent possible,
the Group obtains collateral to secure sales of its products to customers. Also, the Group transacts
with financial institutions belonging to the top 25% of the industry, and/or those which provide
the Group with long-term loans and/or short-term credit facilities.
The Group does not have significant concentrations of credit risk and does not enter into financial
instruments to manage credit risk. With respect to credit risk arising from financial assets other
than installment contracts and accounts receivable (such as cash and cash equivalents and
available-for-sale investments), the Group's exposure to credit risk arises from default of the
counterparties, with a maximum exposure equal to the carrying amount of these instruments.
Liquidity risk
Liquidity risk arises from the possibility that the Company may encounter difficulties in raising
funds to meet commitments from financial instruments.
Management is tasked to minimize liquidity risk though prudent financial planning and execution
to meet the funding requirements of the various operating divisions within the Company. These
are carried through strict implementation of cash management and credit and collection policies;
long-term and short-term loans obtained from financial institutions, through; and capital raising,
including equity, as may be necessary. Presently, the Company has existing long-term loans that
fund capital expenditures. Working capital requirements, on the other hand, are adequately
addressed through short-term credit facilities from financial institutions. Trade receivables are
kept within manageable levels.
Market risks
Market risks stems from new and/or existing re-launched products and/or new packaging at low
prices being introduced in the market place by competitors. To address these competitive
pressures, the Company continues to develop new products in innovative packaging formats to
keep a hold on its consumers and increase market share. The strategy requires significant
resources for market research, product development, and marketing and promotions. Attendant
risks are inventory overstocks, spoilage, and warehousing cost if the new product launched in the
market fails to take off. To manage these risks the Company has established a system where
success indicators in the target market are closely being monitored and supported by effective
supply chain management.
Technological changes
RFM Corporation has been in the flour manufacturing for several decades, and its operating mills
are older than many of its competitors which have more modern equipment and, thus, better rated
operating yields. To meet these challenges, the Company continues to provide sufficient repairs
and maintenance on its equipment and continually upgrades sections of its facilities to remain at
par with the modern machineries. Recent installations are a Buhler blending system which
allowed for more efficiency in product mixing and customization; and a Buhler carousel packing
and weighing system provides very accurate weighing of flour in bags. In addition, the Company
spends in research and development, particularly in the areas of process engineering and wheat
mixtures to produce higher flour yields.
In 2008, the Company invested in a new Buhler C-line Pasta Machine to service its growing
market in the spaghetti noodles, under the Fiesta brand. The machine incorporates the patented
Polymatik Extrusion Technology, which is presently one of the most advanced in raw material
mixing processes, and produces pasta that is firmer, brighter, and with excellent heat tolerance.
Improvements, upgrades, and regular maintenance and repairs of its Aseptic Production Line
allow the Milk and Juice Division to produce good quality ready-to-drink milk and chocolate-
flavored milk as well as fruit juices under the Selecta and Sunkist brands. In 2008 and 2009,
investments were made in automated PET bottle injection, blowing, filling, and packing facilities
to cater to a newly developing packaging format for juice and tea drinks.
The Meat Division specializes in the manufacture of processed and canned meat products for
several years under Swift brand. It has maintained its brand integrity and product quality by
meeting the challenges of competition via continuous upgrading of technology, its equipment and
facilities to meet the demands of local and international market. Collaboration with technical
experts in the field of food science and technology as well as manufacturing has been extended to
foreign and local business partners to be updated in the latest food trends, equipment and raw
materials sourcing. It has its sources of technology information via attendance to seminars,
conferences, conventions, journal subscription and internet access to further enhance its research
and development skills and manufacturing processes.
Labor Unrest
Like other firms in the food and beverage industry, RFM also faces the risk of labor unrest, and
strikes. In August 2006, the Company retired all its 116 trade merchandisers to cut operating
costs. Consequently, these former employees filed a notice of strike, though the operations of the
Company were not disrupted. This matter remains under mediation, with the separation pay
already accepted by 94 former trade merchandisers with only remaining 22 still holding out. The
cases are now on appeal with the Court of Appeals.

Item 2 – Properties
RFM Corporation owns a flour milling plant with a daily rated capacity of 1,000 metric tons per
day, and is located in Barangay Pineda, Pasig City. A pasta plant with a rated capacity of 3,000
kgs (Input) per hour is also located at RFM Pioneer Plant, Barangay Pineda, Pasig City. A milk
and juice plant is located in Manggahan, Pasig City, and has a rated capacity of 9.7 million packs
per month. The milk and juice Tetra plant currently has four (4) production lines, of which two
(2) are owned and two (2) are under financing lease. Lines are running at 15 hours operation per
line at 25 days. The 2 PET lines are completely owned by RFM, with combined production
capacity of 12000 cases a day at 26 days operation per month. One line is located in Manggahan
Pasig; while another is located in Cabuyao, Laguna. A meat processing facility, under 100%-
owned Cabuyao Meat Processing Corporation, is situated in Cabuyao, Laguna and can produce
hotdogs at a capacity of 1200 MT per month, canned lines at 100,000 cases a month, patties and
nuggets line at 150 MT per month, Ham and Bacon Line at 40 MT a month. These properties
with the exception of those under lease are covered by a mortgage trust indenture in favor the
Company’s financial creditors.
Wholly owned food subsidiary Interbake Commissary Corporation owns a margarine plant with a
capacity of 23MT per day located in Pioneer, Pasig City.
In accordance with various loan agreements, the Company and its subsidiaries are restricted from
performing certain corporate acts without the prior approval of the creditors, the more significant
of which relate to entering into a corporate merger or consolidation, acting as guarantor or surety
of obligation and acquiring treasury stocks. The Company and its subsidiaries are also required to
maintain certain financial ratios. As of December 31, 2009, the Company is in compliance with
terms and conditions of these agreements.
A. Flour Division:
Description LOCATIO� CO�DITIO�
Land – 28,951 sq. m. Pineda, Pasig City Mortgaged Property
Flour Mills Plant/Building/Silos/
Warehouse
Pineda, Pasig City Mortgaged Property/In good condition
Flour Mills-Furniture & Office
Equipment
Pineda, Pasig City Mortgaged Property/In good condition
Flour Mills - Machinery and
Equipment
Pineda, Pasig City Mortgage/With a capacity of 1,000 metric
tons per day
B. Pasta Contract Manufacturing Division
Description LOCATIO� CO�DITIO�
Land - 2,356 sq. m. Pineda, Pasig City Mortgage/In good condition
Pasta Plant/Office/Conference
Room/Die Washing Room
Pineda, Pasig City Mortgage/In good condition
Pasta Plant – Furniture &
Office Equipment
Pineda, Pasig City Mortgage/In good condition
Pasta Plant - Machinery &
Equipment
Pineda, Pasig City Mortgage/With a capacity of 3,000 kgs per
hour
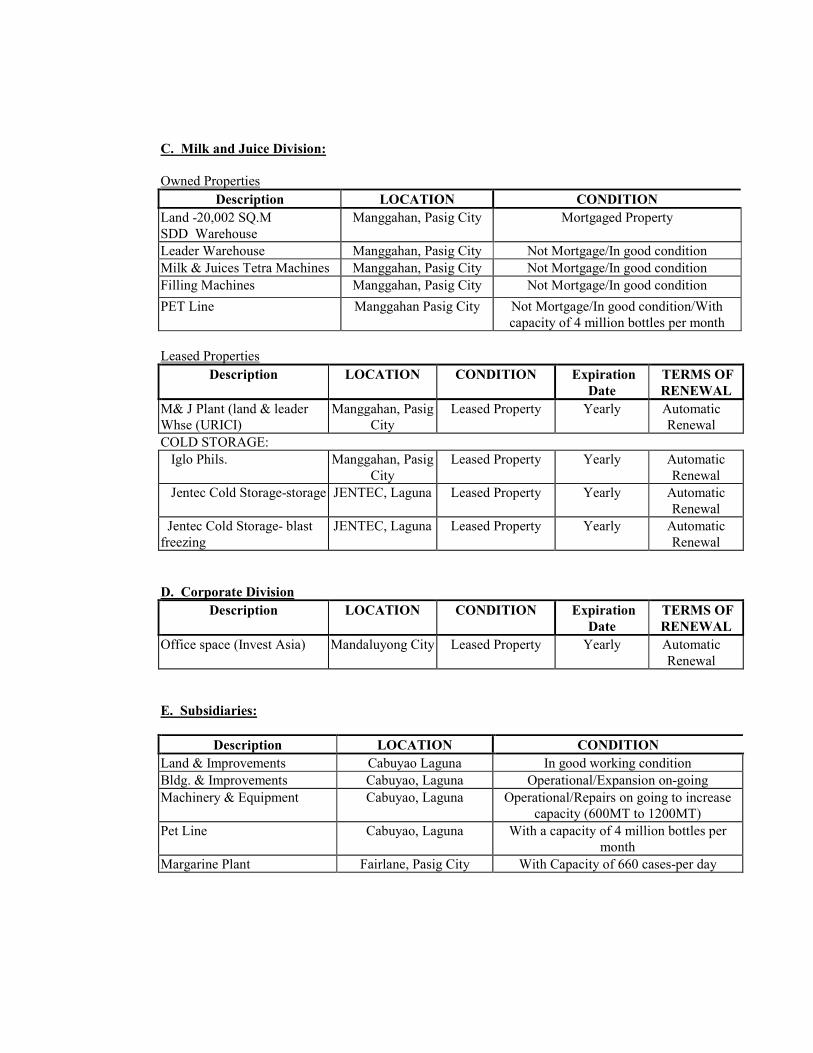
C. Milk and Juice Division:
Owned Properties
Description LOCATIO� CO�DITIO�
Land -20,002 SQ.M
SDD Warehouse
Manggahan, Pasig City Mortgaged Property
Leader Warehouse Manggahan, Pasig City Not Mortgage/In good condition
Milk & Juices Tetra Machines Manggahan, Pasig City Not Mortgage/In good condition
Filling Machines Manggahan, Pasig City Not Mortgage/In good condition
PET Line Manggahan Pasig City Not Mortgage/In good condition/With
capacity of 4 million bottles per month
Leased Properties
Description LOCATIO� CO�DITIO� Expiration
Date
TERMS OF
RE�EWAL
M& J Plant (land & leader
Whse (URICI)
Manggahan, Pasig
City
Leased Property Yearly Automatic
Renewal
COLD STORAGE:
Iglo Phils. Manggahan, Pasig
City
Leased Property Yearly Automatic
Renewal
Jentec Cold Storage-storage JENTEC, Laguna Leased Property Yearly Automatic
Renewal
Jentec Cold Storage- blast
freezing
JENTEC, Laguna Leased Property Yearly Automatic
Renewal
D. Corporate Division
Description LOCATIO� CO�DITIO� Expiration
Date
TERMS OF
RE�EWAL
Office space (Invest Asia) Mandaluyong City Leased Property Yearly Automatic
Renewal
E. Subsidiaries:
Description LOCATIO� CO�DITIO�
Land & Improvements Cabuyao Laguna In good working condition
Bldg. & Improvements Cabuyao, Laguna Operational/Expansion on-going
Machinery & Equipment Cabuyao, Laguna Operational/Repairs on going to increase
capacity (600MT to 1200MT)
Pet Line Cabuyao, Laguna With a capacity of 4 million bottles per
month
Margarine Plant Fairlane, Pasig City With Capacity of 660 cases-per day

Item 3 – Legal Proceedings
Lawsuits and legal actions are in the ordinary course of the Company’s business. However, the
Company or any of its subsidiaries is not currently involved in any material pending litigation or
legal proceeding that could be expected to have a material adverse effect on the Company’s
financial position or its result of operations.
Item 4 – Submission of Matters to a Vote of Security Holders
There were no matters submitted to a vote of security holders during the fourth quarter of this
calendar year covered by this report.
PART II - OPERATIO�AL A�D FI�A�CIAL I�FORMATIO�
Item 5 – Market for Issuer’s Common Equity and Related Stockholders’ Matters
(1) Market Information
RFM shares are traded at the Philippine Stock Exchange (PSE). As of December 31, 2009,
the total number of issued and outstanding shares of the Company is 3,160,403,866 common
shares.
The following are the high and low prices per common share for each quarter within the last
three calendar years and the first quarter of 2010:
2010 High Low
First Quarter 0.65 0.50
2009 High Low
First Quarter 0.29 0.23
Second Quarter 0.39 0.28
Third Quarter 0.58 0.31
Fourth Quarter 0.65 0.47
2008 High Low
First Quarter 0.69 0.45
Second Quarter 0.47 0.46
Third Quarter 0.38 0.38
Fourth Quarter 0.25 0.25
There are no unregistered securities or shares approved for exemption. All shares of the
Company are listed in the Philippines Stock Exchange.
The price of RFM shares as of last trading date – April 29, 2010 was P0.83.

Holders
As of December 31, 2009, there are a total of 3,616 shareholders of RFM common stock.
Filipinos owned 3,135,500,510 common shares or 99.21% while the foreigners owned
24,903,356 common shares or 0.788%, respectively.
Below are the top 20 stockholders of common shares as of December 31, 2009:
�ame �o. of shares
held
% to Total
1. PCD Nominee Corporation 687,716,932 21.76
2. Horizons Realty, Inc. 646,595,738 20.46
3. Triple Eight Holdings Inc. 569,836,472 18.03
4. BJS Development Corporation 311,210,184 9.85
5. Renaissance Property Management Corp. 201,982,966 6.39
6. FEATI University 112,011,350 3.54
7. Chilco Holdings, Inc. 72,748,950 2.30
8. Concepcion Industries, Inc. 71,384,424 2.26
9. Sahara Management & Development Corp. 57,539,818 1.82
10. Select Two Corporation 49,499,612 1.57
11. S&A Industrial Corporation 41,308,360 1.31
12. Republic Commodities Corp 33,115,616 1.05
13. Sole Luna, Inc. 23,926,208 0.76
14. PCD Nominee Corporation 23,746,804 0.75
15. Macric Incorporated 23,302,412 0.74
16. Young Concepts Inc 23,278,814 0.74
17. Lace Express Inc. 23,278,716 0.74
18. Monaco Express Corporation 23,278,552 0.74
19. Foresight Realty Development Corporation 19,215,194 0.61
20. Silang Forest Park, Incorporated 14,915,694 0.47
There are no securities to be issued in connection with an acquisition, business combination
or other reorganization.
(2) Dividends
(a) Dividend per Share
On April 29, 2009, the Board of Directors approved the declaration of cash dividends
amounting to P25 million to its stockholders as of May 14, 2009, and the issuance of
property dividends consisting of 33,265,912 common shares of Philtown at P3.494 per
share. Likewise, on August 26, 2009 the BOD approved the declaration of P25
million cash dividend to all stockholders as of record date.
On April 28, 2010, the Board of Directors approved the declaration of cash dividends
amounting to P50 million to its stockholders at P0.01582 per share.

(b) Dividends Restriction
The long-term loan agreements entered into by RFM Corporation with its creditors
allows the Company to declare and pay cash dividends upon compliance with the
required current ratio and debt-to-equity ratio
Item 6 – Management Discussion and Analysis of Financial Conditions and Results of
Operations for Year 2009
Introduction
This discussion summarizes the significant factors affecting the consolidated operating results and
financial condition of RFM Corporation and its Subsidiaries for the period December 31, 2009.
The following discussion should be read in conjunction with the attached audited consolidated
financial statements of the Company as of December 31, 2009 and 2008, and the related
consolidated statements of income, changes in stockholders’ equity, and cash flows for each of the
two years in the period ended December 31, 2009. All necessary adjustments to present the
Company’s consolidated financial position as of December 31, 2009 and 2008 and the results of
operations and cash flow for the years then ended have been made.
Changes in Accounting Policies and Disclosures
The accounting policies adopted are consistent with those of the previous financial year
except for the adoption of the following new and amended PFRSs and Philippine
Interpretations effective beginning January 1, 2009:
• Amendments to PFRS 7, Financial Instruments: Disclosures, require additional disclosures
about fair value measurement and liquidity risk. Fair value measurements related to items
recorded at fair value are to be disclosed by source of inputs using a three-level fair value
hierarchy, by class, for all financial instruments recognized at fair value. In addition,
reconciliation between the beginning and ending balance for level three fair value
measurements is now required, as well as significant transfers between levels in the fair value
hierarchy. The amendments also clarify the requirements for liquidity risk disclosures with
respect to derivative transactions and financial assets used for liquidity management. The
three-level fair value hierarchy and liquidity risk disclosures are presented in Notes 31 and 32,
respectively.
• PFRS 8, Operating Segments, replaces PAS 14, Segment Reporting, and adopts a full
management approach to identifying, measuring and disclosing the results of an entity’s
operating segments. The information reported would be that which management uses
internally for evaluating the performance of operating segments and allocating resources to
those segments. Such information may be different from that reported in the consolidated
balance sheet, consolidated statement of income and consolidated statement of comprehensive
income and the Group will provide explanations and reconciliations of the differences.
Adoption of this standard did not have any effect on the financial position or performance of
the Group. Disclosures about each of the business segments identified by the Group are
shown in Note 4 to the consolidated financial statements, including revised comparative
information.

• Amendments to PAS 1, Presentation of Financial Statements, separate owner and non-owner
changes in equity. The statement of changes in equity includes only details of transactions
with owners, with non-owner changes in equity presented in a reconciliation of each
component of equity. In addition, the standard introduces the statement of comprehensive
income: it presents all items of recognized income and expense, either in one statement, or in
two-linked statements. The Group has elected to present two statements - a statement of
income and a statement of comprehensive income.
Adoption of the following changes in PFRS and Philippine Interpretations did not have any
significant impact on the Group’s financial statements except where additional disclosures are
required:
• Amendments to PFRS 1, First-time Adoption of Philippine Financial Reporting Standards
• Amendments to PFRS 2, Share-based Payment - Vesting Conditions and Cancellations
• Revised PAS 23, Borrowing Costs
• Amendments to PAS 27, Consolidated and Separate Financial Statements - Cost of an
Investment in a Subsidiary, Jointly Controlled Entity or Associate
• Amendment to PAS 32, Financial Instruments: Presentation, and PAS 1, Presentation of
Financial Statements - Puttable Financial Instruments and Obligations Arising on
Liquidation
• Philippine Interpretation IFRIC 13, Customer Loyalty Programmes, effective for annual
periods beginning on or after July 1, 2008
• Philippine Interpretation IFRIC 16, Hedges of a +et Investment in a Foreign Operation
• Philippine Interpretation IFRIC 18, Transfers of Assets from Customers
Improvements to PFRS
The omnibus amendments to PFRS in 2008 were issued primarily with a view to remove
inconsistencies and clarify wordings. There are separate transitional provisions for each standard.
Adoption of the following improvements to standards did not have significant impact on the
Group’s financial statements.
• PFRS 5, +oncurrent Assets Held for Sale and Discontinued Operations
• PAS 1, Presentation of Financial Statements
• PAS 16, Property, Plant and Equipment
• PAS 19, Employee Benefits
• PAS 20, Accounting for Government Grants and Disclosures of Government Assistance
• PAS 23, Borrowing Costs
• PAS 28, Investments in Associates
• PAS 29, Financial Reporting in Hyperinflationary Economies
• PAS 31, Interest in Joint Ventures
• PAS 36, Impairment of Assets
• PAS 38, Intangible Assets
• PAS 39, Financial Instruments: Recognition and Measurement
• PAS 40, Investment Property
• PAS 41, Agriculture
The omnibus amendments to PFRS issued in 2009 included an amendment to the Appendix to
PAS 18, Revenue. As the amendment to the Appendix to PAS 18 specifies no transitional
provisions, the amendment is effective immediately and retrospectively. The amendment adds
guidance (which accompanies the standard) to determine whether an entity is acting as a principal

or as agent. The features indicating an entity is acting as a principal are whether the entity: (a) has
primary responsibility for providing the goods or services; (b) has inventory risk; (c) has
discretion in establishing prices; and (d) bears the credit risk. The Group has assessed its revenue
arrangements against these criteria and concluded that it is acting as principal in all arrangements.
Accordingly, no change was made in the Group’s revenue recognition policy.
Future Changes in Accounting Policies
The Group will adopt the following revised PFRS, amendment to PAS and Philippine
Interpretations when these become effective, and as these become applicable. Except as otherwise
indicated, the Group does not expect the adoption of these new and amended PFRS, PAS and
Philippine Interpretations to have significant impact on the Group’s financial statements.
Effective in 2010
• Amendments to PFRS 2, Share-based payments - Group Cash-settled Share-based Payment
Transactions, clarify the scope and the accounting for group cash-settled share-based payment
transactions.
• Revised PFRS 3, Business Combinations, and PAS 27, Consolidated and Separate Financial
Statements, introduce a number of changes in the accounting for business combinations that
will impact the amount of goodwill recognized, the reported results in the period that an
acquisition occurs, and future reported results. The revised PAS 27 requires, among others,
that (a) change in ownership interests of a subsidiary (that do not result in loss of control) will
be accounted for as an equity transaction and will have no impact on goodwill nor will it give
rise to a gain or loss; (b) losses incurred by the subsidiary will be allocated between the
controlling and noncontrolling interests (previously referred to as “minority interests”); even
if the losses exceed the noncontrolling equity investment in the subsidiary; and (c) on loss of
control of a subsidiary, any retained interest will be remeasured to fair value and this will
impact the gain or loss recognized on disposal.
The changes introduced by the revised PFRS 3 must be applied prospectively and PAS 27,
retrospectively with few exceptions.
• Amendment to PAS 39, Financial Instruments: Recognition and Measurement - Eligible
Hedged Items, addresses only the designation of a one-sided risk in a hedged item, and the
designation of inflation as a hedged risk or portion in particular situations. The amendment
clarifies that an entity is permitted to designate a portion of the fair value changes or cash
flow variability of a financial instrument as a hedged item.
• Philippine Interpretation IFRIC 17, Distributions of +on-cash Assets to Owners, provides
guidance on how to account for non-cash distributions to owners. The interpretation clarifies
when to recognize a liability, how to measure it and the associated assets, and when to
derecognize the asset and liability.
Improvements to PFRS
The Financial Reporting Standards Council approved in its meeting in May 2009 the adoption of
Improvements to IFRS issued by IASB in April 2009 effective in 2010, unless otherwise stated.
• PFRS 2, Share-based Payment, clarifies that the contribution of a business on formation of a
joint venture and combinations under common control are not within the scope of PFRS 2
even though they are out of scope of PFRS 3. The amendment is effective for financial years
on or after July 1, 2009.
• PFRS 5, +oncurrent Assets Held for Sale and Discontinued Operations, clarifies that the
disclosure required in respect of noncurrent assets or disposal groups classified as held for
sale or discontinued operations are only those set out in PFRS 5. The disclosure requirements
of other PFRS only apply if specifically required for such noncurrent assets or discontinued
operations.
• PFRS 8, Operating Segments, clarifies that segment assets and liabilities need only be
reported when those assets and liabilities are included in measures that are used by the chief
operating decision maker.
• PAS 1, Presentation of Financial Statements, clarifies that the terms of a liability that could
result, at anytime, in its settlement by the issuance of equity instruments at the option of the
counterparty do not affect its classification.
• PAS 7, Statement of Cash Flows, explicitly states that only expenditure that results in a
recognized asset can be classified as a cash flow from investing activities.
• PAS 17, Leases, removes the specific guidance on classifying land as lease so that only the
general guidance remains. Prior to the amendment, leases of land were classified as operating
leases. The amendment now requires that leases of land are classified as either “finance” or
“operating” in accordance with the agreed principles of PAS 17. The amendment will be
applied retrospectively.
• PAS 36, Impairment of Assets, clarifies that the largest unit permitted for allocating goodwill
acquired in a business combination is the operating segment, as defined in PFRS 8 before
aggregation for reporting purposes.
• PAS 38, Intangible Assets, clarifies that if an intangible asset acquired in a business
combination is identifiable only with another intangible asset, the acquirer may recognize the
group of intangible assets as a single asset provided the individual assets have similar useful
lives.
It also clarifies that the valuation techniques presented for determining the fair value of
intangible assets acquired in a business combination that are not traded in active markets are
only examples and are not restrictive on the methods that can be used.
• PAS 39, Financial Instruments: Recognition and Measurement, clarifies that a prepayment
option is considered closely related to the host contract when the exercise price of a
prepayment option reimburses the lender up to the approximate present value of lost interest
for the remaining term of the host contract.
The amendment also clarifies that the scope exemption for contracts between an acquirer and
a vendor in a business combination to buy or sell an acquiree at a future date, applies only to
binding forward contracts, and not derivative contracts where further actions by either party
are still to be taken.
It also clarifies that gains or losses on cash flow hedges of a forecast transaction that
subsequently results in the recognition of a financial instrument or on cash flow hedges of
recognized financial instruments should be reclassified in the period that the hedged forecast
cash flows affect profit or loss.
• Philippine Interpretations IFRIC 9, Reassessment of Embedded Derivatives, clarifies that it
does not apply to possible reassessment, at the date of acquisition, to embedded derivatives in
contracts acquired in a combination between entities or businesses under common control or
the formation of a joint venture.
• Philippine Interpretations IFRIC 16, Hedges of a +et Investment in a Foreign Operation,
states that in a hedge of a net investment in a foreign operation, qualifying hedging
instruments may be held by any entity or entities within the group, including the foreign
operation itself, as long as the designation, documentation and effectiveness requirements of
PAS 39 that relate to a net investment hedge are satisfied.
Effective in 2012
• Philippine Interpretation IFRIC 15, Agreement for Construction of Real Estate, covers
accounting for revenue and associated expenses by entities that undertake the construction of
real estate directly or through subcontractors. This Interpretation requires that revenue on
construction of real estate be recognized only upon completion, except when such contract
qualifies as a construction contract to be accounted for under PAS 11, Construction
Contracts, or involves rendering of services in which case revenue is recognized based on
stage of completion. Contracts involving provision of services with the construction materials
and where the risks and reward of ownership are transferred to the buyer on a continuous
basis will also be accounted for based on stage of completion.
Year ended December 31, 2009 vs. 2008
Management Report on Operations
Diversified food and beverage firm RFM Corporation has registered P365.5 million in net income,
an increase by 49.1% from 2008, rising strong as the economy continues to improve from the
global economic slump.
Gross margins improved from 21.6% to 28.5% in 2009 due to improved plant efficiencies,
softening of commodity prices and cost reduction programs.
With revenues, RFM has continued to beat expectations as it overtakes 2008’s sales of P7.6
billion by P782.7 million, 10.4% higher.
Fiesta spaghetti has maintained its position as market leader based on retail audits because of its
strong value proposition to Filipino consumers. The Fiesta brand is the company’s second market
leader, following the Selecta brand that has continued to dominate the Philippine ice cream market
with over 50 percent market share.
Selecta Fortified Milk strengthened the Company’s presence in the ready-to-drink milk segment .
The Company is also preparing to roll-out as slew of new products in different market categories
that are expected to contribute significantly to overall company sales and improved margins.
Financial Position
Analysis of Balance Sheet Accounts
As of December 31, 2009, the Group’s total assets were P8.9 billion, a decline by 3.2% from last
year’s P9.2 billion, primarily due to the decline in total current assets.
Cash and cash equivalents have declined by 5.8% to P486 million in 2009. Accounts receivable
decreased by P92.9 million resulting from improvements in trade receivable management.
Inventories declined by 7.2% to P1.3 billion due to lower commodity price of major raw materials
declined towards year end of 2009 and improvements in supply chain management.
Property, plant and equipment increased by P199.8 million as the Group manufacturing capacities
were increased in order to meet the increasing demands for its products; and to improve plant
efficiencies as part of cost reduction programs.
Available for Sale (AFS) investments increased by P133.0 million to P2.5 billion. The increase
was primarily due to conversion from Investment in associates of Philtown common shares to AFS
investments valued at P145.0 Million.
The investment in associates declined by P424.0 million primarily due to reclassification of the
investment in Philtown common shares to AFS investments and the derecognition of Philtown as
associate due to the Parent Company’s declaration of its Philtown common shares as property
dividend on April 29, 2009.
Total liabilities reached P3.8 billion, a decline by 11.3% at P488.1 million.
Short term bank loans remain stable at P244.0 million. Long term loans declined by P214.8
million (18%) as these reached maturity dates during the year. Trade payables and accrued
liabilities declined by P151.0 million (9%) to P1.6 billion. Trust receipts declined by P135
million (20%) to P535.1 million.
The Group maintains a healthy balance sheet with a current ratio of 1.37 and a debt to equity ratio
of 0.75.
Year ended December 31, 2008 vs. 2007
Management Report on Operations
RFM Corporation continues to place a positive income performance, achieving a 5% growth to
P245.1 million in 2008 from P234.3 million in 2007. This positive trend is attributed to RFM’s
sustained focus on its core businesses, and intensified brand building, as well as improved cost
reduction measures implemented during the year.
Consolidated net revenues for the whole RFM group amounted to P7.55 billion in 2008, a 24%
growth compared to P6.10 billion in 2007. The company attributed the upsurge to the continuing
strong sales performance of its Flour Based Group, which posted a remarkable growth of 31.7% to
P3.97 billion, as well as its Beverage and Meat Group, with a 22.4% increase to P2.37 billion in
2008.

RFM initiated the construction of a new pasta plant, which became operational in 2008, further
enhancing production of its long noodles line under the name Fiesta, which is the second biggest
brand in the pasta category. Also in 2008, RFM invested in new bottling machines and started
production of PET bottled drinks. Moreover, the launch of “Vitwater” created a new beverage
category – the first of its kind in the country.
Financial Position
Analysis of Balance Sheet Accounts
The Group’s total assets dropped to P9.2 billion from P10.1 billion in 2007. The decline is mainly
attributed to the deconsolidation of Philippine Townships, Inc. On June 25, 2008, the stockholders
and the Board of Directors approved the issuance of property dividends consisting of 143,652,752
common shares of Philtown, thereby reducing control ownership to 34.21%.
Cash and cash equivalents decreased by 25% due to the principal and interest payments that were
made to continually settle the bank loans, trade accounts, and accruals during the year, as well as
acquisitions of various machineries and equipments.
Trade receivables rose by 49% due to increased revenues generated by its manufacturing segment
from P6.1 billion to P7.5 billion.
Inventories also decreased by 66% as real estate inventories were eliminated from 2008 figures,
inventories now only pertains to cost of finished goods, raw materials and supplies in the group’s
manufacturing segments.
The issuance of Philtown shares as property dividends decreased the investment in associates by
P501 million, while it’s conversion of 218 million common shares to preferred increased the
available-for-sale investments by P762 million. Declining market values and sale of marketable
securities during the year decreased valuation gains taken to equity by P94 million.
Acquisition of various equipments and machineries, especially those for the newly built Pasta
plant, and increments on land valuation brought the 92% increase in Net Property Plant and
Equipment.
Investment Property was also eliminated as it only comprised of properties from Philtown.
Relatively, other non-current assets decreased by 66% as Philtown accounts for atleast P116
million of previous year’s total. Amortization of deferred charges also decreased the said account.
Long-term debt increased by 20% as new loans were availed to support the various projects of the
Group, including acquisitions of new machines and improvement of facilities.
Retained earnings of P551 million was decreased by the dividend declarations approved by the
board of directors.

Year ended December 31, 2007 vs. 2006
Management Report on Operations
RFM Corporation posted a stronger income performance of P 234.4 million in 2007, or a 15.7%
growth over the P202.6 million income the previous year. RFM managed to achieve higher
profitability as it focused on executing its value creation strategies and cost reduction measures
during the year.
Key to reaching RFM’s income objectives were the introduction of higher value and innovative
products that banked on RFM’s brands’ respective positioning in the market. Selecta Moo
launched its richer chocolate drink product and basic fortified filled milk, while Sunkist launched
its Hi-Juice beverages and iced tea drinks in more attractive and convenient plastic bottles. Fiesta
pasta, with its new sizes and packaging, has made further inroads in the market making it a strong
number 2 brand in the pasta category. Swift has also launched canned meaty corned beef and Rica
Protina hotdogs that catered well to a broader segment of the market.
RFM also reported that Selecta ice cream, under a joint venture with Unilever, has expanded the
whole ice cream category and in the process further enhanced its market leadership position in ice
cream. Continuous product innovations with affordable pricing like the Selecta 3-in-1 ice cream,
the Selecta Moo ice cream line, and various frozen novelties have brought life to a previously
contracting ice cream market.
RFM’s strong performance was also attributed to its flour division which has exhibited healthy
growth despite the serious wheat market situation due to better plant efficiencies and cost
management.
The income growth was on back of a similar growth performance in Sales revenues. Consolidated
sales for the whole RFM group amounted to P6.99 billion in 2007, a 13.8% growth compared to
P6.14 billion in 2006 as the company focused on fewer but stronger products.
Financial Position
Analysis of Balance Sheet Accounts
The improved profitability contributed to a healthier balance sheet where total stockholder’s
equity increased by 6% to P4.7 billion from P4.4 billion while total asset rose to P10.1 billion
from P9.4 billion or a growth of 7%.
Increase in Cash and cash equivalent by 23% came mainly from proceeds from its sale of
investments and long-term receivables as well as internally generated cash from operations.
Accounts receivable, consisting mainly of trade, rose 35% due to increased revenues generated by
its manufacturing segment from P5.1 billion to P6.1 billion.
Inventories are higher by 7% to P4.0 billion from P3.7 billion due to higher cost of imported
wheat and other materials, as well as additional real properties obtained by its real estate
subsidiary.
Other Current Assets went up by 22% due to increase in deposits on purchases made to suppliers
for future acquisitions of materials and supplies.

Installment contracts receivable declined by 7% due to its sale by Philtown, a real estate
subsidiary, to further push development in its various projects.
Net property plant and equipment have decreased due mainly on depreciation charges during the
year.
Net Investment properties have declined by 5% when Philtown sold certain parcels of land
including the RFM Corporate Center building which is located thereon to Invest Asia Corporation,
a related party.
Other noncurrent asset increased by 7% due mainly to imported machineries in transit.
Account payable and accrued expenses rose by 13% due to increased accruals particularly on
wheat importation and billings from real; estate contractors.
Various payments have reduced the Group’s bank loans from P724 million to P675 million as well
as its trust receipts and acceptances payable from P235 million to P208 million.
Various payments have also reduced the Group’s long term debt from P1.04 billion to P1.03
billion and long term obligation from P173 million to P57 million
Relative increase in retained earnings was largely on account of the favorable results of operation
during the year.
Key Performance Indicators
For the full fiscal years 2009, 2008 & 2007 the Company’s and majority-owned subsidiaries’ top
five (5) key performance indicators are as follows:
In Millions December 2009 December 2008 December 2007
Revenues 8,334 7,551 6,095
Operating Margin 526 264 259
Net Income (Loss) 365 245 234
EBITDA 696 391 355
Current Ratio 1.37 1.39 1.63
(a) Revenue Growth
These indicate external performance of the Company and its subsidiaries in relation to the
movement of consumer demand and the competitors’ action to the market behavior. These also
express market acceptability and room for development and innovations. These are being
monitored and compared as a basis for further study and development.
(b) Operating Margin
This shows the result after operating expenses have been deducted. Operating expenses are
examined, checked and traced for major expenses. These are being analyzed and compared to
budget, and previous years, to ensure prudence and discipline in spending behind marketing and
selling activities.
(c) �et Income
This represents the outcome or results of operations. This measures the over-all performance of
the team, the consequence of all the contributory factors affecting supply, demand, utilization and
decisions.
(d) EBITDA
This measures the Company’s ability to generate cash from operation by adding back non-cash
expenses (i.e. depreciation and amortization expense) to earnings before interest and tax.
(e) Current Ratio
This determines the company’s ability to meet its currently maturing obligations using its current
resources. It indicates the possible tolerable shrinkage in current resources without threat to the
claims of current creditors.
Causes for Any Material Changes from Period to Period of FS, which shall include vertical
and horizontal analyses of any material item
Please refer to the discussions under Results of Operations and Financial Position for the year
ended December 31, 2009 vs. 2008, year ended December 31, 2008 vs. 2007 and year ended
December 31, 2007 vs. 2006.
The Company is not aware of the following:
(i) Any events that will trigger direct or contingent financial obligation that is material to the
company, including any default or acceleration of an obligation.
(ii) All material off-balance sheet transaction, arrangements, obligations (including contingent
obligations), and other relationships of the company with unconsolidated entities or other
persons created during the reporting period.
Seasonal Aspects that has Material Effect on the FS
There is no material effect with the seasonal aspect of certain raw materials specifically wheat on
the financial statements.
Audit and Audit Related Fees
For the years 2009 and 2008, the Company engaged the professional services of SGV and Co. for
an aggregate amount P1.6M for each year, respectively excluding out of pocket expenses. The
engagement is not limited to the examination and preparation of the company's financial
statements in accordance with generally accepted auditing standards. It includes on a test basis
review and evaluation of system, documentation and procedures to ascertain that adequate internal
controls are in placed. Also, they provide updates on latest regulatory or compliance requirement
with government agencies such as Securities and Exchange Commission and other government
agencies.

The audit committee’s approval policies and procedure for external auditors are:
1. Statutory audit of company's annual F/S:
a. The Audit Committee ensures that the services of the external auditor conform with
the provision of the company's manual of corporate governance specifically articles
2.3.4.1; 2.3.4.3 and 2.3.4.4
b. The Audit Committee makes an assessment of the quality of prior year audit work
services, scope, and deliverables and makes a determination of the reasonableness of
the audit fee based on the proposed audit plan for the current year.
c. The Audit Committee approved the final audit plan and scope of audit presented by
the external auditor before the conduct of audit. The final audit plan was already the
output after the conclusion of the series of pre-audit planning with Management.
d. The Audit Committee reports to the Board the approved audit plan.
2. For other services other than annual F/S audit:
a. The Audit Committee evaluates the necessity of the proposed services presented by
Management taking into consideration the following:
i. The effectiveness of company's internal control and risk management
arrangement, systems and procedures, and management degree of compliance.
ii. The effect and impact of new tax and accounting regulations and standards.
iii. Availability of in-house technical expertise.
iv. Cost benefit of the proposed undertaking.
b. The Audit Committee approves and ensures that other services provided by the
external auditor shall not be in conflict with the functions of the external auditor for
the annual audit of its financial statements.
Item 7 – Financial Statements
The consolidated financial statements and schedules listed are filed as part of previously
submitted form 17-A.
Item 8 – Changes in and Disagreements with Accountants on Accounting and Financial
Disclosure
There is no event in the past five (5) years wherein the Company had any disagreement with
regard to any matter relating to accounting principles or practices, financial statement disclosure
or auditing scope or procedure.

The Company regularly adopts New Statement of Financial Accounting Standards (SFAS)/
International Accounting Standards (IAS) where applicable.
PART III - CO�TROL O� COMPE�SATIO� A�D I�FORMATIO�
Item 9 – Directors and Executive Officers of the Issuer
(1) List of Directors, Including Independent Directors, and Executive Officers
+ame of Director/
Executive Officer
Position
Age
Term as
Director
Jose S. Concepcion Jr. Chairman of the Board 78 27
Ernest Fritz Server Vice Chairman 66 21
Jose Ma. A. Concepcion III Director/President & CEO 51 23
Joseph D. Server Director 69 30
Felicisimo M. Nacino Jr. Director/EVP & COO 57 14
John Marie A. Concepcion Director/CEO, URICI 48 22
Ma.Victoria Herminia C. Young Director/GM, ICC & White King
Division
50 3
Francisco A. Segovia Director 56 23
Raissa H. Posadas Director 49 13
Romeo L. Bernardo Independent Director 55 7
Lilia R. Bautista Independent Director 74 4
Raymond B. Azcarate Treasurer SVP & CFO 46 NA
Lauro B. Ramos Assistant Treasurer/GM, RLC 59 NA
Rowel S. Barba Corporate Secretary/VP & Head,
Corporate Legal & HR Division
45 NA
Norman P. Uy SVP & GM, Flour Division 51 NA
Gregory H. Banzon SVP & GM, BMG, Concurrent Sales &
Marketing Director
46 NA
Ramon M. Lopez VP & Exec. Assistant to the President 49 NA
Imelda J. Madarang VP, Export Division 63 NA
Minerva Laforteza VP, Controller for Management
Accounting
45 NA
Gary R. Guarnes AVP & Internal Audit Manager 52 NA
Philip V. Prieto AVP, Meat Purchasing 51 NA
As provided in the Company’s amended Articles of Incorporation, eleven (11) directors were
elected to its Board of Directors during the last Annual Stockholders meeting. The officers, on
the other hand, were elected during the Organizational Meeting following the Annual
Stockholders’ meeting, each to hold office until the corresponding meeting of the Board of
Directors in the next year or until a successor shall have been qualified and elected or appointed.
The Company’s Board of Directors has committees for Audit, Compensation, Nomination, and
Investment. There are two (2) independent directors, one of whom is the Chairman of the Audit
Committee and the other heads the Compensation Committee.

The following sets forth certain information as to the directors and executive officers of the
Company as of December 31, 2009:
Directors
Jose S. Concepcion, Jr.
78 years old
Filipino
Born on 29 December 1931, has an Associate’s degree in Business Administration from
De La Salle University and a Bachelor’s degree in Agriculture from Araneta University. He is the
Chairman of the Board of Directors of RFM Corporation and of Swift Foods, Inc. at the same time
Chief Executive Officer. He also holds the Chairman position in the Asean-Business Advisory
Council – Philippines, and East-Asia Business Council - Philippines. He is the Founding
Chairman of the National Citizens Movement for Free Elections (NAMFREL), Special Resource
Person of UCPB CIIF Finance Development. He is a member of the Board of Directors of
Philtown Properties, Inc. (formerly Philippine Townships, Inc.), and Member of the Board of
Trustees of CARITAS and RFM Foundation, Inc. He was previously the Secretary of the
Department of Trade and Industry, Chairman of the Board of Investments, member of the Central
Bank Monetary Board from 1986-1991, Co-Chairman of Bishops-Businessmen Conference from
1991-1998, and a delegate to the 1971 Constitutional Convention. He served as director of the
Corporation from years 1970 to 1985 and was first elected on 3 April 3 1997 as Chairman of the
Board.
Ernest Fritz Server
66 years old
Filipino
Born on 08 July 1943, has a Bachelor of Arts degree in Economics from the Ateneo de
Manila University and a Master’s degree in Business Administration from the Wharton School of
the University of Pennsylvania. He is Chairman of Uniphil Computer Corporation, Unidata
Corporation, Intercity Properties, Inc., and Millennium Mining and Management Corporation. He
is the Vice Chairman of the Board of Directors of RFM Corporation and RFM Science Park of the
Philippines, Inc. He is a member of the Board of Directors of Invest Asia Corporation, Philtown
Properties, Inc. (formerly Philippine Townships, Inc)., Philtown Property Management, Inc., One
Mckinley Place, Inc., RFM Equities, Inc. BJS Development Corporation and Worldwide Paper
Mills, Inc., He is also President of BJS Development Corporation, Sta. Mesa Machinery
Corporation, Inc., Trans-Pacific Properties, Inc., Geosands Resources Corporation, Eaglerock
Mining Corporation and Philam Fund, Inc. He first became a director of the Corporation on 27
October 1988.
Jose Ma. A. Concepcion III
51 years old
Filipino
Born on 23 June 1958, has a Bachelor's degree in Business Management from Dela Salle
University. He is the President and Chief Executive Officer of the Corporation. He was
appointed by the President of the Philippines as the Presidential Consultant for Entrepreneurship
in the early part of 2005. He is the Chairman of the Board of Directors of Cabuyao Meat

Processing Corporation, Interbake Commissary Corporation, Philtown Property Management,
Inc., RFM Equities, Inc., RFM Insurance Brokers, Inc., FWBC Holdings, Inc., Filipinas Water
Bottling Company, Inc., Unilever RFM Ice Cream, Inc.(formerly Selecta Walls, Inc.), and Philstar
Global Corporation. He is the Vice- Chairman of One Mckinley Place, Inc. He is a director of
Concepcion Industries Inc., one of the largest appliance manufacturers in the country. He was an
awardee of the Ten Outstanding Young Men of the Philippines (TOYM) in 1995 and Time Global
100 List of Young Leaders for the New Millennium in 1994. He is associated with major business
and industry and various socio-civic associations that includes the Philippine Center for
Entrepreneurship. He first became a director of the Corporation on 30 October 1986 and was
elected President and Chief Executive Officer in 1989.
Joseph D. Server Jr.
69 years old
Filipino
Born on 08 October 1940, has a Bachelor of Arts degree in Economics from the Ateneo de
Manila University and a Master’s degree in Business Administration from the Wharton School of
the University of Pennsylvania in the United States. He is Chairman of the Board of BJS
Development Corporation. He serves as Chairman of Rizal Lighterage Corporation and director
of Swift Foods, Inc. He first became a director of the Corporation on 30 August 1979.
Felicisimo M. �acino, Jr.
57 years old
Filipino
Born on 09 May, 1952, has a Bachelor of Arts degree in Economics and a Master’s degree
in Business Administration, both from the University of the Philippines. He is the Executive
Vice-President & Chief Operating Officer of the Corporation and serves as Director of RFM
Corporation, Philtown Properties, Inc.(formerly Philippine Townships, Inc.), RFM Insurance
Brokers, Inc., Rizal Lighterage Corporation, Unilever RFM Ice Cream Inc., and other companies
in the RFM Group. He first became a director of the Corporation on 30 March 1995.
John Marie A. Concepcion
48 years old
Filipino
Born on 13 January 1962, has a degree in Business Administration from Seattle
University, Washington, U.S.A. He is the Chief Executive Officer & Managing Director of
Unilever RFM Ice Cream Inc. (formerly Selecta Walls, Inc.). He is also a director and treasurer of
Selecta Walls Land Corporation (SWLC).He became a director of the Corporation on 29 October
1987.
Ma. Victoria Herminia C. Young
50 years old
Filipino
Born on 4 August 1959, has a Bachelor of Science Degree in Management and Marketing
from Assumption College in 1981. She is currently the General Manager of Interbake
Commissary Corporation and Vice President of White King Division, a division in the Branded
Food Group of the Corporation. She is a Trustee and President of RFM Foundation, Inc., Trustee
of Soul Mission Org., Ronald McDonald House of Charities and a Director of Interbake
Commissary Commission.

Francisco A. Segovia
56 years old
Filipino
Born on 17 January 1954, has a Bachelor of Science degree in Business Management
from the Ateneo De Manila University. He is Vice-Chairman of Rizal Lighterage Corporation.
He is President of Segovia & Corporation, Inc., Fritz International Philippines, Inc., Horseworld,
Inc., Big A. Aviation Corporation, Intellicon, Inc., Regina Realty/Chilco Holdings, Araneta
Institute of Agriculture, Republic Dynamics Corporation and Republic Consolidated Corporation.
He is a director of Rizal Lighterage Corporation, RFM Insurance Brokers, Inc., RFM Equities,
Inc., Philtown Properties, Inc. (formerly Philippine Townships, Inc.), and Invest Asia Corporation.
He first became a director of the Corporation on 30 October 1986.
Raissa Hechanova Posadas
49 years old
Filipino
Born on 16 April 1960, has a Master's degree in Business Administration from Imede
(now IMD) Lausanne, Switzerland and a degree in Bachelor of Arts major in Applied Economics
from De La Salle University. She joined the Corporation as director in April 1997, replacing her
father, Mr. Rafael G. Hechanova, former Chairman of the Board of Directors of RFM
Corporation. She first became a director of the Corporation on 3 April 1997.
Romeo L. Bernardo
55 years old
Filipino
Born 5 September 1954, has a Bachelor of Science degree in Business Economics (magna
cum laude) from the University of the Philippines (Diliman) in 1974 and a Masters degree in
Development Economics (Valedictorian) from Williams College (Williamstown, Massachusetts,
U.S.A.) in 1977. He is the President & Managing Director of Lazaro Bernardo Tiu and
Associates, Inc., Chairman of Ayala Life Peso, Dollar and Euro Bond Funds and Philippine Stock
index Fund and the UP School of Economics Alumni Association, Board Member of Ayala Plans,
Inc., Ayala Life Assurance, Inc., Globe Telecom, Bank of the Philippine Islands, BPI Family
Savings Bank, BPI Direct Savings Bank, BPI Capital Corporation, BPI Leasing Corporation, BPI
Rental Corporation, Philippine National Re-insurance Corporation, Philippine Investment
Management (PHINMA), Inc., Institute of Development and Econometric Analysis, Inc.,
Philippine Institute for Development Studies, PSi Technologies Holdings, Inc., East Asia Power
Resources Corporation and Aboitiz Power Corporation. He is Vice Chairman and a Founding
Fellow of the Foundation for Economic Freedom, Vice President of Financial Executives Institute
of the Philippines and was formerly the President of the Philippine Economic Society and the
Federation of ASEAN Economic Societies. He was formerly Alternate Director of the Asian
Development Bank (1997-1998), Undersecretary for International Finance, Privatization, and
Treasury Operations of the Department of Finance (1990-1996). He first became independent
director of RFM Corporation on 25 September 2002. He is married to Amina Rasul Bernardo
with three children.
Lilia R Bautista
74 years old
Filipino
Born on 15 August 1935, Filipino is an Independent Director of the Company since
September 2006. She is also an independent director of Bank of the Philippine Islands, BPI
Capital, Transnational Diversified Group and Thunderbird Poro Point Development Ventures.
Recently, she was appointed as a member of the Appellate Body of the World Trade Organization
(WTO), with the rank of WTO Deputy Director General. She previously held several positions
including Chairman, Securities and Exchange Commission, Ex-Officio Member, Anti-Money
Laundering Council, Senior Undersecretary and Special Trade Negotiator, DTI, Ambassador
Extraordinary and Plenipotentiary, Chief of Mission, Class I and Permanent Representative to the
United Nations Office, World Trade Organization, World Health Organization, International
Labor Organization and other International Organizations in Geneva, Switzerland, Acting
Secretary , DTI, Chairman Ex- Officio–Board of Investments, National Development Company,
Garments and Textile Export Board, Philippine International Trading Corp., Export Processing
Zone Authority, Center for International Trade Expositions and Missions, Inc., Small and Medium
Development Council, Export and Investment Development Council, Ex-Officio Member-
Monetary Board and various government corporations and inter-agency bodies,
Undersecretary/Deputy Minister, DTI, Concurrently Governor, Board of Investments and
Executive Director and Vice Chairman of the Technology Transfer Board, Asst. Secretary/ Asst.
Minister, DTI, Legal Officer, Chief Legal Officer, Asst. Director , BOI, Hearing Officer of the
Juvenile and Domestic Relations Court of Manila, Legal Officer of the Office of the President,
Legal Editor, Corporation Trust Co, New York, Legal Editor of Prentice Hall, New Jersey and
Ambassador to Belgium. She was a director at the Philippine Judicial Academy and Development
Academy of the Philippines. She holds an L.L.B., University of the Philippines, LLM, University
of Michigan (Dewitt Fellow), M.B.A., University of the Philippines, and attended special courses
in corporate finance and reorganization, New York University and Investment negotiation course,
Georgetown University.
Executive Officers
Management is comprised of owner-managers and professional managers. Mr. Jose Maria A.
Concepcion III is the President and Chief Executive officer of RFM Corporation, and is also a
major shareholder. He joined the Company in 1980 as a route salesman, and occupied positions in
sales and marketing before he became President and Chief Executive Officer in 1989.
Raymond B. Azcarate 46 years old
Filipino
Born on 02 October 1963, has a Bachelor of Science degree in Business Administration
(cum laude) from the University of the Philippines. He is presently the Treasurer and Senior
Vice-President and Chief Finance Officer of the Corporation, and is the Assistant Treasurer of
Philippine Townships, Inc., Rizal Lighterage Corporation. He was elected Treasurer of RFM
Insurance Brokers, Inc. in 2005. He joined the Corporation in 1994.

Lauro B. Ramos 59 years old
Filipino
Born on 3 February 1951, obtained his degree of Bachelor of Science in Business
Administration and Accountancy from the University of the East. He passed the CPA Board
Exam in 1972. He is the General Manager of Rizal Lighterage Corporation and Director of RFM
Insurance Brokerage, Inc., Interbake Commissary Corporation, Rizal Lighterage Corporation and
RFM Equities, Inc.
�orman P. Uy
51 years old
Filipino
Born on 23 December 23 1958, he joined the Corporation in 1989 as Manager for General
Services Division. He is a graduate of AB Philosophy at the University of the Philippines.
Ramon M. Lopez
49 years old
Filipino
Born on 26 October 1960, has a Bachelor of Arts degree major in Economics from U.P
School of Economics and a Masters Degree in Economics at Williams College, Massachusetts,
U.S.A. He joined the Corporate Planning Department of RFM Corporation in 1994. He is a
member of the Board of Directors of Phil. Chamber of Food Manufacturers.
Gregory H. Banzon
46 years old
Filipino
Born on March 12, 1964, has a Bachelor of Science Degree in Commerce majoring in
Marketing Management from De La Salle University where he was a member of the Student
Council and graduated in 1985. He is concurrently the General Manager of the Milk & Juice
Division as well as SVP for the Sales Division. He joined RFM in April 2006 after a brief stint as
an entrepreneur and 10 years with Johnson & Johnson (J&J) where he held the position of
Managing Director of J&J Indonesia as well as ASEAN VP for Marketing from 2000 to 2005 and
various positions of increasing responsibility in Marketing and Sales for J&J Philippines. Prior to
J&J, Greg was with Bayer Philippines, Consumer Products Division as Marketing Manager. His
first employment was with Citibank as part of the Management Trainee Program and subsequently
held key positions with the Bank’s Treasury Division.
Rowel S. Barba
45 years old
Filipino
Born on 13 May 1964, has a Bachelor of Arts degree major in Political Science and
Bachelor of Laws degree, both from the University of the Philippines (Diliman). Prior to joining
the Corporation, he was the Corporate Secretary, Director, Member of the Management
Committee and Chief Legal Counsel and Head of the Legal Division of Jaka Investments
Corporation. While with Jaka, he also served as the Corporate Secretary and director in various
subsidiaries and affiliates, and the Operating Unit Head of the Transport Division. He was the
former Governor for Southern Luzon of the Integrated Bar of the Philippines and Legal Counsel
of the Philippine Practical Shooting Association. He is currently the Vice President and Head of
Corporate Legal Division of the Corporation. He is also the Corporate Secretary of Philippine
Townships, Inc., RFM Insurance Brokers, Inc. and Rizal Lighterage Corporation. He joined
RFM Corporation in April 2007.
Imelda J. Madarang
63 years old
Filipino
Born on October 9, 1946, has a Bachelor of Arts in Foreign Service degree from St.
Theresa’s College, Q.C. and a Masters in Management degree from Asian Institute of
Management. She was formerly the Vice President and General Manager of Swift Tuna
Corporation. Before joining the Corporation, she served as Assistant Secretary for Regional
Operations and various other post at the Department of Trade & Industry where she was
concurrently the Director of Food Terminal Inc. and National Food Authority. She joined RFM
Corporation in 1995.
Minerva C. Laforteza 45 years old
Filipino
Born on 9 March 1965, has a Bachelor of Science degree in Business Administration and
Accountancy and a Masters degree in Business Administration from the University of the
Philippines. She joined RFM Corporation in 1989 as Accounting Supervisor. She is currently the
Vice-President of Branded Food Group for Accounting.
Gary G. Guarnes
52 years old
Filipino
Born on 16 October 1957, has a Bachelor of Science degree in Business Administration
and Accounting at the National College of Business and Arts in 1978. He became a Certified
Public Accountant in 1979. He joined Republic Consolidated Corporation (formerly an affiliate
of RFM Corporation) in 1979 as an Accounting Bookkeeper.
Philip V. Prieto
51 years old
Filipino
Born on 20 August 1958, has a Bachelors of Arts degree from the University of San
Francisco. He is the AVP – Corporate Purchasing. He joined the corporation in 1995 as the
Purchasing Manager of Cosmos Bottling Corporation when this was still under the ownership of
RFM Corporation.
(2) Significant Employees
There is no person other than the executive officers, who are expected by the Corporation to make
significant contribution to the business.
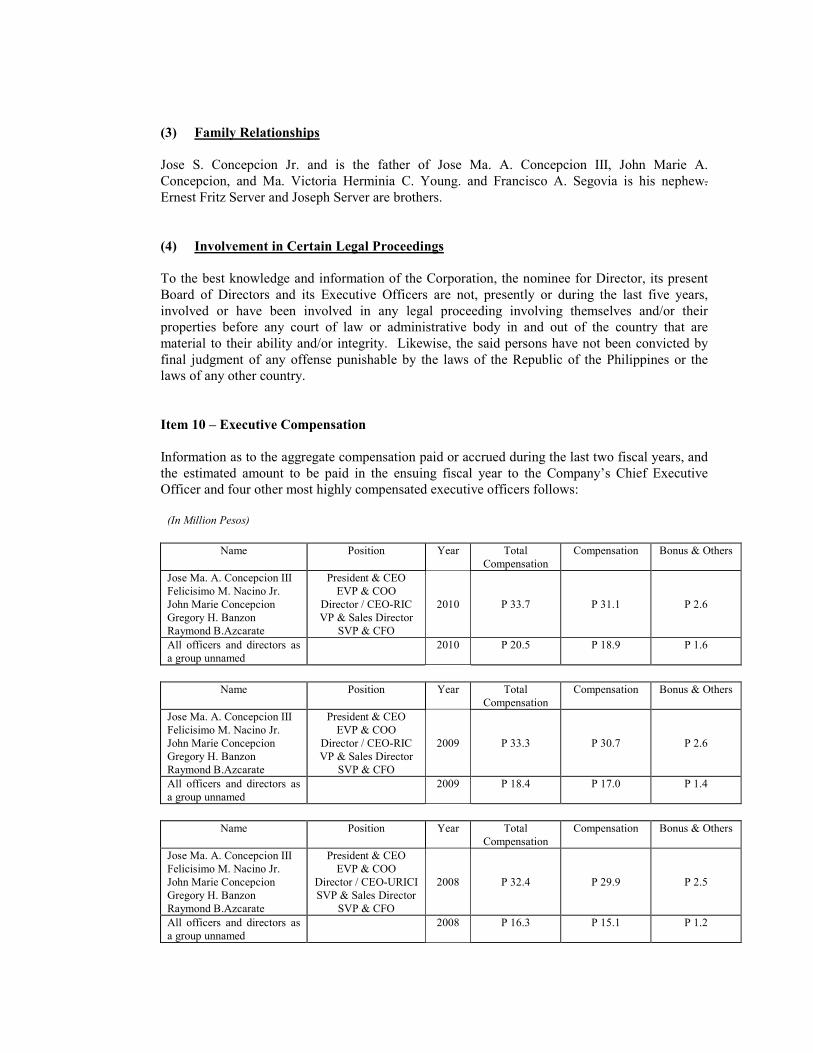
(3) Family Relationships
Jose S. Concepcion Jr. and is the father of Jose Ma. A. Concepcion III, John Marie A.
Concepcion, and Ma. Victoria Herminia C. Young. and Francisco A. Segovia is his nephew.
Ernest Fritz Server and Joseph Server are brothers.
(4) Involvement in Certain Legal Proceedings
To the best knowledge and information of the Corporation, the nominee for Director, its present
Board of Directors and its Executive Officers are not, presently or during the last five years,
involved or have been involved in any legal proceeding involving themselves and/or their
properties before any court of law or administrative body in and out of the country that are
material to their ability and/or integrity. Likewise, the said persons have not been convicted by
final judgment of any offense punishable by the laws of the Republic of the Philippines or the
laws of any other country.
Item 10 – Executive Compensation
Information as to the aggregate compensation paid or accrued during the last two fiscal years, and
the estimated amount to be paid in the ensuing fiscal year to the Company’s Chief Executive
Officer and four other most highly compensated executive officers follows:
(In Million Pesos)
Name Position Year Total
Compensation
Compensation Bonus & Others
Jose Ma. A. Concepcion III
Felicisimo M. Nacino Jr.
John Marie Concepcion
Gregory H. Banzon
Raymond B.Azcarate
President & CEO
EVP & COO
Director / CEO-RIC
VP & Sales Director
SVP & CFO
2010
P 33.7
P 31.1
P 2.6
All officers and directors as
a group unnamed
2010 P 20.5
P 18.9 P 1.6
Name Position Year Total
Compensation
Compensation Bonus & Others
Jose Ma. A. Concepcion III
Felicisimo M. Nacino Jr.
John Marie Concepcion
Gregory H. Banzon
Raymond B.Azcarate
President & CEO
EVP & COO
Director / CEO-RIC
VP & Sales Director
SVP & CFO
2009
P 33.3
P 30.7
P 2.6
All officers and directors as
a group unnamed
2009 P 18.4
P 17.0 P 1.4
Name Position Year Total
Compensation
Compensation Bonus & Others
Jose Ma. A. Concepcion III
Felicisimo M. Nacino Jr.
John Marie Concepcion
Gregory H. Banzon
Raymond B.Azcarate
President & CEO
EVP & COO
Director / CEO-URICI
SVP & Sales Director
SVP & CFO
2008
P 32.4
P 29.9
P 2.5
All officers and directors as
a group unnamed
2008 P 16.3
P 15.1 P 1.2
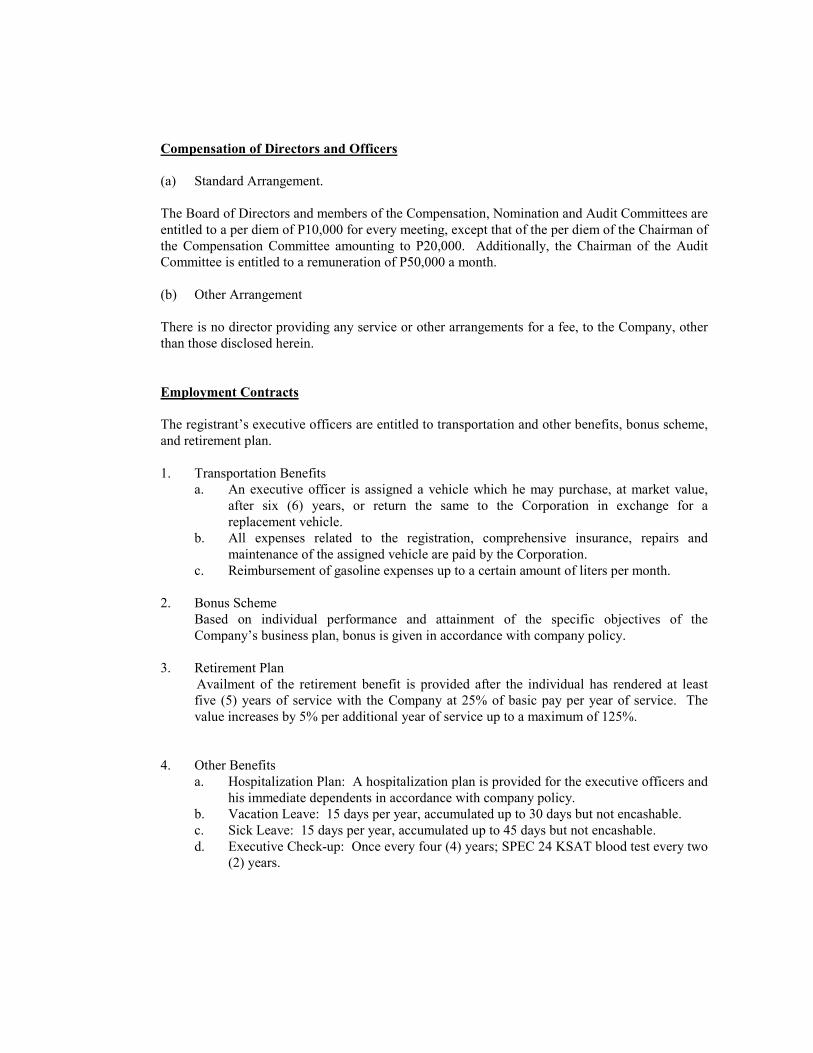
Compensation of Directors and Officers
(a) Standard Arrangement.
The Board of Directors and members of the Compensation, Nomination and Audit Committees are
entitled to a per diem of P10,000 for every meeting, except that of the per diem of the Chairman of
the Compensation Committee amounting to P20,000. Additionally, the Chairman of the Audit
Committee is entitled to a remuneration of P50,000 a month.
(b) Other Arrangement
There is no director providing any service or other arrangements for a fee, to the Company, other
than those disclosed herein.
Employment Contracts
The registrant’s executive officers are entitled to transportation and other benefits, bonus scheme,
and retirement plan.
1. Transportation Benefits
a. An executive officer is assigned a vehicle which he may purchase, at market value,
after six (6) years, or return the same to the Corporation in exchange for a
replacement vehicle.
b. All expenses related to the registration, comprehensive insurance, repairs and
maintenance of the assigned vehicle are paid by the Corporation.
c. Reimbursement of gasoline expenses up to a certain amount of liters per month.
2. Bonus Scheme
Based on individual performance and attainment of the specific objectives of the
Company’s business plan, bonus is given in accordance with company policy.
3. Retirement Plan
Availment of the retirement benefit is provided after the individual has rendered at least
five (5) years of service with the Company at 25% of basic pay per year of service. The
value increases by 5% per additional year of service up to a maximum of 125%.
4. Other Benefits
a. Hospitalization Plan: A hospitalization plan is provided for the executive officers and
his immediate dependents in accordance with company policy.
b. Vacation Leave: 15 days per year, accumulated up to 30 days but not encashable.
c. Sick Leave: 15 days per year, accumulated up to 45 days but not encashable.
d. Executive Check-up: Once every four (4) years; SPEC 24 KSAT blood test every two
(2) years.
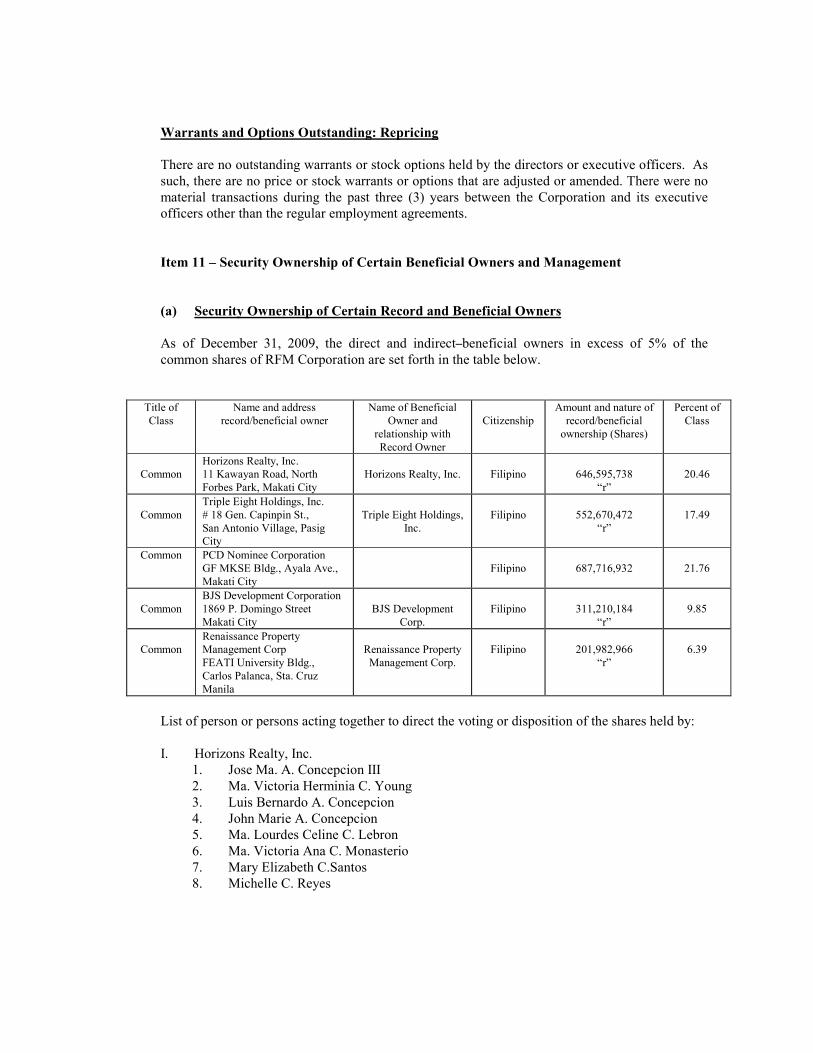
Warrants and Options Outstanding: Repricing
There are no outstanding warrants or stock options held by the directors or executive officers. As
such, there are no price or stock warrants or options that are adjusted or amended. There were no
material transactions during the past three (3) years between the Corporation and its executive
officers other than the regular employment agreements.
Item 11 – Security Ownership of Certain Beneficial Owners and Management
(a) Security Ownership of Certain Record and Beneficial Owners
As of December 31, 2009, the direct and indirect beneficial owners in excess of 5% of the
common shares of RFM Corporation are set forth in the table below.
Title of
Class
Name and address
record/beneficial owner
Name of Beneficial
Owner and
relationship with
Record Owner
Citizenship
Amount and nature of
record/beneficial
ownership (Shares)
Percent of
Class
Common
Horizons Realty, Inc. 11 Kawayan Road, North
Forbes Park, Makati City
Horizons Realty, Inc.
Filipino
646,595,738
“r”
20.46
Common
Triple Eight Holdings, Inc.
# 18 Gen. Capinpin St.,
San Antonio Village, Pasig City
Triple Eight Holdings,
Inc.
Filipino
552,670,472
“r”
17.49
Common PCD Nominee Corporation
GF MKSE Bldg., Ayala Ave.,
Makati City
Filipino
687,716,932
21.76
Common
BJS Development Corporation
1869 P. Domingo Street
Makati City
BJS Development
Corp.
Filipino
311,210,184
“r”
9.85
Common
Renaissance Property Management Corp
FEATI University Bldg.,
Carlos Palanca, Sta. Cruz
Manila
Renaissance Property
Management Corp.
Filipino
201,982,966
“r”
6.39
List of person or persons acting together to direct the voting or disposition of the shares held by:
I. Horizons Realty, Inc.
1. Jose Ma. A. Concepcion III
2. Ma. Victoria Herminia C. Young
3. Luis Bernardo A. Concepcion
4. John Marie A. Concepcion
5. Ma. Lourdes Celine C. Lebron
6. Ma. Victoria Ana C. Monasterio
7. Mary Elizabeth C.Santos
8. Michelle C. Reyes

II. Triple Eight Holdings Inc.
1. Jose Ma. A. Concepcion III
2. Ma. Victoria Ana A. Concepcion
3. Ma. Luisa O. Concepcion
4. Margarita O. Concepcion
5. Monica O. Concepcion
6. Martha O. Uy
III. PCD Nominee Corporation (Filipino) – The PCD is the depository of RFM common shares
traded in the Philippine Stock Exchange. Where shareholders are called upon to vote or
similar matter, the PCD Nominee Corporation only informs its participant brokers of such
event. In turn, participant brokers get in touch with their clients who are the beneficial
owners of shares lodge with the PCD. And it is the beneficial owners who have the voting
power.
IV. BJS Development Corporation
1. Gordon Joseph Server
2. Ernest Fritz Server
3. Joseph B. Server
4. Josephine Marie Server
5. James Server Banzhaf
6. Anne Christine Banzhaf
7. Ernest Fritz Server Jr.
8. Ma. Eugenia B. Server
V. Renaissance Property Management Corporation
1. Jose M. Segovia
2. Francisco Segovia
3. Margaret Segovia
4. Jose Ma. S. Lopez
5. Cesar A. Lopez Jr.
6. Mary Ann C. Pernas
7. Jose S. Concepcion Jr.
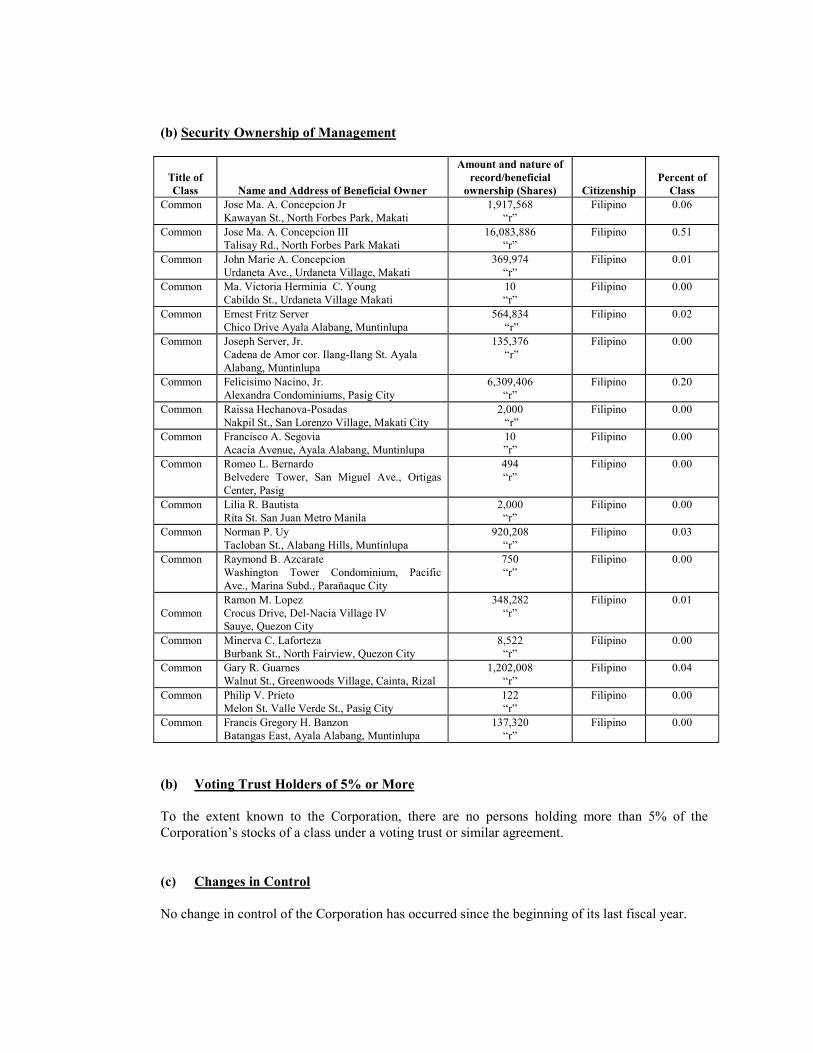
(b) Security Ownership of Management
Title of
Class
�ame and Address of Beneficial Owner
Amount and nature of
record/beneficial
ownership (Shares)
Citizenship
Percent of
Class
Common Jose Ma. A. Concepcion Jr
Kawayan St., North Forbes Park, Makati
1,917,568
“r”
Filipino 0.06
Common Jose Ma. A. Concepcion III Talisay Rd., North Forbes Park Makati
16,083,886 “r”
Filipino 0.51
Common John Marie A. Concepcion
Urdaneta Ave., Urdaneta Village, Makati
369,974
“r”
Filipino 0.01
Common Ma. Victoria Herminia C. Young
Cabildo St., Urdaneta Village Makati
10
“r”
Filipino 0.00
Common Ernest Fritz Server
Chico Drive Ayala Alabang, Muntinlupa
564,834
“r”
Filipino 0.02
Common Joseph Server, Jr.
Cadena de Amor cor. Ilang-Ilang St. Ayala
Alabang, Muntinlupa
135,376
“r”
Filipino 0.00
Common Felicisimo Nacino, Jr.
Alexandra Condominiums, Pasig City
6,309,406
“r”
Filipino 0.20
Common Raissa Hechanova-Posadas
Nakpil St., San Lorenzo Village, Makati City
2,000
“r”
Filipino 0.00
Common Francisco A. Segovia
Acacia Avenue, Ayala Alabang, Muntinlupa
10
”r”
Filipino 0.00
Common Romeo L. Bernardo
Belvedere Tower, San Miguel Ave., Ortigas
Center, Pasig
494
“r”
Filipino 0.00
Common Lilia R. Bautista
Rita St. San Juan Metro Manila
2,000
“r”
Filipino 0.00
Common Norman P. Uy
Tacloban St., Alabang Hills, Muntinlupa
920,208
“r”
Filipino 0.03
Common Raymond B. Azcarate
Washington Tower Condominium, Pacific
Ave., Marina Subd., Parañaque City
750
“r”
Filipino 0.00
Common
Ramon M. Lopez
Crocus Drive, Del-Nacia Village IV Sauye, Quezon City
348,282
“r”
Filipino 0.01
Common Minerva C. Laforteza
Burbank St., North Fairview, Quezon City
8,522
“r”
Filipino 0.00
Common Gary R. Guarnes
Walnut St., Greenwoods Village, Cainta, Rizal
1,202,008
“r”
Filipino 0.04
Common Philip V. Prieto
Melon St. Valle Verde St., Pasig City
122
“r”
Filipino 0.00
Common Francis Gregory H. Banzon
Batangas East, Ayala Alabang, Muntinlupa
137,320
“r”
Filipino 0.00
(b) Voting Trust Holders of 5% or More
To the extent known to the Corporation, there are no persons holding more than 5% of the
Corporation’s stocks of a class under a voting trust or similar agreement.
(c) Changes in Control
No change in control of the Corporation has occurred since the beginning of its last fiscal year.

Item 12 – Certain Relationships and Related Transactions
The Company and its subsidiaries have no transaction involving a director, executive officer, or
stockholder, nor members of their immediate family, who owns ten percent (10%) or more of total
outstanding shares of the Company that are not in the ordinary course of the business of the
Company.
The Parent Company is engaged in the manufacture and sale of flour, juices, milk, processed and
canned meat, pasta and other flour products.
The Parent Company wholly or partially owns its subsidiaries where the basis of management
control lies, as follows:
Subsidiaries and Associates
(As of December 31, 2009)
% of Ownership/
Basis of Control
Cabuyao Meat Processing Corporation 100.00
Interbake Commissary Corporation (ICC) 100.00
Philippine Township, Inc. and Subsidiaries -
RFM Realty Marketing Corporation -
Philtown Property Management, Inc. -
First Tanauan Realty Corporation -
McKinley Tower, Inc. -
First San Rafael Realty Corporation (FTRC) -
Philtown Utilities Corporation -
RFM Equities, Inc. and Subsidiaries 100.00
RFM Insurance Brokers, Inc. 100.00
Conglomerate Securities and Financing Corporation 88.68
RFM Foods Philippines Corporation * 100.00
Southstar Bottled Water Company, Inc. * 100.00
Swift Tuna Corporation * 100.00
FWBC Holdings, Inc. and Susidiary 83.38
Filipinas Water Bottling Company, Inc. (FWBC) 58.37
Rizal Lighterage Corporation 82.98
RFM Canning and Marketing Corporation * 70.00
WS Holdings 60.00
Selecta Wall’s Inc. 50.00
RFM Science Park 40.00
Selecta Wall’s Land, Inc. 35.00
* Dormant

Significant related party transactions are as follows:
Business Purpose of
Arrangements
Related Parties
Transaction Business
Determined
Transaction Prices
Description of
Evaluation, if
Applicable
On Going
Commitments Due
to Arrangements
Sales
Purchases of product
and services
Parent Company
Interbake
Rizal Lighterage
Parent Company
Interbake
Rizal Lighterage
2009 2008 P131M P123M
P235M P163M
P 38M P 8M
P273M P171M
P131M P123M
P - P -
- based on prevailing prices available for
all customers
for working capital
purposes and
investment activities from/to subsidiaries
and other related
parties
Availment / extensions of
both interest-bearing and
non-interest bearing cash advances
No fixed repayment
terms; certain part of the
balance of advances from parent company is
subject to annual interest
of 9% on the monthly
balance.
Indefinite
Distributorship
services
Provided by Parent
Company to URICI for export of frozen dairy
dessert/ mellorine.
Inconsideration of
service provided, the Parent Company bills
service fees equivalent to
7% of the total Export
sales.
Automatic renewal
Management
Services
Parent Company to RIBI Under management
contracts, a yearly management fee of
P500,000
Covering period July
1, 1998 to June 30, 2001, renewable by
mutual agreement of
parties concerned
Lease of office
spaces
The Company has a lease
agreement for office space
with Invest Asia Corporation
Lease expense amounted
to P2.88M and P2.62M
in 2009 and 2008, respectively.
Automatic renewal
unless terminated by
the lessee.
Management
agreement
Parent Company to ICC Monthly fee of P0.3M
from January 1, 2009.
On October 1, 2009, the
monthly fee increased from P0.3M to P1.0M
Automatic renewal
Sale of parcel of
land
In 2007, Philtown sold
certain parcels of land
(including the RFM
Corporate Center, the
Company’s registered office address) to Invest
Asia
Total consideration
received inclusive of
VAT – P305M
The Company has no material transactions (that may not be available from others) with other
parties falling outside the definition of “related parties”.
Transactions with Promoters.
None.

PART IV – CORPORATE GOVER�A�CE
Item 13 – Corporate Governance
(a) Evaluation System to Measure Compliance with Manual of Corporate Governance
There is no particular system presently being applied to measure the Corporation’s
compliance with the provisions of its Manual on Good Corporate Governance. Compliance
with the Manual on good Corporate Governance is validated by the Corporation using the
Corporate Governance Self-Rating Form.
(b) Measure being Undertaken to Fully Comply with the Adopted Leading Practices on
Good Corporate Governance
The following are some of the measures undertaken by the Corporation to ensure that full
compliance with the leading practices on good governance are observed:
1. During the scheduled meetings of the Board of Directors, the attendance of each
director is monitored and recorded;
2. The Compliance Officer has been designated to monitor compliance with the
provisions and requirements of the Corporation’s Manual on Corporate Governance;
3. The Corporation has designated an audit committee, compensation committee,
nomination committee, and investment committee;
4. The Board has elected independent directors of at least two or 20% of the member of
such Board, whichever is lesser;
5. The nomination committee pre-screens and shortlists all candidates nominated to
become directors in accordance with the qualification and disqualification set up and
established;
6. The directors and officers were given copies of the Manual of the Corporate
Governance of the Corporation for their information, guidance and compliance.
(c) Deviation from the Corporation’s Manual of Corporate Governance
Per records, no director failed to meet the fifty percent (50%) attendance requirement in all
board meetings, whether regular or special, during his incumbency, or the immediately
preceding twelve (12) months prior to the next election in accordance with the Manual on
Corporate Governance of the Corporation.
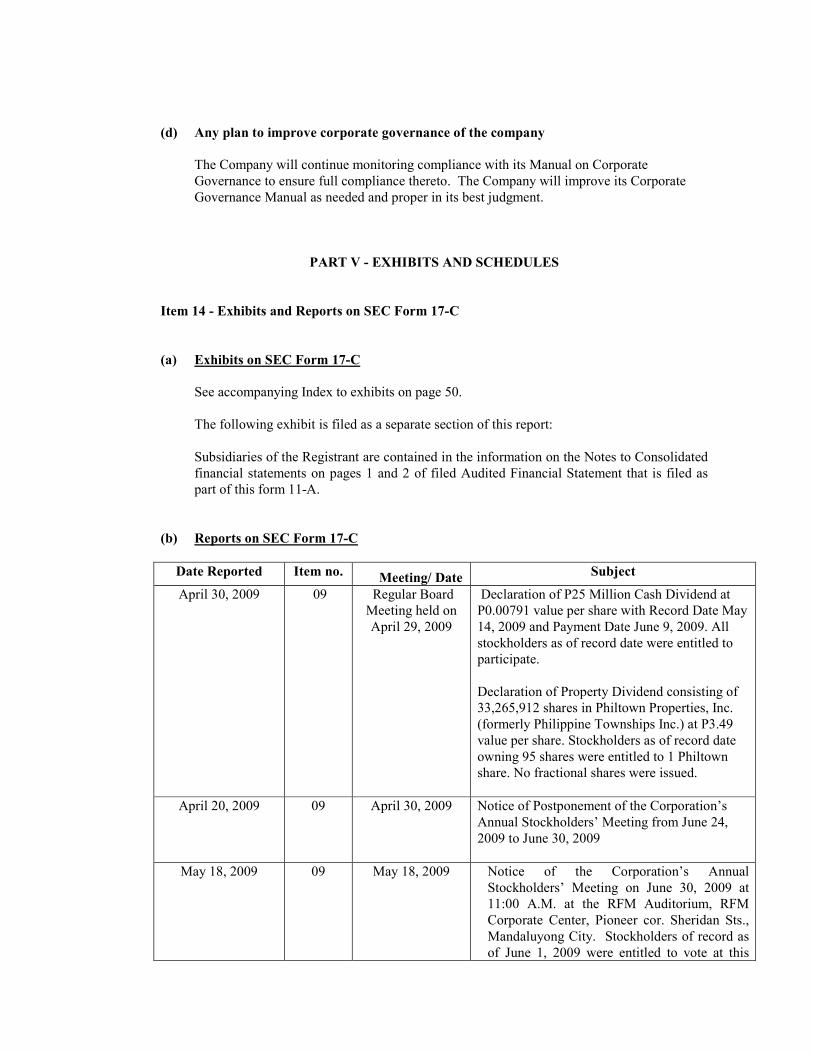
(d) Any plan to improve corporate governance of the company
The Company will continue monitoring compliance with its Manual on Corporate
Governance to ensure full compliance thereto. The Company will improve its Corporate
Governance Manual as needed and proper in its best judgment.
PART V - EXHIBITS A�D SCHEDULES
Item 14 - Exhibits and Reports on SEC Form 17-C
(a) Exhibits on SEC Form 17-C
See accompanying Index to exhibits on page 50.
The following exhibit is filed as a separate section of this report:
Subsidiaries of the Registrant are contained in the information on the Notes to Consolidated
financial statements on pages 1 and 2 of filed Audited Financial Statement that is filed as
part of this form 11-A.
(b) Reports on SEC Form 17-C
Date Reported Item no. Meeting/ Date
Subject
April 30, 2009 09 Regular Board
Meeting held on
April 29, 2009
Declaration of P25 Million Cash Dividend at
P0.00791 value per share with Record Date May
14, 2009 and Payment Date June 9, 2009. All
stockholders as of record date were entitled to
participate.
Declaration of Property Dividend consisting of
33,265,912 shares in Philtown Properties, Inc.
(formerly Philippine Townships Inc.) at P3.49
value per share. Stockholders as of record date
owning 95 shares were entitled to 1 Philtown
share. No fractional shares were issued.
April 20, 2009 09 April 30, 2009 Notice of Postponement of the Corporation’s
Annual Stockholders’ Meeting from June 24,
2009 to June 30, 2009
May 18, 2009 09 May 18, 2009 Notice of the Corporation’s Annual
Stockholders’ Meeting on June 30, 2009 at
11:00 A.M. at the RFM Auditorium, RFM
Corporate Center, Pioneer cor. Sheridan Sts.,
Mandaluyong City. Stockholders of record as
of June 1, 2009 were entitled to vote at this
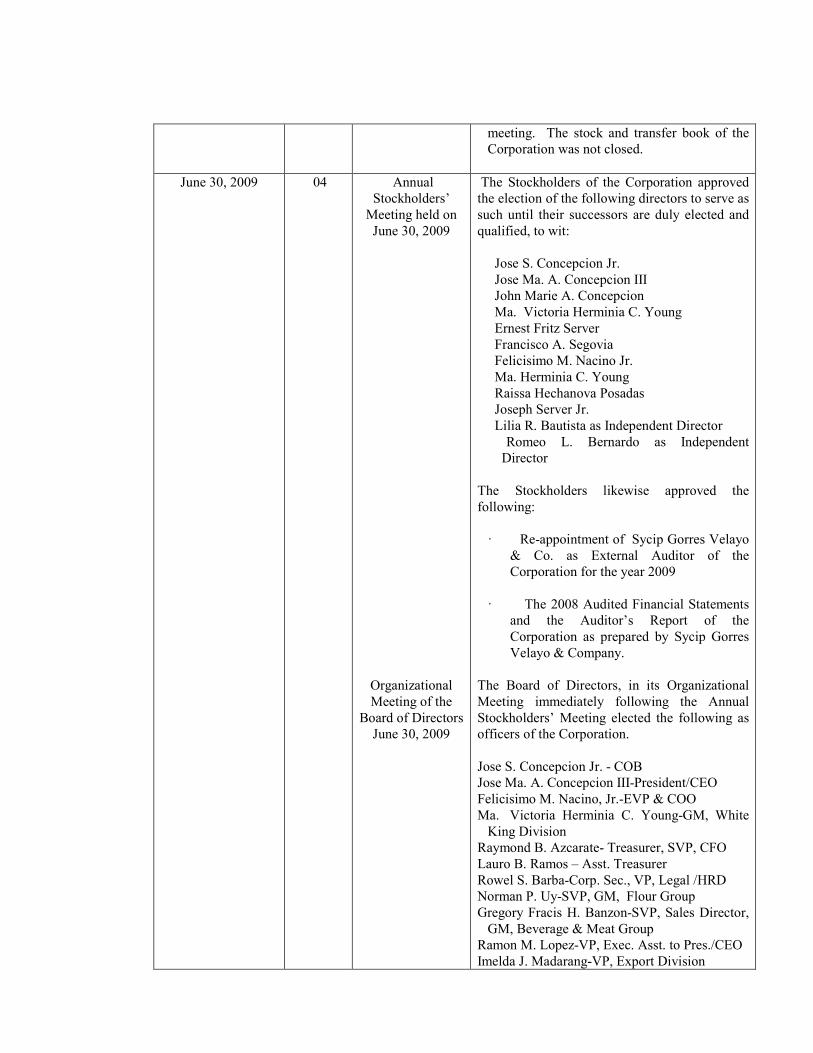
meeting. The stock and transfer book of the
Corporation was not closed.
June 30, 2009 04
Annual
Stockholders’
Meeting held on
June 30, 2009
Organizational
Meeting of the
Board of Directors
June 30, 2009
The Stockholders of the Corporation approved
the election of the following directors to serve as
such until their successors are duly elected and
qualified, to wit:
Jose S. Concepcion Jr.
Jose Ma. A. Concepcion III
John Marie A. Concepcion
Ma. Victoria Herminia C. Young
Ernest Fritz Server
Francisco A. Segovia
Felicisimo M. Nacino Jr.
Ma. Herminia C. Young
Raissa Hechanova Posadas
Joseph Server Jr.
Lilia R. Bautista as Independent Director
Romeo L. Bernardo as Independent
Director
The Stockholders likewise approved the
following:
· Re-appointment of Sycip Gorres Velayo
& Co. as External Auditor of the
Corporation for the year 2009
· The 2008 Audited Financial Statements
and the Auditor’s Report of the
Corporation as prepared by Sycip Gorres
Velayo & Company.
The Board of Directors, in its Organizational
Meeting immediately following the Annual
Stockholders’ Meeting elected the following as
officers of the Corporation.
Jose S. Concepcion Jr. - COB
Jose Ma. A. Concepcion III-President/CEO
Felicisimo M. Nacino, Jr.-EVP & COO
Ma. Victoria Herminia C. Young-GM, White
King Division
Raymond B. Azcarate- Treasurer, SVP, CFO
Lauro B. Ramos – Asst. Treasurer
Rowel S. Barba-Corp. Sec., VP, Legal /HRD
Norman P. Uy-SVP, GM, Flour Group
Gregory Fracis H. Banzon-SVP, Sales Director,
GM, Beverage & Meat Group
Ramon M. Lopez-VP, Exec. Asst. to Pres./CEO
Imelda J. Madarang-VP, Export Division

Minerva C. Laforteza-VP, Beverage & Meat
Group Accounting
Adolfo G. Alvarez-VP, Sales
Gary G. Guarnes-AVP, Audit Manager
Philip V. Prieto-AVP, Meat Purchasing
August 26, 2009
09
August 26, 2009
Board approval of the declaration of P25 Million
Cash Dividend at value per share of P0.00791.
All stockholders as of record date were entitled
to participate.
April 28, 2010 April 28, 2010 Board approval of the declaration of P50Million
Cash Dividend at value per share of P0.01582.
All stockholders as of record date were entitled
to participate.
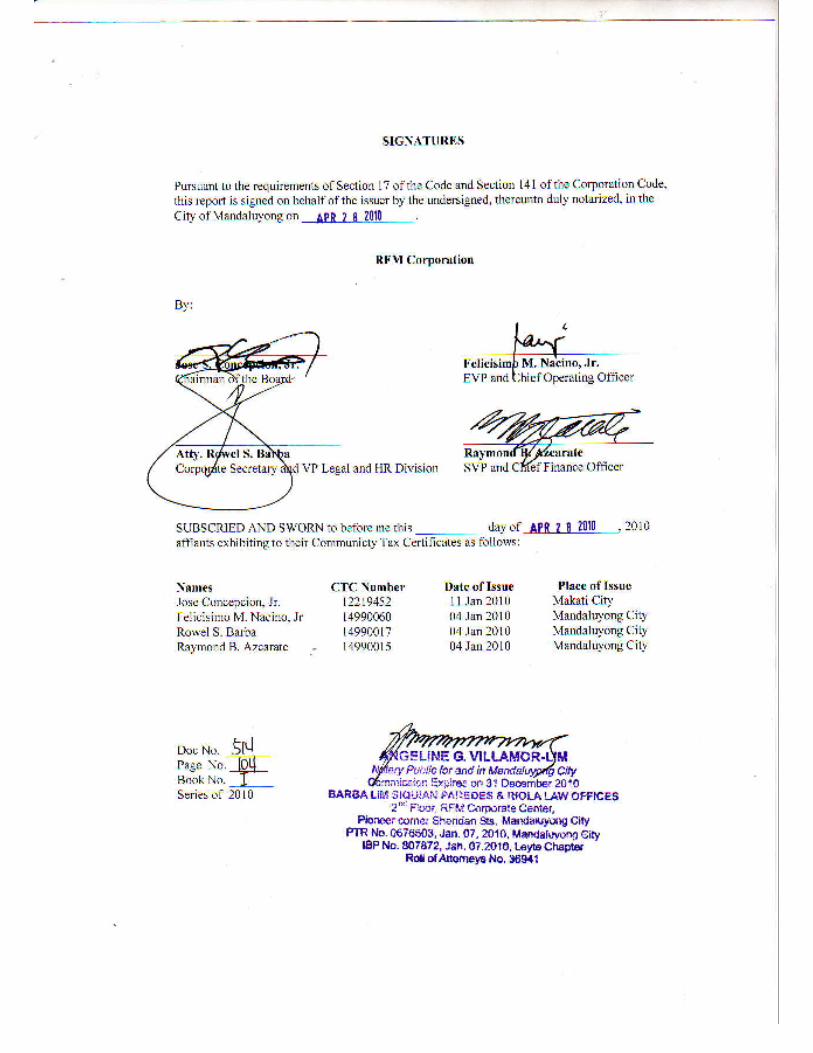

RFM CORPORATIO� A�D SUBSIDIARIES
I�DEX TO FI�A�CIAL STATEME�TS A�D SUPPLEME�TARY SCHEDULES
FORM 17-A, Item 7
For the year ended December 31, 2009 Page
�o.
Consolidated Financial Statements
Consolidated Statement of Management’s Responsibility for Financial Statements
Report of Independent Public Accountants
Consolidated Balance Sheets as of December 31, 2009 and 2008
Consolidated Statements of Income for the years ended December 31, 2009, 2008
and 2007
Consolidated Statements of comprehensive Income for the years ended December
31, 2009, 2008 and 2007
Consolidated Statements of Changes in Equity as of December 31, 2009, 2008 and
2007
Consolidated Statements of Cash Flows for the years ended December 31, 2009,
2008 and 2007
�otes to Consolidated Financial Statements
Supplementary Schedules
A. Marketable Securities (Current Marketable Equity Securities and Short-term
Cash Investments)
B. Amounts Receivable from Directors, Officers, Employees, Related Parties and
Principal Stockholders (Other than Affiliates)
C. �on-current Marketable Equity Securities, Other Long-term Investments,
and Other Investments
D. Indebtedness of Unconsolidated Subsidiaries and Affiliates
Property, Plant and Equipment
Accumulated Depreciation
E. Intangible Assets
F. Long-term Debt
G. Indebtedness to Affiliates and Related Parties (Long-Term Loans from
Related Companies
H. Guarantees of Securities of Other Issuers
I. Capital Stock
J. Retained Earnings Available for Dividends
*
1
2
3
*
*
4
*
5
• These schedules, which are required by Part IV(e) of RSA Rule 48, have been omitted
because they are either not required, not applicable or the information required to be
presented is included in the Company’s consolidated financial statements or the notes to
consolidated financial statements.
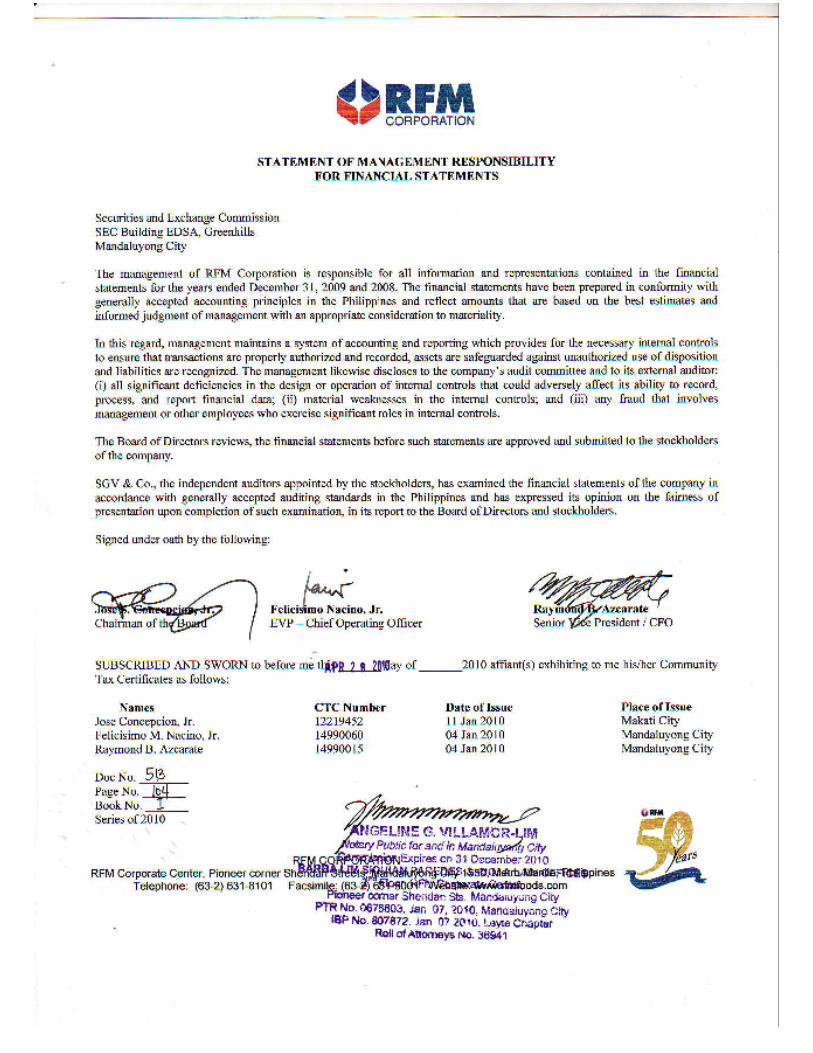
RFM Corporation and Subsidiaries
Consolidated Financial Statements
December 31, 2009 and 2008
and Years Ended December 31, 2009, 2008 and 2007
and
Independent Auditors’ Report
SyCip Gorres Velayo & Co.

1 2 9 9 8
SEC Registration Number
R F M C O R P O R A T I O � A � D S U B S I D I A R I E S
(Company’s Full Name)
R F M C o r p o r a t e C e n t e r ,
P i o n e e r c o r n e r S h e r i d a n
S t r e e t s , M a n d a l u y o n g C i t y
(Business Address: No. Street City/Town/Province)
Raymond B. Azcarate (02) 631-8101 (Contact Person) (Company Telephone Number)
1 2 3 1 A A C F S
Month Day (Form Type) Month Day (Calendar Year) (Annual Meeting)
�ot Applicable
(Secondary License Type, If Applicable)
�ot Applicable
Dept. Requiring this Doc. Amended Articles Number/Section
Total Amount of Borrowings
3,616
Total No. of Stockholders Domestic Foreign
To be accomplished by SEC Personnel concerned
File Number LCU
Document ID Cashier
S T A M P S
Remarks: Please use BLACK ink for scanning purposes.
COVER SHEET

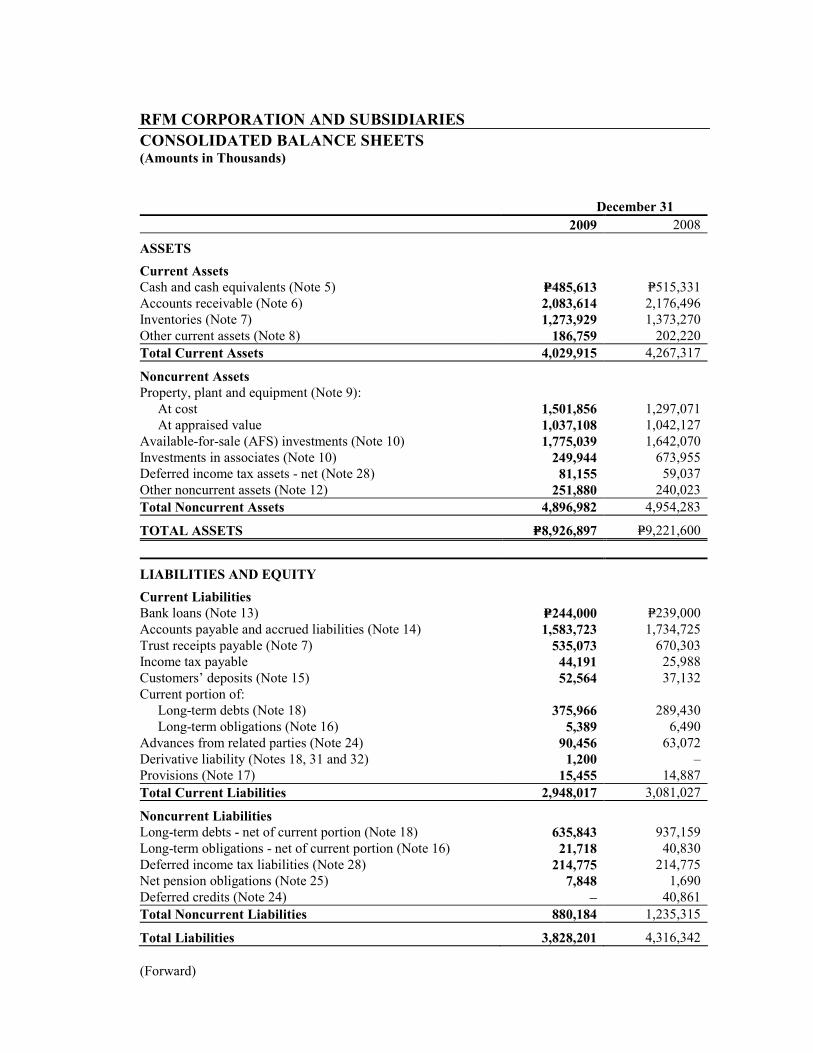
RFM CORPORATIO� A�D SUBSIDIARIES
CO�SOLIDATED BALA�CE SHEETS (Amounts in Thousands)
December 31
2009 2008
ASSETS
Current Assets
Cash and cash equivalents (Note 5) P=485,613 P=515,331
Accounts receivable (Note 6) 2,083,614 2,176,496
Inventories (Note 7) 1,273,929 1,373,270
Other current assets (Note 8) 186,759 202,220
Total Current Assets 4,029,915 4,267,317
�oncurrent Assets
Property, plant and equipment (Note 9):
At cost 1,501,856 1,297,071
At appraised value 1,037,108 1,042,127
Available-for-sale (AFS) investments (Note 10) 1,775,039 1,642,070
Investments in associates (Note 10) 249,944 673,955
Deferred income tax assets - net (Note 28) 81,155 59,037
Other noncurrent assets (Note 12) 251,880 240,023
Total �oncurrent Assets 4,896,982 4,954,283
TOTAL ASSETS P=8,926,897 P=9,221,600
LIABILITIES A�D EQUITY
Current Liabilities
Bank loans (Note 13) P=244,000 P=239,000
Accounts payable and accrued liabilities (Note 14) 1,583,723 1,734,725
Trust receipts payable (Note 7) 535,073 670,303
Income tax payable 44,191 25,988
Customers’ deposits (Note 15) 52,564 37,132
Current portion of:
Long-term debts (Note 18) 375,966 289,430
Long-term obligations (Note 16) 5,389 6,490
Advances from related parties (Note 24) 90,456 63,072
Derivative liability (Notes 18, 31 and 32) 1,200 –
Provisions (Note 17) 15,455 14,887
Total Current Liabilities 2,948,017 3,081,027
�oncurrent Liabilities
Long-term debts - net of current portion (Note 18) 635,843 937,159
Long-term obligations - net of current portion (Note 16) 21,718 40,830
Deferred income tax liabilities (Note 28) 214,775 214,775
Net pension obligations (Note 25) 7,848 1,690
Deferred credits (Note 24) – 40,861
Total �oncurrent Liabilities 880,184 1,235,315
Total Liabilities 3,828,201 4,316,342
(Forward)
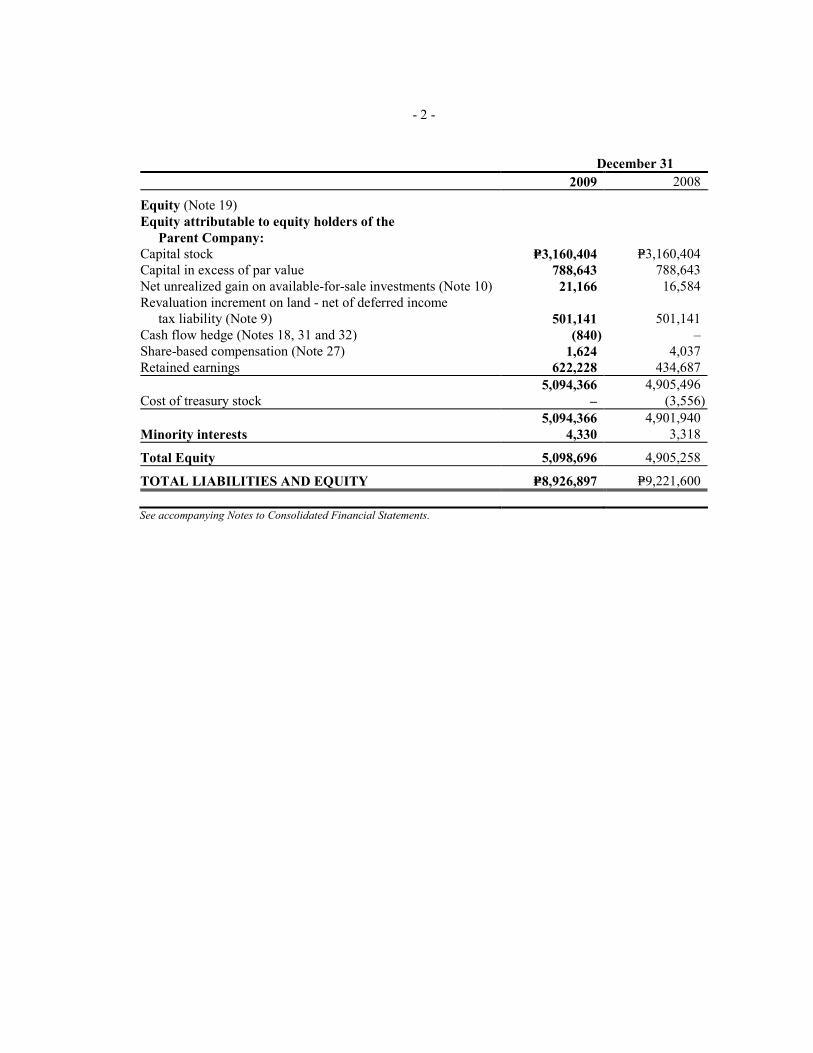
- 2 -
December 31
2009 2008
Equity (Note 19)
Equity attributable to equity holders of the
Parent Company:
Capital stock P=3,160,404 P=3,160,404
Capital in excess of par value 788,643 788,643
Net unrealized gain on available-for-sale investments (Note 10) 21,166 16,584
Revaluation increment on land - net of deferred income
tax liability (Note 9)
501,141
501,141
Cash flow hedge (Notes 18, 31 and 32) (840) –
Share-based compensation (Note 27) 1,624 4,037
Retained earnings 622,228 434,687
5,094,366 4,905,496
Cost of treasury stock – (3,556)
5,094,366 4,901,940
Minority interests 4,330 3,318
Total Equity 5,098,696 4,905,258
TOTAL LIABILITIES A�D EQUITY P=8,926,897 P=9,221,600
See accompanying +otes to Consolidated Financial Statements.

RFM CORPORATIO� A�D SUBSIDIARIES
CO�SOLIDATED STATEME�TS OF I�COME (Amounts in Thousands, Except Per Share Data)
Years Ended December 31
2009 2008 2007
REVE�UE (Note 24)
Manufacturing P=8,312,732 P=7,494,247 P=6,064,270
Services and others 20,865 56,666 30,867
8,333,597 7,550,913 6,095,137
DIRECT COSTS (Note 20)
Manufacturing (5,925,759) (5,882,078) (4,563,537)
Services and others (33,223) (36,878) (32,150)
(5,958,982) (5,918,956) (4,595,687)
GROSS PROFIT 2,374,615 1,631,957 1,499,450
OPERATI�G EXPE�SES
Selling and marketing (Note 21) (1,167,252) (1,002,601) (914,531)
General and administrative (Note 22) (681,032) (365,524) (325,756)
OTHER I�COME (CHARGES)
Interest expense and financing charges (Note 23) (162,007) (145,766) (107,529)
Interest and financing income (Note 23) 24,995 39,182 28,917
Other income - net (Note 23) 100,239 239,479 97,772
I�COME BEFORE I�COME TAX 489,558 396,727 278,323
PROVISIO� FOR I�COME TAX (Note 28)
Current 143,201 97,739 93,831
Deferred (19,100) (27,855) (22,146)
124,101 69,884 71,685
�ET I�COME FROM CO�TI�UI�G
OPERATIO�S 365,457 326,843 206,638
�ET I�COME (LOSS) FROM
DISCO�TI�UED OPERATIO�S (Note 26) – (81,763) 27,680
�ET I�COME P=365,457 P=245,080 P=234,318
Attributable to:
Equity holders of the Parent Company P=364,445 P=242,151 P=232,199
Minority interests 1,012 2,929 2,119
P=365,457 P=245,080 P=234,318
Basic/Diluted Earnings (Loss) Per Share (Note 30):
Net income from continuing operations P=0.116 P=0.103 P=0.065
Net income (loss) from discontinued operations – (0.026) 0.009
P=0.116 P=0.077 P=0.074
See accompanying +otes to Consolidated Financial Statements.
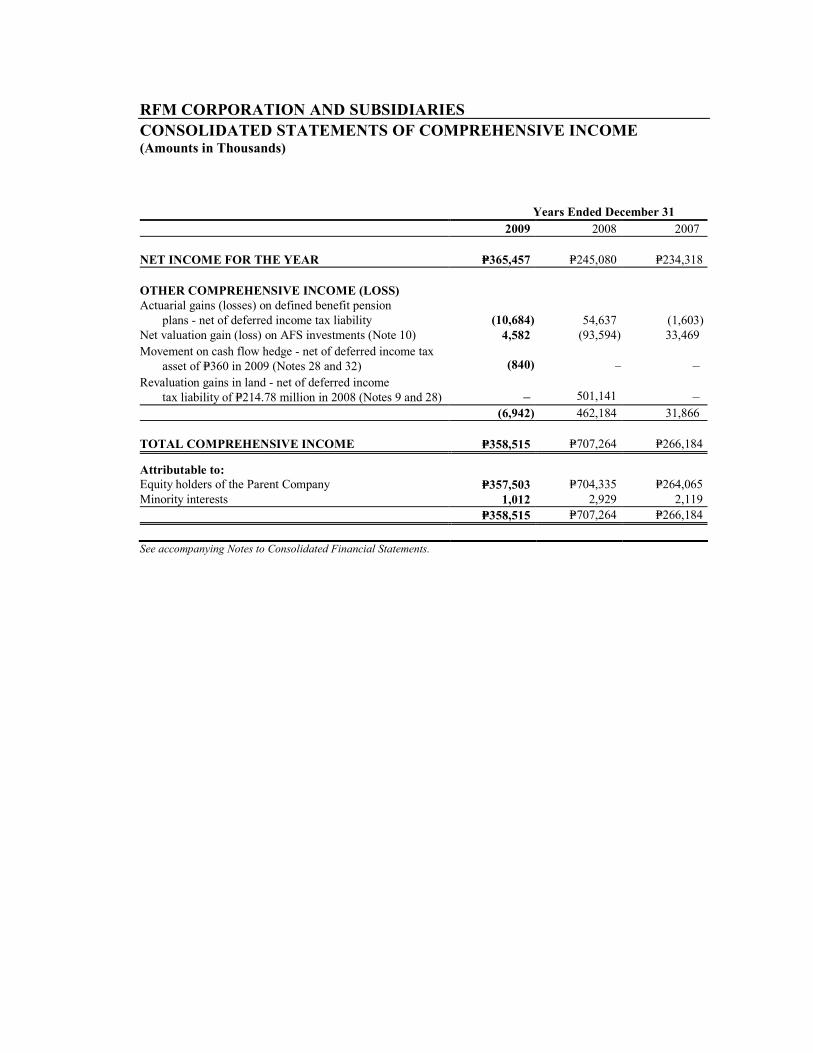
RFM CORPORATIO� A�D SUBSIDIARIES
CO�SOLIDATED STATEME�TS OF COMPREHE�SIVE I�COME (Amounts in Thousands)
Years Ended December 31
2009 2008 2007
�ET I�COME FOR THE YEAR P=365,457 P=245,080 P=234,318
OTHER COMPREHE�SIVE I�COME (LOSS)
Actuarial gains (losses) on defined benefit pension
plans - net of deferred income tax liability
(10,684)
54,637
(1,603)
Net valuation gain (loss) on AFS investments (Note 10) 4,582 (93,594) 33,469
Movement on cash flow hedge - net of deferred income tax
asset of P=360 in 2009 (Notes 28 and 32)
(840) –
–
Revaluation gains in land - net of deferred income
tax liability of P=214.78 million in 2008 (Notes 9 and 28)
–
501,141
–
(6,942) 462,184 31,866
TOTAL COMPREHE�SIVE I�COME P=358,515 P=707,264 P=266,184
Attributable to:
Equity holders of the Parent Company P=357,503 P=704,335 P=264,065
Minority interests 1,012 2,929 2,119
P=358,515 P=707,264 P=266,184
See accompanying +otes to Consolidated Financial Statements.

RFM CORPORATIO� A�D SUBSIDIARIES
CO�SOLIDATED STATEME�TS CHA�GES I� EQUITY FOR THE YEARS E�DED DECEMBER 31, 2009, 2008 A�D 2007
(Amounts in Thousands)
Attributable to Equity Holders of the Parent Company
Revaluation
Capital Net Unrealized Increment - Net of
Capital in Excess Gain on AFS Deferred Income Cash Flow Share-based Retained Treasury Minority Total
Stock of Par Value Investments Tax Liability Hedge Compensation Earnings Stock Subtotal Interests Equity
BALA�CES AT DECEMBER 31, 2006 P=3,927,714 P=1,019,860 P=76,709 P=– P=– P=2,937 P=445,916 (P=1,006,397) P=4,466,739 P=4,306 P=4,471,045
Total comprehensive income (loss) – – 33,469 – – – 230,596 – 264,065 2,119 266,184
Dividends of minority interests – – – – – – – – – (3,585) (3,585)
Sale of treasury shares – (6,763) – – – – – 11,184 4,421 – 4,421
Share-based compensation plan – – – – – 505 – – 505 – 505
BALA�CES AT DECEMBER 31, 2007 3,927,714 1,013,097 110,178 – – 3,442 676,512 (995,213) 4,735,730 2,840 4,738,570
Total comprehensive income (loss) – – (93,594) 501,141 – – 296,788 – 704,335 2,929 707,264
Property dividend declaration (Note 19) – – – – – – (488,679) – (488,679) – (488,679)
Cash dividends declaration – – – – – – (49,934) – (49,934) – (49,934)
Dividends of minority interests – – – – – – – – – (2,436) (2,436)
Retirement of treasury stock (767,310) (224,454) – – – – – 991,764 – – –
Share-based compensation plan – – – – – 595 – – 595 – 595
Net movement during the year – – – – – – – (107) (107) (15) (122)
BALA�CES AT DECEMBER 31, 2008 3,160,404 788,643 16,584 501,141 – 4,037 434,687 (3,556) 4,901,940 3,318 4,905,258
Total comprehensive income (loss) – – 4,582 – (840) – 353,761 – 357,503 1,012 358,515
Property dividend declaration (Note 19) – – – – – – (116,221) – (116,221) – (116,221)
Cash dividends declaration – – – – – – (49,999) – (49,999) – (49,999)
Share-based compensation plan – – – – – (2,413) – – (2,413) – (2,413)
Reissuance of treasury stock – – – – – – – 3,556 3,556 – 3,556
BALA�CES AT DECEMBER 31, 2009 P=3,160,404 P=788,643 P=21,166 P=501,141 (P=840) P=1,624 P=622,228 P=– P=5,094,366 P=4,330 P=5,098,696
See accompanying +otes to Consolidated Financial Statements.
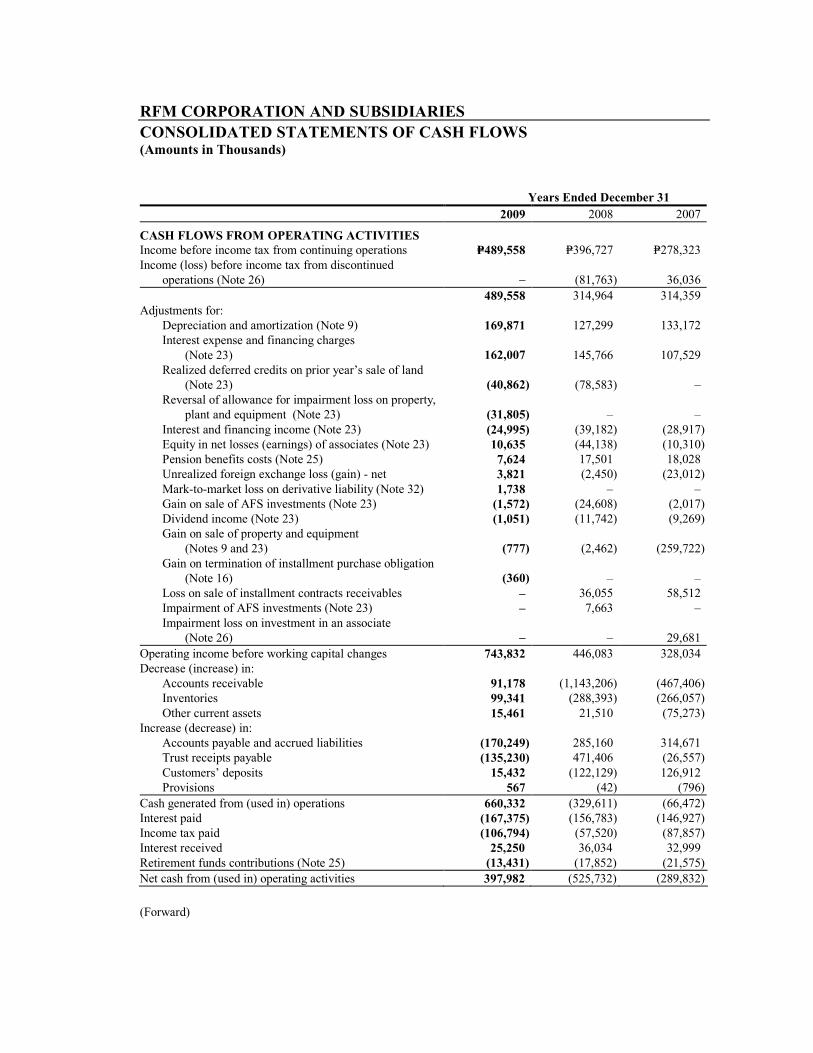
RFM CORPORATIO� A�D SUBSIDIARIES
CO�SOLIDATED STATEME�TS OF CASH FLOWS (Amounts in Thousands)
Years Ended December 31
2009 2008 2007
CASH FLOWS FROM OPERATI�G ACTIVITIES
Income before income tax from continuing operations P=489,558 P=396,727 P=278,323
Income (loss) before income tax from discontinued
operations (Note 26)
–
(81,763)
36,036
489,558 314,964 314,359
Adjustments for:
Depreciation and amortization (Note 9) 169,871 127,299 133,172
Interest expense and financing charges
(Note 23)
162,007
145,766
107,529
Realized deferred credits on prior year’s sale of land
(Note 23)
(40,862)
(78,583)
–
Reversal of allowance for impairment loss on property,
plant and equipment (Note 23)
(31,805)
–
–
Interest and financing income (Note 23) (24,995) (39,182) (28,917)
Equity in net losses (earnings) of associates (Note 23) 10,635 (44,138) (10,310)
Pension benefits costs (Note 25) 7,624 17,501 18,028
Unrealized foreign exchange loss (gain) - net 3,821 (2,450) (23,012)
Mark-to-market loss on derivative liability (Note 32) 1,738 – –
Gain on sale of AFS investments (Note 23) (1,572) (24,608) (2,017)
Dividend income (Note 23) (1,051) (11,742) (9,269)
Gain on sale of property and equipment
(Notes 9 and 23)
(777)
(2,462)
(259,722)
Gain on termination of installment purchase obligation
(Note 16)
(360)
–
–
Loss on sale of installment contracts receivables – 36,055 58,512
Impairment of AFS investments (Note 23) – 7,663 –
Impairment loss on investment in an associate
(Note 26)
–
–
29,681
Operating income before working capital changes 743,832 446,083 328,034
Decrease (increase) in:
Accounts receivable 91,178 (1,143,206) (467,406)
Inventories 99,341 (288,393) (266,057)
Other current assets 15,461 21,510 (75,273)
Increase (decrease) in:
Accounts payable and accrued liabilities (170,249) 285,160 314,671
Trust receipts payable (135,230) 471,406 (26,557)
Customers’ deposits 15,432 (122,129) 126,912
Provisions 567 (42) (796)
Cash generated from (used in) operations 660,332 (329,611) (66,472)
Interest paid (167,375) (156,783) (146,927)
Income tax paid (106,794) (57,520) (87,857)
Interest received 25,250 36,034 32,999
Retirement funds contributions (Note 25) (13,431) (17,852) (21,575)
Net cash from (used in) operating activities 397,982 (525,732) (289,832)
(Forward)
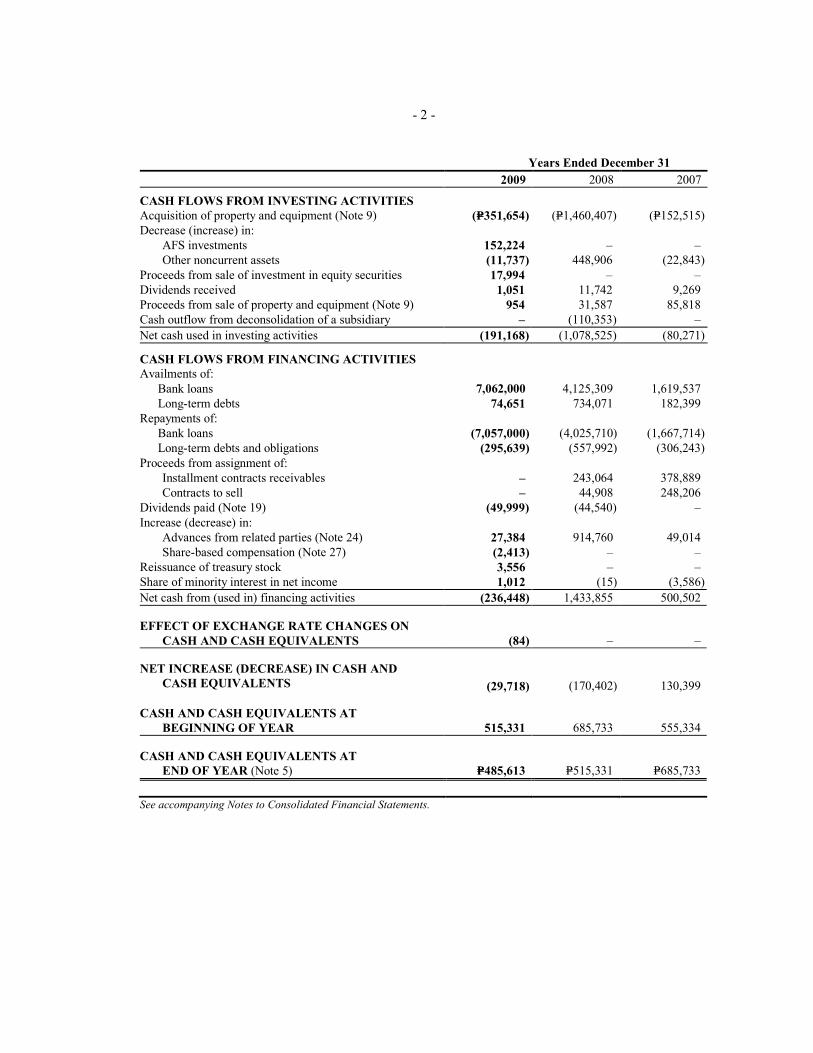
- 2 -
Years Ended December 31
2009 2008 2007
CASH FLOWS FROM I�VESTI�G ACTIVITIES
Acquisition of property and equipment (Note 9) (P=351,654) (P=1,460,407) (P=152,515)
Decrease (increase) in:
AFS investments 152,224 – –
Other noncurrent assets (11,737) 448,906 (22,843)
Proceeds from sale of investment in equity securities 17,994 – –
Dividends received 1,051 11,742 9,269
Proceeds from sale of property and equipment (Note 9) 954 31,587 85,818
Cash outflow from deconsolidation of a subsidiary – (110,353) –
Net cash used in investing activities (191,168) (1,078,525) (80,271)
CASH FLOWS FROM FI�A�CI�G ACTIVITIES
Availments of:
Bank loans 7,062,000 4,125,309 1,619,537
Long-term debts 74,651 734,071 182,399
Repayments of:
Bank loans (7,057,000) (4,025,710) (1,667,714)
Long-term debts and obligations (295,639) (557,992) (306,243)
Proceeds from assignment of:
Installment contracts receivables – 243,064 378,889
Contracts to sell – 44,908 248,206
Dividends paid (Note 19) (49,999) (44,540) –
Increase (decrease) in:
Advances from related parties (Note 24) 27,384 914,760 49,014
Share-based compensation (Note 27) (2,413) – –
Reissuance of treasury stock 3,556 – –
Share of minority interest in net income 1,012 (15) (3,586)
Net cash from (used in) financing activities (236,448) 1,433,855 500,502
EFFECT OF EXCHA�GE RATE CHA�GES O�
CASH A�D CASH EQUIVALE�TS (84) – –
�ET I�CREASE (DECREASE) I� CASH A�D
CASH EQUIVALE�TS (29,718) (170,402)
130,399
CASH A�D CASH EQUIVALE�TS AT
BEGI��I�G OF YEAR 515,331 685,733 555,334
CASH A�D CASH EQUIVALE�TS AT
E�D OF YEAR (Note 5) P=485,613 P=515,331 P=685,733
See accompanying +otes to Consolidated Financial Statements.
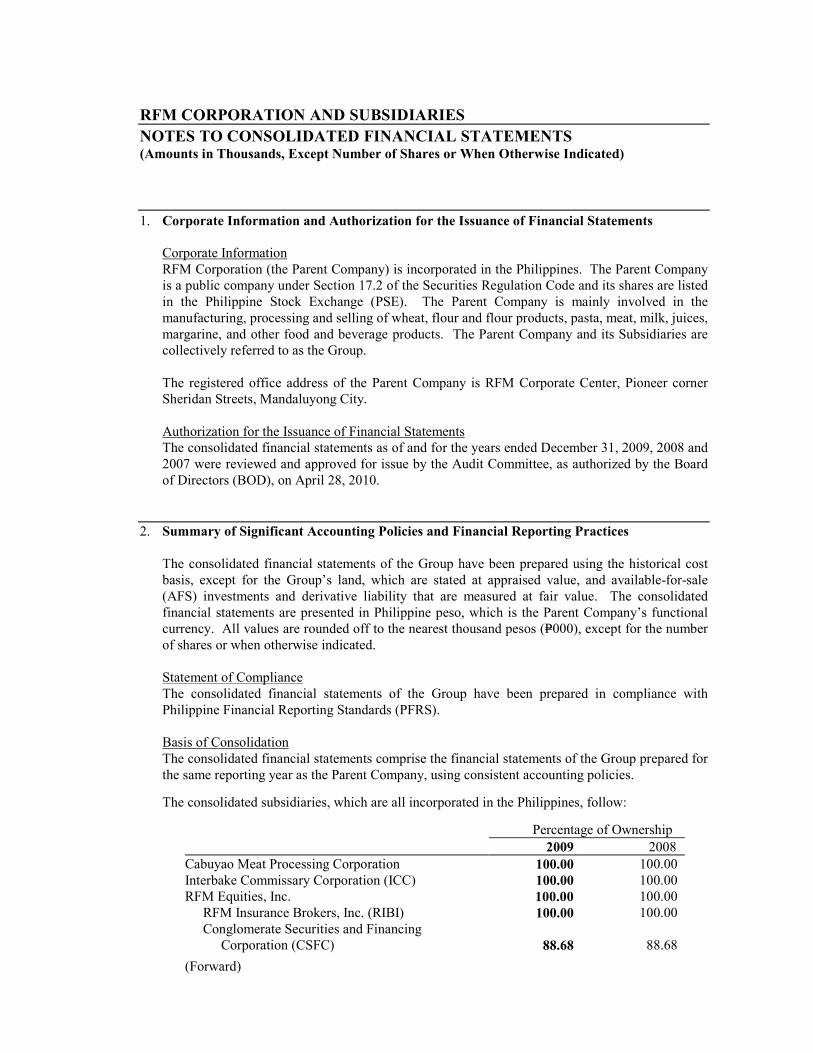
RFM CORPORATIO� A�D SUBSIDIARIES
�OTES TO CO�SOLIDATED FI�A�CIAL STATEME�TS (Amounts in Thousands, Except �umber of Shares or When Otherwise Indicated)
1. Corporate Information and Authorization for the Issuance of Financial Statements
Corporate Information
RFM Corporation (the Parent Company) is incorporated in the Philippines. The Parent Company
is a public company under Section 17.2 of the Securities Regulation Code and its shares are listed
in the Philippine Stock Exchange (PSE). The Parent Company is mainly involved in the
manufacturing, processing and selling of wheat, flour and flour products, pasta, meat, milk, juices,
margarine, and other food and beverage products. The Parent Company and its Subsidiaries are
collectively referred to as the Group.
The registered office address of the Parent Company is RFM Corporate Center, Pioneer corner
Sheridan Streets, Mandaluyong City.
Authorization for the Issuance of Financial Statements
The consolidated financial statements as of and for the years ended December 31, 2009, 2008 and
2007 were reviewed and approved for issue by the Audit Committee, as authorized by the Board
of Directors (BOD), on April 28, 2010.
2. Summary of Significant Accounting Policies and Financial Reporting Practices
The consolidated financial statements of the Group have been prepared using the historical cost
basis, except for the Group’s land, which are stated at appraised value, and available-for-sale
(AFS) investments and derivative liability that are measured at fair value. The consolidated
financial statements are presented in Philippine peso, which is the Parent Company’s functional
currency. All values are rounded off to the nearest thousand pesos (P=000), except for the number
of shares or when otherwise indicated.
Statement of Compliance
The consolidated financial statements of the Group have been prepared in compliance with
Philippine Financial Reporting Standards (PFRS).
Basis of Consolidation
The consolidated financial statements comprise the financial statements of the Group prepared for
the same reporting year as the Parent Company, using consistent accounting policies. The consolidated subsidiaries, which are all incorporated in the Philippines, follow:
Percentage of Ownership
2009 2008
Cabuyao Meat Processing Corporation 100.00 100.00
Interbake Commissary Corporation (ICC) 100.00 100.00
RFM Equities, Inc. 100.00 100.00
RFM Insurance Brokers, Inc. (RIBI) 100.00 100.00
Conglomerate Securities and Financing
Corporation (CSFC)
88.68
88.68
(Forward)

Percentage of Ownership
2009 2008
RFM Foods Philippines Corporation* 100.00 100.00
Southstar Bottled Water Company, Inc.* 100.00 100.00
Swift Tuna Corporation* 100.00 100.00
FWBC Holdings, Inc. 83.38 83.38
Filipinas Water Bottling Company, Inc.
(FWBC)
58.37
58.37
Rizal Lighterage Corporation (RLC) 82.98 82.98
RFM Canning and Marketing, Inc. (RFM Canning)* 70.00 70.00
WS Holdings, Inc. (WHI) 60.00 60.00 * Dormant
All significant intra-group balances, transactions, income and expenses and profits and losses
resulting from intra-group transactions are eliminated in full in consolidation. However,
intra-group losses that indicate impairment are recognized in the consolidated financial
statements.
Subsidiaries are fully consolidated from the date on which control is transferred to the Group.
Control is achieved where the Group has the power to govern the financial and operating policies
of the subsidiary so as to benefit from its activities. Consolidation of subsidiaries ceases when
control is transferred out of the Group. Minority interests represent the portion of income and
expense and net assets in CSFC, FWBC, RLC, RFM Canning and WHI not held by the Group and
are presented separately in the consolidated statement of income and within equity in the
consolidated balance sheet, separately from the equity attributable to equity holders of the Parent
Company.
Changes in Accounting Policies and Disclosures
The accounting policies adopted are consistent with those of the previous financial year except for
the adoption of the following new and amended PFRSs and Philippine Interpretations effective
beginning January 1, 2009:
• Amendments to PFRS 7, Financial Instruments: Disclosures, require additional disclosures
about fair value measurement and liquidity risk. Fair value measurements related to items
recorded at fair value are to be disclosed by source of inputs using a three-level fair value
hierarchy, by class, for all financial instruments recognized at fair value. In addition,
reconciliation between the beginning and ending balance for level three fair value
measurements is now required, as well as significant transfers between levels in the fair value
hierarchy. The amendments also clarify the requirements for liquidity risk disclosures with
respect to derivative transactions and financial assets used for liquidity management. The
three-level fair value hierarchy and liquidity risk disclosures are presented in Notes 31 and 32,
respectively.
• PFRS 8, Operating Segments, replaces PAS 14, Segment Reporting, and adopts a full
management approach to identifying, measuring and disclosing the results of an entity’s
operating segments. The information reported would be that which management uses
internally for evaluating the performance of operating segments and allocating resources to
those segments. Such information may be different from that reported in the consolidated
balance sheet, consolidated statement of income and consolidated statement of comprehensive
income and the Group will provide explanations and reconciliations of the differences.
Adoption of this standard did not have any effect on the financial position or performance of
the Group. Disclosures about each of the business segments identified by the Group are
shown in Note 4 to the consolidated financial statements, including revised comparative
information.
• Amendments to PAS 1, Presentation of Financial Statements, separate owner and non-owner
changes in equity. The statement of changes in equity includes only details of transactions
with owners, with non-owner changes in equity presented in a reconciliation of each
component of equity. In addition, the standard introduces the statement of comprehensive
income: it presents all items of recognized income and expense, either in one statement, or in
two-linked statements. The Group has elected to present two statements - a statement of
income and a statement of comprehensive income.
Adoption of the following changes in PFRS and Philippine Interpretations did not have any
significant impact on the Group’s financial statements except where additional disclosures are
required:
• Amendments to PFRS 1, First-time Adoption of Philippine Financial Reporting Standards
• Amendments to PFRS 2, Share-based Payment - Vesting Conditions and Cancellations
• Revised PAS 23, Borrowing Costs
• Amendments to PAS 27, Consolidated and Separate Financial Statements - Cost of an
Investment in a Subsidiary, Jointly Controlled Entity or Associate
• Amendment to PAS 32, Financial Instruments: Presentation, and PAS 1, Presentation of
Financial Statements - Puttable Financial Instruments and Obligations Arising on
Liquidation
• Philippine Interpretation IFRIC 13, Customer Loyalty Programmes, effective for annual
periods beginning on or after July 1, 2008
• Philippine Interpretation IFRIC 16, Hedges of a +et Investment in a Foreign Operation
• Philippine Interpretation IFRIC 18, Transfers of Assets from Customers
Improvements to PFRS
The omnibus amendments to PFRS in 2008 were issued primarily with a view to remove
inconsistencies and clarify wordings. There are separate transitional provisions for each standard.
Adoption of the following improvements to standards did not have significant impact on the
Group’s financial statements.
• PFRS 5, +oncurrent Assets Held for Sale and Discontinued Operations
• PAS 1, Presentation of Financial Statements
• PAS 16, Property, Plant and Equipment
• PAS 19, Employee Benefits
• PAS 20, Accounting for Government Grants and Disclosures of Government Assistance
• PAS 23, Borrowing Costs
• PAS 28, Investments in Associates
• PAS 29, Financial Reporting in Hyperinflationary Economies
• PAS 31, Interest in Joint Ventures
• PAS 36, Impairment of Assets
• PAS 38, Intangible Assets
• PAS 39, Financial Instruments: Recognition and Measurement
• PAS 40, Investment Property
• PAS 41, Agriculture
The omnibus amendments to PFRS issued in 2009 included an amendment to the Appendix to
PAS 18, Revenue. As the amendment to the Appendix to PAS 18 specifies no transitional
provisions, the amendment is effective immediately and retrospectively. The amendment adds
guidance (which accompanies the standard) to determine whether an entity is acting as a principal

or as agent. The features indicating an entity is acting as a principal are whether the entity: (a)
has primary responsibility for providing the goods or services; (b) has inventory risk; (c) has
discretion in establishing prices; and (d) bears the credit risk. The Group has assessed its revenue
arrangements against these criteria and concluded that it is acting as principal in all arrangements.
Accordingly, no change was made in the Group’s revenue recognition policy.
Summary of Significant Accounting Policies
Cash and Cash Equivalents
Cash includes cash on hand and in banks. Cash equivalents are short-term, highly liquid
investments that are readily convertible to known amounts of cash with original maturities of
three months or less from dates of acquisition and that are subject to an insignificant risk of
change in value.
Financial Instruments
Date of recognition
The Group recognizes a financial asset or a financial liability in the consolidated balance sheet
when it becomes a party to the contractual provisions of the instrument. Purchases and sales of
financial assets that require delivery of assets within the time frame by regulation or convention in
the marketplace are recognized on the settlement date.
Initial recognition and classification of financial instruments
All financial assets and financial liabilities are recognized initially at fair value. Except for
securities at fair value through profit and loss (FVPL), the initial measurement of financial assets
includes any transactions costs. The Group’s financial assets are further classified into the
following categories: financial assets at FVPL, loans and receivables, held-to-maturity (HTM)
investments, and AFS investments or as derivatives designated as hedging instruments in an
effective hedge, as appropriate. The Group also classifies its financial liabilities as financial
liabilities at FVPL and other financial liabilities or as derivatives designated as hedging
instruments in an effective hedge, as appropriate. The classification depends on the purpose for
which the investments were acquired or whether they are quoted in an active market. The Group
determines the classification of its financial instruments at initial recognition and, where allowed
and appropriate, re-evaluates such designation at each financial year-end.
Financial instruments are classified as liability or equity in accordance with the substance of the
contractual arrangement. Interest, dividends, gains and losses relating to a financial instrument or
a component that is a financial liability, are reported as expense or income. Distributions to
holders of financial instruments classified as equity are charged directly to equity, net of any
related income tax benefits.
As of December 31, 2009 and 2008, the Group has no financial assets and financial liabilities at
FVPL and HTM investments.
Determination of fair value
The fair value of financial instruments traded in active markets at the balance sheet date is based
on the quoted market price or dealer price quotations (bid price for long positions and ask price
for short positions), without any deduction for transaction costs. When current bid and asking
prices are not available, the price of the most recent transaction provides evidence of current fair
value as long as there has not been a significant change in economic circumstances since the time
of transaction.
For all other financial instruments not listed in an active market, the fair value is determined by
using appropriate valuation methodologies. Valuation methodologies include net present value
techniques, comparison to similar instruments for which market observable prices exist, options
pricing models, and other relevant valuation models.
Day 1 difference
Where the transaction price in a non-active market is different from the fair value from other
observable current market transactions in the same instrument or based on a valuation technique
whose variables include only data from observable market, the Group recognizes the difference
between the transaction price and fair value (a Day 1 difference) in the consolidated statement of
income unless it qualifies for the recognition as some other type of asset. In cases where use is
made of data which is not observable, the difference between the transaction price and model
value is only recognized in the consolidated statement of income when the inputs become
observable or when the instrument is derecognized. For each transaction, the Group determines
the appropriate method of recognizing the Day 1 difference amount.
Loans and receivables
Loans and receivables are nonderivative financial assets with fixed or determinable payments that
are not quoted in an active market. They arise when the Group provides money, goods or services
directly to a debtor with no intention of trading the receivables. After initial measurement, loans
and receivables are subsequently carried at cost or amortized cost using the effective interest
method less any allowance for impairment. Gains and losses are recognized in the consolidated
statement of income when the loans and receivables are derecognized or impaired, as well as
through the amortization process. Loans and receivables are classified as current assets if maturity
is within 12 months from the balance sheet date. Otherwise, these are classified as noncurrent
assets.
This category primarily includes the Group’s cash in banks and cash equivalents, trade
receivables, advances to related parties, other receivables and receivable from Manila Electric
Company (Meralco) as of December 31, 2009 and 2008.
AFS investments
AFS investments are nonderivative financial assets that are either designated in this category or
not classified in any of the other categories. AFS investments are carried at fair value in the
consolidated balance sheet, with the unrealized gains or losses on changes in their fair value being
recognized directly in the other comprehensive income. When the financial asset is disposed of,
the cumulative gain or loss previously recorded in other comprehensive income is recognized in
the consolidated statement of income. Interest earned or paid on the investments is reported as
interest income or expense using the effective interest method. Dividends earned on financial
assets are recognized in the consolidated statement of income as “Dividend income” when the
right of payment has been established. These financial assets are classified as noncurrent assets
unless there is intention to dispose of such assets within 12 months of the balance sheet date.
AFS investments in unquoted equity securities are carried at historical cost, net of impairment.
As of December 31, 2009 and 2008, the Group’s AFS investments consist of investments in
unquoted redeemable preferred and common shares, and quoted common and golf shares.
Other financial liabilities
This category pertains to financial liabilities that are not held for trading or not designated as at
FVPL upon the inception of the liability. These include liabilities arising from operations or
borrowings (e.g., payables, accruals).
The financial liabilities are initially recognized at fair value and are subsequently carried at
amortized cost, taking into account the impact of applying the effective interest method of

amortization (or accretion) for any related premium, discount and any directly attributable
transaction costs.
As of December 31, 2009 and 2008, the Group’s other financial liabilities include bank loans,
accounts payable and accrued liabilities, trust receipts payable, customers’ deposits, long-term
debts and obligations, including current maturities, and advances from related parties.
Derivatives and hedging
Derivative financial instruments (swaps and option contracts to economically hedge exposure to
fluctuations in interest rates) are initially recognized at fair value on the date on which a
derivative contract is entered into and are subsequently remeasured at fair value. Derivatives are
carried as assets when the fair value is positive and as liabilities when the fair value is negative.
Derivatives are accounted for as at FVPL, where any gains or losses arising from changes in fair
value on derivatives are taken directly to consolidated statement of income for the year, unless the
transaction is a designated and effective hedging instrument.
For the purpose of hedge accounting, hedges are classified as:
a. fair value hedges when hedging the exposure to changes in the fair value of a recognized asset or liability; or
b. cash flow hedges when hedging exposure to variability in cash flows that is either attributable to a particular risk associated with a recognized asset or liability or a forecast transaction; or
c. hedges of a net investment in a foreign operation.
At the inception of a hedge relationship, the Group formally designates and documents the hedge
relationship to which the Group wishes to apply hedge accounting and the risk management
objective and strategy for undertaking the hedge. The documentation includes identification of
the hedging instrument, the hedged item or transaction, the nature of the risk being hedged and
how the entity will assess the hedging instrument’s effectiveness in offsetting the exposure to
changes in the hedged item’s fair value or cash flows attributable to the hedged risk. Such hedges
are expected to be highly effective in achieving offsetting changes in fair value or cash flows and
are assessed on an ongoing basis to determine that they actually have been highly effective
throughout the financial reporting periods for which they were designated.
Hedges which meet the strict criteria for hedge accounting are accounted for as follows:
Fair value hedges
Fair value hedges are hedges of the Group’s exposure to changes in the fair value of a recognized
asset or liability or an unrecognized firm commitment, or an identified portion of such an asset,
liability or firm commitment, that is attributable to a particular risk and could affect profit or loss.
For fair value hedges, the carrying amount of the hedged item is adjusted for gains and losses
attributable to the risk being hedged, the derivative is remeasured at fair value and gains and
losses from both are recognized in the consolidated statement of income.
For fair value hedges relating to items carried at amortized cost, the adjustment to carrying value
is amortized through the consolidated statement of income over the remaining term to maturity.
Any adjustment to the carrying amount of a hedged financial instrument for which the effective
interest method is used is amortized to the consolidated statement of income. Amortization may
begin as soon as an adjustment exists and shall begin no later than when the hedged item ceases to
be adjusted for changes in its fair value attributable to the risk being hedged.

When an unrecognized firm commitment is designated as a hedged item, the subsequent
cumulative change in the fair value of the firm commitment attributable to the hedged risk is
recognized as an asset or liability with a corresponding gain or loss recognized in the consolidated
statement of income. The changes in the fair value of the hedging instrument are also recognized
in the consolidated statement of income.
The Group discontinues fair value hedge accounting if the hedging instrument expires or is sold,
terminated or exercised, the hedge no longer meets the criteria for hedge accounting or the Group
revokes the designation. Any adjustment to the carrying amount of a hedged financial instrument
for which the effective interest method is used is amortized to the consolidated statement of
income. Amortization may begin as soon as an adjustment exists and shall begin no later than
when the hedged item ceases to be adjusted for changes in its fair value attributable to the risk
being hedged.
As of December 31, 2009 and 2008, the Group does not have designated fair value hedge.
Cash flow hedges
Cash flow hedges are hedges of the exposure to variability in cash flows that is attributable to a
particular risk associated with a recognized asset or liability or a highly probable forecast
transaction and could affect profit or loss. The effective portion of the gain or loss on the hedging
instrument is recognized directly in the consolidated statement of comprehensive income, while
the ineffective portion is recognized in the consolidated statement of income.
Amounts taken to the consolidated statement of comprehensive income are transferred to the
consolidated statement of income when the hedged transaction affects the consolidated statement
of income, such as when hedged financial income or financial expense is recognized or when a
forecast sale or purchase occurs. Where the hedged item is the cost of a non-financial asset or
liability, the amounts taken to the consolidated statement of comprehensive income are
transferred to the initial carrying amount of the non-financial asset or liability.
If the forecast transaction is no longer expected to occur, amounts previously recognized in the
consolidated statement of comprehensive income are transferred to the consolidated statement of
income. If the hedging instrument expires or is sold, terminated or exercised without replacement
or rollover, or if its designation as a hedge is revoked, amounts previously recognized in the
consolidated statement of comprehensive income remain in the consolidated statement of
comprehensive income until the forecast transaction occurs. If the related transaction is not
expected to occur, the amount is taken to consolidated statement of income.
The Company has an interest rate swap that is used as hedge for the exposure change in the cash
flows of its P=380.00 million fixed-rate loan in 2009 (see Note 18).
Impairment of Financial Assets
The Group assesses at each balance sheet date whether a financial asset or group of financial
assets is impaired.
Loans and receivables
The Group first assesses whether objective evidence of impairment exists individually for
financial assets that are individually significant, and individually or collectively for financial
assets that are not individually significant. Objective evidence includes observable data that
comes to the attention of the Group about loss events such as but not limited to significant
financial difficulty of the counterparty, a breach of contract, such as a default or delinquency in
interest or principal payments, probability that the borrower will enter bankruptcy or other financial
reorganization.
If there is objective evidence that an impairment loss on loans and receivables carried at
amortized cost has been incurred, the amount of loss is measured as a difference between the
asset’s carrying amount and the present value of estimated future cash flows (excluding future
credit losses that have not been incurred) discounted at the financial asset’s original effective
interest rate (i.e., the effective interest rate computed at initial recognition). The carrying amount
of the asset shall be reduced through the use of an allowance account. The amount of loss is
recognized in the consolidated statement of income. Interest income continues to be accrued on
the reduced carrying amount based on the original effective interest rate of the asset. Loans
together with the associated allowance are written off when there is no realistic prospect of future
recovery.
If it is determined that no objective evidence of impairment exists for an individually assessed
financial asset, whether significant or not, the asset is included in the group of financial assets
with similar credit risk and characteristics and that group of financial assets is collectively
assessed for impairment. Assets that are individually assessed for impairment and for which an
impairment loss is or continues to be recognized are not included in a collective assessment of
impairment. Loans and receivables, together with the related allowance, are written off when there
is no realistic prospect of future recovery and all collateral has been realized. If, in subsequent
period, the amount of the impairment loss decreases and the decrease can be related objectively to
an event occurring after the impairment was recognized, the previously recognized impairment
loss is reversed. Any subsequent reversal of an impairment loss is recognized in the consolidated
statement of income, to the extent that the carrying value of the asset does not exceed its
amortized cost at the reversal date.
In relation to receivables, a provision for impairment is made when there is objective evidence
(such as the probability of insolvency or significant financial difficulties of the debtor) that the
Group will not be able to collect all of the amounts due under the original terms of the invoice.
The carrying amount of the receivable is reduced either directly or through the use of an
allowance account. Impaired financial assets carried at amortized cost are derecognized when
they are assessed as uncollectible either at a direct reduction of the carrying amount or through
use of an allowance account when impairment has been previously recognized in the said amount.
AFS investments
If an AFS investment is impaired, the cumulative loss that had been recognized in the other
comprehensive income (resulting from decline in fair value) shall be recycled to profit and loss
even though the investment has not been derecognized. The amount of the cumulative loss that is
removed from the other comprehensive income and recognized in the profit and loss shall be the
difference between the acquisition cost (net of any principal repayment and amortization) and
current fair value, less any impairment loss on that financial asset previously recognized in the
consolidated statement of income.
In case of equity securities classified as AFS investments, objective evidence would include a
significant or prolonged decline in the fair value of the financial assets below its cost or where
other objective evidence of impairment exists. The determination of what is “significant” or
“prolonged” requires judgment. The Group treats “significant” generally as 30% or more of the
original cost of investment, and “prolonged” as greater than 12 months. In addition, the Group
evaluates other factors, including normal volatility in share price for unquoted equities.
Derecognition of Financial Assets and Financial Liabilities
Financial Assets
A financial asset (or, where applicable, a part of a financial asset or part of a group of similar
financial assets) is derecognized where:
• the right to receive cash flows from the asset has expired;
• the Group retains the right to receive cash flows from the asset, but has assumed an obligation
to pay them in full without material delay to a third party under a “pass-through”
arrangement; or
• the Group has transferred its right to receive cash flows from the asset and either (a) has
transferred substantially all the risks and rewards of the asset, or (b) has neither transferred
nor retained substantially all the risks and rewards of the asset, but has transferred control of
the asset.
Where continuing involvement takes the form of a written and/or purchased option (including a
cash-settled option or similar provision) on the transferred asset, the extent of the Group’s
continuing involvement is the amount of the transferred asset that the Group may repurchase,
except that in the case of a written put option (including a cash-settled option or similar provision)
on an asset measured at fair value, the extent of the Group’s continuing involvement is limited to
the lower of the fair value of the transferred asset and the option exercise price.
Financial Liabilities
A financial liability is derecognized when the obligation under the liability is discharged,
cancelled or has expired.
Where an existing financial liability is replaced by another from the same lender on substantially
different terms, or the terms of an existing liability are substantially modified, such an exchange
or modification is treated as a derecognition of the original liability and the recognition of a new
liability, and the difference in the respective carrying amounts is recognized in the consolidated
statement of income.
Offsetting Financial Instruments
Financial assets and financial liabilities are offset and the net amount reported in the consolidated
balance sheet if, and only if, there is a currently enforceable legal right to offset the recognized
amounts and there is an intention to settle on a net basis, or to realize the asset and settle the
liability simultaneously. This is not generally the case with master netting agreements, and the
related assets and liabilities are presented gross in the consolidated balance sheet.
Embedded Derivatives
An embedded derivative is separated from the host financial or non-financial contract and
accounted for as a derivative if all of the following conditions are met:
• the economic characteristics and risks of the embedded derivative are not closely related to the
economic characteristic of the host contract;
• a separate instrument with the same terms as the embedded derivative would meet the
definition of a derivative; and
• the hybrid or combined instrument is not recognized at FVPL.
The Group assesses whether embedded derivatives are required to be separated from host
contracts when the Group first becomes a party to the contract. Reassessment only occurs if there
is a change in the terms of the contract that significantly modifies the cash flows that would
otherwise be required.
An entity determines whether a modification to the cash flows is significant by considering the
extent to which the expected future cash flows associated with the embedded derivative, the host
contract or both have changed and whether the change is significant relative to the previously
expected cash flows on the contract.
Embedded derivatives that are bifurcated from the host contracts are accounted for as financial
assets at FVPL. Changes in fair values are included in the consolidated statement of income.
Derivatives are carried as assets when the fair value is positive and as liabilities when the fair
value is negative.
As of December 31, 2009 and 2008, the Group does not have contracts identified as having
embedded derivatives characteristics.
Inventories
Inventories, including goods in process, are valued at the lower of cost and net realizable value
(NRV). Costs incurred in bringing the inventories to their present location and conditions are
accounted for as follows:
Finished goods and goods in process - direct materials, direct labor, and a
proportion of manufacturing overhead costs,
determined using the weighted average
method
Raw materials - purchase cost using the weighted average
method
Spare parts and supplies - purchase cost using the weighted average
method
NRV, except for spare parts and supplies, is the estimated selling price in the ordinary course of
business, less the costs of completion, marketing and distribution. For spare parts and supplies,
NRV is the current replacement cost.
An allowance for inventory obsolescence is provided for slow-moving, obsolete, defective and
damaged inventories based on physical inspection and management evaluation.
Property, Plant and Equipment
Property, plant and equipment, except land, are stated at cost less accumulated depreciation and
amortization, and any impairment in value.
Land is stated at revalued amount based on a valuation performed by an independent firm of
appraisers. The increase in the valuation of land is credited to “Revaluation increment on land”,
net of related deferred income tax liability, and presented under the equity section of the
consolidated balance sheet.
Revaluation of land is made so that the carrying amount does not differ materially from that
which would be determined using the fair value at the balance sheet date. For subsequent
revaluations, any resulting increase in the assets carrying amount as a result of the revaluation is
credited to “Revaluation increment on land”, net of related deferred income tax liability in the
consolidated statement of comprehensive income. Any resulting decrease is directly charged
against any related revaluation increment to the extent that the decrease does not exceed the
amount of the revaluation increment in respect of the same assets.
The initial cost of items of property, plant and equipment consists of its purchase price, including
import duties and any directly attributable costs of bringing the asset to its working condition and
location for its intended use. Expenditures incurred after the fixed assets have been put into

operation, such as repairs and maintenance and overhaul costs, are normally charged to the
consolidated statement of income in the period the costs are incurred. In situations where it can
be clearly demonstrated that the expenditures have resulted in an increase in the future economic
benefits expected to be obtained from the use of an item of property, plant and equipment beyond
its originally assessed standard of performance, the expenditures are capitalized as an additional
cost of the item of property, plant and equipment.
Depreciation or amortization are computed on a straight-line basis over the estimated useful lives
of the assets as follows:
Number of Years
Land improvements 10 to 20
Silos, buildings and improvements 10 to 30
Machinery and equipment 10 to 25
Transportation and delivery equipment 5
Office furniture and fixtures 2 to 5
Leasehold improvements are amortized over the life of the assets or the lease term, whichever is
shorter.
Construction in progress are properties in the course of construction for production, rental or
administrative purposes, or for purposes not yet determined, which are carried at cost less any
recognized impairment loss. These assets are not depreciated until such time that the relevant
assets are completed and available for use.
Depreciation or amortization of an item of property, plant and equipment begins when it becomes
available for use, i.e., when it is in the location and condition necessary for it to be capable of
operating in the manner intended by management. Depreciation or amortization ceases at the
earlier of the date that the item is classified as held for sale (or included in a disposal group that is
classified as held for sale) in accordance with PFRS 5, +oncurrent Assets Held for Sale and
Discontinued Operations, and the date the asset is derecognized.
The estimated useful lives and depreciation and amortization method are reviewed periodically to
ensure that the periods and method of depreciation and amortization are consistent with the
expected pattern of economic benefits from items of property, plant and equipment.
Fully depreciated assets are retained in the accounts until they are no longer in use and no further
depreciation is recognized in the consolidated statement of income. When assets are retired or
otherwise disposed of, the cost and the related accumulated depreciation and amortization and any
impairment in value are removed from the accounts and any resulting gain or loss is recognized in
the consolidated statement of income.
Borrowing Costs
Borrowing costs are capitalized if they are directly attributable to the acquisition, construction or
production of a qualifying asset. All other borrowing costs are expensed in the period they are
incurred. Capitalization of borrowing costs commences when the activities to prepare the asset are
in progress and expenditures and borrowing costs are being incurred. Borrowing costs are
capitalized until the assets are substantially ready for their intended use. If the resulting carrying
amount of the asset exceeds its recoverable amount, an impairment loss is recorded. Borrowing
costs include interest charges and other costs incurred in connection with the borrowing of funds.

Investments in Associates
Investments in associates are accounted for under the equity method of accounting. An associate
is an entity in which the Group has significant influence and which is neither a subsidiary nor a
joint venture of the Group. Following are the associates whose investments are accounted for
under the equity method:
Percentage of Ownership
2009 2008
Selecta Wall’s Land Corporation 35.00 35.00
Philstar 30.00 30.00
Philtown (see Note 10) – 34.21
The investments in associates are carried in the consolidated balance sheet at cost plus post-
acquisition changes in the Group’s share in the net assets of the associates. Goodwill relating to
an associate is included in the carrying amount of the investment and is not amortized. The
consolidated statement of income reflects the Group’s share of the results of operations of the
associates. Where there has been a change recognized directly in the equity of the associate, the
Group recognizes its share of any changes, and discloses this when applicable, in the details of the
changes in equity. After application of the equity method, the Group determines whether it is
necessary to recognize any additional impairment loss with respect to the Group’s investment in
the associates. Unrealized gains and losses resulting from transactions between the Group and the
associate are eliminated to the extent of the interest in the associate.
Philtown ceased to be an associate of the Group due to the loss of significant influence resulting
from the Parent Company’s declaration of its investment in Philtown as property dividends to its
stockholders on April 29, 2009 (see note 26).
Interest in Joint Ventures
The interest in 50%-owned joint venture, URICI, is accounted for using the proportionate
consolidation method, which involves consolidating a proportionate share of the joint ventures’
assets, liabilities, income and expenses with similar items in the consolidated financial statements
on a line-by-line basis. The financial statements of the joint venture are prepared for the same
reporting period as the Parent Company.
Adjustments are made in the Group’s consolidated financial statements to eliminate the Group’s
share of intragroup balances, income and expenses and unrealized gains and losses on
transactions between the Group and its jointly controlled entity to the extent of share in interest in
joint venture. Losses on transactions are recognized immediately if the loss provides evidence of
a reduction in the net realizable value of the current assets or am impairment loss. The joint
venture is proportionately consolidated until the date on which the Group ceases to have joint
control over the joint venture.
Impairment of Non-financial Assets
The carrying values of property, plant and equipment, and investments in joint ventures and
associates are reviewed for impairment when events or changes in circumstances indicate that the
carrying values may not be recoverable. If any such indication exists and where the carrying
value exceeds the estimated recoverable amount, the asset or cash-generating units (CGU) is
written down to their recoverable amount. The recoverable amount of the non-financial asset is
the greater of fair value less cost to sell and value-in-use. The fair value less cost to sell is the
amount obtainable from the sale of an asset in an arm’s length transaction. In assessing value-in-
use, the estimated future cash flows are discounted to their present value using a pre-tax discount
rate that reflects current market assessments of the time value of money and the risks specific to
the asset. For an asset that does not generate largely independent cash inflows, the recoverable
amount is determined for the CGU to which the asset belongs. Impairment losses, if any, are

recognized in the consolidated statement of income in those expense categories consistent with
the function of the impaired asset.
Previously recognized impairment loss is reversed only if there has been a change in the
assumptions used to determine the recoverable amount of an asset, but not, however, to an amount
higher than the carrying amount that would have been determined (net of any depreciation and
amortization) had there been no impairment loss recognized for the asset in prior years. A
reversal of an impairment loss is recognized in the consolidated statement of income.
Goodwill
Goodwill acquired in a business combination is initially measured at cost, which is the excess of
the cost of the business combination over the Group’s interest in the net fair value of the
identifiable assets, liabilities and contingent liabilities. Following initial recognition, goodwill is
measured at cost less any accumulated impairment losses. Goodwill is reviewed for impairment
annually, or more frequently if events or changes in circumstances indicate that the carrying value
may be impaired.
For the purpose of impairment testing, goodwill acquired in a business combination is, from the
acquisition date, allocated to each of the Group’s CGU, or groups of CGU, that are expected to
benefit from the synergies of the combination, irrespective of whether other assets or liabilities of
the Group are assigned to those units or groups of units.
Impairment is determined by assessing the recoverable amount of the CGU or group of CGU, to
which goodwill relates. Where the recoverable amount of the CGU or group of CGU is less than
the carrying amounts, an impairment loss is recognized. Where goodwill forms part of a CGU or
group of CGU and part of the operations within that unit is disposed of, the goodwill associated
with the operation disposed of is included in the carrying amount of the operation when
determining the gain or loss on disposal of the operation. Goodwill disposed of in this
circumstance is measured based on the relative values of the operations disposed of and the
portion of the CGU retained.
Capital Stock
Capital stock is stated at par value for all shares issued and outstanding. When the Parent
Company issues more than one class of stock, a separate account is maintained for each class of
stock and the number of shares issued.
When the shares are sold at a premium, the difference between the proceeds and the par value is
credited to the “Capital in excess of par value” account. When shares are issued for a
consideration other than cash, the proceeds are measured by the fair value of the consideration
received. In case shares are issued to extinguish or to settle the liability of the Parent Company,
the share shall be measured at either the fair value of the shares issued or fair value of the liability
settled, whichever is more reliably determinable.
Direct costs incurred related to equity issuance, such as underwriting, accounting and legal fees,
printing costs and taxes are charged to the “Capital in excess of par value” account.
Revenue Recognition
Revenue from sale of goods and services from manufacturing and service operations is recognized
to the extent that it is probable that the economic benefits will flow to the Group and the amount
of revenue can be reliably measured. Revenue is measured at the fair value of the consideration
received or receivable excluding value-added tax (VAT), returns and discounts. The Group
assesses its revenue arrangements against specific criteria in order to determine if it is acting as
principal or agent. The Group has concluded that it is acting as a principal in all of its revenue

arrangements, except for RIBI, an insurance broker, which acts as an agent. The following
specific recognition criteria must also be met before revenue is recognized.
Sale of goods (Manufacturing)
Revenue is recognized when the significant risks and rewards of ownership of the goods have
passed to the buyer and there is actual delivery made and the same is accepted by the buyer.
Sale of services (Service)
Revenue is recognized upon performance of services.
Rent
Rent income is recognized on a straight-line basis over the terms of the lease.
Interest
Interest income is recognized as the interest accrues using the effective interest method.
Dividends
Dividend income on investments in shares of stock is recognized when the Group’s right to
receive the payment is established, which is the date when the dividend declaration is approved by
the investee’s BOD and the stockholders.
Direct Costs
Cost of goods sold is recognized when goods are delivered to and accepted by the buyer. Cost of
services is recognized when the related services are performed.
Selling and Marketing, and General and Administrative Expenses
Selling and marketing expenses are costs incurred to sell or distribute merchandise. It includes
export and documentation processing and delivery, among others. General and administrative
expenses constitute costs of administering the business. Selling and marketing, general and
administrative expenses are expensed as incurred.
Pension Benefits Costs
The Group has defined benefit pension plans covering all permanent, regular, full-time employees
administered by trustee banks. The cost of providing benefits under the defined benefit plans is
determined using the projected unit credit actuarial valuation method. Actuarial gains and losses
arising from experience adjustment and change in actuarial assumptions are recognized as other
comprehensive income.
Actuarial gains and losses are reported in retained earnings in the period they are recognized as
other comprehensive income.
The past service cost is recognized as an expense on a straight-line basis over the average period
until the benefits become vested. If the benefits are already vested, immediately following the
introduction of, or changes to, a pension plan, past service cost is recognized immediately. Gains
or losses on the curtailment or settlement of pension benefits are recognized when the curtailment
or settlement occurs.
The defined benefit liability is the aggregate of the present value of the defined benefit obligation
less past service cost not yet recognized and the fair value of plan assets out of which the
obligations are to be settled directly.
Share-based Compensation Plan
URICI operates an equity-settled, share-based compensation plan. The total amount to be
expensed over the vesting period is determined by reference to the fair value of the options
granted as determined on the grant date, excluding the impact of any non-market vesting
conditions (for example, profitability and sales growth targets).
Non-market vesting conditions are included in assumptions about the number of options that are
expected to become exercisable. At each balance sheet date, the entity revises its estimates of the
number of options that are expected to become exercisable. It recognizes the impact of the
revision of original estimates, if any, in the consolidated statement of income, with a
corresponding adjustment to equity.
Leases
Finance leases, which transfer to the Group substantially all the risks and rewards incidental to
ownership of the leased item, are capitalized at the inception of the lease at the fair value of the
leased property or, if lower, at the present value of the minimum lease payments. Lease payments
are apportioned between the finance charges and reduction of the lease liability so as to achieve a
constant rate of interest on the remaining balance of the liability. Finance charges are recognized
in the consolidated statement of income.
Capitalized leased assets are depreciated over the shorter of the estimated useful lives of the
assets or the respective lease terms.
Leases where lessors retain substantially all the risks and benefits of ownership of the asset are
classified as operating leases. Operating lease payments are recognized as expense in the
consolidated statement of income on a straight-line basis over the lease term.
Foreign Currency Transactions and Translations
Transactions in foreign currencies are recorded using the functional currency exchange rate at the
date of the transaction. Outstanding monetary assets and liabilities denominated in foreign
currencies are translated using the closing exchange rate at balance sheet date. Non-monetary
items that are measured in terms of historical cost in a foreign currency are translated using the
exchange rates as at the dates of the initial transactions.
Income Taxes
Current income tax
Current income tax assets and liabilities for the current and prior periods are measured at the
amount expected to be recovered from or paid to the taxation authorities. The tax rates and tax
laws used as basis to compute the amount are those that have been enacted or substantively
enacted at the balance sheet date.
Deferred income tax
Deferred income tax is provided, using the balance sheet liability method, on all temporary
differences at the balance sheet date between the tax bases of assets and liabilities and their
carrying amounts for financial reporting purposes.
Deferred income tax liabilities are recognized for all taxable temporary differences. Deferred
income tax assets are recognized for all deductible temporary differences and carryforward
benefits of unused tax credit from excess of minimum corporate income tax (MCIT) over regular
corporate income tax (RCIT), to the extent that it is probable that sufficient future taxable profits
will be available against which the deductible temporary differences and carryforward benefits of
unused MCIT can be utilized.

The carrying amount of deferred income tax assets is reviewed at each balance sheet date and
reduced to the extent that it is no longer probable that sufficient future taxable profits will be
available to allow all or part of the deferred income tax assets to be utilized. Unrecognized
deferred income tax assets are reassessed at each balance sheet date and are recognized to the
extent that it has become probable that sufficient future taxable profits will allow the deferred
income tax asset to be recovered.
Deferred income tax assets and deferred income tax liabilities are measured at the tax rates that
are expected to apply to the year when the asset is realized or the liability is settled, based on tax
rates and tax laws that have been enacted or substantively enacted at the balance sheet date.
Deferred income tax assets and deferred income tax liabilities are offset, if a legally enforceable
right exists to offset current income tax assets against current income tax liabilities and the
deferred income taxes relate to the same taxable entity and the same taxation authority.
Earnings Per Share
Basic earnings per share is computed by dividing the net income for the year by the weighted
average number of common shares outstanding during the year after giving retroactive effect to
any stock split or stock dividends declared and stock rights exercised during the year, if any.
The Group does not have potentially dilutive common shares.
Segment Reporting
The Group’s operating businesses are organized and managed separately according to the nature
of the products provided, with each segment representing a strategic business unit that offers
different products and serves different markets. Financial information on business segments are
presented in Note 4.
Provisions and Contingencies
Provisions are recognized when the Group has a present obligation (legal or constructive) as a
result of a past event, it is probable (i.e., more likely than not) that an outflow of resources
embodying economic benefits will be required to settle the obligation, and a reliable estimate can
be made of the amount of the obligation. Where the Group expects some or all of the provision to
be reimbursed, the reimbursement is recognized as a separate asset, but only when the
reimbursement is virtually certain. The expense relating to any provision is presented in the
consolidated statement of income, net of reimbursement. If the effect of the time value of money
is material, provisions are discounted using the current pre-tax rate that reflects, where
appropriate, the risks specific to the liability. Where discounting is used, the increase in the
provision due to the passage of time is recognized as interest expense.
Contingent liabilities are not recognized in the consolidated financial statements. They are
disclosed unless the outflow of resources embodying economic benefits is remote. Contingent
assets are not recognized in the consolidated financial statements but disclosed when an inflow of
economic benefits is probable.
Events After the Balance Sheet Date
Events after the balance sheet date that provide additional information about the Group’s position
at the balance sheet date (adjusting events) are reflected in the consolidated financial statements.
Events after the balance sheet date that are not adjusting events are disclosed in the notes to
consolidated financial statements when material.
Future Changes in Accounting Policies
The Group will adopt the following revised PFRS, amendment to PAS and Philippine
Interpretations when these become effective, and as these become applicable. Except as
otherwise indicated, the Group does not expect the adoption of these new and amended PFRS,
PAS and Philippine Interpretations to have significant impact on the Group’s financial statements.
Effective in 2010
• Amendments to PFRS 2, Share-based payments - Group Cash-settled Share-based Payment
Transactions, clarify the scope and the accounting for group cash-settled share-based
payment transactions.
• Revised PFRS 3, Business Combinations, and PAS 27, Consolidated and Separate Financial
Statements, introduce a number of changes in the accounting for business combinations that
will impact the amount of goodwill recognized, the reported results in the period that an
acquisition occurs, and future reported results. The revised PAS 27 requires, among others,
that (a) change in ownership interests of a subsidiary (that do not result in loss of control)
will be accounted for as an equity transaction and will have no impact on goodwill nor will it
give rise to a gain or loss; (b) losses incurred by the subsidiary will be allocated between the
controlling and noncontrolling interests (previously referred to as “minority interests”); even
if the losses exceed the noncontrolling equity investment in the subsidiary; and (c) on loss of
control of a subsidiary, any retained interest will be remeasured to fair value and this will
impact the gain or loss recognized on disposal.
The changes introduced by the revised PFRS 3 must be applied prospectively and PAS 27,
retrospectively with few exceptions.
• Amendment to PAS 39, Financial Instruments: Recognition and Measurement - Eligible
Hedged Items, addresses only the designation of a one-sided risk in a hedged item, and the
designation of inflation as a hedged risk or portion in particular situations. The amendment
clarifies that an entity is permitted to designate a portion of the fair value changes or cash
flow variability of a financial instrument as a hedged item.
• Philippine Interpretation IFRIC 17, Distributions of +on-cash Assets to Owners, provides
guidance on how to account for non-cash distributions to owners. The interpretation clarifies
when to recognize a liability, how to measure it and the associated assets, and when to
derecognize the asset and liability. Improvements to PFRS
The Financial Reporting Standards Council approved in its meeting in May 2009 the adoption of
Improvements to IFRS issued by IASB in April 2009 effective in 2010, unless otherwise stated.
• PFRS 2, Share-based Payment, clarifies that the contribution of a business on formation of
a joint venture and combinations under common control are not within the scope of PFRS 2
even though they are out of scope of PFRS 3. The amendment is effective for financial years
on or after July 1, 2009.
• PFRS 5, +oncurrent Assets Held for Sale and Discontinued Operations, clarifies that the
disclosure required in respect of noncurrent assets or disposal groups classified as held for
sale or discontinued operations are only those set out in PFRS 5. The disclosure
requirements of other PFRS only apply if specifically required for such noncurrent assets or
discontinued operations.
• PFRS 8, Operating Segments, clarifies that segment assets and liabilities need only be
reported when those assets and liabilities are included in measures that are used by the chief
operating decision maker.
• PAS 1, Presentation of Financial Statements, clarifies that the terms of a liability that could
result, at anytime, in its settlement by the issuance of equity instruments at the option of the
counterparty do not affect its classification.
• PAS 7, Statement of Cash Flows, explicitly states that only expenditure that results in a
recognized asset can be classified as a cash flow from investing activities.
• PAS 17, Leases, removes the specific guidance on classifying land as lease so that only the
general guidance remains. Prior to the amendment, leases of land were classified as
operating leases. The amendment now requires that leases of land are classified as either
“finance” or “operating” in accordance with the agreed principles of PAS 17. The
amendment will be applied retrospectively.
• PAS 36, Impairment of Assets, clarifies that the largest unit permitted for allocating
goodwill acquired in a business combination is the operating segment, as defined in PFRS 8
before aggregation for reporting purposes.
• PAS 38, Intangible Assets, clarifies that if an intangible asset acquired in a business
combination is identifiable only with another intangible asset, the acquirer may recognize
the group of intangible assets as a single asset provided the individual assets have similar
useful lives.
It also clarifies that the valuation techniques presented for determining the fair value of
intangible assets acquired in a business combination that are not traded in active markets are
only examples and are not restrictive on the methods that can be used.
• PAS 39, Financial Instruments: Recognition and Measurement, clarifies that a prepayment
option is considered closely related to the host contract when the exercise price of a
prepayment option reimburses the lender up to the approximate present value of lost interest
for the remaining term of the host contract.
The amendment also clarifies that the scope exemption for contracts between an acquirer
and a vendor in a business combination to buy or sell an acquiree at a future date, applies
only to binding forward contracts, and not derivative contracts where further actions by
either party are still to be taken.
It also clarifies that gains or losses on cash flow hedges of a forecast transaction that
subsequently results in the recognition of a financial instrument or on cash flow hedges of
recognized financial instruments should be reclassified in the period that the hedged forecast
cash flows affect profit or loss.
• Philippine Interpretations IFRIC 9, Reassessment of Embedded Derivatives, clarifies that it
does not apply to possible reassessment, at the date of acquisition, to embedded derivatives
in contracts acquired in a combination between entities or businesses under common control
or the formation of a joint venture.
• Philippine Interpretations IFRIC 16, Hedges of a +et Investment in a Foreign Operation,
states that in a hedge of a net investment in a foreign operation, qualifying hedging
instruments may be held by any entity or entities within the group, including the foreign
operation itself, as long as the designation, documentation and effectiveness requirements of
PAS 39 that relate to a net investment hedge are satisfied.
Effective in 2012
• Philippine Interpretation IFRIC 15, Agreement for Construction of Real Estate, covers
accounting for revenue and associated expenses by entities that undertake the construction
of real estate directly or through subcontractors. This Interpretation requires that revenue on
construction of real estate be recognized only upon completion, except when such contract
qualifies as a construction contract to be accounted for under PAS 11, Construction
Contracts, or involves rendering of services in which case revenue is recognized based on
stage of completion. Contracts involving provision of services with the construction
materials and where the risks and reward of ownership are transferred to the buyer on a
continuous basis will also be accounted for based on stage of completion.
3. Management’s Use of Significant Accounting Judgments and Estimates
The preparation of the Group’s consolidated financial statements requires management to make
judgments and estimates that affect the amounts reported and the disclosures made. The estimates
and assumptions used in the consolidated financial statements are based upon management’s
evaluation of relevant facts and circumstances as of the date of the financial statements. Actual
results could differ from these estimates, and such estimates will be adjusted accordingly, when
the effects become determinable.
Judgments
In the process of applying the Group’s accounting policies, management has made the following
judgments apart from those involving estimations, which have the most significant effect in the
amounts recognized in the consolidated financial statements. Classification of financial instruments
The Group classifies a financial instrument, or its component parts, on initial recognition as a
financial asset, a financial liability or an equity instrument in accordance with the substance of the
contractual arrangement and the definitions of a financial asset, a financial liability or an equity
instrument. The substance of a financial instrument, rather than its legal form, governs its
classification in the consolidated balance sheet. Classification of financial instruments is
reviewed at each balance sheet date. Impairment of AFS investments
The Group determines that AFS investments are impaired when there has been a significant or
prolonged decline in the fair value below their cost. This determination of what is ‘significant’ or
‘prolonged’ requires judgment. The Group treats ‘significant’ generally as 30% or more and
‘prolonged’ as greater than 12 months for the quoted equity securities. Impairment may be
appropriate when there is evidence of deterioration in the financial health of the investee, industry
and sector performance, changes in technology, and operational and financing cash flows. As of
December 31, 2009 and 2008, AFS investments in equity securities amounted to
P=1,775.04 million and P=1,642.07 million, respectively (see Note 10a).
Impairment loss recognized on AFS investments amounted to P=7.66 million in 2008 and nil in
2009 and 2007.

Provisions
The estimate of the probable costs for the resolution of possible third party claims has been
developed in consultation with outside consultant/legal counsel handling the Group’s defense on
these matters and is based upon an analysis of potential results. When management and its
outside consultant/legal counsel believe that the eventual liabilities under these and any other
claims, if any, will not have a material effect on the financial statements, no provision for
probable losses is recognized in the Group’s financial statements. The amount of provision is
being reassessed at least on an annual basis to consider new relevant information.
Provisions amounted to P=15.46 million and P=14.89 million as of December 31, 2009 and 2008,
respectively (see Notes 17 and 29c).
Determination of the classification of leases
The Group has entered into various lease agreements as a lessee. The Group accounts for lease
arrangements as finance lease when the lease term is for the major part of the life of the asset and
the Group has the option to purchase the asset at a price that is expected to be sufficiently lower
than the fair value at the date the option is exercisable. Otherwise, the leases are accounted for as
operating leases.
Estimates
The key assumptions concerning the future and other key sources of estimation at the balance
sheet date that have a significant risk of causing a material adjustment to the carrying amount of
asset and liabilities within the next financial year are discussed below.
Determination of fair value of financial instruments
Financial assets and financial liabilities, on initial recognition, are accounted for at fair value. The
fair values of financial assets and financial liabilities, on initial recognition are normally the
transaction price. In the case of those financial assets that have no active markets, fair values are
determined using an appropriate valuation technique. Valuation techniques are used particularly
for financial assets and financial liabilities (including derivatives) that are not quoted in an active
market. Where valuation techniques are used to determine fair values (discounted cash flow,
option models), they are periodically reviewed by qualified personnel who are independent of the
trading function. All models are calibrated to ensure that outputs reflect actual data and
comparative market prices. To the extent practicable, models use only observable data as
valuation inputs. However, other inputs such as credit risk (whether that of the Group or the
counterparties), forward prices, volatilities and correlations, require management to develop
estimates or make adjustments to observable data of comparable instruments. The amount of
changes in fair values would differ if the Group uses different valuation assumptions or other
acceptable methodologies. Any change in fair value of these financial instruments (including
derivatives) would affect either the consolidated statement of income or equity.
The carrying values and the fair values of financial assets and financial liabilities as of
December 31, 2009 and 2008 are disclosed in Note 32.
Valuation of land under revaluation basis
The Group’s parcels of land are carried at revalued amounts, which approximate their fair values
at the date of the revaluation, less any subsequent accumulated depreciation and accumulated
impairment losses. The revaluation is performed by professionally qualified appraisers.
Revaluations are made every three to five years to ensure that the carrying amounts do not differ
materially from those which would be determined using fair values at balance sheet date.
The resulting increase in the valuation of land based on the 2008 valuations amounting to
P=501.14 million as of December 31, 2009 and 2008 is presented as “Revaluation increment on
land - net of deferred income tax liability” (see Note 9).
Estimation of allowance for doubtful accounts
The Group maintains allowance for doubtful accounts based on the results of the individual and
collective assessment. Under the individual assessment, the Group is required to obtain the
present value of estimated cash flows using the receivable’s original effective interest rate.
Impairment loss is determined as the difference between the receivable’s carrying balance and the
computed present value. If no future cash flows is expected, impairment loss is equal to the
carrying balance of the receivables. Factors considered in individual assessment are payment
history, inactive accounts, past due status and term. The collective assessment would require the
Group to classify its receivables based on the credit risk characteristics (customer type, payment
history, past due status and term) of the customers. Impairment loss is then determined based on
historical loss experience of the receivables grouped per credit risk profile. Historical loss
experience is adjusted on the basis of current observable data to reflect the effects of current
conditions that did not affect the period on which the historical loss experience is based and to
remove the effects of conditions in the historical period that do not exist currently. The
methodology and assumptions used for the individual and collective assessments are based on
management’s judgment and estimate. Therefore, the amount and timing of recorded expense for
any period would differ depending on the judgments and estimates made during the year.
As of December 31, 2009 and 2008, the carrying value of accounts receivable amounted to
P=2,083.61 million and P=2,176.50 million, respectively (see Note 6). The related allowance for
doubtful accounts on current receivables amounted to P=567.55 million and P=580.31 million as of
December 31, 2009 and 2008, respectively (see Notes 6 and 31). Noncurrent advances to related
parties amounting to P=848.91 million and P=849.80 million as of December 31, 2009 and 2008,
respectively, were fully provided with allowance (see Note 24).
Estimation of allowance for probable losses
Allowance for probable losses of other current assets is based on the ability of the Company to
recover the carrying value of the assets. Accounts estimated to be potentially unrecoverable are
provided with adequate allowance through charges to profit or loss in the form of allowance for
probable loss.
The allowance for probable losses pertaining to other current assets amounted to P=33.65 million
as of December 31, 2009 and 2008 (see Note 8).
Estimation of inventory obsolescence
The Group estimates the allowance for inventory obsolescence related to inventories based on a
certain percentage of non-moving inventories. The level of allowance is evaluated by management
based on past experiences and other factors affecting the saleability of goods such as present
demand in the market and emergence of new products, among others.
Allowance for inventory obsolescence amounted to P=168.11 million and P=195.20 million as of
December 31, 2009 and 2008, respectively (see Note 7).
Estimation of +RV of inventories
The Group determines the NRV of inventories annually in accordance with the accounting policy
stated in Note 2. In determining the NRV, the Group considers the current selling price of the
inventories and the estimated costs of completion and costs to sell.
The Group did not recognize any provision for inventory losses in 2009. As of
December 31, 2009 and 2008, the carrying value of inventories amounted to P=1,273.93 million
and P=1,373.27 million, respectively (see Note 7).

Estimation of useful lives of property, plant and equipment
The Group estimates the useful life of depreciable property, plant and equipment based on a
collective assessment of similar businesses, internal technical evaluation and experience with
similar assets. Estimated useful lives are based on the periods over which the assets are expected
to be available for use. The estimated useful lives are reviewed periodically and are updated if
expectations differ from previous estimates due to physical wear and tear, technical and
commercial obsolescence and legal or other limits on the use of the assets. It is possible,
however, that future results of operations could be materially affected by changes in the amounts
and timing of recorded expenses brought about by changes in the factors mentioned above. A
reduction in the estimated useful life of any item of property, plant and equipment would increase
the recorded operating expenses and decrease the carrying value of the assets and vice versa.
The carrying values of these property, plant and equipment amounted to P=2,538.96 million and
P=2,339.20 million as of December 31, 2009 and 2008, respectively (see Note 9).
Determination of impairment of non-financial assets
The Group determines whether goodwill is impaired at least on an annual basis. This requires an
estimation of the recoverable amounts, which is determined based on the value in use calculation,
which requires the estimation of cash flows expected to be generated from the continued use and
ultimate disposition of the asset.
Goodwill amounted to P=190.56 million as of December 31, 2009 and 2008. There was no
impairment on goodwill in 2009, 2008 and 2007 (see Note 12).
The Group assesses whether there are indications of impairment on its other noncurrent non-
financial assets, at least on an annual basis. If there are, impairment testing is performed except
for goodwill which is tested on an annual basis. This requires an estimation of the value-in-use of
the CGUs to which the assets belong. Estimating the value-in-use requires the Group to make an
estimate of the expected future cash flows from the CGU and also to choose a suitable discount
rate in order to calculate the present value of those cash flows. No further impairment losses were
recognized in 2009 and 2008 in view of the significantly improved profitability of the Group. The
carrying value of property, plant and equipment valued at cost amounted to P=1,501.86 million and
P=1,297.07 million as of December 31, 2009 and 2008, respectively. Accumulated impairment loss
on property, plant and equipment amounted to P=112.29 million as of December 31, 2009 and
P=219.24 million as of December 31, 2008 (see Note 9).
As of December 31, 2009 and 2008, the carrying value of investments in associates amounted to
P=249.94 million and P=673.96 million, respectively, net of accumulated impairment amounting to
P=43.21 million as of December 31, 2009 and 2008 (see Note 10b).
Recognition of deferred income tax assets
The Group reviews the carrying amounts of deferred income tax assets at each balance sheet date
and adjusts the balance of deferred income tax assets to the extent that it is no longer probable
that sufficient future taxable profits will be available to allow all or part of the deferred income
tax assets to be utilized.
Deferred income tax assets recognized amounted to P=81.16 million and P=59.04 million as of
December 31, 2009 and 2008, respectively (see Note 28).
Deferred income tax assets from deductible temporary differences and excess MCIT amounting to
P=587.94 million and P=646.71 million as of December 31, 2009 and 2008, respectively, were not
recognized because the Group believes that it is not probable that it will have sufficient future
taxable profits against which these items can be utilized (see Note 28).
Estimation of pension benefits obligations and costs
The determination of the Group’s obligation and costs of pension benefits depends on the
selection by management of certain assumptions used by the actuary in calculating such amounts.
Those assumptions are described in Note 25 and include, among others the discount rate,
expected rate of return and rate of salary increase. The Group recognizes all actuarial gains and
losses in the consolidated statement of comprehensive income, and therefore generally affects the
recorded obligation. While management believes that the Group’s assumptions are reasonable
and appropriate, significant differences in actual experience or significant changes in assumptions
may materially affect the Group’s pension obligation. Net pension obligations amounted to P=7.85 million and P=1.69 million as of December 31, 2009
and 2008, respectively. Pension benefits costs amounted to P=7.62 million in 2009, P=17.50 million
in 2008 and P=18.03 million in 2007 (see Note 25).
Use of effective interest rate
The Group made reference to the prevailing market interest rates for instruments of the same
tenor in choosing the discount rates used to determine the net present value of long-term,
non-interest-bearing receivable from Meralco, advances to and from associates and other related
parties and other long-term financial assets and obligations.
Receivable from Meralco included under “Other current assets” and “Other noncurrent assets”
accounts in the 2009 and 2008 consolidated balance sheets amounted to P=8.96 million and
P=16.64 million, respectively (see Notes 8 and 12).
4. Segment Information
The segment reporting format is determined to be the Group’s operating business segments. The
Group is organized into the following operating business segments: (a) beverage and meat
products, (b) flour-based products, (c) real estate, and (d) others. The beverage and meat products segment manufactures and sells meat, fats and oil, and milk and
juices. Flour-based products segment manufactures and sells flour, pasta, bakery and other
bakery products. The real estate segment develops and sells real estate properties and leases
office and other premises owned by the Group, but which are surplus to the Group’s
requirements. Others consist of insurance, financing, lighterage moving, cargo handling, ice
cream manufacturing and other services shown in aggregate as “Other Operations.” The operating businesses are organized and managed separately according to the nature of the
products and services provided, with each segment representing a strategic business unit that
offers different products and serves different markets. All operating business segments used by
the Company meet the definition of reportable segment under PFRS 8. Segment assets include all operating assets used by a segment and consist principally of operating
cash, receivables, inventories and property, plant and equipment, net of allowance and provisions.

Segment liabilities include all operating liabilities and consist principally of trade, wages and
taxes currently payable and accrued liabilities.
Intersegment transactions, i.e., segment revenues, segment expenses and segment results, include
transfers between business segments. Those transfers are eliminated in consolidation. The Group does not have a single external customer from which revenue generated amounted to
10% or more of the total revenue of the Group.
Information with regard to the Group’s significant business segments follows:
2009
Continuing Operations
Beverage
and Meat
Products
Flour
Based
Products
Other
Operations
Unallocated
Corporate
Balances
Total Eliminations
Consolidated
�et sales
External sales P=2,712,702 P=3,749,390 P=1,871,505 P=– P=8,333,597 P=8,333,597
Intersegment sales 21,397 365,606 43,693 – 430,696 (430,696) –
P=2,734,099 P=4,114,996 P=1,915,198 P=– 8,764,293 (P=430,696) P=8,333,597
Results
Income (loss) before provision
for income tax and minority interest
(P=329,540)
P=680,045
P=235,852
P=71,356
P=657,713
(P=168,155)
P=489,558
Interest and other financial income (charges) - net
(217,319)
31,786
(708)
29,692
(156,549)
19,537
(137,012)
Equity in net losses of associates – – – – – (10,635) (10,635)
Provision for income tax – (18,603) (70,426) – (89,029) (35,072) (124,101)
Net income (329,540) 661,442 165,427 71,356 568,685 (203,228) 365,457
Other information
Segment assets 4,298,546 5,988,978 1,494,577 3,863,863 15,645,964 (8,825,2056,820,759
Investments 133,267 – 59,736 2,594,457 2,787,460 2,024,983
Deferred income tax assets (196) 7,501 59,443 9,526 76,274 81,155
Consolidated Total Assets P=4,431,617 P=5,996,479 P=1,613,756 P=6,467,846 P=18,509,698 (P= P=8,926,897
Consolidated Total Liabilities P=6,212,234 P=1,973,392 P=2,066,453 P=2,932,895 P=13,184,974 (P= P=3,828,201
Capital expenditures P=194,264 P=17,183 P=137,265 P=2,942 P=351,654 P=351,654
Depreciation and amortization 73,978 49,925 43,227 2,741 169,871 169,871
Noncash expenses other than
depreciation and amortization
9,196
498
1,906
3,203
14,803
14,803
2008
Continuing Operations
Beverage and Meat
Products
Flour Based
Products
Other
Operations
Unallocated Corporate
Balances
Total
Discontinued Operations - Real
Estate
Eliminations
Consolidated
�et sales
External sales P=2,370,104 P=3,656,004 P=1,524,805 P=– P=7,550,913 P=194,396 (P=194,396) P=7,550,913 Intersegment sales – 318,933 7,976 – 326,909 – (326,909) –
P=2,370,104 P=3,974,937 P=1,532,781 P=– 7,877,822 P=194,396 (P=521,305) P=7,550,913
Income (loss) before provision for
income tax and minority interest
(P=222,698)
P=468,320
P=241,800
P=63,456
P=550,878
(P=81,763)
(P=72,388)
P=396,727
Interest and other financial income
(charges) - net
(138,934)
34,058
(24,433)
22,725
(106,584)
7,694
(7,694)
(106,584) Equity in net earnings of associates – – – – 44,138 (69,556) 69,556 44,138
Provision for income tax – – – – 69,884 8,354 (8,354) 69,884
Net income – – – – 326,843 (81,763) – 245,080
Other information
Segment assets P=2,228,094 P=3,934,229 P=3,656,249 P=2,540,222 P=12,358,794 P=– (P=5,512,135) P=6,846,659 Investments 167,958 21,398 2,777,346 950,067 3,916,769 – (1,600,865) 2,315,904
Deferred income tax assets (196) 6,945 46,032 6,256 59,037 – – 59,037
Consolidated Total Assets P=2,395,856 P=3,962,572 P=6,479,627 P=3,496,545 P=16,334,600 P=– (P=7,113,000) P=9,221,600
Consolidated Total Liabilities P=1,620,372 P=752,631 P=1,194,670 P=1,932,325 P=5,499,998 P=– (P=1,183,656) P=4,316,342
Capital expenditures P=131,179 P=374,732 P=110,597 P=1,706 P=618,214 P=– P=– P=618,214
Depreciation and amortization 51,643 35,404 38,748 1,504 127,299 – – 127,299
Noncash expenses other than depreciation and amortization
166,087
25,459
791
7,663
200,000
–
–
200,000
2007
Continuing Operations
Beverage
and Meat
Products
Flour
Based
Products
Other
Operations
Unallocated
Corporate
Balances
Total
Discontinued Operations -
Real
Estate
Eliminations
Consolidated
�et sales External sales P=1,935,885 P=2,785,547 P=1,373,705 P=– P=6,095,137 P=892,668 (P=892,668) P=6,095,137
Intersegment sales – 232,999 23,308 – 256,307 – (256,307) –
P=1,935,885 P=3,018,546 P=1,397,013 P=– P=6,351,444 P=892,668 (P=1,148,975) P=6,095,137
Income (loss) before provision for income tax and minority
interest
(P=239,354)
P=479,538
P=97,149
P=46,980
P=384,313
P=36,036
(P=142,026)
P=278,323
Interest and other financial income (charges) - net
(117,658)
34,057
(47,428)
52,417
(78,612)
19,990
(19,990)
(78,612)
Equity in net earnings of associates – – – – – – 10,310 10,310
Provision for income tax – – – – 71,685 8,356 (8,356) 71,685
Net income – – – – 206,638 27,680 – 234,318
Other information
Segment assets P=2,939,276 P=3,274,155 P=947,401 P=2,609,894 P=9,770,726 P=4,728,934 (P=5,827,132) P=8,672,528 Investments 320,701 326,472 278,153 4,069,015 4,994,341 388,812 (4,019,652) 1,363,501
Deferred income tax assets (liability)
(196)
7,218
51,407
19,498
77,927
34,343
–
112,270
Consolidated Total Assets P=3,259,781 P=3,607,845 P=1,276,961 P=6,698,407 P=14,842,994 P=5,152,089 (P=9,846,784) P=10,148,299
Consolidated Total Liabilities P=1,348,033 P=644,239 P=1,052,868 P=1,557,458 P=4,602,598 P=3,537,178 (P=2,730,047) P=5,409,729
Capital expenditures P=24,680 P=24,428 P=86,675 P=2,942 P=138,725 P=10,302 P=– P=149,027 Depreciation and amortization 48,809 40,938 29,265 1,398 120,410 12,762 – 133,172
Noncash expenses other than
depreciation and amortization
117,658
–
36,937
–
154,595
(19,989)
–
134,606
5. Cash and Cash Equivalents
2009 2008
Cash on hand and in banks P=346,250 P=248,730
Short-term investments 139,363 266,601
P=485,613 P=515,331
Cash in banks earns interest at the respective bank deposit rates. Short-term investments are made
for varying periods of up to three months depending on the immediate cash requirements of the
Group, and earn interest at the respective short-term investment rates.
Interest income earned from cash in banks and short-term investments amounted to
P=23.18 million in 2009, P=36.54 million in 2008 and P=25.46 million in 2007.
6. Accounts Receivable
2009 2008
Trade receivables P=1,783,590 P=1,950,970
Advances to related parties (Note 24) 622,713 561,231
Other receivables 244,863 244,602
2,651,166 2,756,803
Less allowance for doubtful accounts 567,552 580,307
P=2,083,614 P=2,176,496
Trade receivables are noninterest-bearing and are generally on 30 to 60 days term.
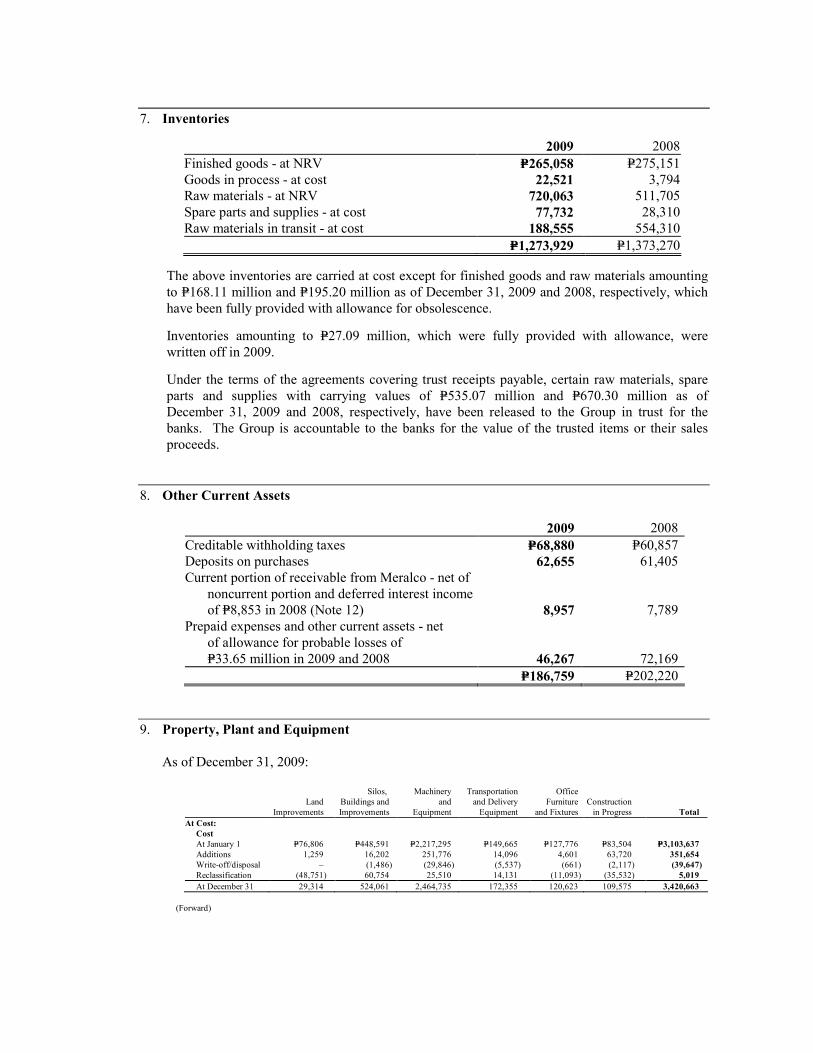
7. Inventories
2009 2008
Finished goods - at NRV P=265,058 P=275,151
Goods in process - at cost 22,521 3,794
Raw materials - at NRV 720,063 511,705
Spare parts and supplies - at cost 77,732 28,310
Raw materials in transit - at cost 188,555 554,310
P=1,273,929 P=1,373,270
The above inventories are carried at cost except for finished goods and raw materials amounting
to P=168.11 million and P=195.20 million as of December 31, 2009 and 2008, respectively, which
have been fully provided with allowance for obsolescence.
Inventories amounting to P=27.09 million, which were fully provided with allowance, were
written off in 2009.
Under the terms of the agreements covering trust receipts payable, certain raw materials, spare
parts and supplies with carrying values of P=535.07 million and P=670.30 million as of
December 31, 2009 and 2008, respectively, have been released to the Group in trust for the
banks. The Group is accountable to the banks for the value of the trusted items or their sales
proceeds.
8. Other Current Assets
2009 2008
Creditable withholding taxes P=68,880 P=60,857
Deposits on purchases 62,655 61,405
Current portion of receivable from Meralco - net of
noncurrent portion and deferred interest income
of P=8,853 in 2008 (Note 12) 8,957 7,789
Prepaid expenses and other current assets - net
of allowance for probable losses of
P=33.65 million in 2009 and 2008 46,267 72,169
P=186,759 P=202,220
9. Property, Plant and Equipment
As of December 31, 2009:
Silos, Machinery Transportation Office
Land Buildings and and and Delivery Furniture Construction
Improvements Improvements Equipment Equipment and Fixtures in Progress Total
At Cost:
Cost
At January 1 P=76,806 P=448,591 P=2,217,295 P=149,665 P=127,776 P=83,504 P=3,103,637
Additions 1,259 16,202 251,776 14,096 4,601 63,720 351,654
Write-off/disposal – (1,486) (29,846) (5,537) (661) (2,117) (39,647)
Reclassification (48,751) 60,754 25,510 14,131 (11,093) (35,532) 5,019
At December 31 29,314 524,061 2,464,735 172,355 120,623 109,575 3,420,663
(Forward)

Silos, Machinery Transportation Office
Land Buildings and and and Delivery Furniture Construction
Improvements Improvements Equipment Equipment and Fixtures in Progress Total
Accumulated
Depreciation
and
Amortization
At January 1 P=10,009 P=226,804 P=1,141,664 P=104,899 P=103,952 P=– P=1,587,328
Depreciation and
amortization 603 23,077 125,454 15,249 5,488 – 169,871
Write-off/disposal – (1,486) (23,226) 10,634 (418) – (14,496)
Reclassification (188) (8,864) 83,712 10,053 (9,572) – 75,141
Others – – (11,329) – – – (11,329)
At December 31 10,424 239,531 1,316,275 140,835 99,450 – 1,806,515
Accumulated
Impairment
Loss
At January 1 – – 219,238 – – – 219,238
Reclassification – – (75,141) – – – (75,141)
Reversal of
allowance for
impairment loss
–
–
(31,805)
–
–
–
(31,805)
At December 31 – – 112,292 – – – 112,292
�et Book Values at
December 31
P=18,890
P=284,530
P=1,036,168
P=31,520
P=21,173
P=109,575
P=1,501,856
At Appraised Value - Land
At January 1, 2009 P=1,042,127
Reclassification (5,019)
At December 31, 2009 P=1,037,108
As of December 31, 2008:
Silos, Machinery Transportation Office
Land Buildings and and and Delivery Furniture Construction
Improvements Improvements Equipment Equipment and Fixtures in Progress Total
At Cost:
Cost
At January 1 P=403,017 P=407,076 P=1,740,062 P=162,483 P=121,491 P=177,313 P=3,011,442
Additions – 46,047 430,825 6,860 8,440 126,042 618,214
Write-off/disposal – (2,335) (76,838) (6,133) – – (85,306)
Reclassification (326,211) – 163,491 1,504 248 (165,243) (326,211)
Deconsolidation – (2,197) (40,245) (15,049) (2,403) (54,608) (114,502)
At December 31 76,806 448,591 2,217,295 149,665 127,776 83,504 3,103,637
Accumulated
Depreciation and
Amortization
At January 1 9,482 216,980 1,137,417 112,508 95,140 – 1,571,527
Depreciation and
Amortization 527 14,356 87,629 13,572 11,215 – 127,299
Write-off/disposal – (2,335) (75,712) (6,133) – – (84,180)
Deconsolidation – (2,197) (7,670) (15,048) (2,403) – (27,318)
At December 31 10,009 226,804 1,141,664 104,899 103,952 – 1,587,328
Accumulated
Impairment
Loss
At January 1 – – 220,310 – – – 220,310
Reversal of allowance
for impairment loss
–
–
(1,072)
–
–
–
(1,072)
At December 31 – – 219,238 – – – 219,238
�et Book Values at
December 31
P=66,797
P=221,787
P=856,393
P=44,766
P=23,824
P=83,504
P=1,297,071
At Appraised Value - Land
At January 1, 2008 P=–
Reclassification 326,211
Appraisal increase 715,916
At December 31, 2008 P=1,042,127
In 2008, the Group’s land were stated at their revalued amounts based on a valuation as of
December 4, 2008. Accordingly, the costs were reclassified from “At cost” to “At appraised
value”. The resulting increase in the valuation of these assets amounting to P=715.92 million is
presented under “Revaluation increment on land” account, net of the related deferred income tax
liability in the equity section of the 2008 consolidated balance sheet and in the 2008 consolidated
statement of comprehensive income. If land were carried at cost less any impairment in value, the
amount would have been P=326.21 million.

Property, plant and equipment includes machinery and equipment with net carrying amount of
P=30.35 million and P=33.63 million as of December 31, 2009 and 2008, respectively, where the
Group is a lessee under finance leases (see Note 16). The “Equipment Sale Agreement” between the Parent Company and Tetra Pak Philippines, Inc.
was cancelled and terminated effective October 31, 2009 (see Note 16). The carrying value of the
related machinery and equipment amounted to P=13.64 million and P=15.16 million as of
October 31, 2009 and December 31, 2008, respectively. Property, plant and equipment with carrying value of P=1,892.82 million and P=1,288.00 million as
of December 31, 2009 and 2008, respectively, were used as collateral for the Group’s various
obligations.
10. Investments
a. AFS Investments
Rollforward of AFS investments follows:
Unquoted
Redeemable
Preferred
Shares
Common
Shares
Common
and Golf
Shares
Total
Balance, January 1, 2008 P=836,799 P=4,960 P=97,726 P=939,485
Add: Conversion of Philtown common shares
to preferred shares 762,850
–
–
762,850
Property dividends received – 35 – 35
Less: Sale of AFS investments – – (21,818) (21,818)
Adjustments to AFS due to: Valuation loss – – (30,819) (30,819)
Impairment loss recognized
in profit or loss –
–
(7,663)
(7,663)
Balance, December 31, 2008 1,599,649 4,995 37,426 1,642,070
Add: Reclassification of Philtown common shares from investment in
associate to AFS investment –
144,749
–
144,749
Property dividend received – 8 – 8
Less: Sale of Swift common shares – – (16,422) (16,422)
Adjustments to AFS due to
valuation increase –
–
4,634
4,634
Balance, December 31, 2009 P=1,599,649 P=149,752 P=25,638 P=1,775,039
Investments in redeemable preferred shares represent investments in Swift Foods, Inc. (Swift)
and Philtown. The Swift preferred shares have no voting rights and are convertible to
common shares anytime at the ratio of 10 common shares for every preferred share held and
are redeemable at the option of Swift. On January 29, 2008, the BOD and the Stockholders of
Philtown amended the Articles of Incorporation of Philtown with the conversion of
218,349,995 of its issued common shares to “Class B” preferred shares.
Under the Amended Articles of Incorporation of Philtown, Class B preferred shares with no
voting rights shall be redeemed by Philtown at the discretion of its BOD. Philtown
stockholders owning common shares are entitled to subscribe to the preferred shares in the
same proportion as their ownership in the common shares. Accordingly, the Parent Company
received 218,349,995 Philtown preferred shares valued at P=762.85 million in 2008.
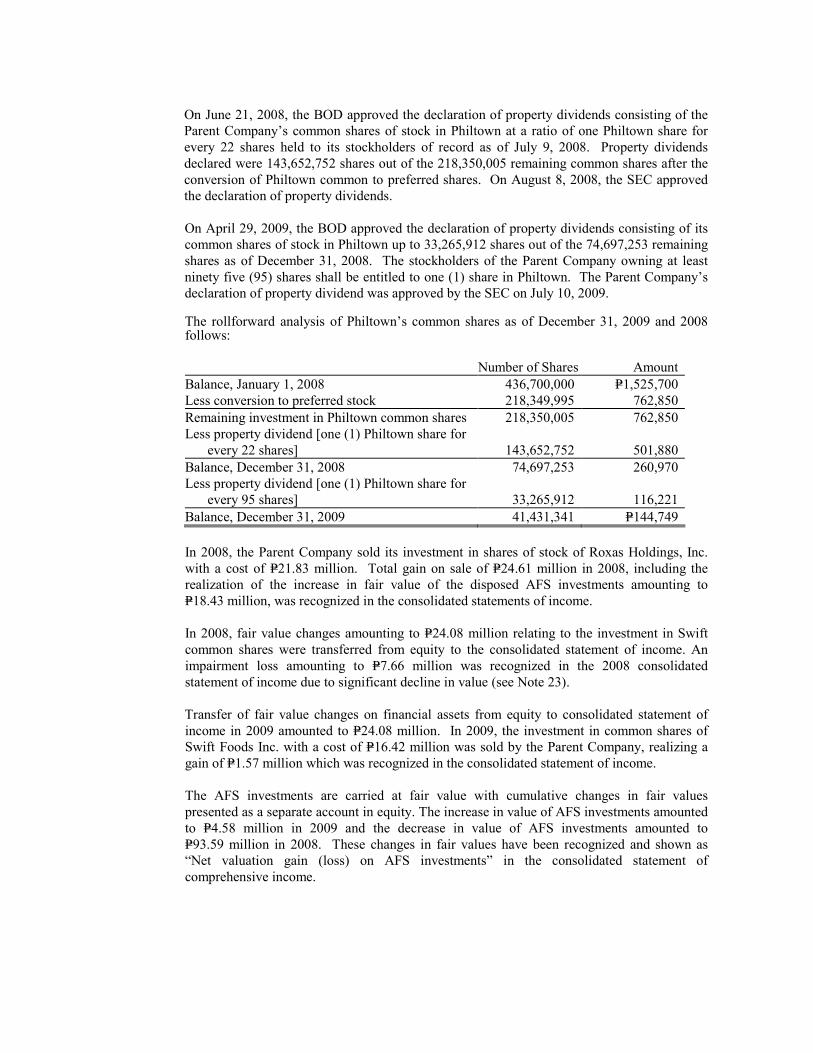
On June 21, 2008, the BOD approved the declaration of property dividends consisting of the
Parent Company’s common shares of stock in Philtown at a ratio of one Philtown share for
every 22 shares held to its stockholders of record as of July 9, 2008. Property dividends
declared were 143,652,752 shares out of the 218,350,005 remaining common shares after the
conversion of Philtown common to preferred shares. On August 8, 2008, the SEC approved
the declaration of property dividends.
On April 29, 2009, the BOD approved the declaration of property dividends consisting of its
common shares of stock in Philtown up to 33,265,912 shares out of the 74,697,253 remaining
shares as of December 31, 2008. The stockholders of the Parent Company owning at least
ninety five (95) shares shall be entitled to one (1) share in Philtown. The Parent Company’s
declaration of property dividend was approved by the SEC on July 10, 2009.
The rollforward analysis of Philtown’s common shares as of December 31, 2009 and 2008 follows:
Number of Shares Amount
Balance, January 1, 2008 436,700,000 P=1,525,700
Less conversion to preferred stock 218,349,995 762,850
Remaining investment in Philtown common shares 218,350,005 762,850
Less property dividend [one (1) Philtown share for
every 22 shares] 143,652,752 501,880
Balance, December 31, 2008 74,697,253 260,970
Less property dividend [one (1) Philtown share for
every 95 shares] 33,265,912 116,221
Balance, December 31, 2009 41,431,341 P=144,749
In 2008, the Parent Company sold its investment in shares of stock of Roxas Holdings, Inc.
with a cost of P=21.83 million. Total gain on sale of P=24.61 million in 2008, including the
realization of the increase in fair value of the disposed AFS investments amounting to
P=18.43 million, was recognized in the consolidated statements of income.
In 2008, fair value changes amounting to P=24.08 million relating to the investment in Swift
common shares were transferred from equity to the consolidated statement of income. An
impairment loss amounting to P=7.66 million was recognized in the 2008 consolidated
statement of income due to significant decline in value (see Note 23).
Transfer of fair value changes on financial assets from equity to consolidated statement of
income in 2009 amounted to P=24.08 million. In 2009, the investment in common shares of
Swift Foods Inc. with a cost of P=16.42 million was sold by the Parent Company, realizing a
gain of P=1.57 million which was recognized in the consolidated statement of income.
The AFS investments are carried at fair value with cumulative changes in fair values
presented as a separate account in equity. The increase in value of AFS investments amounted
to P=4.58 million in 2009 and the decrease in value of AFS investments amounted to
P=93.59 million in 2008. These changes in fair values have been recognized and shown as
“Net valuation gain (loss) on AFS investments” in the consolidated statement of
comprehensive income.

Rollforward of net unrealized gain on AFS investments follows:
2009 2008
Beginning of year P=16,584 P=110,178
Less: Net unrealized gain (loss) 4,582 (75,167)
Reversal of increase in value of AFS
investment due to sale
–
(18,427)
End of year P=21,166 P=16,584
b. Investments in Associates - at equity
2009 2008
Acquisition costs:
Beginning of year P=637,046 P=327,679
Additions – 481,867
Derecognition (260,970) (172,500)
Reclassification (190,562) –
End of year 185,514 637,046
Accumulated impairment loss:
Beginning of year (43,208) (48,208)
Derecognition – 5,000
End of year (43,208) (43,208)
142,306 593,838
Accumulated equity in net (losses) earnings:
Beginning of year 80,117 (18,430)
Equity in net (losses) earnings for the year
(Note 23)
(10,635)
44,138
Derecognition 44,587 69,556
Dividends received (6,431) (15,147)
End of year 107,638 80,117
P=249,944 P=673,955
In 2008, the derecognition in investment acquisition costs, accumulated impairment loss and
accumulated equity in net losses pertain to Philtown’s investments at equity in RFM-SPPI and
PSI Tech Realty which was effected as a result of the deconsolidation of Philtown and its
subsidiaries from the Group. The additions to the acquisition costs in 2008 pertain to the
34.21% remaining investment of the Parent Company in Philtown.
In 2009, derecognition in investment acquisition costs pertains to Philtown’s investments at
equity which was derecognized as an associate due to the Parent Company’s declaration of its
Philtown common shares as property dividends on April 29, 2009.
11. Interests in Joint Venture URICI, a 50% joint venture of the Parent Company and Unilever Philippines, Inc. (ULP), is
engaged in manufacturing, distributing, marketing, selling, importing, exporting and dealing in ice
cream, ice cream desserts and ice cream novelties and similar food products. Based on the buy-
out formula as stipulated in the shareholders’ agreement between the Parent Company and ULP,
the estimated value of the Parent Company’s 50% ownership interest in URICI amounted to
P=1,135.15 million and P=780.66 million as of December 31, 2009 and 2008, respectively.

Summarized financial information of URICI showing the Group’s 50% share follow:
2009 2008
Current assets P=512,574 P=432,372
Noncurrent assets 389,619 266,300
Current liabilities 760,521 561,886
Noncurrent liabilities 3,715 14,337
Revenue 1,854,221 1,465,199
Cost and expenses 1,632,989 773,266
Net income 154,131 82,158
12. Other �oncurrent Assets
2009 2008
Goodwill P=190,562 P=190,562
Receivable from Meralco - net of current portion
of P=7,789 in 2008 – 8,853
Other noncurrent assets 61,318 40,608
P=251,880 P=240,023
The balance of the receivable from the Meralco refund scheme as of December 31 follows:
2009 2008
Nominal amount of receivable P=9,496 P=18,995
Deferred interest income (539) (2,353)
8,957 16,642
Less current portion 8,957 7,789
P=– P=8,853
Interest income earned from Meralco refund amounted to P=1.81 million, P=2.64 million and
P=3.46 million in 2009, 2008 and 2007, respectively.
13. Bank Loans
This account represents the Group’s proportionate share in the unsecured short-term loans of
URICI from local banks and lending investors bearing effective annual interest rates within the
range of 4.0% to 9.0% in 2009 and 5.0% to 8.0% in 2008. Bank loans amounted to
P=244.00 million and P=239.00 million as of December 31, 2009 and 2008, respectively.
Interest expense amounted to P=11.39 million in 2009, P=12.62 million in 2008 and P=5.95 million in
2007. Interest payable as of December 31, 2009 and 2008 amounted to P=0.78 million and
P=1.29 million, respectively.
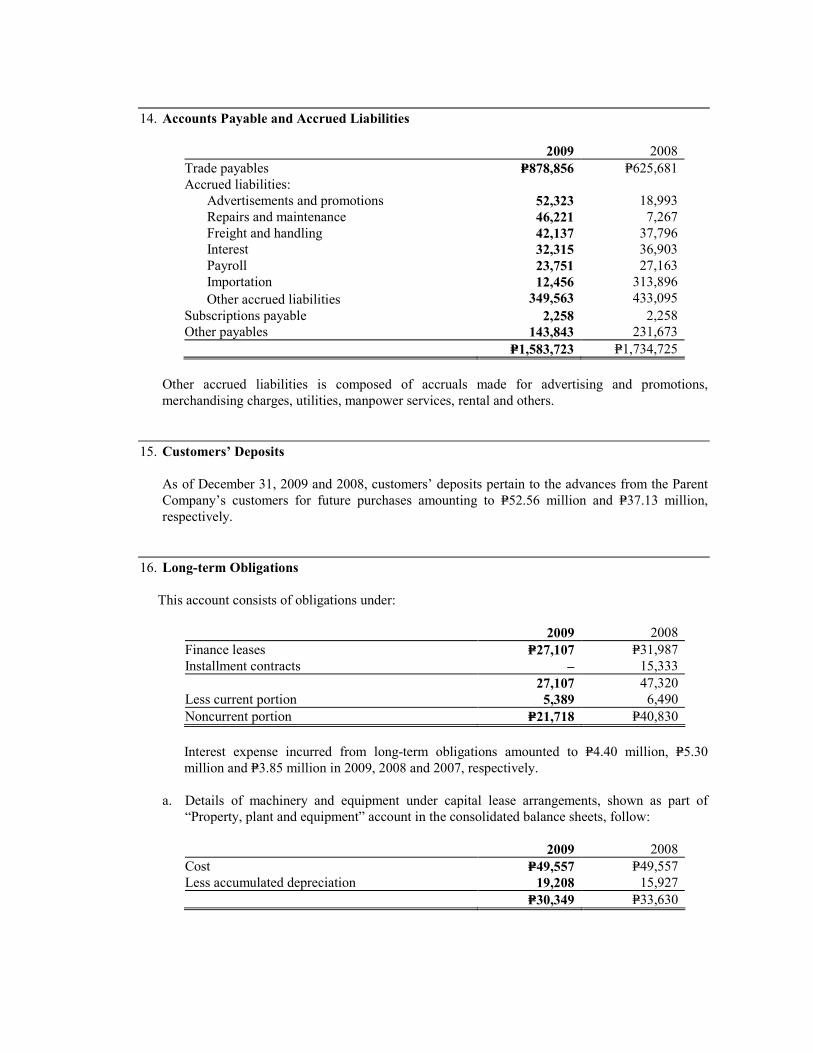
14. Accounts Payable and Accrued Liabilities
2009 2008
Trade payables P=878,856 P=625,681
Accrued liabilities:
Advertisements and promotions 52,323 18,993
Repairs and maintenance 46,221 7,267
Freight and handling 42,137 37,796
Interest 32,315 36,903
Payroll 23,751 27,163
Importation 12,456 313,896
Other accrued liabilities 349,563 433,095
Subscriptions payable 2,258 2,258
Other payables 143,843 231,673
P=1,583,723 P=1,734,725
Other accrued liabilities is composed of accruals made for advertising and promotions,
merchandising charges, utilities, manpower services, rental and others.
15. Customers’ Deposits
As of December 31, 2009 and 2008, customers’ deposits pertain to the advances from the Parent
Company’s customers for future purchases amounting to P=52.56 million and P=37.13 million,
respectively.
16. Long-term Obligations
This account consists of obligations under:
2009 2008
Finance leases P=27,107 P=31,987
Installment contracts – 15,333
27,107 47,320
Less current portion 5,389 6,490
Noncurrent portion P=21,718 P=40,830
Interest expense incurred from long-term obligations amounted to P=4.40 million, P=5.30
million and P=3.85 million in 2009, 2008 and 2007, respectively.
a. Details of machinery and equipment under capital lease arrangements, shown as part of
“Property, plant and equipment” account in the consolidated balance sheets, follow:
2009 2008
Cost P=49,557 P=49,557
Less accumulated depreciation 19,208 15,927
P=30,349 P=33,630

The aggregate future minimum payments under finance leases follow:
2009 2008
Within one year P=7,852 P=7,852
Over one year up to 2014 25,520 33,373
Total minimum lease obligations 33,372 41,225
Less amounts representing interest 6,265 9,238
Present value of minimum lease payments 27,107 31,987
Less current portion 5,389 4,879
Noncurrent portion P=21,718 P=27,108
b. Details of machinery and equipment under installment purchase arrangements, shown as part
of “Property, plant and equipment” account in the consolidated balance sheets, follow:
2009 2008
Cost P=19,250 P=19,250
Less accumulated depreciation 5,608 4,093
13,642 15,157
Less returned due to cancellation of installment
purchase arrangements 13,642 –
P=– P=15,157
On November 27, 2009, the Parent Company and Tetra Pak Philippines, Inc. have agreed that
effective October 31, 2009, the “Equipment Sale Agreement” entered into between the
companies will be cancelled and terminated. The cancellation of the contract for the
aforementioned machines shall extinguish the original agreement. Any claims prior to the
effectivity of the cancellation such as the monthly installments shall remain in force until fully
paid. The carrying value as of October 31, 2009 of the machinery and equipment related to
the terminated agreement amounted to P=13.64 million.
17. Provisions
2009 2008
At January 1 P=14,887 P=14,929
Additions 855 –
Paid during the year (287) (42)
At December 31 P=15,455 P=14,887
A provision was recognized for expected claims against the Parent Company arising from the
ordinary course of business. As of December 31, 2009, URICI has recognized a restructuring
provision amounting to P=0.86 million (see Note 29c).

18. Long-term Debts
The details of the long-term debts of the Parent Company, which consist of peso-denominated
promissory notes obtained from local banks, follow:
2009 2008
Loan from a local bank with interest rate based on
91-day PDST-F plus spread of 2.5%; payable in
equal quarterly installments of P=23,749 starting
March 2009
P=285,005
P=380,000
Loans from local banks with interest rate based
on 90-day PDST-F plus spread of 2.5%, with
principal payments due as follows:
- payable in full in October 2012; 224,020 225,149
- payable in equal quarterly installments
amounting to P=7,500 starting October 2008;
112,500
142,500
- payable in equal quarterly installments of
P=6,315 starting January 2010;
75,780
–
- payable in equal quarterly installements of
P=6,250 starting January 2009;
75,000
100,000
- payable in equal quarterly installments
amounting to P=4,000 starting
February 2009;
64,000
80,000
- payable in equal quarterly installments of
P=4,500 starting January 2010;
54,000
54,000
- payable in equal quarterly installments of
P=1,920 starting January 2010;
23,000
23,000
- payable in equal quarterly installments of
P=1,000 starting in March 2009;
16,000
20,000
- payable in equal quarterly installments of
P=167starting January 2010; and
2,000
2,000
- payable in equal quarterly installments of
P=100 starting January 2010
1,200
1,200
Loans from a local bank with interest rate based on
91-day T-bill plus spread of 2.5% with principal
payments due as follows:
- payable in equal quarterly installments of
P=11,582 starting September 2006; and 34,747 81,076
- payable in equal quarterly installments of
P=7,671 starting October 2006 30,682 61,365
Loans from a local bank with interest rate based on
30-day PDST-F plus spread of 2.5% with
principal payments due as follows:
- payable in 16 equal quarterly installments of
P=3,417 to starting January 2007; 13,669 27,338
- payable in equal quarterly installments of
P=6,231; and – 18,692
(Forward)

2009 2008
- payable in equal quarterly installments of
P=1,500 starting February 2006 with
the remaining balance paid in lumpsum in
January 2009
P=–
P=9,685
Loan from a local bank for car financing with
interest rate of 11.67%; payable in 36 monthly
amortizations starting June 2007 206 584
1,011,809 1,226,589
Less current portion 375,966 289,430
Noncurrent portion P=635,843 P=937,159
In accordance with the loan agreements, the Parent Company is restricted from performing certain
corporate acts without the prior consent or approval of the creditors, the more significant of which
relate to entering into merger or consolidation, entering into guaranty or surety of obligation and
acquiring treasury stock. The Parent Company is also required to maintain certain financial ratios
(based on the consolidated financial statements). As of December 31, 2009 and 2008, the Parent
Company is in compliance with the terms and conditions of the loan agreements with the banks.
The Parent Company, as “Mortgagor”, and a local bank “as Trustee”, based on the loan covenants
with the local banks, have a Collateral Trust Agreement (CTA) providing a collateral pool, which
includes certain property, plant and equipment of the Group for its long-term and short-term
borrowings (see Note 9).
The Parent Company (Mortgagor/Borrower) and a local bank (Trustee) entered into a Mortgage
Trust Indenture (MTI) providing a collateral pool for the Parent Company’s obligations consisting
of a parcel of land and building (warehouse). A total of P=211.05 million and P=143.62 million
loans were secured by the MTI as of December 31, 2009 and 2008, respectively. Total fair market
value of the collateral pool as of December 31, 2009 and 2008 amounted to P=2,786.07 million and
P=2,128.68 million, respectively.
Interest expense incurred from the long-term debts amounted to P=146.22 million, P=127.85 million
and P=96.09 million in 2009, 2008 and 2007, respectively.
The Trustee’s annual report as of December 31, 2009 and 2008 covers the following:
2009 2008
Fair market value of collateral pool P=2,786,066 P=2,128,667
Outstanding loan secured by the CTA 1,560,257 1,109,263
Remaining loanable amount 1,340,355 20,095
On August 27, 2009, the Parent Company entered into a three-year pay-fixed, receive-floating
interest rate swap contract to mitigate the interest rate fluctuation risk on financing its peso-
denominated loan from a local bank amounting to P=380.00 million. Under the swap, the Parent
Company will receive quarterly interest of three-month PDST-F plus 250 basis points, and will
pay 7.92% per annum on the principal balance amortizing based on the loan payment’s schedule
starting from October 5, 2009. The interest rate swap effectively fixed the floating rate of the
said loan over the duration of the agreement at 7.92% per annum. The notional amount of the
interest rate swap as of December 31, 2009 amounted to P=380.00 million.
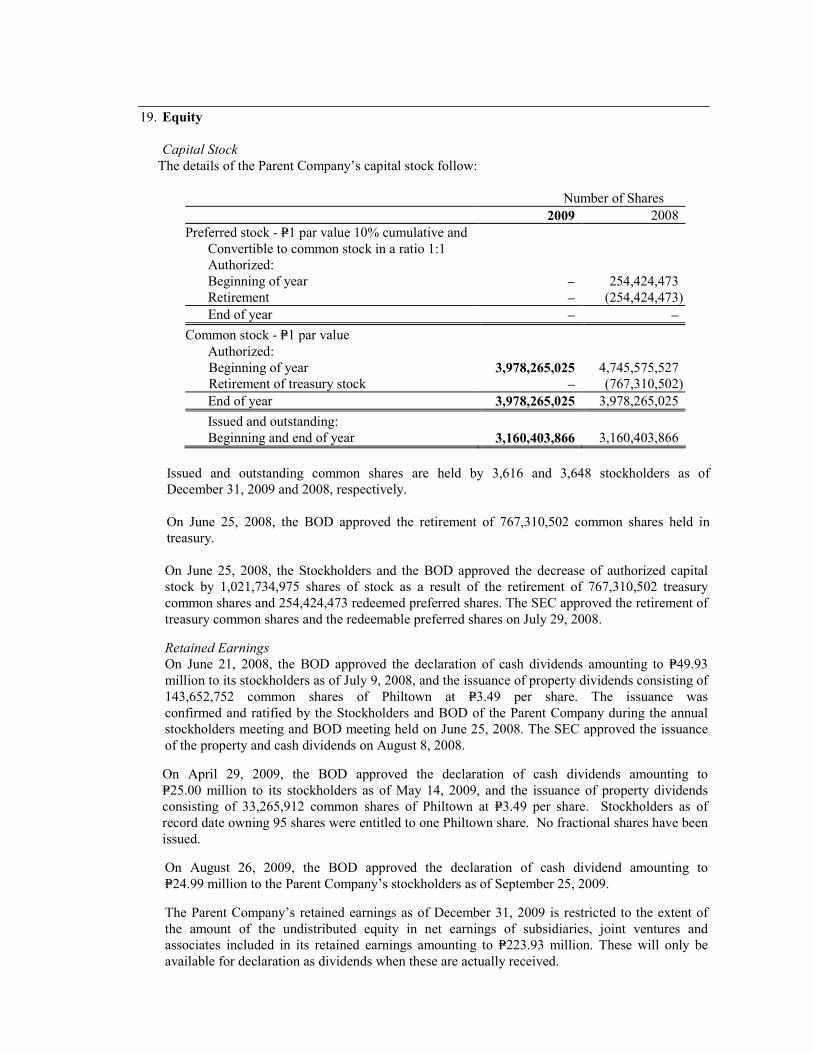
19. Equity
Capital Stock
The details of the Parent Company’s capital stock follow:
Number of Shares
2009 2008
Preferred stock - P=1 par value 10% cumulative and
Convertible to common stock in a ratio 1:1
Authorized:
Beginning of year – 254,424,473
Retirement – (254,424,473)
End of year – –
Common stock - P=1 par value
Authorized:
Beginning of year 3,978,265,025 4,745,575,527
Retirement of treasury stock – (767,310,502)
End of year 3,978,265,025 3,978,265,025
Issued and outstanding:
Beginning and end of year 3,160,403,866 3,160,403,866
Issued and outstanding common shares are held by 3,616 and 3,648 stockholders as of
December 31, 2009 and 2008, respectively.
On June 25, 2008, the BOD approved the retirement of 767,310,502 common shares held in
treasury.
On June 25, 2008, the Stockholders and the BOD approved the decrease of authorized capital
stock by 1,021,734,975 shares of stock as a result of the retirement of 767,310,502 treasury
common shares and 254,424,473 redeemed preferred shares. The SEC approved the retirement of
treasury common shares and the redeemable preferred shares on July 29, 2008. Retained Earnings
On June 21, 2008, the BOD approved the declaration of cash dividends amounting to P=49.93
million to its stockholders as of July 9, 2008, and the issuance of property dividends consisting of
143,652,752 common shares of Philtown at P=3.49 per share. The issuance was
confirmed and ratified by the Stockholders and BOD of the Parent Company during the annual
stockholders meeting and BOD meeting held on June 25, 2008. The SEC approved the issuance
of the property and cash dividends on August 8, 2008.
On April 29, 2009, the BOD approved the declaration of cash dividends amounting to
P=25.00 million to its stockholders as of May 14, 2009, and the issuance of property dividends
consisting of 33,265,912 common shares of Philtown at P=3.49 per share. Stockholders as of
record date owning 95 shares were entitled to one Philtown share. No fractional shares have been
issued.
On August 26, 2009, the BOD approved the declaration of cash dividend amounting to
P=24.99 million to the Parent Company’s stockholders as of September 25, 2009. The Parent Company’s retained earnings as of December 31, 2009 is restricted to the extent of
the amount of the undistributed equity in net earnings of subsidiaries, joint ventures and
associates included in its retained earnings amounting to P=223.93 million. These will only be
available for declaration as dividends when these are actually received.
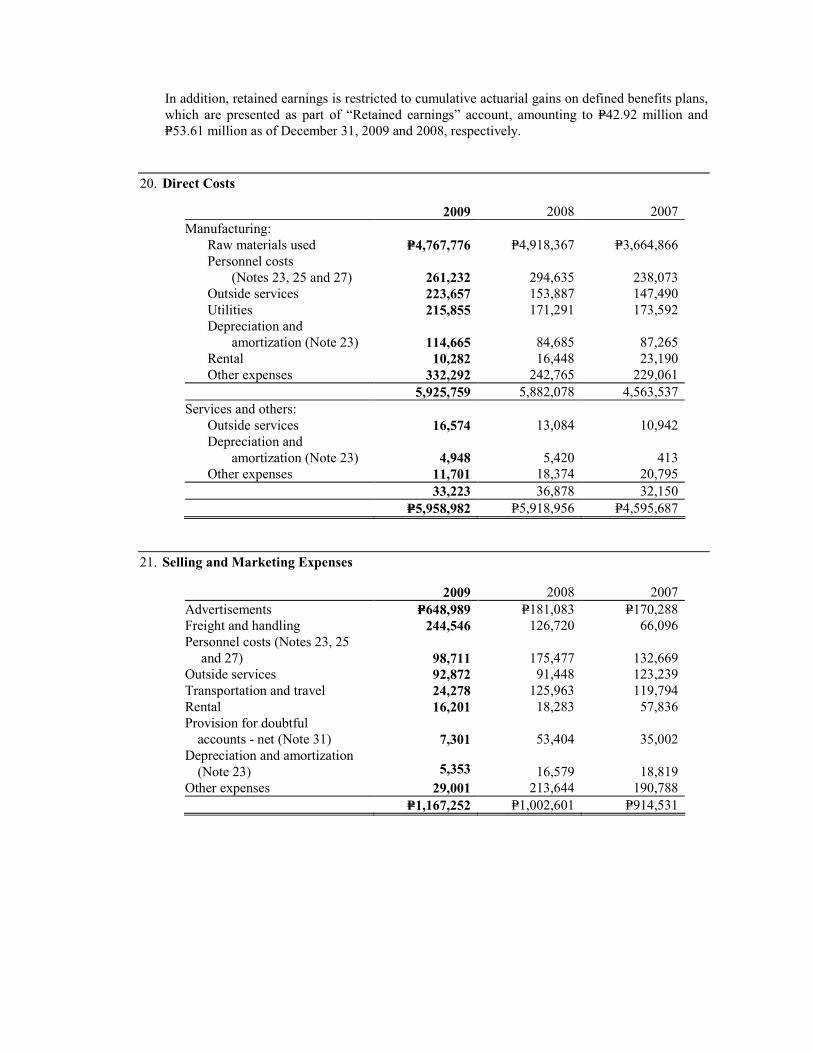
In addition, retained earnings is restricted to cumulative actuarial gains on defined benefits plans,
which are presented as part of “Retained earnings” account, amounting to P=42.92 million and
P=53.61 million as of December 31, 2009 and 2008, respectively.
20. Direct Costs
2009 2008 2007
Manufacturing:
Raw materials used P=4,767,776 P=4,918,367 P=3,664,866
Personnel costs
(Notes 23, 25 and 27) 261,232 294,635
238,073
Outside services 223,657 153,887 147,490
Utilities 215,855 171,291 173,592
Depreciation and
amortization (Note 23)
114,665
84,685
87,265
Rental 10,282 16,448 23,190
Other expenses 332,292 242,765 229,061
5,925,759 5,882,078 4,563,537
Services and others:
Outside services 16,574 13,084 10,942
Depreciation and
amortization (Note 23) 4,948 5,420
413
Other expenses 11,701 18,374 20,795
33,223 36,878 32,150
P=5,958,982 P=5,918,956 P=4,595,687
21. Selling and Marketing Expenses
2009 2008 2007
Advertisements P=648,989 P=181,083 P=170,288
Freight and handling 244,546 126,720 66,096
Personnel costs (Notes 23, 25
and 27)
98,711
175,477
132,669
Outside services 92,872 91,448 123,239
Transportation and travel 24,278 125,963 119,794
Rental 16,201 18,283 57,836
Provision for doubtful
accounts - net (Note 31)
7,301
53,404
35,002
Depreciation and amortization
(Note 23)
5,353
16,579
18,819
Other expenses 29,001 213,644 190,788
P=1,167,252 P=1,002,601 P=914,531
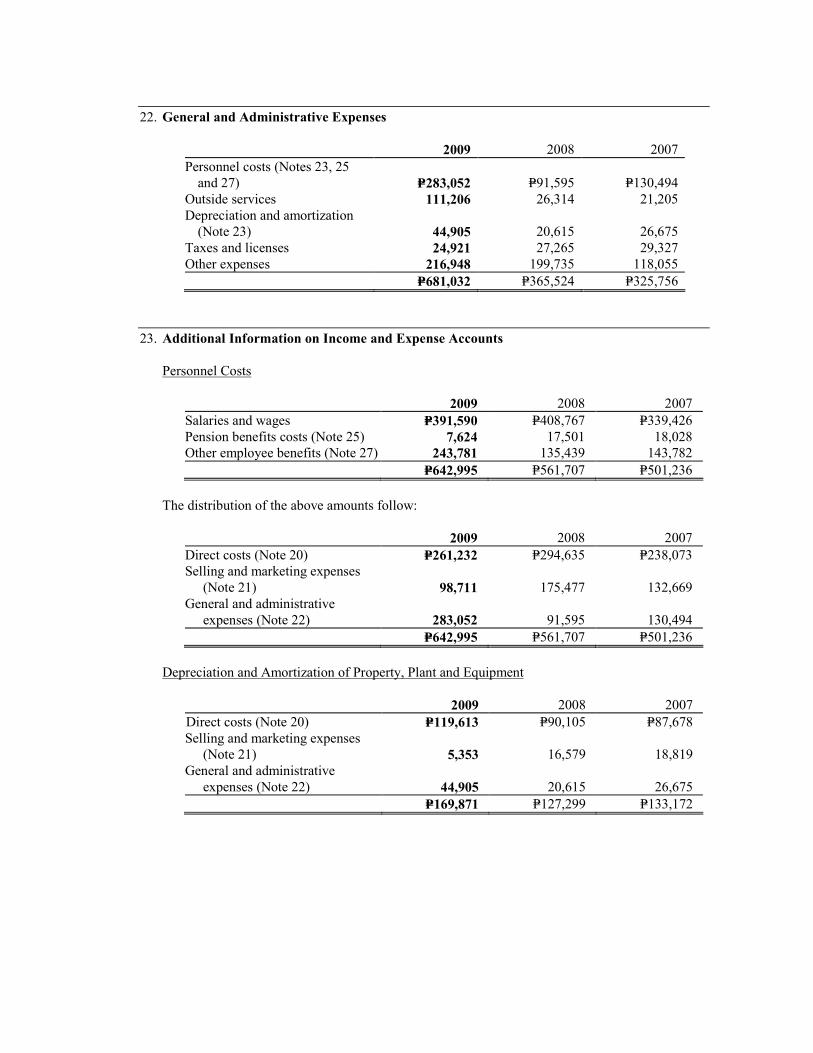
22. General and Administrative Expenses
2009 2008 2007
Personnel costs (Notes 23, 25
and 27) P=283,052 P=91,595 P=130,494
Outside services 111,206 26,314 21,205
Depreciation and amortization
(Note 23)
44,905
20,615
26,675
Taxes and licenses 24,921 27,265 29,327
Other expenses 216,948 199,735 118,055
P=681,032 P=365,524 P=325,756
23. Additional Information on Income and Expense Accounts
Personnel Costs
2009 2008 2007
Salaries and wages P=391,590 P=408,767 P=339,426
Pension benefits costs (Note 25) 7,624 17,501 18,028
Other employee benefits (Note 27) 243,781 135,439 143,782
P=642,995 P=561,707 P=501,236
The distribution of the above amounts follow:
2009 2008 2007
Direct costs (Note 20) P=261,232 P=294,635 P=238,073
Selling and marketing expenses
(Note 21) 98,711 175,477 132,669
General and administrative
expenses (Note 22) 283,052 91,595 130,494
P=642,995 P=561,707 P=501,236
Depreciation and Amortization of Property, Plant and Equipment
2009 2008 2007
Direct costs (Note 20) P=119,613 P=90,105 P=87,678
Selling and marketing expenses
(Note 21) 5,353 16,579 18,819
General and administrative
expenses (Note 22) 44,905 20,615 26,675
P=169,871 P=127,299 P=133,172
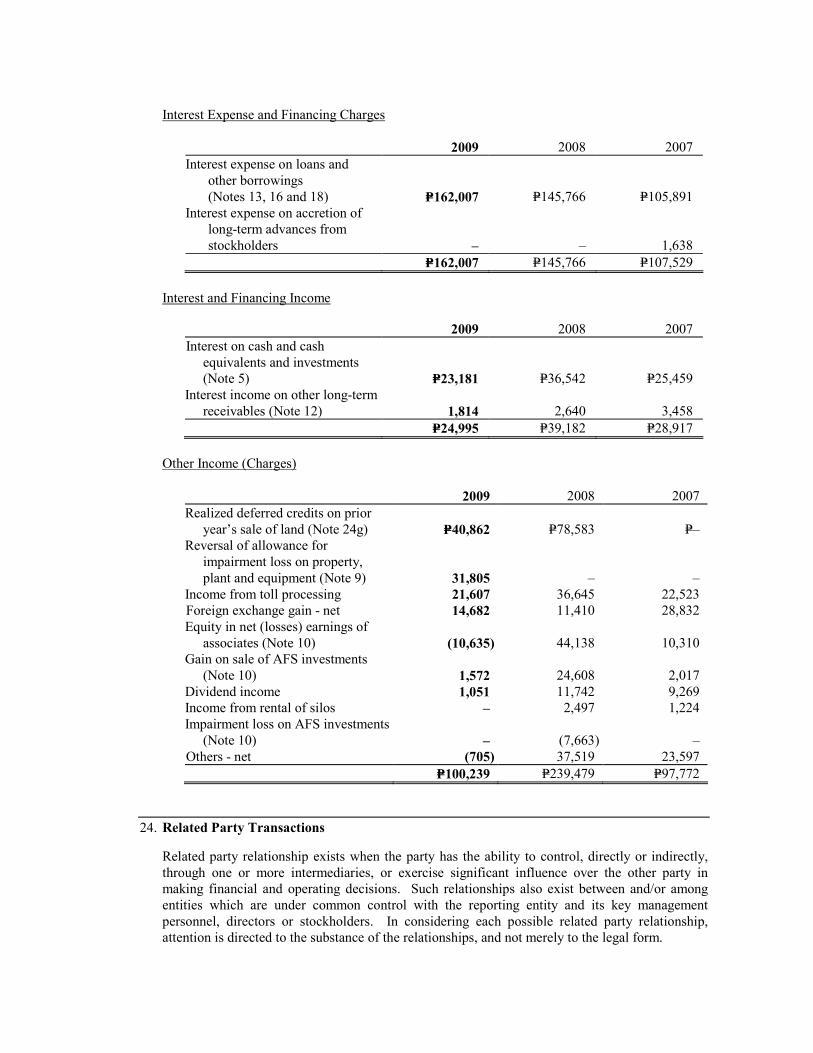
Interest Expense and Financing Charges
2009 2008 2007
Interest expense on loans and
other borrowings
(Notes 13, 16 and 18)
P=162,007
P=145,766
P=105,891
Interest expense on accretion of
long-term advances from
stockholders
– –
1,638
P=162,007 P=145,766 P=107,529
Interest and Financing Income
2009 2008 2007
Interest on cash and cash
equivalents and investments
(Note 5) P=23,181 P=36,542 P=25,459
Interest income on other long-term
receivables (Note 12) 1,814 2,640 3,458
P=24,995 P=39,182 P=28,917
Other Income (Charges)
2009 2008 2007
Realized deferred credits on prior
year’s sale of land (Note 24g) P=40,862 P=78,583 P=–
Reversal of allowance for
impairment loss on property,
plant and equipment (Note 9) 31,805 – –
Income from toll processing 21,607 36,645 22,523
Foreign exchange gain - net 14,682 11,410 28,832
Equity in net (losses) earnings of
associates (Note 10) (10,635) 44,138 10,310
Gain on sale of AFS investments
(Note 10) 1,572 24,608 2,017
Dividend income 1,051 11,742 9,269
Income from rental of silos – 2,497 1,224
Impairment loss on AFS investments
(Note 10) – (7,663) –
Others - net (705) 37,519 23,597
P=100,239 P=239,479 P=97,772
24. Related Party Transactions
Related party relationship exists when the party has the ability to control, directly or indirectly,
through one or more intermediaries, or exercise significant influence over the other party in
making financial and operating decisions. Such relationships also exist between and/or among
entities which are under common control with the reporting entity and its key management
personnel, directors or stockholders. In considering each possible related party relationship,
attention is directed to the substance of the relationships, and not merely to the legal form.

Significant related party transactions are as follows: Transactions within the Group
a. Sales and purchases of products and services to/from subsidiaries:
Sales Purchases
2009 2008 2007 2009 2008 2007
Parent Company P=130,914 P=122,951 P=83,011 P=272,995 P=171,208 P=173,296
ICC 234,691 163,231 149,989 130,914 122,951 83,011
RLC 38,304 7,977 23,307 – – –
The sales and purchases within the Group are subject to normal terms and conditions.
b. The Parent Company entered into a management agreement with ICC under which the Parent
Company shall receive from ICC a monthly fee of P=0.30 million from January 1, 2009. On
October 1, 2009, the monthly fee increased from P=0.30 million to P=1.00 million. Total
service income amounted to P=5.70 million in 2009.
In addition, ICC leases production and warehouse from the Parent Company for its
manufacturing operations and warehousing of its raw materials and finished goods. Rental
income amounted to P=11.90 million, P=3.83 million and P=4.20 million in 2009, 2008 and 2007,
respectively. Net receivable from ICC amounted to P=12.55 million and P=25.29 million,
included under the “Trade receivables” account, as of December 31, 2009 and 2008,
respectively (see Note 6).
c. The Parent Company utilizes RLC for its lighterage requirements. Service fee to RLC
amounted to P=38.30 million in 2009, P=26.86 million in 2008 and P=23.31 million in 2007.
Accounts payable amounted toP=7.33 million and P=7.25 million as of December 31, 2009 and
2008, respectively.
d. Availments/extensions of both interest-bearing and noninterest-bearing cash advances mainly
for working capital purposes and investment activities from/to subsidiaries and other related
parties with no fixed repayment terms. Advances to a subsidiary are subject to annual interest
of 9% on the monthly outstanding balance. Total interest earned by the Parent Company
amounted to P=40.20 million in 2009, P=12.57 million in 2008 and P=8.00 million in 2007.
e. Distribution services provided by the Parent Company to URICI, a joint venture entity, for the
export of frozen dairy dessert/mellorine - URICI pays service fees equivalent to 7% of the
total net sales value of goods distributed. Service fees amounted to P=9.85 million,
P=6.60 million and P=5.89 million for the years ended December 31, 2009, 2008 and 2007,
respectively.
f. Management services of the Parent Company to RIBI, a majority-owned subsidiary, wherein
RIBI pays the Parent Company a yearly management fee equivalent to 5% of income before
income tax or a fixed amount based on the level of net sales, whichever is higher.
Management fee for the years ended December 31, 2009, 2008 and 2007 amounted to
P=0.50 million each year.
g. Sale of land to Philtown in 2002 resulting to a deferred gain amounting to P=119.45 million
was included under “Deferred Credits” account in the balance sheets. In 2008, the Parent
Company realized P=78.58 million of the deferred credits and included it under the “Realized
deferred credits on prior year’s sale of land” account, resulting from the declaration of its
65.79% ownership in Philtown as property dividends to its stockholders. This resulted to the

loss of control over Philtown but resulted to significant influence. In 2009, the Group further
reduced its ownership in Philtown to 18.97% through declaration of part of that investment as
property dividends to its stockholders, which resulted to the loss of significant influence in
Philtown and full realization of the deferred credits amounting to P=40.86 million in 2009.
Transactions with Other Related Parties
The Company has a lease agreement for office space with Invest Asia Corporation, an entity
under common control. The lease covers a one-year period, renewable every year at the option of
the Company. Lease expense amounted to P=2.88 million, P=2.62 million and P=2.48 million in
2009, 2008 and 2007, respectively.
Advances to other related parties under common control (shown as part of “Advances to related
parties” in Note 6) as of December 31, 2009 and 2008 consist of:
2009 2008
Philtown Properties, Inc. P=521,143 P=545,062
Invest Asia 20,988 5,011
Others - net of allowance for doubtful accounts of
P=22.35 million in 2009 and P=8.86 million in 2008 58,229 2,300
P=600,360 P=552,373
Noncurrent advances to related parties under common control as of December 31, 2009 and 2008
follow:
2009 2008
Asia Food Franchising Corporation P=662,066 P=662,066
Rolling Pin 135,724 135,724
Roman Pizza 31,403 31,403
RFM Development US 9,674 9,674
Others 10,046 10,931
848,913 849,798
Less allowance for doubtful accounts 848,913 849,798
P=– P=–
Advances from other related companies consist of:
2009 2008
Proportionate share in advances from
related parties P=83,288 P=46,662
Others 7,168 16,410
P=90,456 P=63,072
Compensation of key management personnel of the Group by benefit type follows:
2009 2008 2007
Salaries and other short-term
benefits
P=113,338
P=126,827
P=77,149
Proportionate share in share-
based compensation of
URICI
7,113
2,269
3,669
Pension benefits costs 6,785 6,751 6,751
P=127,236 P=135,847 P=87,569

25. Pension Benefits
The Parent Company, joint venture and certain subsidiaries and certain subsidiaries have funded,
noncontributory defined benefits pension plans (the Plans) covering substantially all permanent
employees.
As of December 31, 2009 and 2008, the present value of defined benefits obligations amounted to
P=238.29 million and P=71.13 million, respectively, and the fair value of the fund assets amounted
to P=230.44 million and P=172.88 million, respectively.
a. Pension Benefits Costs
The components of pension benefits costs recognized in the consolidated statements of
income for the years ended December 31 follow:
2009 2008 2007
Current service cost P=4,865 P=15,925 P=15,454
Interest cost on benefits obligation 14,445 19,442 17,723
Expected return on plan assets (11,686) (17,866) (15,149)
Pension benefits costs P=7,624 P=17,501 P=18,028
b. Net Pension Obligations
The details of the net pension obligations and the amounts recognized in the consolidated
balance sheets as of December 31, 2009 and 2008 follow:
2009 2008
Defined benefits obligations P=238,287 P=71,129
Fair value of plan assets (230,439) (172,882)
7,848 (101,753)
Unrecognized asset due to limit – 100,063
Net pension obligations P=7,848 P=1,690
Changes in the present value of the defined benefits obligations follow:
2009 2008
Defined benefits obligations, January 1 P=71,129 P=243,942
Current service cost 4,865 15,925
Interest cost on benefit obligation 14,445 19,442
Actuarial loss (gain) 153,017 (203,413)
Benefits paid (5,169) (2,192)
Derecognition – (2,575)
Defined benefits obligations, December 31 P=238,287 P=71,129
Changes in the fair value of plan assets follow: 2009 2008
Fair value of plan assets, January 1 P=172,882 P=168,213
Expected return on plan assets 11,686 17,866
Contributions 13,431 17,852
Benefits paid (5,169) (2,192)
Actuarial gain (loss) for the year 37,609 (28,857)
Fair value of plan assets, December 31 P=230,439 P=172,882

Categories of plan assets as a percentage of the fair value of total plan assets follow: 2009 2008
Investments in bonds and other financial instruments 62.19% 83.10%
Investment in real estate 20.00%
Cash and cash equivalents 17.34% 16.51%
Loans and other receivables 0.47% 0.39%
100.00% 100.00%
The overall expected return on the plan assets is determined based on the market prices prevailing
on that date applicable to the period over which the obligation is to be settled. As of
January 1, 2009 and 2008, the principal assumptions used in determining pension benefits costs
for the Group’s plan follow:
January 1
2009 2008
Discount rate per annum 11% to 29% 8%
Expected annual rate of return on plan assets 5% to 13% 9% to 11%
Future annual increase in salary 5% to 8% 7% to 8%
The latest actuarial valuation of the Group is as of December 31, 2009. The discount rate used in
determining the present value of defined benefits obligations as of December 31, 2009ranges
from 9.00% to 9.78%. Annual contribution to the retirement plan consists of a payment to cover
the current service cost for the year plus payment toward funding the actuarial accrued liability.
The Group’s expected contribution to the fund assets amounted to P=15.99 million in 2010.
The amounts for the current and previous periods of the fair value of the plan assets, the present
value of the defined benefits obligations and the experience adjustments, follow:
2009 2008 2007 2006 2005
Fair value of plan assets P=230,439 P=172,882 P=168,213 P=134,363 P=94,175
Defined benefits obligation (238,287) (71,129) (243,942) (212,891) (191,889)
Surplus (deficit) (7,848) 101,753 (75,729) (78,528) (97,714)
Experience adjustments on the
defined benefit obligation
(153,017)
(203,413)
69
5,998
(4,559)
Experience adjustments on plan
assets
37,609
(28,857)
(2,397)
9,660
(4,332)
26. Discontinued Operations
On June 25, 2008, the BOD approved the declaration and issuance of property dividends
consisting of 143,652,752 common shares, which represents 65.79% of the total common stock,
of Philtown. The issuance was confirmed and ratified by the BOD and the Stockholders of the
Parent Company during the BOD meeting and the annual stockholders’ meeting held on June 25,
2008. The SEC approved the issuance of the property dividends on July 9, 2008.
The Parent Company’s issuance of Philtown common stock as property dividends to its
stockholders was accounted for as a disposal and, accordingly, the Group accounted for the
operations of Philtown and its subsidiaries as discontinued operations under PFRS 5. In 2008, the
consolidated statements of income for the years ended December 31, 2007 and 2006 have been
restated to reflect the post-tax profit or loss of Philtown and its subsidiaries as a single amount on
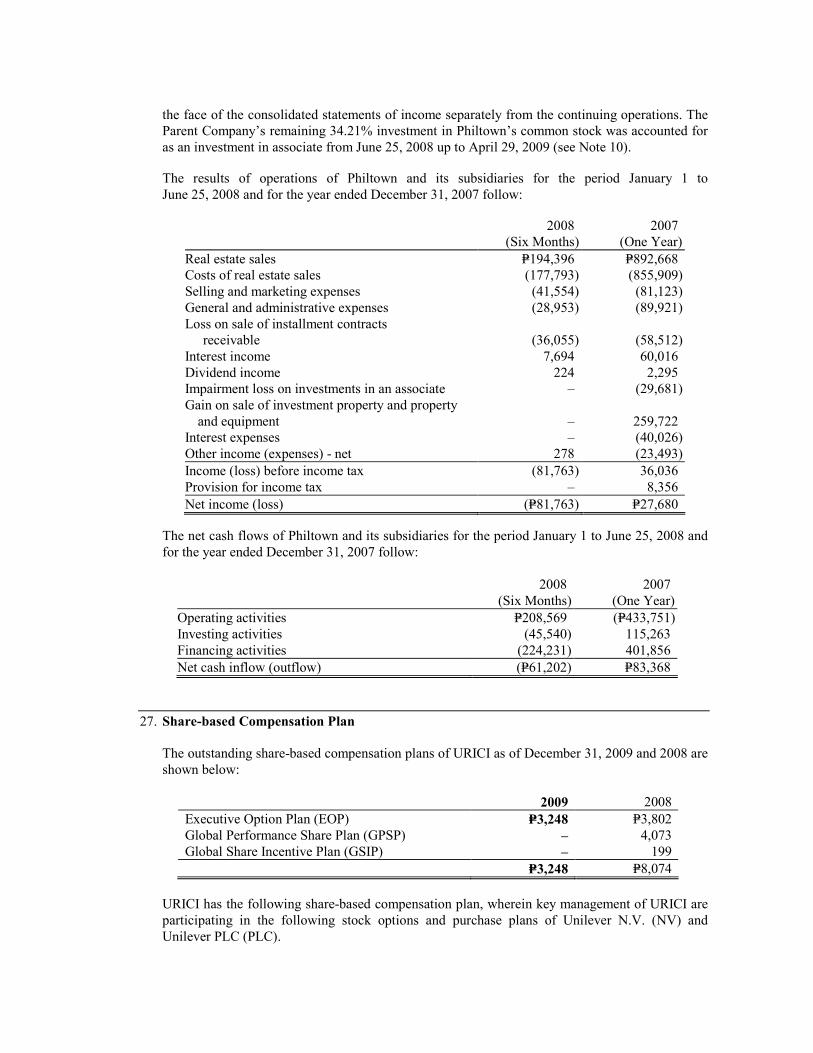
the face of the consolidated statements of income separately from the continuing operations. The
Parent Company’s remaining 34.21% investment in Philtown’s common stock was accounted for
as an investment in associate from June 25, 2008 up to April 29, 2009 (see Note 10).
The results of operations of Philtown and its subsidiaries for the period January 1 to
June 25, 2008 and for the year ended December 31, 2007 follow:
2008 2007
(Six Months) (One Year)
Real estate sales P=194,396 P=892,668
Costs of real estate sales (177,793) (855,909)
Selling and marketing expenses (41,554) (81,123)
General and administrative expenses (28,953) (89,921)
Loss on sale of installment contracts
receivable (36,055) (58,512)
Interest income 7,694 60,016
Dividend income 224 2,295
Impairment loss on investments in an associate – (29,681)
Gain on sale of investment property and property
and equipment – 259,722
Interest expenses – (40,026)
Other income (expenses) - net 278 (23,493)
Income (loss) before income tax (81,763) 36,036
Provision for income tax – 8,356
Net income (loss) (P=81,763) P=27,680
The net cash flows of Philtown and its subsidiaries for the period January 1 to June 25, 2008 and
for the year ended December 31, 2007 follow:
2008 2007
(Six Months) (One Year)
Operating activities P=208,569 (P=433,751)
Investing activities (45,540) 115,263
Financing activities (224,231) 401,856
Net cash inflow (outflow) (P=61,202) P=83,368
27. Share-based Compensation Plan
The outstanding share-based compensation plans of URICI as of December 31, 2009 and 2008 are
shown below:
2009 2008
Executive Option Plan (EOP) P=3,248 P=3,802
Global Performance Share Plan (GPSP) – 4,073
Global Share Incentive Plan (GSIP) – 199
P=3,248 P=8,074
URICI has the following share-based compensation plan, wherein key management of URICI are
participating in the following stock options and purchase plans of Unilever N.V. (NV) and
Unilever PLC (PLC).

GPSP
The GPSP was introduced in 2005. Under this plan, managers can be awarded conditional shares
which will vest three years later at a level between 0% and 150% (for middle management) or
200% (for higher executives) depending on the achievement of set targets for underlying sales
growth and free cash flow over the three-year performance period. The amount to be paid by
participants to obtain the shares at vesting is zero. Each reward of performance shares is
conditional and vests subject to performance conditions three years after the date of the award.
No new awards will subsequently be made under this plan as a new plan was approved by the
stockholders in 2008. The new plan is called the GSIP which integrates and replaces the GPSP,
making Unilever’s long-term arrangements simpler, easier to understand and supportive of the
Company’s strategic remuneration principles for its executives.
EOP
The plan was introduced in 2005 to reward key employees of URICI of NV shares for their
contribution to the enhancement of URICI’s longer term future and their commitment to URICI
over a sustained period. Under this plan, options are granted to employees of the group on a
discretionary basis. The grant is dependent on the performance of URICI and the individual
employee. The share options under this plan become exercisable after a three-year period from
the date of grant and have a maximum term of ten years.
The economic fair value of the share options awarded is calculated using an option pricing mode
(adjusted Black Scholes model) and the resulting cost is recognized as employee benefit cost over
the vesting period of the grant.
Since the introduction of the GPSP in 2005, it is Unilever’s intention to make no future grants
under this plan.
GSIP
Under the GSIP, annual awards of shares in NV and PLC are granted to executive directors along
with other senior employees. The actual number of shares received at vesting after three years
depends on the satisfaction of performance conditions linked to improvements in URICI’s
performance.
The vesting share will be conditional on the achievement of three distinct performance conditions
over the performance period. The performance period is a thee-year calendar period. These are:
(a) vesting of 40% of the shares in the award is based on a condition measuring URICI’s relative
total shareholder return; (b)vesting of a further 30% of the shares in the award is conditional on
average underlying sales growth performance over the three-year period; and (c) the vesting of the
final 30% of the shares in the award is conditional on cumulative ungeared free cash flow
performance which is the basic driver of returns URICI is able to generate to its stockholders.
Share Matching Plan (SMP)
The SMP enhances the alignment with stockholders’ interests and supports the retention of key
executives. In addition, the necessity to hold the shares for a minimum period of three years
supports the shareholding requirements.
The executive directors receive 25% of their annual incentive in the form of NV and PLC shares.
These are matched with an equivalent number of matching shares. The matching shares will vest
three years provided that the underlying shares have been retained during this period and the
executive director has not resigned or been dismissed at the end of the period.

There is no further performance conditions on the vesting of the matching shares because the
shares are directly linked to the annual incentive (which is itself subject to certain performance
conditions). In addition, during the three-year vesting period, the share price of NV and PLC will
be influenced by the performance of the Company. This, in turn, will affect the ultimate value of
the matching shares on vesting.
It has been agreed that NV and PLC shall charge URICI the cost of the options granted.
The summary of the status and changes on the GPSP, EOP, GSIP and SMP as of and for the years
ended December 31 follows:
GPSP 2009 2008
Unilever �V Shares Unilever NV Shares
�umber of
Shares
Weighted
Average
Exercise Price
Number of
Shares
Weighted
Average
Exercise Price
Outstanding at January 1 4,035 P=18.15 4,035 P=17.97
Vested (2,655) 17.41 – –
Lapsed (590) 19.06 – –
Outstanding at December 31 790 P=19.06 4,035 P=18.15
Fair value per share award during the year in
Euro/Peso (a) (b)
–
–
–
–
Fair value per share award during the year in Peso – – – – (a) Weighted average of share awards granted during the period.
(b) Estimated based on par achievement target.
EOP 2009 2008
Unilever �V Shares Unilever PLC Shares Unilever NV Shares Unilever PLC Shares
Weighted Weighted Weighted Weighted
�umber Average �umber Average Number Average Number Average
of Exercise of Exercise of Exercise of Exercise
Options Price Options Price Options Price Options Price
Outstanding at January 1 4,950 €18.20 4,860 £12.27 5,775 €18.18 5,670 £12.17
Exercised – – – – (825) €18.03 (810) £11.54
Outstanding at December 31 4,950 €18.20 4,860 £12.27 4,950 €18.20 4,860 £12.17
Exercisable at December 31 4,950 €18.20 4,860 £12.27 4,950 €18.20 4,860 £12.17
The fair value of options at grant date which were exercised in 2008 determined using the Black
Scholes model are: (a) Unilever NV, 825 shares in 2004 - P=265 (€3.81); and (b) Unilever PLC
shares; 810 shares in 2004 - P=413 (£3.96). Total cost of exercised options in 2008 which were transferred to URICI’s share premium
amounted to P=554. The exercise prices and remaining life of the EOP as of December 31, 2009 follow: Unilever NV Shares
Options Outstanding Options Exercisable
Number of Shares
Options Outstanding
Weighted Average
Remaining
Contractual Life
Weighted Average
Exercise Price
Number of Share
Options Exercisable
Weighted
Average
Exercise Price
2,475 3 years €18.37 2,475 €18.37
2,475 4 years €18.03 2,475 €18.03
4,950 4,950

Unilever PLC Shares
Options Outstanding Options Exercisable
Number of Shares
Options Outstanding
Weighted Average
Remaining
Contractual Life
Weighted Average
Exercise Price
Number of Share
Options Exercisable
Weighted
Average
Exercise Price
2,430 3 years £13.00 2,430 £13.00
2,430 4 years £11.54 2,430 £11.54
4,860 4,860
GSIP 2009 2008
Unilever �V Shares Unilever NV Shares
�umber of
Shares
Weighted
Average
Exercise Price
Number of
Shares
Weighted Average
Exercise Price
Outstanding at January 1 480 P=19.11 – P=–
Grant 820 13.02 480 19.11
Outstanding at December 31 1,300 P=15.27 480 P=19.11
Fair value per share award during the year in
Euro/Pound (a) (b)
13.02
–
19.11
–
Fair value per share award during the year in Peso 850 – 1,245 – (a) Weighted average of share awards granted during the period.
(b) Estimated based on par achievement target.
SMP 2009 2008
Unilever �V Shares
Unilever PLC
Shares
Unilever NV Shares
Unilever PLC
Shares
�umber
of
Shares
Weighted
Average
Exercise
Price
�umber
of
Shares
Weighted
Average
Exercise
Price
Number
of
Shares
Weighted
Average
Exercise
Price
Number
of
Shares
Weighted
Average
Exercise
Price
Outstanding at January 1 – – 670 €20.07 686 £13.55
Grant – – 68 21.30 67 16.72
Vested – – (738) 20.18 (753) 13.83
Outstanding at December 31 – – – –
Fair value per share award
during the year in
Euro/Pound(a)
€–
£–
€21.30
£16.72
Fair value per share award
during the year in Peso
P=–
P=–
P=1,353
P=1,366 (a) Weighted average of share awards granted during the period.
28. Income Taxes a. Summary of deferred income taxes:
2009 2008
Group P=22,283 P=15,254
Joint ventures 58,872 43,783
Deferred income tax assets - net P=81,155 P=59,037
Deferred income tax liability on revaluation
increment on land (Note 9) P=214,775
P=214,775
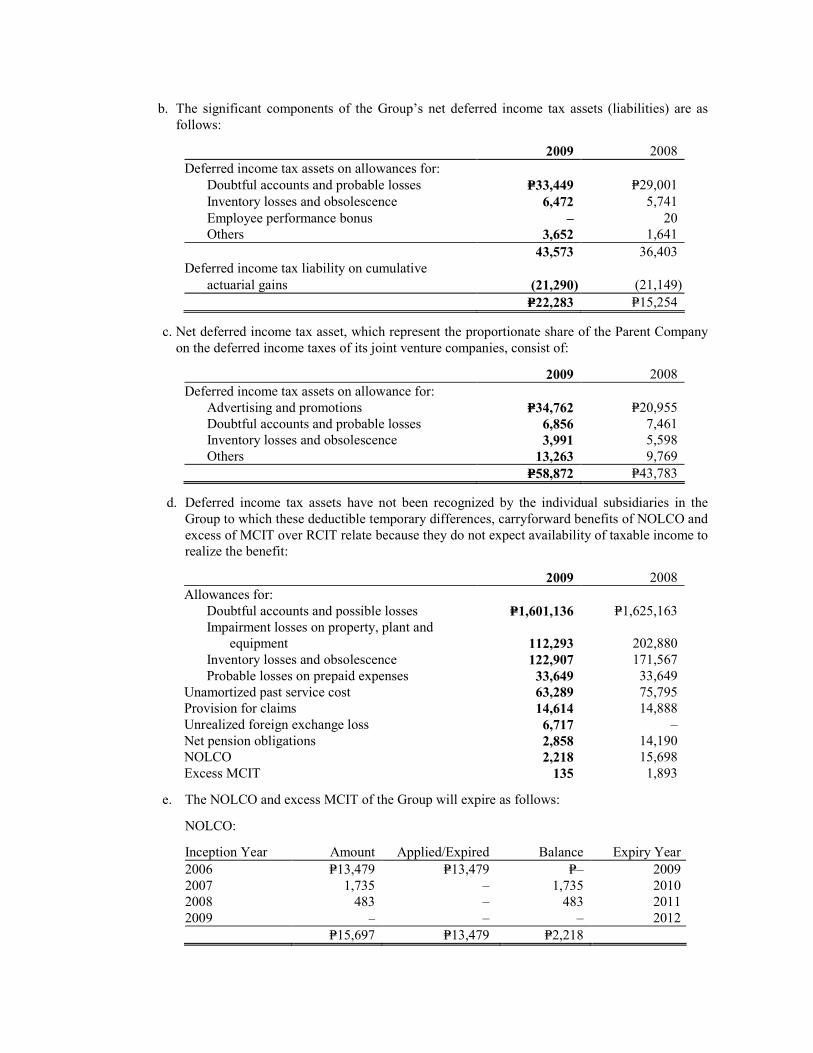
b. The significant components of the Group’s net deferred income tax assets (liabilities) are as
follows: 2009 2008
Deferred income tax assets on allowances for:
Doubtful accounts and probable losses P=33,449 P=29,001
Inventory losses and obsolescence 6,472 5,741
Employee performance bonus – 20
Others 3,652 1,641
43,573 36,403
Deferred income tax liability on cumulative
actuarial gains (21,290) (21,149)
P=22,283 P=15,254
c. Net deferred income tax asset, which represent the proportionate share of the Parent Company
on the deferred income taxes of its joint venture companies, consist of: 2009 2008
Deferred income tax assets on allowance for:
Advertising and promotions P=34,762 P=20,955
Doubtful accounts and probable losses 6,856 7,461
Inventory losses and obsolescence 3,991 5,598
Others 13,263 9,769
P=58,872 P=43,783
d. Deferred income tax assets have not been recognized by the individual subsidiaries in the
Group to which these deductible temporary differences, carryforward benefits of NOLCO and
excess of MCIT over RCIT relate because they do not expect availability of taxable income to
realize the benefit:
2009 2008
Allowances for:
Doubtful accounts and possible losses P=1,601,136 P=1,625,163
Impairment losses on property, plant and
equipment 112,293 202,880
Inventory losses and obsolescence 122,907 171,567
Probable losses on prepaid expenses 33,649 33,649
Unamortized past service cost 63,289 75,795
Provision for claims 14,614 14,888
Unrealized foreign exchange loss 6,717 –
Net pension obligations 2,858 14,190
NOLCO 2,218 15,698
Excess MCIT 135 1,893
e. The NOLCO and excess MCIT of the Group will expire as follows:
NOLCO:
Inception Year Amount Applied/Expired Balance Expiry Year
2006 P=13,479 P=13,479 P=– 2009
2007 1,735 – 1,735 2010
2008 483 – 483 2011
2009 – – – 2012
P=15,697 P=13,479 P=2,218
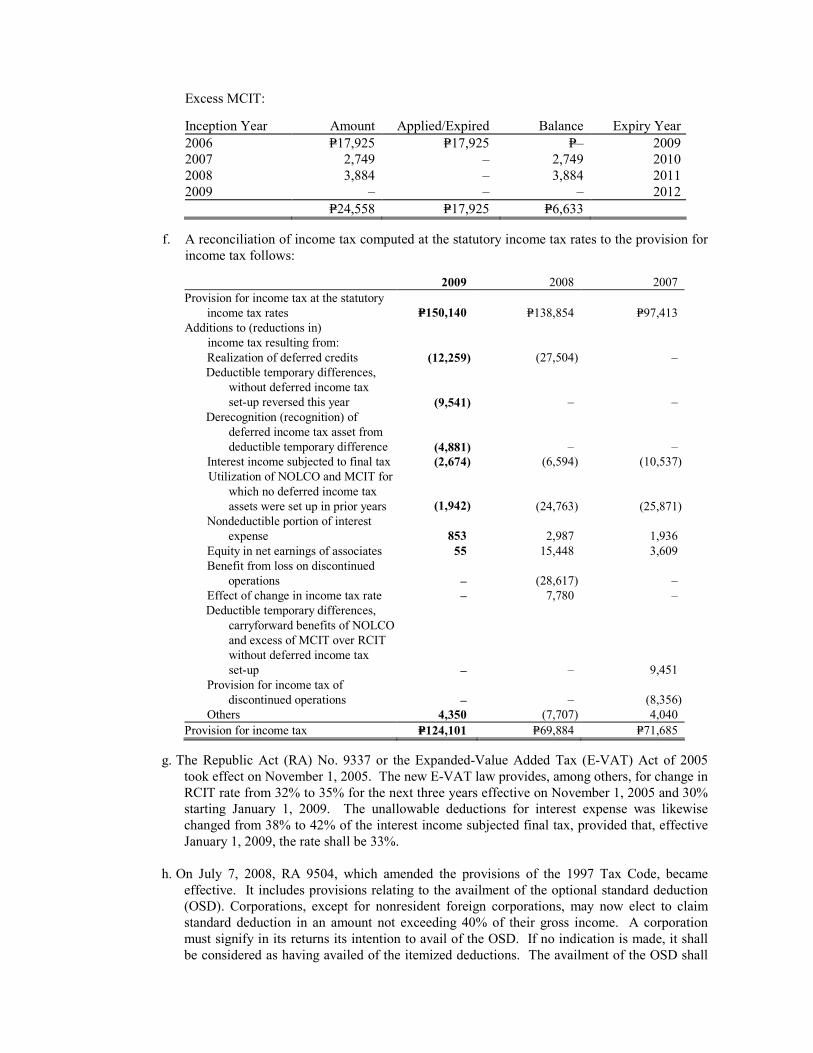
Excess MCIT:
Inception Year Amount Applied/Expired Balance Expiry Year
2006 P=17,925 P=17,925 P=– 2009
2007 2,749 – 2,749 2010
2008 3,884 – 3,884 2011
2009 – – – 2012
P=24,558 P=17,925 P=6,633 f. A reconciliation of income tax computed at the statutory income tax rates to the provision for
income tax follows:
2009 2008 2007
Provision for income tax at the statutory
income tax rates
P=150,140
P=138,854
P=97,413
Additions to (reductions in)
income tax resulting from:
Realization of deferred credits (12,259) (27,504) –
Deductible temporary differences,
without deferred income tax
set-up reversed this year (9,541)
–
–
Derecognition (recognition) of
deferred income tax asset from
deductible temporary difference (4,881) –
–
Interest income subjected to final tax (2,674) (6,594) (10,537)
Utilization of NOLCO and MCIT for
which no deferred income tax
assets were set up in prior years
(1,942)
(24,763)
(25,871)
Nondeductible portion of interest
expense
853
2,987
1,936
Equity in net earnings of associates 55 15,448 3,609
Benefit from loss on discontinued
operations – (28,617)
–
Effect of change in income tax rate – 7,780 –
Deductible temporary differences,
carryforward benefits of NOLCO
and excess of MCIT over RCIT
without deferred income tax
set-up –
–
9,451
Provision for income tax of
discontinued operations – –
(8,356)
Others 4,350 (7,707) 4,040
Provision for income tax P=124,101 P=69,884 P=71,685
g. The Republic Act (RA) No. 9337 or the Expanded-Value Added Tax (E-VAT) Act of 2005
took effect on November 1, 2005. The new E-VAT law provides, among others, for change in
RCIT rate from 32% to 35% for the next three years effective on November 1, 2005 and 30%
starting January 1, 2009. The unallowable deductions for interest expense was likewise
changed from 38% to 42% of the interest income subjected final tax, provided that, effective
January 1, 2009, the rate shall be 33%.
h. On July 7, 2008, RA 9504, which amended the provisions of the 1997 Tax Code, became
effective. It includes provisions relating to the availment of the optional standard deduction
(OSD). Corporations, except for nonresident foreign corporations, may now elect to claim
standard deduction in an amount not exceeding 40% of their gross income. A corporation
must signify in its returns its intention to avail of the OSD. If no indication is made, it shall
be considered as having availed of the itemized deductions. The availment of the OSD shall

be irrevocable for the taxable year for which the return is made. On September 24, 2008, the
BIR issued Revenue Regulation (RR) 10-2008 for the implementing guidelines of the law.
On February 18, 2010, the BIR issued RR 2-2010 for the Amendment to Sections 6 and 7 of
RR No. 16-2008 with respect to the determination of the OSD of general professional
partnerships and the partners thereof, as well as the manner and period for making the election
to claim OSD in the income tax returns. Further, on February 26, 2010, the BIR issued
Revenue Memorandum Circular No. 16-2010 which clarifies the disclosure of election to use
the OSD for taxable year 2009.
The Group opted not to avail of the OSD in 2009.
29. Commitments and Contingencies
a. As discussed in Note 16, the Group entered into finance leases and installment contract
arrangements covering various machineries and equipment with a third party supplier.
b. The Parent Company entered into a Trademark License Agreement with Sunkist Growers,
Inc. (Sunkist) whereby the latter granted the Parent Company exclusive right to use certain of
Sunkist’s trademark and trade dress in connection with the manufacture, marketing,
distribution and sale of non-carbonated beverages. The Parent Company agreed to pay a
fixed amount of royalty, as stipulated in the Agreement, every year. The Agreement will
cease upon mutual consent of the Parent Company and Sunkist. Unpaid royalty amounted to
P=6.04 million and P=5.52 million as of December 31, 2009 and 2008, respectively. Royalty
expense amounted to P=10.25 million, P=9.87 million and P=9.39 million in 2009, 2008 and
2007, respectively.
c. The Group is currently involved in certain legal, contractual and regulatory matters that
require the recognition of provisions for related probable claims against the Group.
Management and its legal counsel believe the said cases will be resolved in favor of the
Group and in the event that any of those cases will have an adverse ruling against the Group,
it will not have a material effect on its consolidated financial statements. The disclosure of
additional details beyond the present disclosures may seriously prejudice the Group’s position
and negotiation strategies with respect to these matters. Thus, as allowed by PAS 37,
Provisions, Contingent Liabilities and Contingent Assets, only a general description is
provided.
30. Basic/Diluted Earnings (Loss) Per Share
2009 2008 2007
a. Net income from continuing
operations P=365,457 P=326,843 P=206,638
b. Net income (loss) from discontinued
operations (Note 26) – (81,763) 27,680
c. Weighted average number of
common shares outstanding 3,160,403,866 3,160,403,866 3,156,052,263
d. Basic/diluted earnings (loss) per share
- Continuing operations (a/c)
- Discontinued operations (b/c)
P=0.116
–
P=0.103
(0.026)
P=0.065
0.009
Total P=0.116 P=0.077 P=0.074
The Group does not have potentially dilutive common shares as of December 31, 2009, 2008 and
2007. Therefore, the basic and dilutive earnings per share are the same as of those dates.
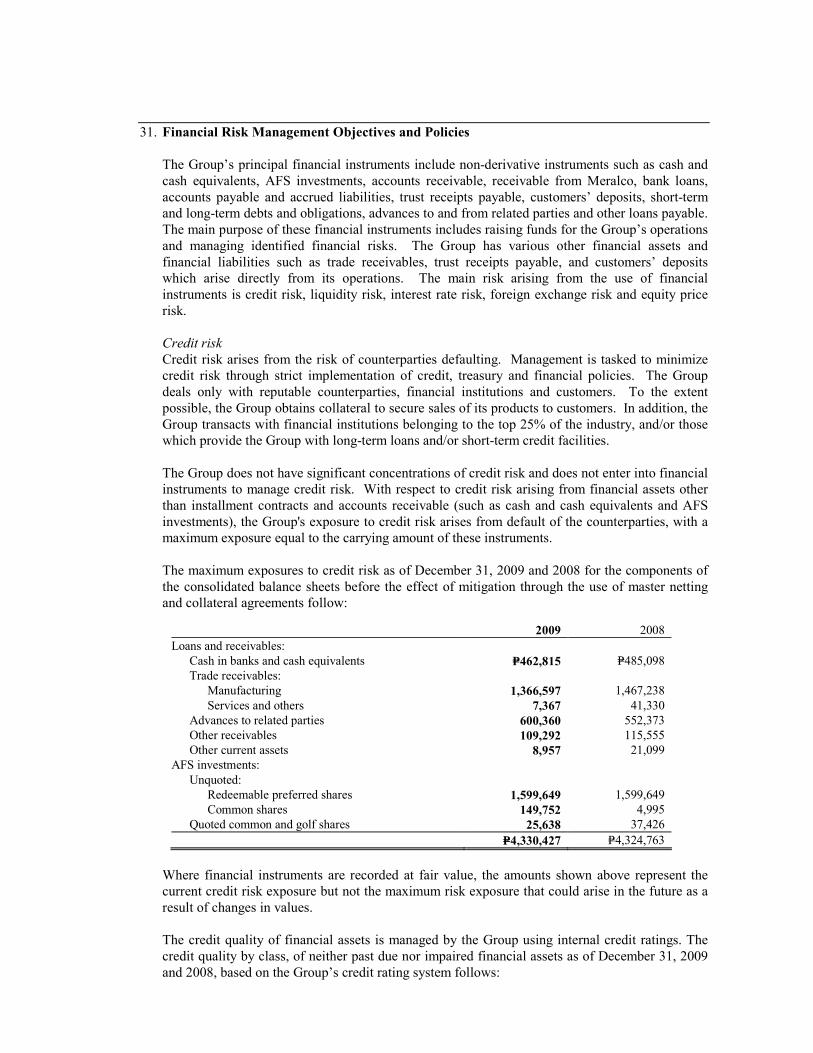
31. Financial Risk Management Objectives and Policies
The Group’s principal financial instruments include non-derivative instruments such as cash and
cash equivalents, AFS investments, accounts receivable, receivable from Meralco, bank loans,
accounts payable and accrued liabilities, trust receipts payable, customers’ deposits, short-term
and long-term debts and obligations, advances to and from related parties and other loans payable.
The main purpose of these financial instruments includes raising funds for the Group’s operations
and managing identified financial risks. The Group has various other financial assets and
financial liabilities such as trade receivables, trust receipts payable, and customers’ deposits
which arise directly from its operations. The main risk arising from the use of financial
instruments is credit risk, liquidity risk, interest rate risk, foreign exchange risk and equity price
risk.
Credit risk
Credit risk arises from the risk of counterparties defaulting. Management is tasked to minimize
credit risk through strict implementation of credit, treasury and financial policies. The Group
deals only with reputable counterparties, financial institutions and customers. To the extent
possible, the Group obtains collateral to secure sales of its products to customers. In addition, the
Group transacts with financial institutions belonging to the top 25% of the industry, and/or those
which provide the Group with long-term loans and/or short-term credit facilities.
The Group does not have significant concentrations of credit risk and does not enter into financial
instruments to manage credit risk. With respect to credit risk arising from financial assets other
than installment contracts and accounts receivable (such as cash and cash equivalents and AFS
investments), the Group's exposure to credit risk arises from default of the counterparties, with a
maximum exposure equal to the carrying amount of these instruments.
The maximum exposures to credit risk as of December 31, 2009 and 2008 for the components of
the consolidated balance sheets before the effect of mitigation through the use of master netting
and collateral agreements follow:
2009 2008
Loans and receivables:
Cash in banks and cash equivalents P=462,815 P=485,098
Trade receivables:
Manufacturing 1,366,597 1,467,238
Services and others 7,367 41,330
Advances to related parties 600,360 552,373
Other receivables 109,292 115,555
Other current assets 8,957 21,099
AFS investments:
Unquoted:
Redeemable preferred shares 1,599,649 1,599,649
Common shares 149,752 4,995
Quoted common and golf shares 25,638 37,426
P=4,330,427 P=4,324,763
Where financial instruments are recorded at fair value, the amounts shown above represent the
current credit risk exposure but not the maximum risk exposure that could arise in the future as a
result of changes in values.
The credit quality of financial assets is managed by the Group using internal credit ratings. The
credit quality by class, of neither past due nor impaired financial assets as of December 31, 2009
and 2008, based on the Group’s credit rating system follows:
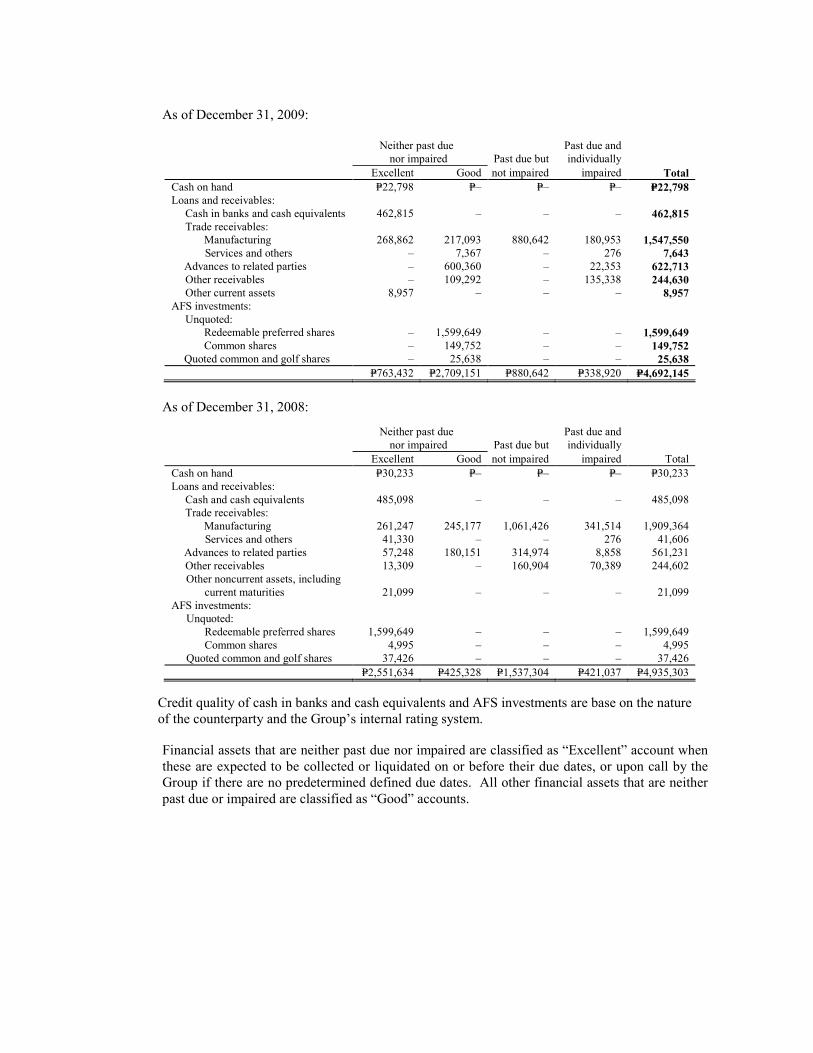
As of December 31, 2009:
Neither past due Past due and
nor impaired Past due but individually
Excellent Good not impaired impaired Total
Cash on hand P=22,798 P=– P=– P=– P=22,798
Loans and receivables:
Cash in banks and cash equivalents 462,815 – – – 462,815
Trade receivables:
Manufacturing 268,862 217,093 880,642 180,953 1,547,550
Services and others – 7,367 – 276 7,643
Advances to related parties – 600,360 – 22,353 622,713
Other receivables – 109,292 – 135,338 244,630
Other current assets 8,957 – – – 8,957
AFS investments:
Unquoted:
Redeemable preferred shares – 1,599,649 – – 1,599,649
Common shares – 149,752 – – 149,752
Quoted common and golf shares – 25,638 – – 25,638
P=763,432 P=2,709,151 P=880,642 P=338,920 P=4,692,145
As of December 31, 2008:
Neither past due Past due and
nor impaired Past due but individually
Excellent Good not impaired impaired Total
Cash on hand P=30,233 P=– P=– P=– P=30,233
Loans and receivables:
Cash and cash equivalents 485,098 – – – 485,098 Trade receivables:
Manufacturing 261,247 245,177 1,061,426 341,514 1,909,364
Services and others 41,330 – – 276 41,606
Advances to related parties 57,248 180,151 314,974 8,858 561,231
Other receivables 13,309 – 160,904 70,389 244,602
Other noncurrent assets, including
current maturities
21,099 – – –
21,099
AFS investments: Unquoted:
Redeemable preferred shares 1,599,649 – – – 1,599,649
Common shares 4,995 – – – 4,995
Quoted common and golf shares 37,426 – – – 37,426
P=2,551,634 P=425,328 P=1,537,304 P=421,037 P=4,935,303
Credit quality of cash in banks and cash equivalents and AFS investments are base on the nature
of the counterparty and the Group’s internal rating system.
Financial assets that are neither past due nor impaired are classified as “Excellent” account when
these are expected to be collected or liquidated on or before their due dates, or upon call by the
Group if there are no predetermined defined due dates. All other financial assets that are neither
past due or impaired are classified as “Good” accounts.
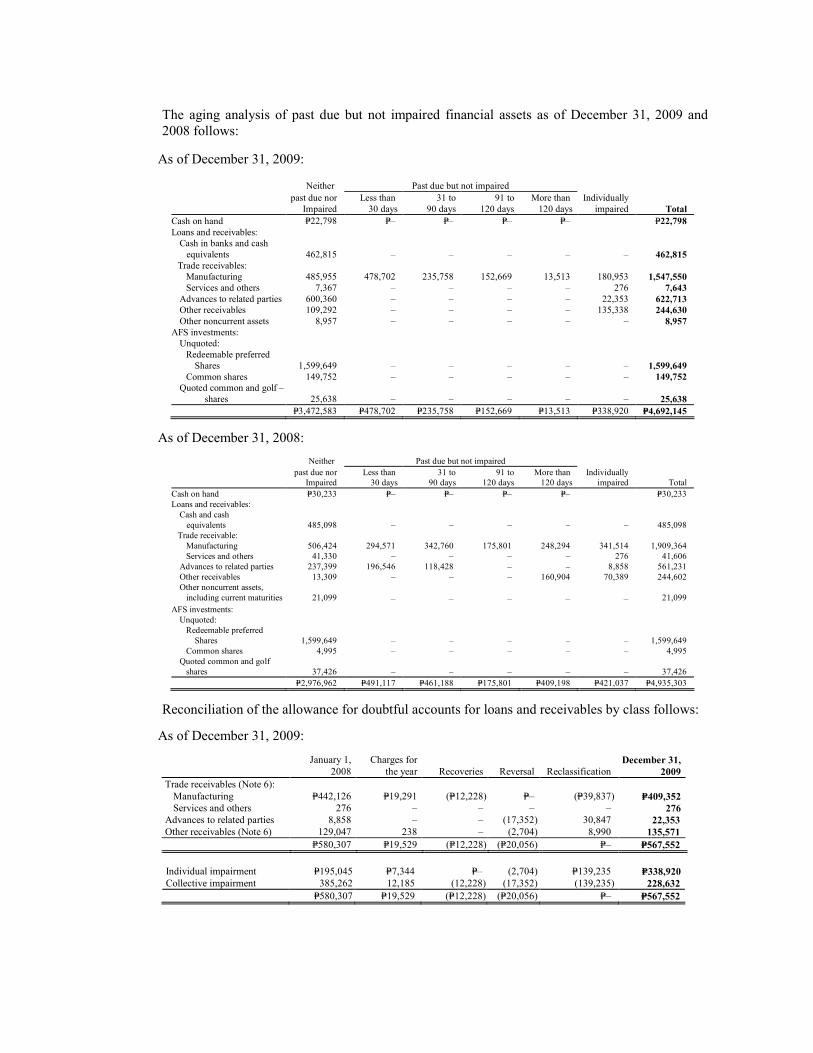
The aging analysis of past due but not impaired financial assets as of December 31, 2009 and
2008 follows:
As of December 31, 2009:
Neither Past due but not impaired
past due nor Less than 31 to 91 to More than Individually
Impaired 30 days 90 days 120 days 120 days impaired Total
Cash on hand P=22,798 P=– P=– P=– P=– P=22,798
Loans and receivables:
Cash in banks and cash
equivalents
462,815
–
–
–
–
–
462,815
Trade receivables:
Manufacturing 485,955 478,702 235,758 152,669 13,513 180,953 1,547,550
Services and others 7,367 – – – – 276 7,643
Advances to related parties 600,360 – – – – 22,353 622,713
Other receivables 109,292 – – – – 135,338 244,630
Other noncurrent assets 8,957 – – – – – 8,957
AFS investments:
Unquoted:
Redeemable preferred
Shares
1,599,649
–
–
–
–
–
1,599,649
Common shares 149,752 – – – – – 149,752
Quoted common and golf –
shares
25,638
–
–
–
–
–
25,638
P=3,472,583 P=478,702 P=235,758 P=152,669 P=13,513 P=338,920 P=4,692,145
As of December 31, 2008:
Neither Past due but not impaired
past due nor Less than 31 to 91 to More than Individually
Impaired 30 days 90 days 120 days 120 days impaired Total
Cash on hand P=30,233 P=– P=– P=– P=– P=30,233
Loans and receivables:
Cash and cash
equivalents
485,098
–
–
–
–
–
485,098
Trade receivable:
Manufacturing 506,424 294,571 342,760 175,801 248,294 341,514 1,909,364
Services and others 41,330 – – – – 276 41,606
Advances to related parties 237,399 196,546 118,428 – – 8,858 561,231
Other receivables 13,309 – – – 160,904 70,389 244,602
Other noncurrent assets,
including current maturities
21,099
–
–
–
–
–
21,099
AFS investments:
Unquoted:
Redeemable preferred
Shares
1,599,649
–
–
–
–
–
1,599,649
Common shares 4,995 – – – – – 4,995
Quoted common and golf
shares
37,426
–
–
–
–
–
37,426
P=2,976,962 P=491,117 P=461,188 P=175,801 P=409,198 P=421,037 P=4,935,303
Reconciliation of the allowance for doubtful accounts for loans and receivables by class follows:
As of December 31, 2009:
January 1,
2008
Charges for
the year Recoveries Reversal Reclassification December 31,
2009
Trade receivables (Note 6):
Manufacturing P=442,126 P=19,291 (P=12,228) P=– (P=39,837) P=409,352
Services and others 276 – – – – 276
Advances to related parties 8,858 – – (17,352) 30,847 22,353
Other receivables (Note 6) 129,047 238 – (2,704) 8,990 135,571
P=580,307 P=19,529 (P=12,228) (P=20,056) P=– P=567,552
Individual impairment P=195,045 P=7,344 P=– (2,704) P=139,235 P=338,920
Collective impairment 385,262 12,185 (12,228) (17,352) (139,235) 228,632
P=580,307 P=19,529 (P=12,228) (P=20,056) P=– P=567,552

As of December 31, 2008:
January 1,
2008
Charges for
the year Recoveries
Write-offs Deconsolidation
December 31,
2008
Trade receivables (Note 6):
Manufacturing P=422,418 P=53,404 (P=13,001) (P=19,294) (P=1,401) P=442,126
Services and others 788 – – – (512) 276
Advances to related parties 50,686 – – (41,828) – 8,858
Other receivables (Note 6) 196,788 – (3,037) – (64,704) 129,047
P=670,680 P=53,404 (P=16,038) (P=61,122) (P=66,617) P=580,307
Individual impairment P=524,213 P=40,601 (P=16,038) (P=61,122) (P=66,617) P=421,037
Collective impairment 146,467 12,803 – – – 159,270
P=670,680 P=53,404 (P=16,038) (P=61,122) (P=66,617) P=580,307
Allowance for doubtful accounts relating to noncurrent advances to related parties amounting to
P=0.89 million were written off in 2009. Liquidity risk
Liquidity risk arises from the possibility that the Group may encounter difficulties in raising fund
to meet commitments from financial instruments. Management is tasked to minimize liquidity risk through prudent financial planning and execution
to meet the funding requirements of the various operating divisions within the Group; through
long-term and short-term debts obtained from financial institutions; through strict implementation
of credit and collection policies, particularly in containing trade receivables; and through capital
raising, including equity, as may be necessary. Presently, the Group has existing long-term debts
that fund capital expenditures. Working capital requirements, on the other hand, are adequately
addressed through short-term credit facilities from financial institutions. Trade receivables are
kept within manageable levels.
The following tables show the maturity profile of the Group’s other financial liabilities as of
December 31, 2009 and 2008, and the undiscounted cash flows from financial assets used for
liquidity purposes as of December 31, 2009.
As of December 31, 2009:
Less than
1 year
1 to less
than
2 years
2 to less
than
3 years
3 to less
than
4 years
4 to less than
5 years
More than
5 years
Total
Cash on hand P=22,798 P=– P=– P=– P=– P=– P=22,798
Loans and
receivables:
Cash in banks and cash
equivalents 462,815 – – – – – 462,815
Trade receivables:
Manufacturing 485,955 880,642 – – – – 1,366,597
Service 7,367 – – – – – 7,367
Other current assets 8,957 – – – – – 8,957
Advances to related
parties 600,360 – – – – – 600,360
Other receivables 109,292 – – – – – 109,292
P=1,697,544 P=880,642 P=– P=– P=– P=– P=2,578,186
Other financial
liabilities:
Bank loans P=244,781 P=– P=– P=– P=– P=– P=244,781
Accounts payable
and accrued
liabilities
1,561,551
–
–
–
–
–
1,561,551
Trust receipts payable 541,819 – – – – – 541,819
Customers’ deposits 52,564 – – – – – 52,564
(Forward)

Less than
1 year
1 to less
than
2 years
2 to less
than
3 years
3 to less
than
4 years
4 to less than
5 years
More than
5 years
Total
Long-term debts
and obligations,
including current
maturities
P=395,433
P=314,539
P=308,610
P=50,890
P=1,456
P=
P=1,070,928
Advances from
related parties
90,456
–
–
–
–
–
90,456
P=2,886,604 P=314,539 P=308,610 P=50,890 P=1,456 P=– P=3,562,099
As of December 31, 2008:
Less than
1 year
1 to less
than
2 years
2 to less
than
3 years
3 to less
than
4 years
4 to less than
5 years
More than
5 years
Total
Bank loans P=240,289 P=– P=– P=– P=– P=– P=240,289
Accounts payable
and accrued
liabilities
1,664,725
–
–
–
–
–
1,664,725
Trust receipts payable 670,303 – – – – – 670,303
Customers’ deposits 37,132 – – – – – 37,132
Long-term debts
and obligations,
including current
maturities
404,832
377,327
461,588
11,156
11,156
7,850
1,273,909
Advances from
related parties
63,072
–
–
–
–
–
63,072
P=3,080,353 P=377,327 P=461,588 P=11,156 P=11,156 P=7,850 P=3,949,430
Refer to Notes 13, 16 and 18 for the interest rate profile of bank loans, long-term debts and obligations.
Interest rate risk
The Group’s exposure to changes in interest rates relates primarily to the Group’s short-term and
long-term debt obligations.
Management is tasked to minimize interest rate risk through interest rate swaps and options, and
having a mix of variable and fixed interest rates on its loans. Presently, the Group’s short-term
and long-term debts are market-determined, with the long-term debts interest rates based on
PDST-F-1 plus a certain spread.
To further reduce its interest rate risk exposure, the Group through the Parent Company entered
into an interest rate swap agreement in 2009 (see Note 18). The Parent Company utilizes PHP
interest rate swap with a receive variable leg based on the benchmark interest rate of three-month
PDST-F and pay fixed leg that it is the receive leg that virtually matches the loan’s critical terms.
With this, the variability in cash flows of the interest rate swaps are expected to offset the
variability in cashflows of the loan due to changes in the benchmark interest rate. Therefore, the
Parent Company concluded that no or little ineffectiveness will result (absent a default by the
counterparty). Accordingly, mark-to-market adjustments on the interest rate swap are directly
recognized in consolidated statement of comprehensive income.
As more of the floating-rate loans were paid on scheduled repayment dates and the hedging
transaction effectively converted the floating rate to fixed rate, the percentage of floating-rate debt
represents 62.44% of total outstanding long-term debts as of December 31, 2009.
The Group has not entered into interest rate swaps and options prior to 2009.

The sensitivity to a reasonably possible change in interest rates on the Group’s long-term debts,
with all other variables held constant of the Group’s income before income tax for the year ended
December 31, 2009 and 2008 follows:
December 31, 2009:
Change in interest rates (in basis points*)
133bp rise 115bp rise 133bp fall 115bp fall
Effect in income before
income tax (P=16,306) (P=14,099) P=16,306 P=14,099 *1 basis point is equivalent to 0.01%
December 31, 2008:
Change in interest rates (in basis points*)
500bp rise 250bp rise 500bp fall 250bp fall
Effect in income before
income tax (P=172,893) (P=86,444) P=172,893 P=86,444 *1 basis point is equivalent to 0.01%
URICI is not expecting significant exposures to interest rate risk considering the short-term
maturities of its bank loans.
There is no other impact on the Group’s equity other than those affecting the income.
With regard to the Parent Company’s hedging transaction, the following table demonstrates the
sensitivity of fair value changes due to movements in interest rates with all other variables held
constant. Management expects that interest rates will move by -/+50 basis points within the next
reporting period. The sensitivity to equity as of December 31, 2009 pertains to the interest rate
swap transaction accounted for as a cash flow hedge.
Change in interest
rates (in basis point*) Effect on Equity
2009 50bp rise P=1,900
50bp fall (1,900) *1 basis point is equivalent to 0.01%
Foreign exchange risk
The Group’s exposure to foreign exchange risk results from the Parent Company and URICI’s
business transactions and financing agreements denominated in foreign currencies.
Management is tasked to minimize foreign exchange risk through the natural hedges arising from
its export business and through external currency hedges. Presently, trade importations are
immediately paid or converted into Philippine peso obligations as soon as these are negotiated
with suppliers. The Group has not done any external currency hedges in 2009 and 2008.
Parent Company
A reasonably possible change of -/+ 5% in United States (US) dollar exchange rate at
December 31, 2009 and 2008 would lead to the following income before income tax movements
in the Parent Company statements of income:
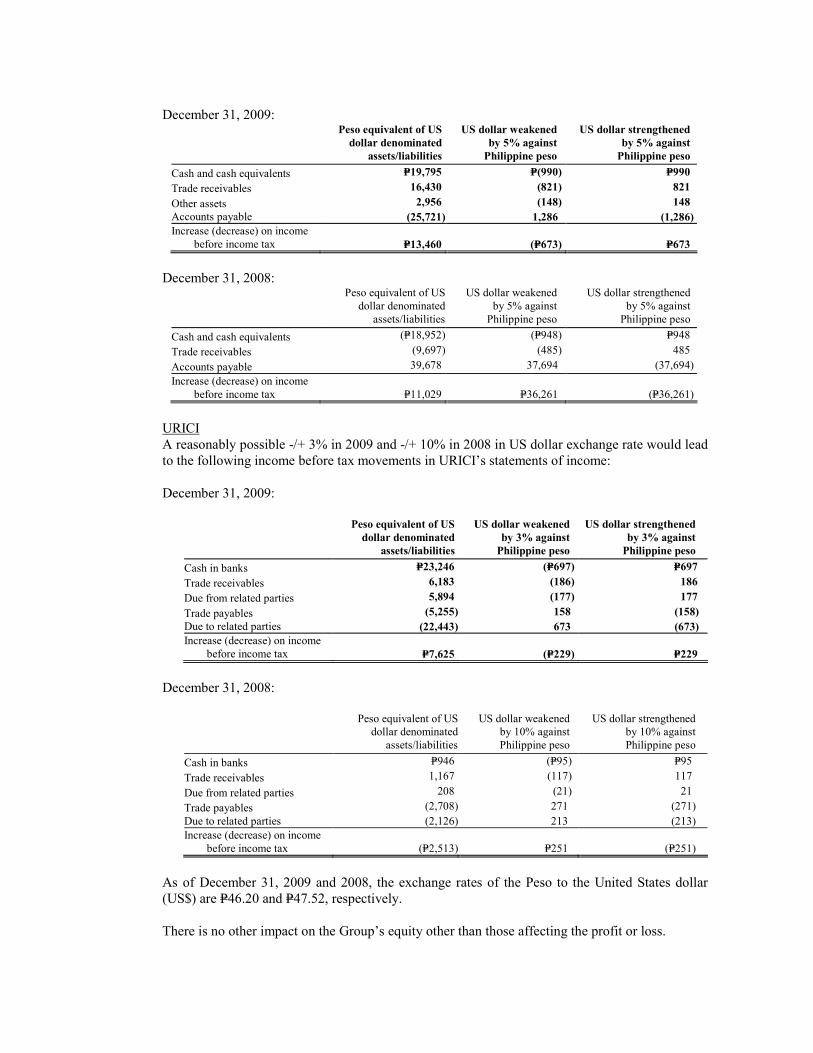
December 31, 2009: Peso equivalent of US
dollar denominated
US dollar weakened
by 5% against
US dollar strengthened
by 5% against
assets/liabilities Philippine peso Philippine peso
Cash and cash equivalents P=19,795 P=(990) P=990
Trade receivables 16,430 (821) 821
Other assets 2,956 (148) 148
Accounts payable (25,721) 1,286 (1,286)
Increase (decrease) on income
before income tax
P=13,460
(P=673)
P=673
December 31, 2008: Peso equivalent of US
dollar denominated
US dollar weakened
by 5% against
US dollar strengthened
by 5% against
assets/liabilities Philippine peso Philippine peso
Cash and cash equivalents (P=18,952) (P=948) P=948
Trade receivables (9,697) (485) 485
Accounts payable 39,678 37,694 (37,694)
Increase (decrease) on income
before income tax
P=11,029
P=36,261
(P=36,261)
URICI
A reasonably possible -/+ 3% in 2009 and -/+ 10% in 2008 in US dollar exchange rate would lead
to the following income before tax movements in URICI’s statements of income:
December 31, 2009:
Peso equivalent of US
dollar denominated
US dollar weakened
by 3% against
US dollar strengthened
by 3% against
assets/liabilities Philippine peso Philippine peso
Cash in banks P=23,246 (P=697) P=697
Trade receivables 6,183 (186) 186
Due from related parties 5,894 (177) 177
Trade payables (5,255) 158 (158)
Due to related parties (22,443) 673 (673)
Increase (decrease) on income
before income tax
P=7,625
(P=229)
P=229
December 31, 2008:
Peso equivalent of US
dollar denominated US dollar weakened
by 10% against US dollar strengthened
by 10% against
assets/liabilities Philippine peso Philippine peso
Cash in banks P=946 (P=95) P=95
Trade receivables 1,167 (117) 117
Due from related parties 208 (21) 21
Trade payables (2,708) 271 (271)
Due to related parties (2,126) 213 (213)
Increase (decrease) on income
before income tax
(P=2,513)
P=251
(P=251)
As of December 31, 2009 and 2008, the exchange rates of the Peso to the United States dollar
(US$) are P=46.20 and P=47.52, respectively.
There is no other impact on the Group’s equity other than those affecting the profit or loss.

Equity price risk
Equity price risk is such risk where the fair values of investments in quoted equity securities
could decrease as a result of changes in the levels of equity indices and the value of individual
stock. Management strictly monitors the movement of the share prices pertaining to its
investments. The Group is exposed to equity securities price risk because of investments, which
are classified as AFS investments (see Note 10). These investments, totaling P=25.64 million and
P=37.43 million as of December 31, 2009 and 2008, respectively, represent 0.28% and 0.40% of
the total assets of the Group.
The effect on equity, as a result of a reasonably possible change in the fair value of the Group’s
equity instruments held as AFS investments as of December 31, 2009 and 2008, which could be
brought by changes in quoted prices with all other variables held constant, follows:
Change in quoted prices of
investments carried at fair value
2009
2008
Increase by 10% P=2,567 P=3,690
Increase by 5% 1,284 1,855
Decrease by 10% (2,567) (3,690)
Decrease by 5% (1,284) (1,855)
There is no other impact on the Group’s equity other than those affecting the profit or loss.
32. Financial Assets and Financial Liabilities
The following summarizes the carrying values and fair values of the Group’s financial assets and
financial liabilities as of December 31:
December 31, 2009 December 31, 2008
Carrying
Value
Fair
Value
Carrying
Value
Fair
Value
Financial Assets
Cash on hand P=22,798 P=22,798 P=30,233 P=30,233
Loans and receivables:
Cash in banks and cash equivalents 462,815 462,815 485,098 485,098
Trade receivables:
Manufacturing 1,366,597 1,366,597 1,467,238 1,467,238
Services and others 7,367 7,367 41,330 41,330
Advances to related parties 600,360 600,360 552,373 552,373
Other receivables 109,292 109,292 115,555 117,263
Other noncurrent assets, including
current maturities
8,957
8,957
21,099
21,099
2,555,388 2,555,388 2,682,693 2,684,401
AFS investments:
Unquoted:
Redeemable preferred shares
1,599,649
1,599,649
1,599,649
1,599,649 Common shares 149,752 149,752 4,995 4,995
Quoted common and golf shares 25,638 25,638 37,426 37,426
1,775,039 1,775,039 1,642,070 1,642,070
P=4,353,225 P=4,353,225 P=4,354,996 P=4,356,704
(Forward)

December 31, 2009 December 31, 2008
Carrying
Value
Fair
Value
Carrying
Value
Fair
Value
Financial Liabilities
Derivative liability P=1,200 P=1,200 P=– P=–
Other financial liabilities:
Bank loans 244,000 244,000 239,000 239,000
Accounts payable and accrued
liabilities
1,583,723
1,583,723
1,734,725
1,734,725
Trust receipts payable 535,073 535,073 670,303 670,303
Customers’ deposits 52,564 52,564 37,132 37,132
Long-term debts and obligations,
including current maturities
1,038,917
1,070,928
1,273,909
1,377,802
Advances from related parties 90,456 90,456 63,072 63,072
3,544,733 3,576,744 4,018,141 4,122,034
P=3,545,933 P=3,577,944 P=4,018,141 P=4,122,034
Fair Value of Financial Instruments
The following methods and assumptions were used to estimate the fair value of each class of
financial instrument for which it is practicable to estimate such value.
Due to the short-term nature of the transactions, the carrying amounts of cash and cash
equivalents, accounts receivable, bank loans, accounts payable and accrued liabilities, trust
receipts payable and customers’ deposits approximate their fair values.
The fair value of quoted AFS investment has been determined by reference to quoted market
prices at the close of business on December 31, 2009 and 2008. Investments in unquoted equity
securities are carried at historical cost, net of impairment, as their fair value cannot be reliably
measured.
The fair value of advances to/from related parties, receivable from Meralco and long-term
obligations are based on the discounted value of future cash flows using the applicable rates for
similar types of instruments.
The carrying value of long-term debt, for which interest rates are repriced quarterly based on
market rates, approximates the fair value. Refer to Notes 13, 16 and 18 for the interest rate profile
of these liabilities.
Fair Value Hierarchy
The Group uses the following hierarchy for disclosing the fair values of financial instruments by
valuation source of input:
• quoted prices in active markets for identical assets or liabilities (Level 1);
• those involving inputs other than quoted prices included in Level 1 that are observable for the
asset or liability, either directly (as prices) or indirectly (derived from prices) (Level 2); and
• those with inputs for the asset or liability that are not based on observable market date
(unobservable inputs) (Level 3).
The following table shows an analysis of financial instruments recorded at fair value by level of
the fair value hierarchy as of December 31, 2009:
Level 1 Level 2 Level 3 Total
Quoted AFS investments P=25,638 P=– P=– P=25,638
Derivative liability – 1,200 – 1,200

There had been no transfers between Level 1, Level 2 and Level 3 of the fair value hierarchy in
2009.
Derivative Instruments
The related fair values of the Parent Company’s derivative financial instruments outstanding as of
December 31, 2009 follow:
Asset Liability Interest rate swap: BDO Loan P=– (P=1,200)
P=– (P=1,200)
Derivatives Accounted for Under Cash Flow Hedge Accounting
On August 27, 2009, the Parent Company entered into an interest rate swap transaction with
Hongkong and Shanghai Banking Corporation (HSBC) to hedge the cash flow variability on the
BDO loan due to movements in interest rates. Details of the interest rate swap follow:
Trade Date Maturity Date Notional Amount* Receive Floating Pay Fixed
August 27, 2009 October 3, 2012 P=380.00 million PDST-F + 250 basis points 7.92% per annum
*Amortizing based on a given schedule Under the interest rate swap, the Parent Company will receive quarterly interest at a rate of
3-months PDST-F plus 2.50% per annum spread on the outstanding peso balance starting
October 5, 2009 until October 3, 2012, and pay quarterly interest at fixed rate of 7.92% per annum
on the outstanding peso balance starting October 5, 2009 until October 3, 2012. As of
December 31, 2009, the outstanding notional amount of the swap amounted to P=380.00 million,
which amortizes in installments of P=31.67 million every three months.
Hedge Effectiveness of Cash Flow Hedge
Movements of the Parent Company’s cumulative translation adjustments on cash flow hedges for
the year ended December 31, 2009 follow:
Balance at beginning of year P=–
Fair value changes of derivative 2,938
Fair value changes on derivative taken to profit or loss (1,738)
Derivative liability at end of year 1,200
Less tax effect 360
Cash flow hedge at end of year P=840
No ineffectiveness was recognized in the Parent Company statement of income.
Fair Value Changes on Derivatives
The net changes in the fair values of all derivative instruments for the year ended
December 31, 2009 follow:
Balance at beginning of year P=–
Net changes in fair values of derivatives:
Designated as accounting hedge (2,938)
Not designated as accounting hedge –
(2,938)
Fair value of derivative taken to profit or loss 1,738
Derivative liability at end of year (P=1,200)

Forward Contracts
For the year ended December 31, 2009, URICI, through the Central Treasury Department, entered
into forward foreign exchange contracts as a hedge against foreign currency denominated
liabilities and commitments. These forward foreign exchange contracts are expected to be settled
within one month from the balance sheet date.
URICI’s forward foreign exchange contracts outstanding as of December 31, 2009 follow:
Aggregate notional amount of forward exchange
contracts in US dollar (unrounded amount) $8,367
Average contracted forward rate in US dollar at balance
sheet date P=46.41
The fair value of forward foreign exchange contracts is determined using forward exchange market
rates at balance sheet date and any difference between the fair market values and aggregate
notional amounts of these forward foreign exchange contracts is recognized immediately in the
statement of comprehensive income (see Note 31).
33. Capital Management
It is the objective of the Group to maintain a capital base that adequately services the needs of its
present and future operations while keeping within the capital level required by creditors. The
capital base is also sufficient to address present and future uncertainties and risks inherent in the
business and changes in the economic conditions. Payment of dividends, return of capital, or
issuance of shares to increase capital shall be made accordingly and as may be necessary. No
changes were made in the objectives, policies and processes as of December 31, 2009 and 2008.
The following table summarizes the total capital considered by the Group: 2009 2008 Capital stock P=3,160,404 P=3,160,404 Capital in excess of par value 788,643 788,643
Retained earnings 622,228 381,080
Treasury shares – (3,556)
P=4,571,275 P=4,326,571
34. �otes to Consolidated Statements of Cash Flows
a. The Group’s noncash investing activity in 2009 pertain to the cancellation of installment
purchase obligation on machinery and equipment with a net book value of P=13.64 million. In 2008, the Company’s noncash investing activities pertain to (i) the conversion of
Philtown’s common shares to preferred shares amounting to P=762.85 million; and (ii) the
revaluation of the Company’s parcels of land, which are classified as property, plant and
equipment, amounting to P=456.37 million, net of related deferred income tax liability.
b. The Company’s noncash financing activities in 2009 pertain to (i) the Company’s declaration
of 25.56% of Philtown’s common shares amounting to P=116.22 million as property dividends
to the Company’s stockholders, and (ii) the interest rate swap that is used as hedge for the
exposure change in the fair value of the Company’s P=380.00 million fixed-rate loan
amounting to P=1.2 million.

c. In 2008, the Company’s noncash financing activities pertain to (i) the Company’s declaration
of 65.79% of Philtown’s common shares amounting to P=501.88 million as property dividends
to the Company’s stockholders and (ii) the retirement of the Company’s treasury shares
amounting to P=991.76 million.


-1-
RFM CORPORATIO� A�D SUBSIDIARIES
Schedule B. Amounts Receivable from Directors, Officers, Employees, Related Parties and Principal Stockholders (Other
than Affiliates)
For the year Ended December 31, 2009
(Amounts in Million Pesos unless otherwise stated)
Deductions
�ame and Designation of Debtor
Beginning
Balance Additions
Amount
Collected
Amount
Written Off
Current �on-current
Jose Concepcion III/ President &
CEO
P 24.66 P- P (4.07) -
Felicisimo �acino Jr./ Director 1.50 - (0.01) -
Other Directors and Officers 1.04 - (0.31) -
P 27.20 P – P (4.39) -
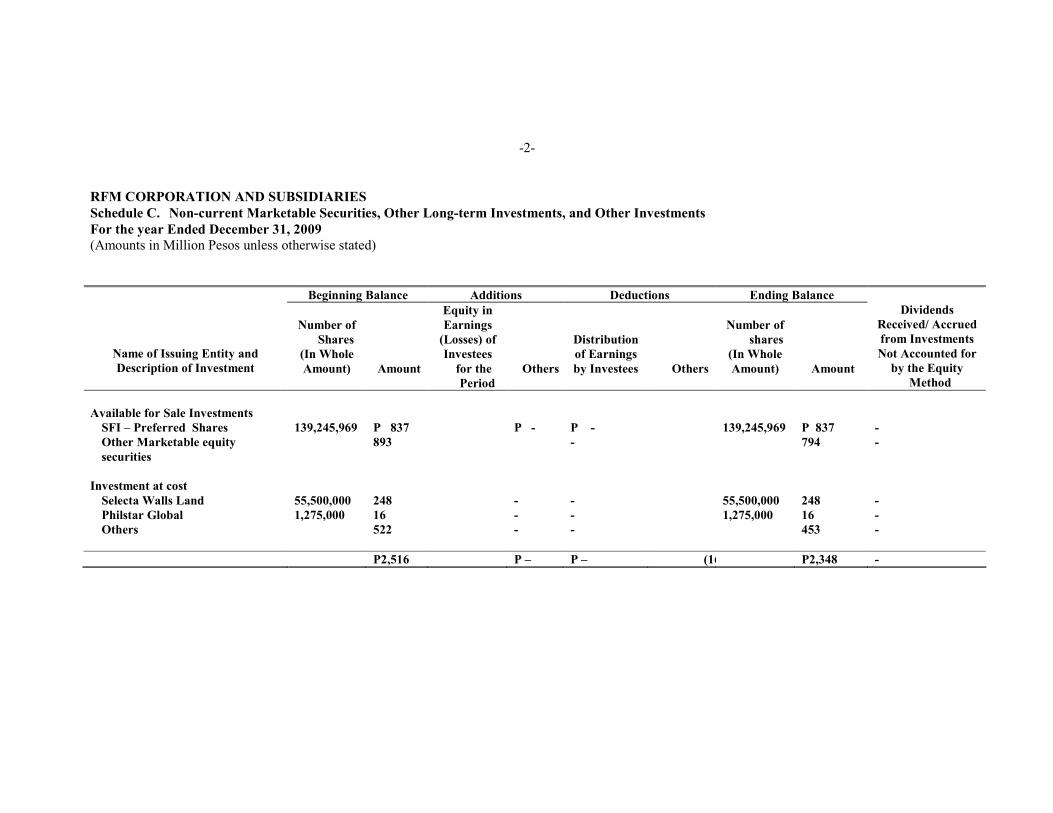
-2-
RFM CORPORATIO� A�D SUBSIDIARIES
Schedule C. �on-current Marketable Securities, Other Long-term Investments, and Other Investments
For the year Ended December 31, 2009
(Amounts in Million Pesos unless otherwise stated)
Beginning Balance Additions Deductions Ending Balance
�ame of Issuing Entity and
Description of Investment
�umber of
Shares
(In Whole
Amount) Amount
Equity in
Earnings
(Losses) of
Investees
for the
Period
Others
Distribution
of Earnings
by Investees Others
�umber of
shares
(In Whole
Amount) Amount
Dividends
Received/ Accrued
from Investments
�ot Accounted for
by the Equity
Method
Available for Sale Investments
SFI – Preferred Shares 139,245,969 P 837 P - P - 139,245,969 P 837 -
Other Marketable equity
securities
893 - 794 -
Investment at cost
Selecta Walls Land 55,500,000 248 - - 55,500,000 248 -
Philstar Global 1,275,000 16 - - 1,275,000 16 -
Others 522 - - 453 -
P2,516 P – P – (168 P2,348 -
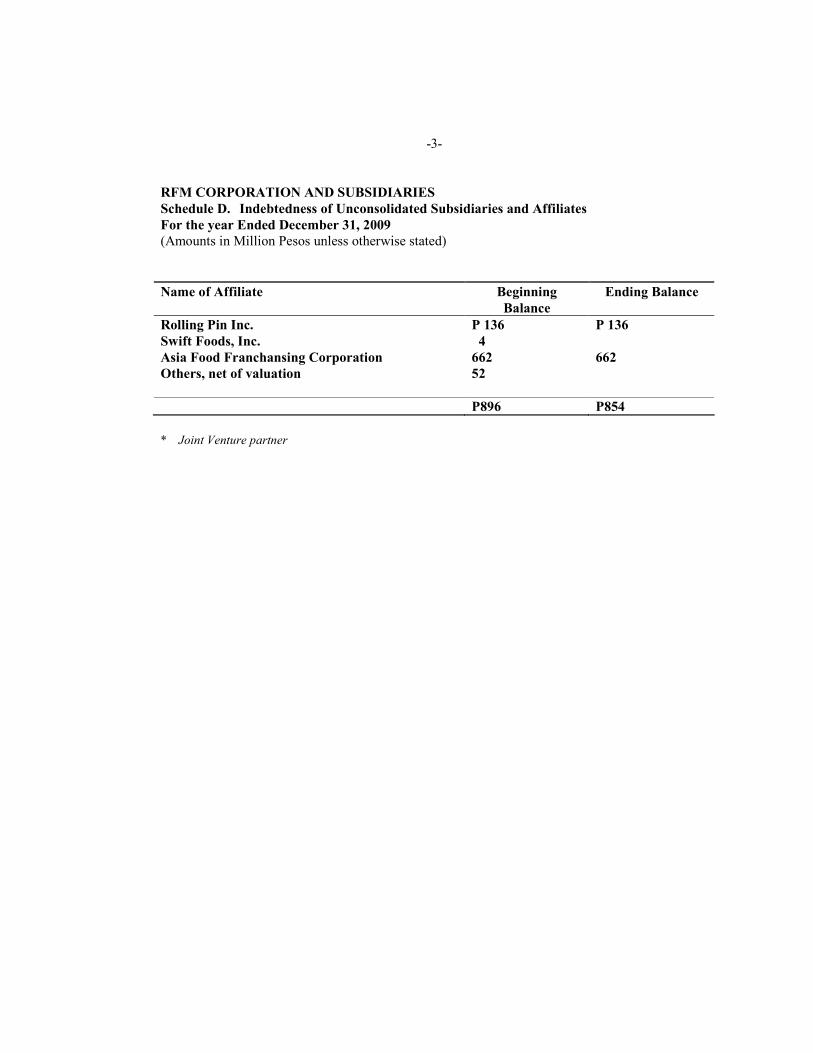
-3-
RFM CORPORATIO� A�D SUBSIDIARIES
Schedule D. Indebtedness of Unconsolidated Subsidiaries and Affiliates
For the year Ended December 31, 2009
(Amounts in Million Pesos unless otherwise stated)
�ame of Affiliate Beginning
Balance
Ending Balance
Rolling Pin Inc.
Swift Foods, Inc.
Asia Food Franchansing Corporation
Others, net of valuation
P 136
4
662
52
P 136
662
P896 P854
* Joint Venture partner
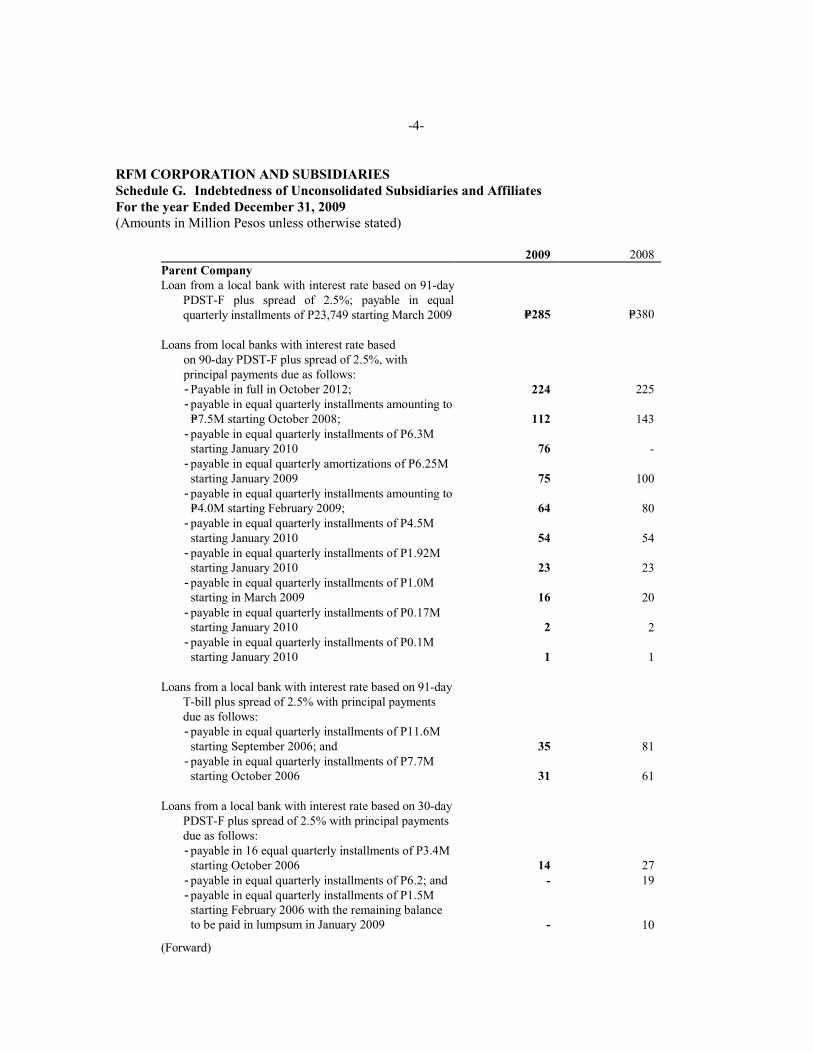
-4-
RFM CORPORATIO� A�D SUBSIDIARIES
Schedule G. Indebtedness of Unconsolidated Subsidiaries and Affiliates
For the year Ended December 31, 2009
(Amounts in Million Pesos unless otherwise stated)
2009 2008
Parent Company
Loan from a local bank with interest rate based on 91-day
PDST-F plus spread of 2.5%; payable in equal
quarterly installments of P23,749 starting March 2009
P=285
P=380
Loans from local banks with interest rate based
on 90-day PDST-F plus spread of 2.5%, with
principal payments due as follows:
- Payable in full in October 2012; 224 225
- payable in equal quarterly installments amounting to
P=7.5M starting October 2008;
112
143
- payable in equal quarterly installments of P6.3M
starting January 2010
76
-
- payable in equal quarterly amortizations of P6.25M
starting January 2009
75
100
- payable in equal quarterly installments amounting to
P=4.0M starting February 2009;
64
80
- payable in equal quarterly installments of P4.5M
starting January 2010
54
54
- payable in equal quarterly installments of P1.92M
starting January 2010
23
23
- payable in equal quarterly installments of P1.0M
starting in March 2009
16
20
- payable in equal quarterly installments of P0.17M
starting January 2010
2
2
- payable in equal quarterly installments of P0.1M
starting January 2010
1
1
Loans from a local bank with interest rate based on 91-day
T-bill plus spread of 2.5% with principal payments
due as follows:
- payable in equal quarterly installments of P11.6M
starting September 2006; and
35
81
- payable in equal quarterly installments of P7.7M
starting October 2006
31
61
Loans from a local bank with interest rate based on 30-day
PDST-F plus spread of 2.5% with principal payments
due as follows:
- payable in 16 equal quarterly installments of P3.4M
starting October 2006
14
27
- payable in equal quarterly installments of P6.2; and - 19
- payable in equal quarterly installments of P1.5M
starting February 2006 with the remaining balance
to be paid in lumpsum in January 2009
-
10
(Forward)

Loans from a local bank for car financing with interest rate
of 11.67%; payable in 36 monthly amortizations
starting June 2007
-
1
1,012 1,226
Less current portion 376 289
Noncurrent portion P=636 P=937
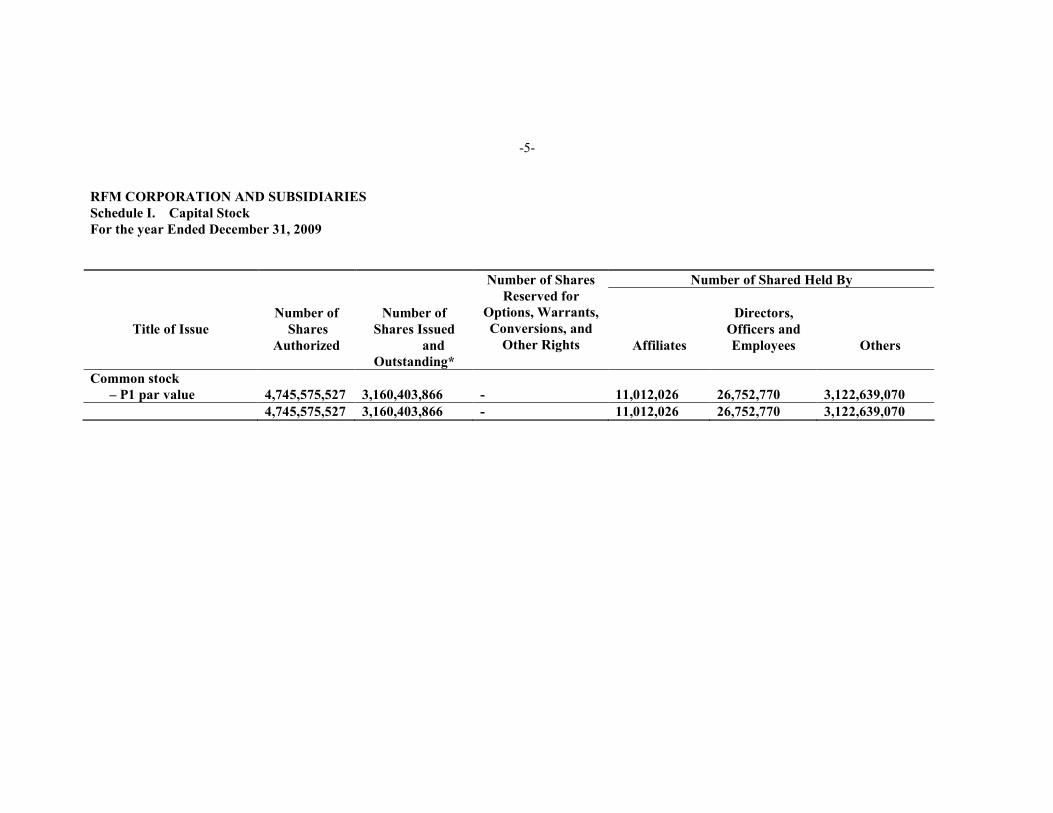
-5-
RFM CORPORATIO� A�D SUBSIDIARIES
Schedule I. Capital Stock
For the year Ended December 31, 2009
�umber of Shared Held By
Title of Issue
�umber of
Shares
Authorized
�umber of
Shares Issued
and
Outstanding*
�umber of Shares
Reserved for
Options, Warrants,
Conversions, and
Other Rights
Affiliates
Directors,
Officers and
Employees
Others
Common stock
– P1 par value
4,745,575,527
3,160,403,866
-
11,012,026
26,752,770
3,122,639,070
4,745,575,527 3,160,403,866 - 11,012,026 26,752,770 3,122,639,070

RFM CORPORATIO�
Schedule J. Retained Earnings Available for Dividends
For the year ended December 31, 2009
(Amounts in Million Pesos unless otherwise stated)
Unappropriated Retained Earnings P182
Net income during the period closed to Retained
Earnings 372
Less: Nonactual income
Valuation gain on AFS investments (5)
Unrealized foreign exchange gain -
Income on accretion -
Net income actually earned/realized during the period 549
Add(Less):
Dividends declared during the period
Property dividends (116)
Cash dividends (50)
Treasury shares -
Total Retained Earnings Available for Dividends P383