second quarter 2006 - bmo reports/3/1/bmo q2... · 2006. 6. 9. · financial highlights (unaudited)...
TRANSCRIPT

BMO Financial Group Second Quarter 2006 Report to Shareholders BMO Financial Group Second Quarter2006 Report to Shareholders BMO Financial Group Second Quarter 2006 Report to Shareholders BMOFinancial Group Second Quarter 2006 Report to Shareholders BMO Financial Group Second Quarter 2006Report to Shareholders BMO Financial Group Second Quarter 2006 Report to Shareholders BMO FinancialGroup Second Quarter 2006 Report to Shareholders BMO Financial Group Second Quarter 2006 Report toShareholders BMO Financial Group Second Quarter 2006 Report to Shareholders BMO Financial GroupSecond Quarter 2006 Report to Shareholders BMO Financial Group Second Quarter 2006 Report toShareholders BMO Financial Group Second Quarter 2006 Report to Shareholders BMO Financial GroupSecond Quarter 2006 Report to Shareholders BMO Financial Group Second Quarter 2006 Report toShareholders BMO Financial Group Second Quarter 2006 Report to Shareholders BMO Financial Group
I am pleased to present BMO Financial Group’s Second Quarter 2006 Report to Shareholders.
Tony ComperPresident and Chief Executive OfficerMay 24, 2006
Second Quarter 2006
For the period ended April 30, 2006
BMO Q2 06 Eng_v03.qxd 6/3/06 1:10 AM Page fci

Financial Highlights
(Unaudited) (Canadian $ in millions, except as noted) For the three months ended For the six months ended
April 30, January 31, October 31, July 31, April 30, Change from April 30, April 30, Change from2006 2006 2005 2005 2005 April 30, 2005 2006 2005 April 30, 2005
Income Statement HighlightsTotal revenue $ 2,473 $ 2,481 $ 2,620 $ 2,411 $ 2,397 3.1% $ 4,954 $ 4,808 3.0%Total revenue (teb) (a) 2,503 2,512 2,650 2,441 2,428 3.0 5,015 4,867 3.0Provision for credit losses 66 52 57 73 6 (+100) 118 49 (+100)Non-interest expense 1,571 1,545 1,636 1,579 1,579 (0.5) 3,116 3,112 0.1Net income 644 630 657 541 600 7.1 1,274 1,202 5.9
Common Share Data ($)
Diluted earnings per share $ 1.24 $ 1.22 $ 1.27 $ 1.05 $ 1.16 $ 0.08 $ 2.46 $ 2.32 $ 0.14Diluted cash earnings per share (a) 1.25 1.24 1.31 1.08 1.21 0.04 2.49 2.40 0.09Dividends declared per share 0.53 0.49 0.49 0.46 0.46 0.07 1.02 0.90 0.12Book value per share 27.54 27.04 26.53 26.00 25.60 1.94 27.54 25.60 1.94Closing share price 64.67 68.30 57.81 61.10 56.65 8.02 64.67 56.65 8.02Total market value of common shares ($ billions) 32.4 34.3 28.9 30.6 28.2 4.2 32.4 28.2 4.2
As at
April 30, January 31, October 31, July 31, April 30, Change from2006 2006 2005 2005 2005 April 30, 2005
Balance Sheet HighlightsAssets $ 312,410 $ 305,765 $ 297,532 $ 290,389 $ 292,356 6.9%Net loans and acceptances 187,561 178,582 174,337 171,618 172,641 8.6Deposits 194,488 193,259 193,793 188,750 191,045 1.8Common shareholders’ equity 13,816 13,591 13,270 13,001 12,764 8.2
For the three months ended For the six months ended
April 30, January 31, October 31, July 31, April 30, April 30, April 30,2006 2006 2005 2005 2005 2006 2005
Primary Financial Measures (%) (b)
Average annual five year total shareholder return 16.4 14.2 13.8 17.4 19.6 16.4 19.6Diluted earnings per share growth 6.9 5.2 19.8 (15.3) 3.6 6.0 9.4Diluted cash earnings per share growth (a) 3.3 4.2 19.1 (15.0) 3.4 3.8 9.1Return on equity 19.1 18.5 19.8 16.5 19.5 18.8 19.5Cash return on equity (a) 19.3 18.7 20.3 17.1 20.2 19.0 20.1Net economic profit (NEP) growth (a) (0.2) (4.2) 31.8 (37.4) (2.1) (2.2) 8.5Revenue growth 3.1 2.9 16.5 2.1 (0.4) 3.0 1.5Revenue growth (teb) (a) 3.0 3.0 16.3 2.0 (0.7) 3.0 1.1Non-interest expense-to-revenue ratio 63.5 62.3 62.4 65.5 65.9 62.9 64.7Non-interest expense-to-revenue ratio (teb) (a) 62.7 61.5 61.7 64.7 65.0 62.1 63.9Cash non-interest expense-to-revenue ratio (teb) (a) 62.3 61.1 60.9 63.8 64.0 61.7 62.9Provision for credit losses-to-average loans
and acceptances (annualized) 0.14 0.12 0.13 0.17 0.01 0.13 0.06Gross impaired loans and acceptances-to-
equity and allowance for credit losses 4.57 4.47 4.91 5.92 6.77 4.57 6.77Cash and securities-to-total assets ratio 25.1 26.7 26.2 26.8 27.6 25.1 27.6Tier 1 capital ratio 10.17 10.38 10.25 9.39 9.38 10.17 9.38Credit rating
Standard & Poor’s AA- AA- AA- AA- AA- AA- AA-Moody’s Aa3 Aa3 Aa3 Aa3 Aa3 Aa3 Aa3
Other Financial Ratios (% except as noted) (b)
Twelve month total shareholder return 17.7 27.5 3.7 13.8 12.6 17.7 12.6Dividend yield 3.28 2.87 3.39 3.01 3.25 3.15 3.18Price-to-earnings ratio (times) 13.5 14.5 12.5 13.8 12.3 13.5 12.3Market-to-book value (times) 2.35 2.53 2.18 2.35 2.21 2.35 2.21Net economic profit ($ millions) (a) 295 278 321 212 296 573 587Return on average assets 0.84 0.82 0.85 0.72 0.79 0.83 0.80Net interest margin 1.45 1.54 1.54 1.61 1.56 1.49 1.58Net interest margin (teb) (a) 1.49 1.58 1.58 1.65 1.60 1.53 1.62Non-interest revenue-to-total revenue 55.0 52.3 54.4 49.6 50.7 53.7 50.5Non-interest revenue-to-total revenue (teb) (a) 54.3 51.7 53.8 49.0 50.1 53.0 49.9Non-interest expense growth (0.5) 0.8 9.6 2.6 0.9 0.1 (0.4)Total capital ratio 11.72 11.84 11.76 11.08 11.30 11.72 11.30Tier 1 capital ratio - U.S. basis 9.86 10.08 9.96 8.99 8.93 9.86 8.93Equity-to-assets ratio 4.6 4.6 4.7 4.7 4.6 4.6 4.6
All ratios in this report are based on unrounded numbers.(a) Refer to the “GAAP and Related Non-GAAP Measures used in the MD&A” section on page 6 for an
explanation of cash results, reporting on a taxable equivalent basis (teb) and net economic profit.Securities regulators require that companies caution readers that earnings and other measures
adjusted to a basis other than generally accepted accounting principles (GAAP) do not have stan-dardized meanings under GAAP and are unlikely to be comparable to similar measures used byother companies.
(b) For the period ended, or as at, as appropriate.
BMO Q2 06 Eng_v03.qxd 6/3/06 1:10 AM Page fcii

BMO Financial Group Second Quarter Report 2006 | 1
Management’s Discussion and Analysis (MD&A)
1 All earnings per share (EPS) measures in the MD&A refer to diluted EPS unless specified otherwise. 2 The adjustments that change results under generally accepted accounting principles (GAAP) to cash results and GAAP
revenue and income taxes to a taxable equivalent basis (teb) are outlined in the Non-GAAP Measures section in theFinancial Performance Review, where all non-GAAP measures and their closest GAAP counterparts are outlined.Revenues and income taxes in the financial statements are stated in accordance with GAAP. Otherwise, all revenues andincome taxes and measures that include revenues or income taxes in the MD&A are stated on a taxable equivalent basis.
3 In the fourth quarter of 2005, BMO completed the sale of Harrisdirect, our former U.S. direct-investing business.Certain of our revenue and expense growth and productivity measures have been disclosed on a basis that excludesHarrisdirect results in the comparative periods, to assist in explaining performance.
References to retail and business banking refer to Personal and Commercial Client Group activities and references towealth management refer to Private Client Group activities.
Year-over-Year Operating Highlights for the Quarter:� Net income of $644 million, up $44 million or 7.1% � EPS1 of $1.24, up 6.9%, and cash EPS2 of $1.25, up 3.3% � Excluding the $67 million after-tax net impact of significant items that benefited results
a year ago, net income increased $111 million or 21% and EPS increased $0.21 or 20% � ROE of 19.1%, compared with 19.5% a year ago � A $66 million specific provision for credit losses, compared with a $46 million specific
provision and $40 million reduction of the general allowance last year� Revenue2 growth of 3.0% (5.4% excluding Harrisdirect 3 and 7.4% after also excluding
the impact of the weaker U.S. dollar)� Expense decline of 0.5% (3.3% growth excluding Harrisdirect and 5.4% growth after
also excluding the impact of the weaker U.S. dollar) � Productivity ratio2 improved 225 basis points to 62.7% and cash productivity ratio2 by
170 basis points to 62.3%� Announced a $0.09 or 17% increase in dividends to $0.62 per common share in
the third quarter and raised the target dividend payout range to 45-55% from 35-45%of net income available to common shareholders. The increased target range leadsthe Canadian banking industry and reflects BMO’s commitment to effectivecapital management� Tier 1 Capital Ratio of 10.17%, well above our target of 8% and up from 9.38% a year
ago but down from 10.38% at the end of the first quarter � Operating Group Net Income
• Personal and Commercial Client Group down $7 million or 2.4% to $286 million (up$13 million or 4.7% excluding a $20 million recovery of prior years’ income taxes in 2005)
– P&C Canada down $4 million or 1.3% to $259 million (up $16 million or 6.9%excluding the $20 million recovery of prior years’ income taxes, due to strongvolume growth)
– P&C Chicagoland Banking down $3 million or 12% to $27 million (down US$2 millionor 4.6% on a U.S. dollar basis due to infrastructure spending)
• Private Client Group up $19 million or 25% to $96 million, due to strong revenuegrowth (adjusted for the sale of Harrisdirect)
• Investment Banking Group up $39 million or 19% to $245 million (up $76 million or45% excluding a $37 million after-tax gain on restructuring VIEs in 2005, due to strongrevenue growth and a low effective tax rate)
• Corporate Support down $7 million to $17 million (up $3 million excluding the$10 million after tax net benefit of a reduction of the general allowance and a litigationprovision in 2005)
Year-over-Year Operating Highlights for the Year to Date: � Net income of $1,274 million, up $72 million or 5.9%� EPS of $2.46, up 6.0%, and cash EPS of $2.49, up 3.8%� Excluding the $99 million after-tax net impact of significant items that benefited results
for the year-to-date period a year ago, net income increased $171 million or 15% andEPS increased $0.33 or 15% � ROE of 18.8%, compared with 19.5%� Productivity ratio improved 180 basis points to 62.1% and cash productivity ratio
improved 125 basis points to 61.7%
Bank of Montreal uses a unified branding approach that links all of the organization’s member companies. Bank of Montreal, together with its subsidiaries, isknown as BMO Financial Group. As such, in this quarterly report, the names BMO and BMO Financial Group mean Bank of Montreal, together with its subsidiaries.
MD&A commentary is as of May 24, 2006. Unless otherwise indicated, all amounts are in Canadian dollars and have been derived fromfinancial statements prepared in accordance with Canadian generally accepted accounting principles (GAAP).
Summary DataIncrease/(Decrease) Increase/(Decrease) Increase/(Decrease)
(Canadian $ in millions, except per share data and as noted) Q2-2006 vs. Q2-2005 vs. Q1-2006 YTD-2006 vs. YTD-2005
Revenue per financial statements 2,473 76 3% (8) – 4,954 146 3%Taxable equivalent basis (teb) adjustment 30 (1) (4%) (1) (3%) 61 2 3%
Revenue (teb) (1) 2,503 75 3% (9) – 5,015 148 3%Specific provision for credit losses 66 20 43% 14 27% 118 29 33%Reduction of the general allowance – 40 100% – – – 40 100%
Total provision for credit losses 66 60 +100% 14 27% 118 69 +100%Non-interest expense 1,571 (8) (1%) 26 2% 3,116 4 –Income taxes per financial statements 173 (25) (12%) (62) (26%) 408 (9) (2%)Taxable equivalent basis adjustment 30 (1) (4%) (1) (3%) 61 2 3%
Income taxes (teb) (1) 203 (26) (11%) (63) (23%) 469 (7) (2%)Non-controlling interest in subsidiaries 19 5 36% – – 38 10 36%Net income 644 44 7% 14 2% 1,274 72 6%
Amortization of intangible assets (after tax) 9 (12) (55%) – – 18 (22) (52%)Cash net income (1) 653 32 5% 14 2% 1,292 50 4%Earnings per share - basic ($) 1.27 0.08 7% 0.03 2% 2.51 0.14 6%Earnings per share - diluted ($) 1.24 0.08 7% 0.02 2% 2.46 0.14 6%Cash earnings per share - diluted ($) (1) 1.25 0.04 3% 0.01 1% 2.49 0.09 4%Return on equity (ROE) 19.1% (0.4%) 0.6% 18.8% (0.7%)Cash ROE (1) 19.3% (0.9%) 0.6% 19.0% (1.1%)Non-interest expense-to-revenue ratio 63.5% (2.4%) 1.2% 62.9% (1.8%)Non-interest expense-to-revenue (teb) ratio (1) 62.7% (2.3%) 1.2% 62.1% (1.8%)Cash non-interest expense-to-revenue (teb) ratio (1) 62.3% (1.7%) 1.2% 61.7% (1.2%)Net interest margin 1.45% (0.11%) (0.09%) 1.49% (0.09%)Net interest margin (teb) (1) 1.49% (0.11%) (0.09%) 1.53% (0.09%)
Operating Group net income:Personal and Commercial Client Group 286 (7) (2%) (14) (5%) 586 (1) –
P&C Canada 259 (4) (1%) (7) (3%) 525 (1) –P&C Chicagoland Banking 27 (3) (12%) (7) (21%) 61 – –
Private Client Group 96 19 25% 2 3% 190 40 27%Investment Banking Group 245 39 19% 17 7% 473 30 7%Corporate Support, including Technology and Solutions (T&S) 17 (7) (33%) 9 +100% 25 3 6%
BMO Financial Group net income 644 44 7% 14 2% 1,274 72 6%
(1) These are non-GAAP amounts or non-GAAP measures. Please see footnote 2 to the preceding Operating Highlightsabove and the Non-GAAP Measures section on page 6, which outline the use of non-GAAP measures in this document.
BMO Q2 06 Eng_v03.qxd 6/3/06 1:10 AM Page 1

Net income of $644 million for the second quarter ended April 30, 2006 was up $44 million or 7.1% from a year ago. EPS increased $0.08 or 6.9% to $1.24 and Cash EPS increased$0.04 or 3.3% to $1.25.
On May 24, 2006, BMO announced a $0.09 or 17% increase individends to $0.62 per common share in the third quarter andan increase in its target dividend payout range to 45-55% from35-45% of net income available to common shareholders.
“Earnings increased strongly from a year ago,” said TonyComper, President and Chief Executive Officer, BMO FinancialGroup on release of results on May 24, 2006. “InvestmentBanking Group earned record net income and Private ClientGroup’s results were its second-best ever, surpassed only by thefinal quarter of last year when we recorded significant gains onsales. P&C Canada continues to generate strong volume growth,while investing in strategic initiatives.
“I’m pleased to also announce that BMO is increasing its targetdividend payout range to 45-55% of net income available tocommon shareholders. The increase, from 35-45%, is reflectiveof our confidence in our continued ability to generate earningsand our strong capital position. Our disciplined approach tocapital management will allow us to continue to execute ourattractive growth strategies and continue our longstandingcommitment to enhancing shareholder value.
“In keeping with our new payout target, I’m also pleased toannounce a 17% increase in our third quarter dividend tocommon shareholders, which will grow by $0.09 to $0.62 percommon share, up 35% from a year ago.”
Net income increased $111 million or 21% from the secondquarter a year ago excluding the significant items outlined belowfrom results in 2005. On a similarly-adjusted basis, EPSincreased $0.21 or 20% and Cash EPS increased $0.17 or 16%.
Net income in the second quarter of 2005 was increased by the$67 million ($0.13 per share) after-tax net impact of:� A $44 million ($37 million after tax) revenue increase in
Investment Banking Group related to the restructuring ofcustomer securitization variable interest entities (VIEs);
� A $40 million ($26 million after tax) reduction in the generalallowance for credit losses reflected in Corporate Support;
� A $20 million recovery of prior years’ income taxes recordedin Personal and Commercial Client Group; and
� A $25 million ($16 million after tax) litigation provisionreflected in Corporate Support expenses.
Adjusted for the impact of last year’s sale of Harrisdirect, therewas robust revenue growth in Private Client Group that drove a$19 million or 25% increase in its net income. The benefit ofstrong revenue growth and a low tax rate drove improvedperformance in Investment Banking Group where net incomeincreased $39 million, but increased $76 million or 45%excluding revenue recognized on restructuring VIEs in the year-ago period. Personal and Commercial Client Group net incomedeclined $7 million from the second quarter of 2005, butincreased $13 million or 4.7% excluding the recovery of prioryears’ income taxes recognized in the previous year. Theincrease was driven largely by improved volumes.
Net income improved $14 million or 2.0% from the alreadystrong results of the first quarter. Higher provisions for creditlosses, lower trading revenues and costs of investing for futuregrowth in our retail banking and wealth management platformswere offset by the benefit of a low tax rate.
Investment Banking Group net income improved by $17 millionor 7.3% from the first quarter, as a low effective tax rate andreduced expenses more than offset lower revenues. PrivateClient Group net income rose $2 million or 2.5%, as solidrevenue growth offset higher revenue-based costs. CorporateSupport net income increased $9 million due to reducedexpenses. Personal and Commercial Client Group net incomedeclined by $14 million or 4.7%, as improved volumes wereoffset by reduced net interest margin, increased costs and theimpact of three fewer calendar days in the second quarter.
Year to date, net income of $1,274 million rose $72 million or5.9% from the comparable period in 2005. EPS was $2.46, up$0.14 or 6.0%, and cash EPS was $2.49, up $0.09 or 3.8%. Therewere five significant items in the year-to-date period ended April30, 2005, comprising the four amounts itemized above plus a$32 million recovery of prior years’ income taxes in InvestmentBanking Group’s results in the first quarter of 2005. Thesesignificant items increased BMO’s earnings for the comparableperiod in 2005 by a net $99 million ($0.19 per share). Excludingthose significant items of a year ago, net income for the year todate increased $171 million or 15%. On a similarly-adjustedbasis, EPS for the year-to-date period rose $0.33 or 15% and cashEPS rose $0.28 or 13%.
Personal and Commercial Client Group net income for the yearto date declined $1 million, but increased by $19 million or 3.4%excluding the recovery of prior years’ income taxes in the year-ago period, driven by strong volume growth, partially offset bythe impact of reduced net interest margins, higher provisions forcredit losses and increased expenses. Private Client Group netincome increased $40 million or 27%, as strong revenue growth,adjusting for the sale of Harrisdirect, more than offset increasedrevenue-based costs. Investment Banking Group net incomeincreased $30 million, but excluding the VIE revenue and therecovery of prior years’ income taxes in 2005, net incomeincreased $99 million or 26%, as strong revenue growth morethan offset higher performance-based costs.
“We have delivered strong year-to-date performance andremain on track to achieve the financial targets we set for theyear,” added Mr. Comper. “We continue to successfully balancethe need to invest for future growth with our commitment toachieve our annual targets.”
Revenue1 for the quarter increased $75 million or 3.0% froma year ago to $2,503 million, but increased $128 million or 5.4%excluding Harrisdirect and $172 million or 7.4% after alsoexcluding the VIE revenues of a year ago. The weaker U.S. dollarlowered revenue growth by $48 million or 2.0%. Personal andCommercial Client Group revenue increased $53 million or 4.1%due to strong volume growth in personal and commercial prod-ucts, partially offset by reduced securitization revenue and theeffects of lower net interest margins and the weaker U.S. dollar.
2 | BMO Financial Group Second Quarter Report 2006
Management’s Discussion and Analysis
Performance Overview
1 On a taxable equivalent basis – see the GAAP and Related Non-GAAP Measures section.
BMO Q2 06 Eng_v03.qxd 6/3/06 1:10 AM Page 2

BMO Financial Group Second Quarter Report 2006 | 3
Private Client Group revenue decreased $16 million or 3.4%, butincreased $37 million or 8.1% excluding Harrisdirect and$43 million or 9.4% after also excluding the impact of the weakerU.S. dollar. The Group’s revenue growth was broadly based.Investment Banking Group’s revenue increased $46 million or6.8%, but increased $90 million or 14% excluding VIE revenuesand $117 million or 18% after also excluding the impact of theweaker U.S. dollar. Trading revenue was up appreciably due tofavourable trading conditions and increased client activitiesassociated with higher volatility in energy prices. Securitiescommissions and equity and debt underwriting activities alsoincreased. BMO’s net investment securities gains were$30 million in the quarter, up from a relatively low $12 millionof gains in the second quarter of 2005.
Revenue declined $9 million or 0.4% from the first quarter, inpart due to three fewer calendar days in the second quarter.Personal and Commercial Client Group revenue was up$3 million, as the effects of volume growth were partially offsetby the impact of fewer days, lower net interest margin and theweaker U.S. dollar. Investment Banking Group revenue declinedby $17 million or 2.3% due to lower merger and acquisition feesthis quarter and particularly high trading revenues in the firstquarter. However, equity and debt underwriting fees increasedtogether with securities commissions. Private Client Grouprevenue increased $23 million or 4.9% due primarily to highercommission and fee-based revenue in full-service investing andincreased client trade volumes in direct investing.
Year to date, revenue rose $148 million or 3.0% to$5,015 million, but increased $256 million or 5.4% excludingHarrisdirect and $300 million or 6.3% after also excluding VIErevenues. The weaker U.S. dollar lowered revenue growth by$78 million or 1.6%. Year-to-date revenue growth was largelyattributable to the same factors that contributed to the quarter’syear-over-year growth.
BMO’s overall net interest margin1 was 1.49% in the secondquarter of 2006, a decline of 11 basis points from a year ago, and9 basis points from the first quarter. Two-thirds of the declinefrom the first quarter was attributable to the decline inInvestment Banking Group. Net interest margins in P&C Canadaand Investment Banking Group both declined relative to a yearago and relative to the first quarter. P&C Chicagoland Banking’smargin declined from a year ago but improved from the firstquarter. Net interest margins are detailed in the Revenue sectionon page 7.
Non-interest expense in the second quarter of 2006 decreased$8 million or 0.5% from a year ago to $1,571 million, butincreased $50 million or 3.3% excluding Harrisdirect and$75 million or 5.0% after also excluding last year’s litigationprovision. The weaker U.S. dollar lowered expense growth by$32 million or 2.0%. There were increased performance-basedcosts in Investment Banking Group and higher revenue-basedcosts in Private Client Group. Retail and business banking costsrose due to higher employee-related costs resulting from anexpansion of both our retail and commercial sales forces inCanada and acquisitions and associated integration costs in P&CChicagoland Banking as well as the costs of new branches.Increased initiative expenditures in both Canada and the UnitedStates added to retail and business banking expenses.
Non-interest expense increased $26 million or 1.6% from thefirst quarter. There were increased marketing costs and higherexpenses due to investing in our physical distribution network inCanadian retail and business banking. Acquisitions, increasedcredit origination and marketing expenses as well as a majorbranch technology initiative added to costs in P&C ChicagolandBanking. There were increases in revenue-based costs in PrivateClient Group, while Investment Banking Group’s costs declineddespite higher performance-based costs. Expenses were loweredby the impact of three fewer calendar days in the second quarter.
Year to date, non-interest expense was relatively unchanged at$3,116 million, but increased $119 million or 4.0% excludingHarrisdirect and $144 million or 4.9% after also excluding lastyear’s litigation provision. The weaker U.S. dollar loweredexpense growth by $50 million or 1.6%. Increased expenses wereprimarily due to the same factors that contributed to higherexpenses in the second quarter relative to a year ago.
The productivity ratio was 62.7% in the second quarter of2006, compared with 65.0% a year ago. The cash productivityratio improved 170 basis points to 62.3%, or by 117 basis pointsexcluding Harrisdirect in the year-ago period. Our productivityand cash productivity ratios deteriorated 123 basis points fromthe first quarter. Year to date, our productivity ratio improved180 basis points from the comparable period in 2005, while ourcash productivity ratio improved by 125 basis points, thediffering rates of change relating largely to the sale ofHarrisdirect and the resulting reduction in the amortization ofintangible assets, a non-cash charge.
Although up from a year ago, specific provisions for creditlosses remain at low levels, totalling $66 million in the secondquarter, compared with $46 million a year ago and $52 million inthe first quarter. There was a $40 million reduction in thegeneral allowance for credit losses in the second quarter of 2005.Specific provisions for credit losses were $118 million for theyear to date, compared with $89 million a year ago. The overallprovision for credit losses for the comparable year-to-date periodin 2005 was $49 million, including the $40 million reduction inthe general allowance, compared to $118 million for the currentyear to date. We continue to anticipate specific provisions forcredit losses of $325 million or less in fiscal 2006, below the 2006annual target of $400 million or less established at the beginningof the year.
Net income from U.S.-based businesses totalled US$100 millionin the second quarter of 2006, compared with US$106 million ayear ago and US$109 million in the first quarter. ExcludingUS$23 million of net income recognized in U.S. results on therestructuring of VIEs in the prior year, net income improvedUS$17 million from a year ago as stronger commodity derivativestrading revenues were only partially offset by higher expenses.The decrease from the first quarter was due to reduced earningsin P&C Chicagoland Banking and Private Client Group. Lowercommodity derivatives trading revenues in Investment BankingGroup were largely offset by improved commission revenues andreduced expenses.
1 On a taxable equivalent basis – see the GAAP and Related Non-GAAP Measures section.
BMO Q2 06 Eng_v03.qxd 6/3/06 1:10 AM Page 3

The Tier 1 capital ratio was 10.17%, down from 10.38% atthe end of the first quarter and 10.25% at the end of 2005. Thedecreases were primarily attributable to increases in risk-weighted assets, largely due to loan growth in Personal andCommercial Client Group and Investment Banking Group.
During the quarter, we repurchased 1,861,300 Bank ofMontreal common shares under our common share repurchaseprogram at an average cost of $65.63 per share, for a total cost of$122 million. There have been 3,215,800 common shares repur-chased under the existing normal-course issuer bid that expireson September 5, 2006 and pursuant to which BMO is permittedto repurchase for cancellation up to 15 million Bank of Montrealcommon shares, representing approximately 3% of BMO’s publicfloat. Our common share repurchase program is primarilyintended to offset, over time, the impact of dilution caused by theexercise of stock options, our dividend reinvestment plan andthe conversion of convertible shares.
Bank of Montreal has an equity ownership interest inMasterCard Incorporated. On May 5, 2006, MasterCard filed apreliminary prospectus in connection with a proposed initialpublic offering in the United States. A portion of Bank ofMontreal’s interest in MasterCard is expected to be redeemed aspart of the initial public offering process. If the transaction iscompleted on the terms outlined in the preliminary prospectus,BMO could realize an after-tax gain of approximatelyCDN$20-$30 million on our redeemed interest. The actual gainwill vary depending on the pricing and expenses of the offering,the gross proceeds realized by MasterCard, the number of sharesactually redeemed and exchange rates.
2006 Earnings and Economic OutlookWe remain on track to achieve the annual targets for 2006outlined above, which were established at the end of 2005. Wenow expect that the Canadian economy will grow at a respectablepace of 3.2% in 2006, compared with 2.9% in 2005. Businessinvestment is expected to remain strong, as we anticipatecontinued healthy profit growth. This should support growth inbusiness lending. In contrast, the housing market is expected to
moderate from extremely high levels of activity as past increasesin interest rates dampen demand for residential mortgages. Thestrong Canadian dollar will also likely restrain economic growththis year. Nevertheless, the continued solid economic expansionshould support fee-based investment banking activities in 2006.High commodity prices and general weakness in the U.S. dollarare expected to continue to support the Canadian dollar, which inturn should limit further increases in interest rates. We anticipatethat the resource-producing Western provinces will continue tolead Canada’s economy this year.
The U.S. economy is now projected to expand at a moderatelystrong rate of 3.5% in 2006, similar to last year’s pace. Continuedstrong business investment resulting from healthy corporatebalance sheets is expected to drive the expansion, and shouldsupport business loan growth. Although the Federal Reserveappears to be near the end of its tightening cycle, past increases ininterest rates will likely temper demand for residential mortgagesand personal loans. Despite a low unemployment rate and highenergy costs, inflation should be restrained by high productivitygrowth and intense global competition. The U.S. dollar isexpected to continue to depreciate against most major currenciesin response to the large U.S. trade deficit.
Management’s Responsibility for Financial Information A rigorous and comprehensive financial governance frameworkis in place at BMO and its subsidiaries at both the managementand board levels. Each year, BMO’s Annual Report contains astatement signed by the Chief Executive Officer (CEO) and ChiefFinancial Officer (CFO) outlining management’s responsibilityfor financial information contained in the report. BMO filedcertifications, signed by the CEO and CFO, with the CanadianSecurities Administrators and the SEC in the United States inDecember 2005 when we filed our Annual Report and otherannual disclosure documents. In those filings, BMO’s CEO andCFO certify, as required in Canada by Multilateral Instrument52-109 (Certification of Disclosure in Issuers’ Annual and InterimFilings) and in the United States by the Sarbanes-Oxley Act, theappropriateness of the financial disclosures in our annual filingsand the effectiveness of our disclosure controls and procedures.BMO’s CEO and CFO certify the appropriateness of the financialdisclosures in our interim filings with securities regulators,including this MD&A and the accompanying unaudited interimconsolidated financial statements for the period ended April 30,2006. They also certify that they are responsible for the design ofdisclosure controls and procedures.
As in prior quarters, BMO’s audit committee reviewed thisMD&A and the attached unaudited interim consolidated financialstatements, and BMO’s Board of Directors approved thesedocuments prior to their release.
A comprehensive discussion of our businesses, strategies andobjectives can be found in Management’s Discussion and Analysisin BMO’s 2005 Annual Report, which can be accessed on our website at www.bmo.com/investorrelations. Readers are also encour-aged to visit the site to view other quarterly financial information.
4 | BMO Financial Group Second Quarter Report 2006
Management’s Discussion and Analysis
Annual Targets for 2006
� 5% to 10% EPS growth from a baseof $4.59 (excluding changes in thegeneral allowance)� ROE of 17% to 19%� Specific provision for credit losses of
$400 million or less
We continue to anticipate specificprovisions of $325 million or less in fiscal 2006, as estimated in thefirst quarter
� Tier 1 capital ratio of at least 8.0%� Improve our cash productivity ratio
by 100 to 150 basis points
Year-to-date Performance to April 30, 2006� EPS of $2.46, up 8.4% from $2.27
(excluding changes in the generalallowance) � ROE of 18.8% annualized� Specific provision for credit losses
of $118 million
� Tier 1 capital ratio of 10.17%� Cash productivity improvement of
125 basis points year-over-year
BMO Q2 06 Eng_v03.qxd 6/6/06 6:05 PM Page 4

BMO Financial Group Second Quarter Report 2006 | 5
Caution regarding forward-looking statements Bank of Montreal’s public communications often include written or oral forward-looking statements. Statements of this type are included in this document, and may be includedin other filings with Canadian securities regulators or the U.S. Securities and Exchange Commission, or in other communications. All such statements are made pursuant to the’safe harbor’ provisions of the United States Private Securities Litigation Reform Act of 1995 and of any applicable Canadian securities legislation. Forward-looking statementsmay involve, but are not limited to, comments with respect to our objectives and priorities for 2006 and beyond, our strategies or future actions, our targets, expectations forour financial condition or share price, and the results of or outlook for our operations or for the Canadian and U.S. economies.
By their nature, forward-looking statements require us to make assumptions and are subject to inherent risks and uncertainties. There is significant risk that predictions,forecasts, conclusions or projections will not prove to be accurate, that our assumptions may not be correct and that actual results may differ materially from such predictions,forecasts, conclusions or projections. We caution readers of this quarterly report not to place undue reliance on our forward-looking statements as a number of factors couldcause actual future results, conditions, actions or events to differ materially from the targets, expectations, estimates or intentions expressed in the forward-looking statements.
The future outcomes that relate to forward-looking statements may be influenced by many factors, including but not limited to: general economic conditions in the countriesin which we operate; interest rate and currency value fluctuations; changes in monetary policy; the degree of competition in the geographic and business areas in which weoperate; changes in laws; judicial or regulatory proceedings; the accuracy and completeness of the information we obtain with respect to our customers and counterparties; ourability to execute our strategic plans and to complete and integrate acquisitions; critical accounting estimates; operational and infrastructure risks; general political conditions;global capital market activities; the possible effects on our business of war or terrorist activities; disease or illness that impacts on local, national or international economies,and disruptions to public infrastructure, such as transportation, communications, power or water supply; and technological changes.
We caution that the foregoing list is not exhaustive of all possible factors. Other factors could adversely affect our results. For more information, please see the discussion onpages 29 and 30 of BMO’s 2005 Annual Report, which outlines in detail certain key factors that may affect BMO’s future results. When relying on forward-looking statements tomake decisions with respect to Bank of Montreal, investors and others should carefully consider these factors, as well as other uncertainties and potential events, and theinherent uncertainty of forward-looking statements. Bank of Montreal does not undertake to update any forward-looking statement, whether written or oral, that may bemade, from time to time, by the organization or on its behalf.
Assumptions on how the Canadian and U.S. economies will perform in 2006 and how that impacts our businesses were material factors we considered when setting ourstrategic priorities and objectives and in determining our financial targets for the 2006 fiscal year, including provisions for credit losses. Key assumptions included that theCanadian and U.S. economies would expand at a healthy pace in 2006 and that inflation would remain low. We also assumed that interest rates would increase gradually inboth countries in 2006 and the Canadian dollar would hold onto its recent gains. We believe that these assumptions are still valid and have continued to rely upon them inconsidering our ability to achieve our 2006 financial targets. In determining our expectations for economic growth, both broadly and in the financial services sector, we primarilyconsider historical economic data provided by the Canadian and U.S. governments and their agencies. Tax laws in the countries in which we operate, primarily Canada andthe United States, are material factors we consider when determining our sustainable effective tax rate.
Regulatory FilingsOur continuous disclosure materials, including our interimfilings, annual MD&A and audited consolidated financial state-ments, our Annual Information Form and the Notice of Annual
Meeting of Shareholders and Proxy Circular are available on ourweb site at www.bmo.com/investorrelations, on the CanadianSecurities Administrators’ web site at www.sedar.com and on theEDGAR section of the SEC’s web site at www.sec.gov.
BMO Q2 06 Eng_v03.qxd 6/3/06 1:10 AM Page 5

6 | BMO Financial Group Second Quarter Report 2006
Management’s Discussion and Analysis
Financial Performance Review
GAAP and Related Non-GAAP Measures used in the MD&A
(Canadian $ in millions, except as noted) Q2-2006 Q1-2006 Q2-2005 YTD-2006 YTD-2005
Net interest income per financial statements (a) 1,113 1,182 1,181 2,295 2,379 Non-interest revenue 1,360 1,299 1,216 2,659 2,429
Revenue per financial statements (b) 2,473 2,481 2,397 4,954 4,808
Taxable equivalent basis (teb) adjustment (c) 30 31 31 61 59
Net interest income (teb) (a+c) (d) (1) 1,143 1,213 1,212 2,356 2,438 Non-interest revenue 1,360 1,299 1,216 2,659 2,429
Revenue (teb) (e) (1) 2,503 2,512 2,428 5,015 4,867
Provision for income taxes per financial statements 173 235 198 408 417 Taxable equivalent basis adjustment 30 31 31 61 59
Provision for income taxes (teb) (1) 203 266 229 469 476
Non-interest expense (f) 1,571 1,545 1,579 3,116 3,112 Amortization of intangible assets (12) (11) (24) (23) (48)
Cash-based expense (g) (1) 1,559 1,534 1,555 3,093 3,064
Net income 644 630 600 1,274 1,202 Amortization of intangible assets, net of income taxes 9 9 21 18 40
Cash net income (1) 653 639 621 1,292 1,242 Preferred share dividends (8) (8) (8) (16) (16)Charge for capital (1) (350) (353) (317) (703) (639)
Net economic profit (1) 295 278 296 573 587
Non-interest expense-to-revenue ratio (2) (%) ((f/b) x 100) 63.5 62.3 65.9 62.9 64.7Non-interest expense-to-revenue (teb) ratio (1) (2) (%) ((f/e) x 100) 62.7 61.5 65.0 62.1 63.9Cash non-interest expense-to-revenue (teb) ratio (1) (2) (%) ((g/e) x 100) 62.3 61.1 64.0 61.7 62.9Net interest margin annualized (%) ((a/average assets) x 100) 1.45 1.54 1.56 1.49 1.58Net interest margin (teb) annualized (1) (%) ((d/average assets) x 100) 1.49 1.58 1.60 1.53 1.62EPS (uses net income) ($) 1.24 1.22 1.16 2.46 2.32Cash EPS (1) (uses cash net income) ($) 1.25 1.24 1.21 2.49 2.40
(1) These are non-GAAP amounts or non-GAAP measures.(2) Also referred to as productivity ratio and cash productivity ratio.
BMO uses both GAAP and certain non-GAAP measures toassess performance. Securities regulators require that companiescaution readers that earnings and other measures adjusted to abasis other than GAAP do not have standardized meanings underGAAP and are unlikely to be comparable to similar measuresused by other companies. The preceding table reconciles thenon-GAAP measures, which management regularly monitors,to their GAAP counterparts.
Cash earnings and cash productivity measures may enhancecomparisons between periods when there has been an acquisi-tion, particularly because the purchase decision may notconsider the amortization of intangible assets to be a relevantexpense. Cash EPS measures are also disclosed because analystsoften focus on this measure, and cash EPS is used by ThomsonFirst Call to track third-party earnings estimates that arefrequently reported in the media. Cash measures add the after-tax amortization of intangible assets to GAAP earnings to derivecash net income (and associated cash EPS) and deduct the amor-tization of intangible assets from non-interest expense to derivecash productivity measures.
BMO, like many banks, analyzes revenue, and ratios computedusing revenue, on a taxable equivalent basis (teb). This basisincludes an adjustment that increases GAAP revenues and theGAAP provision for income taxes by an amount that would raiserevenues on certain tax-exempt securities to a level equivalent toamounts that would incur tax at the statutory rate. The effectiveincome tax rate is also analyzed on a taxable equivalent basis forconsistency of approach. Analysis on a taxable equivalent basisneutralizes the impact on ratios of investing in tax exempt ortax-advantaged securities rather than fully taxable securities withhigher yields. It reduces distortions in ratios between periodsand between institutions related to the choice of tax-advantagedand taxable investments. In this MD&A, all revenues and taxamounts and related ratios are stated on a taxable equivalentbasis, unless indicated otherwise.
Net economic profit represents cash net income available tocommon shareholders, less a charge for capital, and is consideredan effective measure of economic value added.
BMO Q2 06 Eng_v03.qxd 6/3/06 1:10 AM Page 6

BMO Financial Group Second Quarter Report 2006 | 7
Foreign Exchange
The Canadian dollar equivalents of BMO’s U.S.-dollar-denomi-nated revenues, expenses, provision for credit losses, incometaxes and net income in the first and second quarters of 2006were lowered relative to the comparable periods by the weak-ening of the U.S. dollar. The following table indicates therelevant average Canadian/U.S. dollar exchange rates and theimpact of changes in the rates. At the start of each quarter, BMOenters into hedging transactions that are expected to partiallyoffset the pre-tax effects of exchange rate fluctuations in thequarter on our U.S. dollar net income for that quarter. As such,these activities partially mitigate the impact of exchange ratefluctuations within a single quarter.
The gain or loss from hedging transactions in future periodswill be determined by both future currency fluctuations and theamount of underlying future hedging transactions, since thetransactions are entered into each quarter in relation to expectedU.S.-dollar-denominated net income for the next three months.The effect of currency fluctuations on our investments in foreignoperations is discussed in the Income Taxes section on page 11.
Effects of U.S. dollar exchange rate fluctuations on BMO’s results
Q2-2006 YTD-2006
(Canadian $ millions, except as noted) vs. Q2-2005 vs. Q1-2006 vs. YTD-2005
Canadian/U.S. dollar exchange rate (average)Current period 1.1413 1.1413 1.1489Prior period 1.2336 1.1562 1.2216
Reduced net interest income (16) (3) (28)Reduced non-interest revenue (32) (5) (50)
Reduced total revenue (48) (8) (78)Reduced expense 32 5 50Reduced provision for credit losses – – 1Reduced income taxes 6 1 18
Reduced net income before hedging gains (10) (2) (9)Hedging gains 7 7 8Income taxes thereon (2) (2) (2)
Increased (reduced) net income (5) 3 (3)
Value Measures Annualized ROE was 19.1% for the quarter, compared with19.5% a year ago and 18.5% in the first quarter. Year to date,annualized ROE was 18.8%, in line with our annual target of17% to 19% ROE, but down from 19.5% a year ago, as a resultof higher equity.
EPS of $1.24 increased $0.08 or 6.9% from the second quarterof 2005 and $0.02 or 1.6% from the first quarter. Year to date, EPSof $2.46 was up $0.14 or 6.0% from the comparable period a yearago. Excluding the reduction of the general allowance in 2005,EPS for the year-to-date period was up 8.4%, in line with ourannual target of 5% to 10% EPS growth on that basis.
Net economic profit (NEP) was $295 million (see the precedingNon-GAAP Measures section), compared with $296 million inthe second quarter of 2005. Year to date, NEP was $573 million,down from $587 million in the first six months of 2005, again dueto higher equity.
The total shareholder return (TSR) on an investment in BMOcommon shares was (4.6%) in the second quarter, following areturn of 19.1% in the first quarter. BMO’s TSR was 17.7% for thetwelve months ended April 30, 2006, while BMO’s averageannual TSR for the five-year period ended April 30, 2006 was16.4%, the fourth best of Canada’s major banks and above thecomparable S&P/TSX Composite average annual total return of11.0%. The five-year average annual TSR is our primary measureof shareholder value and the most important of our financialperformance and condition measures. Our governing objective isto maximize shareholder value and generate, over time, firstquartile total shareholder returns relative to our Canadian andNorth American peer groups.
Net Income Net income and variances in net income between periods werereviewed in the preceding Performance Overview. Net income byoperating group is reviewed in more detail in the Review ofOperating Group Performance that follows.
Net income from U.S.-based businesses totalled $112 millionor 17.4% of BMO’s net income in the quarter, compared with$129 million and 21.5% a year ago. U.S. results in the secondquarter of 2005 included $29 million of the revenue fromrestructuring VIEs (and $29 million of related net income sincethe VIEs in the United States are non-taxable entities). Year todate, net income from U.S.-based businesses totalled $239 millionor 18.8% of BMO’s net income, compared with $285 million and23.7% for the comparable period in 2005.
Revenue As explained in the preceding Non-GAAP Measures section onpage 6, BMO, like many banks, analyzes revenue on a taxableequivalent basis (teb) and all revenues and ratios computedusing revenue in this MD&A are stated on that basis.
Total revenue and variances in total revenue were reviewedin the preceding Performance Overview section.
Net Interest Margin (teb)
Increase Increase Increase
(Decrease) (Decrease) (Decrease)
(In basis points) Q2-2006 vs. Q2-2005 vs. Q1-2006 YTD-2006 vs. YTD-2005
P&C Canada 252 (12) (6) 255 (11)P&C Chicagoland Banking 345 (10) 5 342 (15)
Personal and Commercial Client Group 268 (11) (3) 270 (11)Private Client Group 882 49 29 867 57 Investment Banking Group 43 (22) (8) 47 (19)Corporate Support, including Technology and Solutions (T&S) nm nm nm nm nm
Total BMO 149 (11) (9) 153 (9)
nm – not meaningful
BMO Q2 06 Eng_v03.qxd 6/3/06 1:10 AM Page 7

Net interest income was $1,143 million, a decrease of$69 million from the second quarter of last year. Net interestmargin was 1.49%, down 11 basis points from a year ago, or by23 basis points excluding the impact of VIE assets as discussedin the following paragraph. Average assets rose $3.2 billion.Average assets of Personal and Commercial Client Groupincreased $10 billion largely due to residential mortgages, whichhave continued to grow strongly due to active housing markets.Investment Banking Group’s average assets fell by $6 billion, butincreased by $15 billion after adjusting for VIE assets as discussedin the following paragraph. The increase was attributable tohigher derivative assets, trading securities, reverse repos andcorporate loans.
BMO’s net interest margin was lowered by approximately12 basis points in the first and second quarters of 2005 becausewe were required to consolidate $21 billion of variable interestentity (VIE) assets in BMO’s balance sheet in the first half of2005. The VIE assets lowered Investment Banking Group’s netinterest margin by approximately 9 basis points in the first andsecond quarters of 2005. On April 29, 2005, we completed arestructuring of these VIEs; consequently, the VIE assets were nolonger included in BMO’s balance sheet as of that date.
Personal and Commercial Client Group net interest margin fell11 basis points from a year ago. P&C Canada net interest marginwas 12 basis points lower, due to personal loans growing fasterthan deposits, aggressive mortgage pricing in a competitivemarket and the interest rate environment. Rising interest ratescaused narrower spreads on variable rate mortgage and loanproducts. In addition, the absolute low level of all interest ratescontributed to the margin decline, mitigated by pricing actions incertain deposit categories. P&C Chicagoland Banking net interestmargin was 10 basis points lower due to assets, primarilyconsumer loans, growing faster than deposits and competitivepressures on loan pricing. Investment Banking Group netinterest margin fell 22 basis points due to lower trading netinterest income and lower spreads on corporate loans in thecompetitive rate environment in the United States and ininterest-rate-sensitive businesses in the rising interest rateenvironment. Excluding the impact of VIEs in 2005, the Group’snet interest margin declined 31 basis points.
Net interest income includes interest earned on trading assetsand the associated costs of funding those assets. The differencebetween these two amounts represents our trading net interestincome. Most of the revenue related to these trading assetsconsists of mark-to-market gains. These gains are included innon-interest trading revenues and are significantly higher thantrading net interest income. Trading net interest income wasmarginally negative this quarter, as compared with positivetrading net interest income in the second quarter of last year andpositive, but low, trading net interest income in the first quarter,due primarily to increased funding costs. The changescontributed to reductions in net interest margin in InvestmentBanking Group. Total interest and non-interest trading revenueswere $179 million in the second quarter, up $48 million from theprior year but down $52 million from the record tradingrevenues of the first quarter.
Relative to the first quarter, net interest income fell $70 million,in part due to three fewer calendar days in the second quarter.Average assets rose $8.9 billion, of which approximately two-
thirds was attributable to Investment Banking Group. Netinterest margin fell 9 basis points to 1.49%. Two-thirds of thedecline from the first quarter was attributable to the decline inInvestment Banking Group. Net interest margin in Personal andCommercial Client Group fell 3 basis points. P&C Canada netinterest margin fell 6 basis points due to pricing aggressively inthe competitive mortgage market and total personal loansgrowing faster than deposits. P&C Chicagoland Banking netinterest margin rose 5 basis points due to improved spread ondeposits, partially offset by a decrease in loan spreads caused bycompetitive pressures. Net interest margin in InvestmentBanking Group fell 8 basis points due to lower trading netinterest income and lower cash collections on previouslyimpaired loans.
Year to date, net interest income decreased $82 million to$2,356 million. Average assets increased $6 billion but were$27 billion higher, adjusted for the VIE assets. Again, approxi-mately two-thirds of the latter increase was attributable toInvestment Banking Group. BMO’s overall net interest marginwas down 9 basis points or by 21 basis points excluding theimpact of VIE assets, for reasons that are largely consistent withthe second quarter decline relative to a year ago.
BMO’s non-interest revenue in the second quarter increased$144 million or 12% from the prior year to $1,360 million, butincreased $180 million or 15% excluding Harrisdirect and$224 million or 20% after also excluding VIE revenues.Investment Banking Group’s revenue increased as equity, foreignexchange and particularly commodity derivatives tradingrevenues were up sharply due to favourable trading conditionsand increased client activities associated with higher volatility inenergy prices. Equity and debt underwriting activities rosesharply, while merger and acquisition and commission revenuesalso increased. Private Client Group non-interest revenue was upstrongly, after adjusting for the prior year’s $36 million contribu-tion from Harrisdirect. The increase was driven by improvedtrade volumes in direct investing and higher commission andfee-based revenue in full-service investing, including highermutual fund fees. In P&C Canada, there were higher cards andinsurance revenues and increased sales of term investmentproducts and mutual funds. BMO’s net investment securitiesgains were $30 million in the quarter, up from a relatively low$12 million of gains in the second quarter of 2005. However,securitization revenue declined $29 million from a year ago.There were gains on the sales of securitized assets in 2005 andlosses in the current quarter. The gain/loss on a sale is largelyrelated to the yield on securitized assets relative to market yields.The weaker U.S. dollar reduced the overall pace of growth innon-interest revenues.
Relative to the first quarter, non-interest revenue rose$61 million or 4.7%. There was strong growth in Private ClientGroup due primarily to higher commissions and fee-basedrevenue in full-service investing and increased client tradevolumes in direct investing. Personal and Commercial ClientGroup non-interest revenue also rose strongly, driven byincreased investment securities gains, higher cards and insurancerevenues and increased sales of term investment and mutualfund products, partially offset by lower securitization revenue.Investment Banking Group non-interest revenue increased dueto strong equity and debt underwriting and commissions
8 | BMO Financial Group Second Quarter Report 2006
Management’s Discussion and Analysis
BMO Q2 06 Eng_v03.qxd 6/3/06 1:10 AM Page 8

BMO Financial Group Second Quarter Report 2006 | 9
revenues, partially offset by reductions in trading revenues andmerger and acquisition fees. Overall growth in non-interestrevenues was curtailed by three fewer calendar days in thecurrent quarter and the impact of the weaker U.S. dollar.
Year to date, non-interest revenue increased $230 million or9.4% to $2,659 million, but increased $305 million or 13%excluding Harrisdirect and $349 million or 15% after alsoexcluding VIE revenues. Investment Banking Group revenue wasmuch higher as increased commodity derivatives and othertrading revenues were up sharply due to favourable tradingconditions and increased client activities associated with highervolatility in energy prices. Merger and acquisition revenueimproved significantly, while securities commissions and debtand equity underwriting revenue also increased. BMO’s invest-ment securities gains were comparable to the prior period.Private Client Group non-interest revenue was up strongly, afteradjusting for the prior year’s $75 million contribution fromHarrisdirect. The growth was driven by increased managedassets levels in the mutual fund businesses and higher commis-sion and fee-based revenue in our brokerage businesses.Personal and Commercial Client Group revenue also increaseddue to higher cards and insurance revenues and increased salesof term investment and mutual fund products, partially offset bylower securitization revenue. The weaker U.S. dollar reduced theoverall pace of growth in non-interest revenues.
Non-Interest ExpenseNon-interest expense in the second quarter of 2006 decreased$8 million or 0.5% from a year ago to $1,571 million, butincreased $50 million or 3.3% excluding Harrisdirect and$75 million or 5.0% after also excluding last year’s $25 millionlitigation provision. The weaker U.S. dollar lowered expensegrowth by $32 million or 2.0%. There were increased perform-ance-based costs in Investment Banking Group and higher
revenue-based costs in Private Client Group. In Canada, retailand business banking costs rose due to higher employee-relatedcosts resulting from an expansion of both our retail and commer-cial sales forces and higher marketing costs. Costs of newbranches and integrating acquired businesses increasedexpenses in P&C Chicagoland Banking. Increased initiativeexpenditures in both Canada and the United States added toretail and business banking expenses.
Non-interest expense increased $26 million or 1.6% from thefirst quarter. There were increased marketing costs and higherexpenses due to investing in our physical distribution network inCanadian retail and business banking. Acquisitions, increasedcredit origination and marketing expenses as well as branchtechnology initiatives added to costs in P&C ChicagolandBanking. There were increases in revenue-based costs in PrivateClient Group, while Investment Banking Group costs declinedslightly, despite higher performance-based costs.
Year to date, non-interest expense was relatively unchanged at$3,116 million, but increased $119 million or 4.0% excludingHarrisdirect and $144 million or 4.9% after also excluding lastyear’s litigation provision. The weaker U.S. dollar loweredexpense growth by $50 million or 1.6%. The increase wasprimarily due to the same factors that contributed to higherexpenses in the second quarter relative to a year ago.
The productivity ratio was 62.7% in the second quarter of2006, compared with 65.0% a year ago. The cash productivityratio improved 170 basis points to 62.3%, or by 117 basis pointsexcluding Harrisdirect in the year-ago period. Our productivityand cash productivity ratios deteriorated 123 basis points fromthe first quarter. Year to date, our productivity ratio improved180 basis points from a year ago while our cash productivity ratioimproved by 125 basis points, the differing rates of changerelating largely to the sale of Harrisdirect and the resulting reduc-tion in the amortization of intangible assets, a non-cash charge.
Risk Management
Provisions for Credit Losses (PCL)
(Canadian $ in millions, except as noted) Q2-2006 Q1-2006 Q2-2005 YTD-2006 YTD-2005
New specific provisions 116 89 108 205 201Reversals of previously established allowances (15) (17) (47) (32) (81)Recoveries of loans previously written off (35) (20) (15) (55) (31)
Specific provision for credit losses 66 52 46 118 89
Reduction of the general allowance – – (40) – (40)
Provision for (recovery of) credit losses 66 52 6 118 49
Specific PCL as a % of average net loans and acceptances (annualized) 0.14% 0.12% 0.11% 0.13% 0.11%PCL as a % of average net loans and acceptances (annualized) 0.14% 0.12% 0.01% 0.13% 0.06%
Changes in Gross Impaired Loans and Acceptances (GIL)GIL, Beginning of Period 745 804 1,089 804 1,119Additions to impaired loans & acceptances 173 78 138 251 227Reductions in impaired loans & acceptances (56) (66) (68) (122) (115)Write-offs (91) (71) (107) (162) (179)
GIL, End of Period 771 745 1,052 771 1,052
GIL as a % of gross loans & acceptances 0.41% 0.41% 0.61% 0.41% 0.61%GIL as a % of equity and allowances for credit losses 4.57% 4.47% 6.77% 4.57% 6.77%
BMO Q2 06 Eng_v03.qxd 6/3/06 1:10 AM Page 9

The provision for credit losses totalled $66 million in thequarter, compared with $6 million in the second quarter of 2005and $52 million in the first quarter of 2006. Year to date, theprovision totalled $118 million, compared with $49 million ayear ago. There was no reduction of the general allowance in thesecond quarter of 2006, compared with a $40 million reductiona year ago.
Although specific provisions increased slightly from the firstquarter and a year ago, they continue at low levels, representingan annualized 14 basis points of average net loans and accept-ances, including securities purchased under resale agreements.Specific provisions for the year to date represent an annualized13 basis points of average net loans and acceptances, up slightlyfrom a year ago but appreciably lower than the 33 basis pointsaverage of the past five fiscal years. The components of thespecific provision are outlined in the preceding Provisions forCredit Losses table.
While remaining at historically low levels, gross impaired loansand acceptances increased during the quarter to $771 millionfrom $745 million in the first quarter, but were down from$1,052 million a year ago. Factors contributing to the changes areoutlined in the preceding table. New impaired loan formationstotalled $173 million, up from $78 million in the first quarterand $138 million a year earlier. BMO continues to benefit fromeffective loan realization practices, including cash collectionsand loan sales, which partially offset higher formations in thesecond quarter. During the quarter, loan sales totalled $39 millionwith resulting reversals and recoveries of $18 million, comparedwith loan sales of $31 million in the prior year with relatedreversals and recoveries of $10 million. There were no sales ofimpaired loans in the first quarter of the current year.
The total allowance for credit losses of $1,117 million at theend of the second quarter was comprised of a specific allowanceof $178 million and a general allowance of $939 million. Thespecific allowance was up $8 million from the first quarter butdown $76 million from a year ago. The decrease from a year agowas primarily due to the decline in impaired loans over the sameperiod. The general allowance is maintained to absorb impair-ment in the existing credit portfolio that cannot yet be associatedwith specific credit assets. It is assessed on a quarterly basis and
decreased $6 million from the first quarter due to the weakerU.S. dollar. We believe the total allowance for credit losses fullyaddresses impairment in BMO’s credit portfolio.
BMO’s loan book continues to be comprised largely of morestable consumer and commercial portfolios, which, excludingsecurities borrowed or purchased under resale agreements,represented 85.1% of the loan portfolio at the end of the secondquarter, relatively unchanged from a year ago and the end of thefirst quarter.
We continue to closely monitor those industry sectorsconsidered to be of most concern in today’s economy, includingairline, auto, forestry and those sectors considered to beparticularly sensitive to high energy prices and the risingCanadian dollar. BMO’s exposures to these sectors remains wellwithin acceptable levels. We are also attentive to other factorsthat could affect credit quality in the consumer and corporateand commercial portfolios, including the potential impact ofrising interest rates. Looking forward, short-term conditionsshould remain relatively stable, with potential weaknessdeveloping in the latter part of the year or early 2007. Thisoutlook is supported by our expectation for continued lowcorporate default rates, moderate levels of impaired loanformations and stable economic conditions across NorthAmerica. We continue to anticipate that specific provisions infiscal 2006 will be $325 million or less, below the 2006 target of$400 million or less established at the beginning of the year.
BMO’s market risk and liquidity and funding managementpractices and key measures are outlined on pages 70 to 73 of the2005 Annual Report. Trading and underwriting Market ValueExposure and Earnings Volatility have been generally consistentquarter-over-quarter. Structural Market Value Exposure (MVE)declined in the first quarter of 2006 as a result of lowermodelled interest rate volatility. Interest rate volatility is derivedfrom 10 years of historical data, which, starting in fiscal 2006,excludes the high volatility associated with fiscal 1995.Otherwise, there have been no significant changes to levels ofliquidity and funding risk or structural market risk since the endof fiscal 2005. There were no significant changes to market riskor liquidity and funding management practices during thequarter or since the end of last year.
10 | BMO Financial Group Second Quarter Report 2006
Management’s Discussion and Analysis
Aggregate Market Value Exposure and Earnings Volatility forTrading and Underwriting and Structural Positions ($ millions)*
Market value 12-month
(After-tax Canadian equivalent) exposure (MVE) earnings volatility
Apr. 30 Jan. 31 Oct. 31 Apr. 30 Jan. 31 Oct. 31
2006 2006 2005 2006 2006 2005
Trading and Underwriting (12.5) (13.9) (11.6) (11.2) (11.6) (9.1)Structural (267.1) (260.2) (326.3) (26.1) (29.7) (28.1)
Total (279.6) (274.1) (337.9) (37.3) (41.3) (37.2)
* Measured at a 99% confidence interval.Losses are in brackets.
BMO Q2 06 Eng_v03.qxd 6/3/06 1:10 AM Page 10

Structural Balance Sheet Earnings and Value Sensitivity to Changes in Interest Rates ($ millions)*Earnings
Economic sensitivity
value over the next
(After-tax Canadian equivalent) sensitivity 12 months
Apr. 30 Jan. 31 Oct. 31 Apr. 30 Jan. 31 Oct. 31
2006 2006 2005 2006 2006 2005
100 basis point increase (235.3) (234.3) (228.8) 20.4 24.0 25.1100 basis point decrease 200.3 188.7 191.9 (19.9) (27.1) (22.4)
200 basis point increase (487.3) (490.9) (478.0) 33.9 42.2 44.1200 basis point decrease 351.7 327.5 347.3 (28.1) (43.5) (45.8)
* Losses are in brackets and benefits are presented as positive numbers.
BMO Financial Group Second Quarter Report 2006 | 11
Total Trading and Underwriting MVE Summary ($ millions)*
For the quarter ended April 30, 2006 As at January 31, 2006 As at October 31, 2005
(Pre-tax Canadian equivalent) Quarter-end Average High Low Quarter-end Quarter-end
Commodity VaR (5.7) (4.5) (6.6) (2.4) (7.1) (3.2)Equity VaR (4.7) (4.8) (10.5) (2.6) (3.4) (3.8)Foreign exchange VaR (0.5) (0.5) (1.9) (0.1) (0.6) (0.4)Interest rate VaR (Mark-to-Market) (5.0) (4.3) (6.1) (3.4) (4.7) (3.8)Correlation 6.7 6.4 8.9 5.0 7.2 5.5
Comprehensive VaR (9.2) (7.7) (13.3) (5.3) (8.6) (5.7)Interest rate VaR (accrual) (5.7) (7.3) (8.5) (5.7) (8.3) (8.0)Issuer Risk (4.3) (4.8) (8.3) (3.6) (4.6) (4.1)
Total MVE (19.2) (19.8) (25.2) (17.2) (21.5) (17.8)
* One-day measure using a 99% confidence interval.Losses are in brackets and benefits are presented as positive numbers.
Income TaxesAs explained in the Non-GAAP Measures section, BMO adjustsrevenue to a taxable equivalent basis for analysis in this MD&A,with an offsetting adjustment to the provision for income taxes.As such, the provisions for income taxes and associated rates arestated on a taxable equivalent basis in the MD&A.
The provision for income taxes decreased $26 million from thesecond quarter a year ago and $63 million from the first quarterto $203 million.
Results in the year-ago period included a $20 million recoveryof prior years’ income taxes and $29 million of non-taxablerevenue from restructuring VIEs. The effective tax rate for thequarter was 23.5%, compared with 29.0% in the first quarter and27.2% (30.8% excluding the $20 million tax recovery and the$29 million of non-taxable revenue from restructuring VIEs) inthe second quarter a year ago.
Year to date, the provision for income taxes declined $7 millionto $469 million. There was a $52 million recovery of prior years’income taxes recorded in the first six months of 2005. The effec-tive tax rate in the current year-to-date period was 26.4%, downfrom 27.9% (31.5% excluding the recovery of prior years’ incometaxes and the non-taxable revenue from restructuring VIEs) inthe comparable period a year ago. We continue to consider thesustainable income tax rate to be 29% to 31%.
BMO hedges the foreign exchange risk arising from itsinvestments in U.S. operations by funding the investments inU.S. dollars. Under this program, the gain or loss from hedgingand the unrealized gain or loss from translation of the investmentsin U.S. operations are charged or credited to shareholders’equity. For income tax purposes, the gain or loss on the hedgingactivities attracts an income tax charge or credit in the currentperiod, which is charged or credited to shareholders’ equity,while the associated unrealized gain or loss on the investmentsin U.S. operations does not attract income taxes until the invest-ments are liquidated. The income tax charge/benefit arising froma hedging gain/loss is a function of the fluctuation in U.S. ratesfrom period to period. Hedging of the investments in U.S. opera-tions has given rise to an income tax charge of $58 million inshareholders’ equity for the quarter and $174 million for the yearto date. Refer to the Consolidated Statement of Changes inShareholders’ Equity included on page 26 of the unauditedinterim consolidated financial statements for further details.
BMO Q2 06 Eng_v03.qxd 6/3/06 1:10 AM Page 11

12 | BMO Financial Group Second Quarter Report 2006
Management’s Discussion and Analysis
Summary Quarterly Results Trends
Q2 Q1 Q4 Q3 Q2 Q1 Q4 Q3
(Canadian $ in millions, except as noted) 2006 2006 2005 2005 2005 2005 2004 2004
Total revenue (teb) 2,503 2,512 2,650 2,441 2,428 2,439 2,279 2,393Provision for credit losses - specific 66 52 57 73 46 43 37 (70)Provision for credit losses - general – – – – (40) – (50) (40)Non-interest expense 1,571 1,545 1,636 1,579 1,579 1,533 1,493 1,538
Net income 644 630 657 541 600 602 551 643
Basic earnings per share ($) 1.27 1.24 1.30 1.07 1.19 1.18 1.08 1.27Diluted earnings per share ($) 1.24 1.22 1.27 1.05 1.16 1.16 1.06 1.24Net interest margin 1.45 1.54 1.54 1.61 1.56 1.61 1.77 1.82Canadian/U.S. dollar exchange rate (average) 1.14 1.16 1.18 1.24 1.23 1.21 1.26 1.34
Operating group net income:P&C Canada 259 266 271 277 263 263 236 240P&C Chicagoland Banking 27 34 34 30 30 31 31 28
Personal and Commercial Client Group 286 300 305 307 293 294 267 268Private Client Group 96 94 107 63 77 73 53 58Investment Banking Group 245 228 226 184 206 237 190 230Corporate Support, including T&S 17 8 19 (13) 24 (2) 41 87
BMO Financial Group net income 644 630 657 541 600 602 551 643
BMO’s quarterly earning trends were reviewed in detail onpages 76 and 77 of the 2005 Annual Report. The above tableoutlines summary results for the third quarter of fiscal 2004through the second quarter of fiscal 2006. Quarterly provisionsfor credit losses have generally started to trend upward, affectingperformance. In addition, quarterly results sometimes includesignificant items that affect the level of earnings and trendanalysis. The net impact of such items increased earningssignificantly in the third quarter of 2004. The first, second andfourth quarters of 2005 were also affected by significant items.BMO’s pattern of growing earnings in consecutive quarters wasinterrupted in the fourth quarter of 2004 and into 2005, largelybecause of provisioning trends and significant items affectingquarterly results. Net interest margins have generally trendedlower in the competitive, low interest rate environment. Theweakening of the U.S. dollar has dampened revenue and expensegrowth over the past two years but has had a more modestimpact on net income, in part due to our practice of hedgingour currency exposure.
BMO’s provision for credit losses declined during 2004 as wemoved into a particularly favourable span of the credit cycle.Provisions were especially low in the third quarter of 2004 as werecorded high levels of reversals of previous allowances andrecoveries of earlier write-offs. These reversals and recoverieswere a significant component of the high net income inCorporate Support in that quarter.
A significant factor affecting results in 2006 in the context oftrend analysis was the fourth quarter of 2005 sale of Harrisdirect,which was contributing $50 to $60 million to BMO’s quarterlyrevenues and expenses and a quarterly operating loss of about$5 million.
Balance SheetTotal assets of $312.4 billion increased $14.9 billion fromOctober 31, 2005. The increase primarily reflects growth in netloans and acceptances ($13.2 billion), securities ($1.7 billion)and other assets ($1.1 billion), partially offset by a $1.1 billiondecrease in cash resources.
The $13.2 billion increase in net loans and acceptances waslargely due to a $4.8 billion increase in securities borrowed orpurchased under resale agreements, driven by customer demand,a $4.0 billion increase in loans to business and government,consistent with our strategy to grow our commercial business,and a $3.6 billion increase in residential mortgages and loans,driven by the low interest rate environment and the activehousing market.
The $1.7 billion increase in securities was largely attributableto a $1.5 billion increase in trading securities. The increase wasprimarily due to higher corporate debt and equity tradingsecurities resulting from normal trading activity. The excess ofinvestment securities’ book value over market value increased$43 million from October 31, 2005, to $46 million, mainlyreflecting higher unrealized losses on fixed income investmentsin the rising interest rate environment.
The $1.1 billion increase in other assets was mainly due topending trade settlements, and the $1.1 billion decrease in cashresources was primarily due to lower interest bearing depositswith other banks, resulting from an interest rate environmentunfavourable for reinvestment.
Liabilities and shareholders’ equity increased $14.9 billionfrom October 31, 2005, reflecting increases in deposits($0.7 billion), other liabilities ($13.6 billion) and shareholdersequity ($0.6 billion).
Deposits by banks, which account for 12% of total deposits,decreased $2.1 billion as they were replaced by securities lent orsold under repurchase agreements. Deposits by businesses andgovernments, which account for 48% of total deposits, increased$1.8 billion and were used to fund growth in loans. Deposits fromindividuals, which account for 40% of total deposits, increased$1.0 billion and were also used to fund growth in loans.
BMO Q2 06 Eng_v03.qxd 6/3/06 1:10 AM Page 12

BMO Financial Group Second Quarter Report 2006 | 13
The $8.8 billion increase in securities lent or sold underrepurchase agreements was used to fund growth in tradingsecurities and securities borrowed or purchased under resaleagreements and to reduce borrowings from banks. The$2.5 billion increase in other liabilities was primarily due tohigher balances owing to clients and brokers, resulting frompending trade settlements, and the $1.5 billion change inderivative financial instruments reflected increased client activityas well as volatility in commodity prices.
Contractual obligations by year of maturity were outlined inTable 8 on page 81 of BMO’s 2005 Annual Report. There havebeen no material changes to contractual obligations that areoutside the ordinary course of our business.
Capital ManagementBMO’s Tier 1 capital ratio was 10.17%, down from 10.38% at theend of the first quarter and 10.25% at the end of 2005, but wellabove our minimum target of 8.0%. The decreases were primarilyattributable to increases in risk-weighted assets, largely due toloan growth in Personal and Commercial Client Group andInvestment Banking Group.
The total capital ratio was 11.72%, compared with 11.84% at theend of the first quarter and 11.76% at the end of last year. Again,the decreases were primarily due to risk-weighted asset growth.
On May 24, BMO announced that it was increasing its targetdividend payout range to 45-55% of net income available tocommon shareholders. The increase, from 35-45%, is reflectiveof our confidence in our continued ability to generate earningsand our strong capital position. Our disciplined approach tocapital management will allow us to continue to execute ourattractive growth strategies and continue our longstandingcommitment to enhancing shareholder value.
In keeping with the new payout target, BMO also announceda 17% increase in its third quarter dividend to common share-holders, which will grow by $0.09 from $0.53 to $0.62 percommon share, up 35% from $0.46 a year ago.
During the quarter, BMO raised $700 million of subordinateddebt through the issue of 5.10% Series D Medium-Term Notes,First Tranche, due April 2021, under our Canadian Medium-TermNote Program. The issue, which closed on April 21, adds toBMO’s Tier 2 capital base. The net proceeds of the offering willbe used for general corporate purposes.
On March 14, 2006, Bank of Montreal redeemed its$125 million of 7.40% Debentures, Series 19, due 2011. Theredemption was prompted by the high yield relative to currentmarket rates and lowered BMO’s total capital ratio by approxi-mately 8 basis points.
On March 29, 2006, Bank of Montreal announced its intentionto, and on May 9, 2006 did redeem its $300 million of 8.15%Debentures, Series 21, due 2011. The announcement of theredemption, which was prompted by the high yield relative tocurrent market rates, required us to exclude the debentures incalculating our capital ratio in the second quarter and loweredBMO’s total capital ratio by approximately 20 basis points.
During the quarter, we repurchased 1,861,300 Bank ofMontreal common shares under our common share repurchaseprogram at an average cost of $65.63 per share, for a total cost of
$122 million. Year to date, we repurchased 2,399,500 commonshares at an average cost of $64.45 per share, for a total cost of$154 million. There have been 3,215,800 common shares repur-chased under the existing normal-course issuer bid that expireson September 5, 2006 and pursuant to which BMO is permittedto repurchase for cancellation up to 15 million Bank of Montrealcommon shares, representing approximately 3% of BMO’s publicfloat. Our common share repurchase program is primarilyintended to offset, over time, the impact of dilution caused by theexercise of stock options, our dividend reinvestment plan andthe conversion of convertible shares.
Outstanding Shares and Securities Convertible into Common Shares
Number of shares or
As of May 17, 2006 Canadian dollar amount
Common shares 501,116,000Class B Preferred Shares
Series 5 $ 200,000,000Convertible into common shares:Class B Preferred Shares
Series 4 $ 200,000,000Series 6 $ 250,000,000Series 10 $ 396,000,000
Stock options- vested 21,249,000- non-vested 3,746,000
Notes 20 and 21 to the audited financial statements on pages 118 and 119 and the table on page 60 inthe Annual MD&A included in the 2005 Annual Report provide details on share capital.
Credit RatingBMO’s credit rating, as measured by Standard & Poor’s (S&P)senior debt ratings, remains unchanged at AA- with a stableoutlook, the best, together with two of our competitors, of the sixmajor Canadian banks. Our credit rating, as measured by Moody’ssenior debt ratings, remains unchanged at Aa3 with a stableoutlook, below only one of the six major Canadian banks. Bothcredit ratings are indicative of high grade, high quality issues.
Transactions with Related PartiesIn the ordinary course of business, we provide banking servicesto our joint venture and equity accounted investments on thesame terms that we offer our customers. A select suite ofcustomer loan and mortgage products is offered to employees atrates normally available only to preferred customers.
Preferred rate loan agreements are discussed in Note 26 of theaudited consolidated financial statements on page 128 of the2005 Annual Report. There have been no amounts advancedunder these preferred rate loan agreements in fiscal 2006, exceptfor mortgage loans related to staff transfers we initiated.
Off-Balance Sheet ArrangementsBMO enters into a number of off-balance sheet arrangements inthe normal course of operations. The most significant off-balancesheet arrangements that we enter into are credit instruments,derivatives, and VIEs, which are described on page 61 of the2005 Annual Report. There were no significant changes to theseoff-balance sheet arrangements during the six months endedApril 30, 2006.
BMO Q2 06 Eng_v03.qxd 6/3/06 1:10 AM Page 13

Accounting Policies and Critical Accounting EstimatesThe notes to BMO’s October 31, 2005 audited consolidatedfinancial statements outline our significant accounting policies.There have been no changes to our significant accounting policiesin fiscal 2006.
Pages 63 to 65 of the 2005 Annual Report contain a discussionof certain accounting estimates that are considered particularlyimportant, as they require management to make significantjudgments, some of which relate to matters that are inherentlyuncertain. Readers are encouraged to refer to the Annual Reportto review that discussion.
Future Accounting ChangesFinancial Instruments, Hedges and Comprehensive IncomeThe Canadian Institute of Chartered Accountants (CICA) hasissued new accounting rules on financial instruments, hedgesand comprehensive income that will require us to account for allof our investment securities and hedging derivatives at fairvalue. When we adopt the new rules, on November 1, 2006, wewill re-measure our securities and derivatives, as appropriate,and report a new section of shareholders’ equity called othercomprehensive income. The impact of recording these assets andliabilities at fair value will be recognized in opening equity andresults for prior periods will not be restated. We cannot determinethe impact that these rules will have on our consolidated financialstatements, as this will be dependent on fair values at the timeof adoption.
Earnings per ShareThe CICA has issued new rules that will require BMO to includethe potential conversion of certain of our preferred shares andcapital trust securities to common shares in the calculation ofdiluted earnings per share. The effective date has not beenfinalized; however, we expect to adopt these new rules in theyear ended October 31, 2006. Diluted earnings per share of priorperiods will be restated upon adoption. Under the new standard,our diluted earnings per share for the years ended October 31,2005, 2004 and 2003 would be reduced by approximately $0.07,$0.09 and $0.11, respectively.
Stock-based CompensationThe CICA has issued draft new guidance on stock-basedcompensation that will require us to immediately expense stock-based awards to employees who are eligible to retire at the timeof the grant. Currently, these awards are expensed over thevesting period. The effective date has not been finalized;however, we expect to adopt these new rules in the year endedOctober 31, 2006, on a retroactive basis. We do not expect theimpact to be material on an annual basis. However, since moststock compensation awards are granted in the first quarter ofeach year, this change will result in increased compensationexpense in the first quarter of each year and decreased compen-sation expense for the remainder of the year.
14 | BMO Financial Group Second Quarter Report 2006
Management’s Discussion and Analysis
Review of Operating Groups’ Performance
The following sections review the financial results of each ofour operating segments and operating groups for the secondquarter of 2006, and outline some of their business achievementsin the quarter.
Periodically, certain business lines and units within the busi-ness lines are transferred between client groups to more closelyalign BMO’s organizational structure and its strategic priorities.All comparative figures are reclassified to reflect these transfers.
Note 10 on page 31 of the attached unaudited interim consol-idated financial statements outlines how income statement itemsrequiring allocation are distributed among the operating groups,including the allocation of the provision for credit losses.Corporate Support is generally charged (or credited) with differ-ences between the periodic provisions for credit losses chargedto the client groups under our expected loss provisioningmethodology and the periodic provisions required under GAAP.
BMO Q2 06 Eng_v03.qxd 6/3/06 1:10 AM Page 14
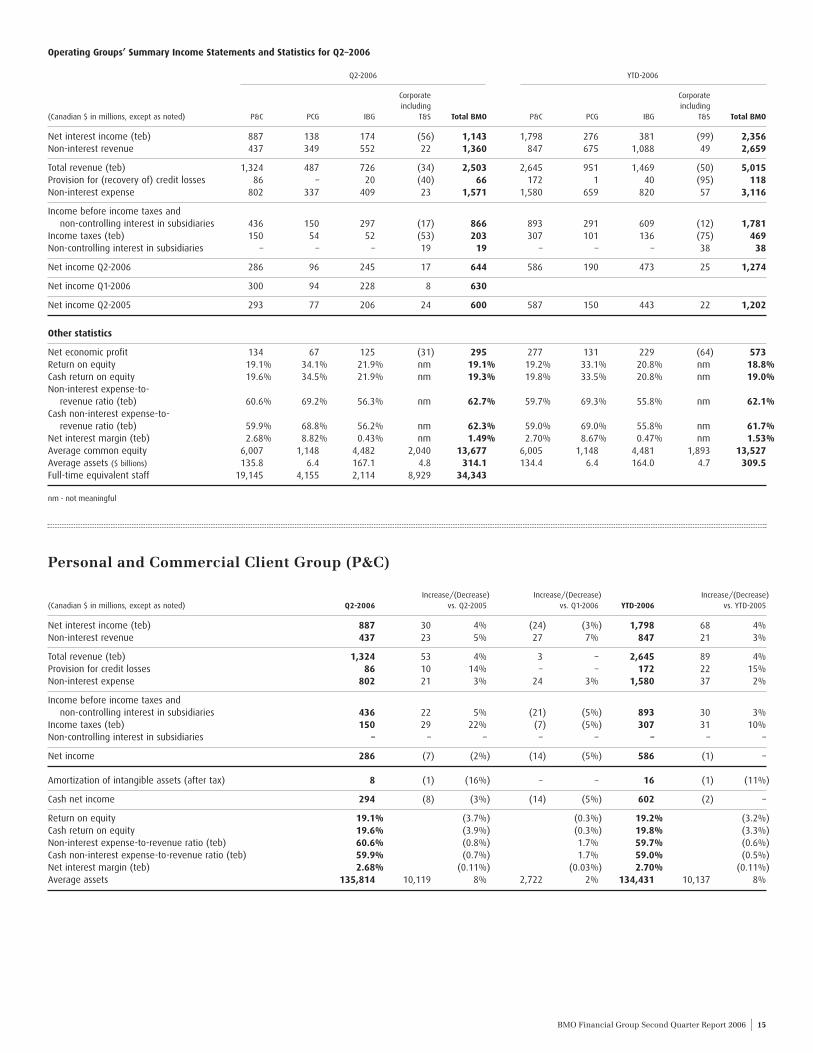
BMO Financial Group Second Quarter Report 2006 | 15
Operating Groups’ Summary Income Statements and Statistics for Q2–2006
Q2-2006 YTD-2006
Corporate Corporateincluding including
(Canadian $ in millions, except as noted) P&C PCG IBG T&S Total BMO P&C PCG IBG T&S Total BMO
Net interest income (teb) 887 138 174 (56) 1,143 1,798 276 381 (99) 2,356Non-interest revenue 437 349 552 22 1,360 847 675 1,088 49 2,659
Total revenue (teb) 1,324 487 726 (34) 2,503 2,645 951 1,469 (50) 5,015Provision for (recovery of) credit losses 86 – 20 (40) 66 172 1 40 (95) 118Non-interest expense 802 337 409 23 1,571 1,580 659 820 57 3,116
Income before income taxes and non-controlling interest in subsidiaries 436 150 297 (17) 866 893 291 609 (12) 1,781
Income taxes (teb) 150 54 52 (53) 203 307 101 136 (75) 469Non-controlling interest in subsidiaries – – – 19 19 – – – 38 38
Net income Q2-2006 286 96 245 17 644 586 190 473 25 1,274
Net income Q1-2006 300 94 228 8 630
Net income Q2-2005 293 77 206 24 600 587 150 443 22 1,202
Other statistics
Net economic profit 134 67 125 (31) 295 277 131 229 (64) 573Return on equity 19.1% 34.1% 21.9% nm 19.1% 19.2% 33.1% 20.8% nm 18.8%Cash return on equity 19.6% 34.5% 21.9% nm 19.3% 19.8% 33.5% 20.8% nm 19.0%Non-interest expense-to-
revenue ratio (teb) 60.6% 69.2% 56.3% nm 62.7% 59.7% 69.3% 55.8% nm 62.1%Cash non-interest expense-to-
revenue ratio (teb) 59.9% 68.8% 56.2% nm 62.3% 59.0% 69.0% 55.8% nm 61.7%Net interest margin (teb) 2.68% 8.82% 0.43% nm 1.49% 2.70% 8.67% 0.47% nm 1.53%Average common equity 6,007 1,148 4,482 2,040 13,677 6,005 1,148 4,481 1,893 13,527Average assets ($ billions) 135.8 6.4 167.1 4.8 314.1 134.4 6.4 164.0 4.7 309.5Full-time equivalent staff 19,145 4,155 2,114 8,929 34,343
nm - not meaningful
Increase/(Decrease) Increase/(Decrease) Increase/(Decrease)(Canadian $ in millions, except as noted) Q2-2006 vs. Q2-2005 vs. Q1-2006 YTD-2006 vs. YTD-2005
Net interest income (teb) 887 30 4% (24) (3%) 1,798 68 4%Non-interest revenue 437 23 5% 27 7% 847 21 3%
Total revenue (teb) 1,324 53 4% 3 – 2,645 89 4%Provision for credit losses 86 10 14% – – 172 22 15%Non-interest expense 802 21 3% 24 3% 1,580 37 2%
Income before income taxes and non-controlling interest in subsidiaries 436 22 5% (21) (5%) 893 30 3%
Income taxes (teb) 150 29 22% (7) (5%) 307 31 10%Non-controlling interest in subsidiaries – – – – – – – –
Net income 286 (7) (2%) (14) (5%) 586 (1) –
Amortization of intangible assets (after tax) 8 (1) (16%) – – 16 (1) (11%)
Cash net income 294 (8) (3%) (14) (5%) 602 (2) –
Return on equity 19.1% (3.7%) (0.3%) 19.2% (3.2%)Cash return on equity 19.6% (3.9%) (0.3%) 19.8% (3.3%)Non-interest expense-to-revenue ratio (teb) 60.6% (0.8%) 1.7% 59.7% (0.6%)Cash non-interest expense-to-revenue ratio (teb) 59.9% (0.7%) 1.7% 59.0% (0.5%)Net interest margin (teb) 2.68% (0.11%) (0.03%) 2.70% (0.11%)Average assets 135,814 10,119 8% 2,722 2% 134,431 10,137 8%
Personal and Commercial Client Group (P&C)
BMO Q2 06 Eng_v03.qxd 6/3/06 1:10 AM Page 15

Financial Performance ReviewPersonal and Commercial Client Group represents the sum ofour two retail and business banking operating segments,Personal and Commercial Client Group – Canada (P&C Canada)and Personal and Commercial Client Group – ChicagolandBanking (P&C Chicagoland Banking). These operating segmentsare reviewed separately in the sections that follow.
Personal and Commercial Client Group net income was$286 million for the second quarter of 2006, down $7 million or2.4% from the second quarter a year ago and $14 million or4.7% from the first quarter. Net income for the year to date was
$586 million, down $1 million from a year ago. The secondquarter of 2005 benefited from a $20 million recovery of prioryears’ income taxes. Excluding the tax recovery, net income forthe second quarter rose $13 million or 4.7% from a year ago andnet income for the year to date increased $19 million or 3.4%.
Personal and Commercial Client Group’s productivity ratiofor the quarter improved by 82 basis points from a year ago butdeteriorated 175 basis points from the first quarter to 60.6%, dueprimarily to three fewer days in the current quarter and higherexpenses in both the United States and Canada.
Financial Performance ReviewP&C Canada’s net income of $259 million for the second quarterof 2006 was down $4 million or 1.3% from the second quarter of2005. The second quarter of 2005 benefited from a $20 millionrecovery of prior years’ income taxes. Excluding that recovery,net income for the second quarter rose $16 million or 6.9% froma year ago driven by strong volume growth, partially offset bylower net interest margins, higher provisions for credit lossesand increased expenses. Although there was both strong non-interest revenue and volume growth, net income was down$7 million or 2.5% from the first quarter, due largely to theimpact of three fewer calendar days in the second quarter,lower net interest margin and higher expenses.
Year to date, net income of $525 million was down $1 millionfrom the comparable period of 2005. Excluding the $20 million taxrecovery in the comparable period, net income rose $19 million or3.9%, driven by strong volume growth, partially offset by theimpact of lower net interest margin, higher provisions for creditlosses and increased expenses.
Revenue for the quarter rose $54 million or 5.1% from thesecond quarter of 2005 to $1,097 million. There was strongvolume growth in both personal and commercial products,
higher cards and insurance revenue and increased sales of terminvestment products and mutual funds, partially offset by lowersecuritization revenue. There was a decline in net interestmargin due to total personal loans growing faster than deposits,aggressive mortgage pricing in a competitive market and theinterest rate environment. Rising interest rates caused narrowerspreads on variable rate mortgage and loan products. In addition,the absolute low level of all interest rates contributed to themargin decline, mitigated by pricing actions in certain depositcategories.
Relative to the first quarter, revenue was basically unchanged.Increased sales of term investment and mutual funds products,higher insurance and cards revenue and higher investmentsecurities gains were offset by the impacts of three fewercalendar days in the second quarter and lower net interestmargin. The decline in net interest margin was due to pricingaggressively in the competitive mortgage market and totalpersonal loans growing faster than deposits.
Year to date, revenue increased $81 million or 3.8% to$2,193 million. The factors contributing to the increase werelargely consistent with those responsible for the year-over-yearincrease for the quarter.
16 | BMO Financial Group Second Quarter Report 2006
Management’s Discussion and Analysis
Increase/(Decrease) Increase/(Decrease) Increase/(Decrease)(Canadian $ in millions, except as noted) Q2-2006 vs. Q2-2005 vs. Q1-2006 YTD-2006 vs. YTD-2005
Net interest income (teb) 700 28 4% (26) (3%) 1,426 55 4%Non-interest revenue 397 26 7% 27 7% 767 26 3%
Total revenue (teb) 1,097 54 5% 1 – 2,193 81 4%Provision for credit losses 79 11 16% 1 – 157 22 16%Non-interest expense 628 17 3% 10 2% 1,246 29 2%
Income before income taxes and non-controlling interest in subsidiaries 390 26 7% (10) (3%) 790 30 4%
Income taxes (teb) 131 30 27% (3) (3%) 265 31 12%Non-controlling interest in subsidiaries – – – – – – – –
Net income 259 (4) (1%) (7) (3%) 525 (1) –
Amortization of intangible assets (after tax) 2 – – (1) (11%) 5 – –
Cash net income 261 (4) (1%) (8) (3%) 530 (1) –
Non-interest expense-to-revenue ratio (teb) 57.3% (1.2%) 0.9% 56.8% (0.8%)Cash non-interest expense-to-revenue ratio (teb) 57.1% (1.2%) 0.9% 56.7% (0.6%)Net interest margin (teb) 2.52% (0.12%) (0.06%) 2.55% (0.11%)Average assets 113,878 9,470 9% 2,411 2% 112,653 8,652 8%
P&C Canada
BMO Q2 06 Eng_v03.qxd 6/3/06 1:10 AM Page 16

BMO Financial Group Second Quarter Report 2006 | 17
The provision for credit losses was $79 million, up $11 millionfrom a year ago but consistent with the first quarter. Year to date,the provision for credit losses was $157 million, up $22 millionfrom a year ago. The increases from a year ago were due to higherlending volumes and better commercial credit information as aconsequence of the improved risk management framework thatresults from our Basel initiative. BMO’s practice is to charge lossprovisions to the client operating groups each year using anexpected loss provision methodology based on each group’sshare of expected credit losses over an economic cycle.
Non-interest expense of $628 million in the second quarterwas up $17 million or 2.9% from a year ago. The increase wasattributable to higher employee-related costs resulting from anexpansion of both our retail and commercial sales forces as wellas increased marketing expenditures.
Relative to the first quarter, non-interest expense increased$10 million or 1.7%, due to higher marketing expenses andinvestments in our distribution network including the expansionof our sales forces, partially offset by the impact of three fewercalendar days in the second quarter. Year to date, non-interestexpense was $29 million or 2.4% higher than in the comparableperiod of 2005, due to the expansion of the sales forces,increased marketing expenses and other initiatives. Initiativesunderway in 2006 include further investment in our physicaldistribution network, including the replacement of our ABMnetwork and enhancement of technology for front-line sales andservice representatives to increase capacity and improvecustomer service.
P&C Canada’s productivity ratio in the quarter improved122 basis points from a year ago to 57.3%, but slipped 95 basispoints from the first quarter, due primarily to three fewer days inthe second quarter and higher marketing and initiative expenses.Year to date, the productivity ratio improved by 75 basis points to56.8% and the cash productivity ratio improved by 66 basispoints to 56.7%.
Bank of Montreal has an equity ownership interest inMasterCard Incorporated. On May 5, 2006, MasterCard filed apreliminary prospectus in connection with a proposed initialpublic offering in the United States. A portion of Bank ofMontreal’s interest in MasterCard is expected to be redeemed aspart of the initial public offering process. If the transaction iscompleted on the terms outlined in the preliminary prospectus,BMO could realize an after-tax gain of approximately CDN$20-$30 million on our redeemed interest. The actual gain will varydepending on the pricing and expenses of the offering, the grossproceeds realized by MasterCard, the number of shares actuallyredeemed and exchange rates.
Business Developments and AchievementsP&C Canada’s priorities for fiscal 2006 are outlined on page 45of BMO’s 2005 Annual Report. Notable business developmentsand achievements in the second quarter in support of our 2006priorities are listed below.� There was strong growth in average loans and acceptances,
which increased $10.9 billion or 10.5% from the secondquarter of 2005 and $2.7 billion or 2.4% from the first quarter,after adding back the effects of securitizations. Personal andcommercial deposits grew $2.0 billion or 4.7% from a year agoand declined $0.5 billion or 1.2% from the first quarter,partially due to seasonality.
� The most recently available data (December 2005) indicatesthat BMO continued to rank second in Canadian businessbanking market share for business loans $5 million and below.Business banking market share declined 6 basis points fromthe prior year but improved 14 basis points from the precedingquarter to 18.66%. Total commercial loans and acceptancesincreased by $1.8 billion or 6.8% from the second quarter of2005 and total deposits grew by $1.4 billion or 8.0%. TheCanadian Bankers Association (CBA) issues business bankingmarket share statistics on a one-calendar quarter lag basis.
� The most recently available data indicates that our total shareof the Canadian banking industry’s personal market businesswas 13.15%, an increase of 3 basis points from the previousquarter and 15 basis points from a year ago. Strong growth inmortgages and mutual funds were the largest contributors tothe increases. Personal market share statistics are issued bythe CBA on a one-month lag basis.
� In 2006, we began an initiative to replace our entire ABMnetwork, in part to provide enhanced security features toprotect customer information. Through the end of the secondquarter, we have replaced more than half of the machines andare on track to replace the entire network by the end of the year.
� In line with our strategy to make our personal deposit productsand everyday banking plans as convenient and easy to under-stand as possible and more effectively identify our customerneeds, we have consolidated and simplified our product offer.Effective May 1, 2006, we moved to three accounts and fourplans, which will dramatically reduce complexity for bothcustomers and employees. Previously, there were more than180 possible combinations of accounts and plans.
BMO Q2 06 Eng_v03.qxd 6/3/06 1:10 AM Page 17

18 | BMO Financial Group Second Quarter Report 2006
Management’s Discussion and Analysis
P&C Chicagoland Banking
Increase/(Decrease) Increase/(Decrease) Increase/(Decrease)(Canadian $ in millions, except as noted) Q2-2006 vs. Q2-2005 vs. Q1-2006 YTD-2006 vs. YTD-2005
Net interest income (teb) 187 2 1% 2 1% 372 13 4%Non-interest revenue 40 (3) (7%) – 4% 80 (5) (6%)
Total revenue (teb) 227 (1) – 2 1% 452 8 2%Provision for credit losses 7 (1) – (1) – 15 – 4%Non-interest expense 174 4 2% 14 9% 334 8 2%
Income before income taxes and non-controlling interest in subsidiaries 46 (4) (9%) (11) (20%) 103 – –
Income taxes (teb) 19 (1) (3%) (4) (19%) 42 – –Non-controlling interest in subsidiaries – – – – – – – –
Net income 27 (3) (12%) (7) (21%) 61 – –
Amortization of intangible assets (after tax) 6 (1) (11%) 1 4% 11 (1) (3%)
Cash net income 33 (4) (12%) (6) (19%) 72 (1) (1%)
Non-interest expense-to-revenue ratio (teb) 76.6% 1.9% 5.5% 73.9% 0.4%Cash non-interest expense-to-revenue ratio (teb) 73.4% 2.2% 5.6% 70.6% 0.6%Net interest margin (teb) 3.45% (0.10%) 0.05% 3.42% (0.15%)Average assets 21,936 649 3% 311 1% 21,778 1,485 7%
P&C Chicagoland Banking Select Financial Data (U.S. $ in millions)
Net interest income (teb) 164 14 9% 4 3% 324 30 10%Non-interest revenue 36 – – 2 6% 70 – –
Total revenue (teb) 200 14 8% 6 3% 394 30 8%Non-interest expense 153 15 11% 15 11% 291 24 9%Net Income 24 (2) (8%) (5) (17%) 53 3 6%Average assets 19,222 1,968 11% 515 3% 18,960 2,357 14%
Financial Performance ReviewP&C Chicagoland Banking net income of $27 million for thesecond quarter of 2006 was down $3 million or 12% from thesecond quarter of 2005 and $7 million or 21% from the firstquarter of 2006. The decreases were due to increased costsassociated primarily with acquisitions, new branches andenhancements to our branch technology platform. Year to date,net income of $61 million was unchanged from a year ago, asrevenue growth offset increased expenses.
Revenue for the quarter decreased $1 million or 0.4% from thesame quarter a year ago to $227 million, but increased $18 millionor 7.7% excluding the impact of the weaker U.S. dollar. Theincrease was driven by loan growth (both commercial andconsumer), improved deposit spread and the impact of theacquisition of Villa Park Trust and Savings Bank and newbranches, partially offset by the effect of lower loan spreads. Netinterest margin decreased by 10 basis points as assets, primarilyconsumer loans, grew faster than deposits. Other contributingfactors were competitive pressures on loan pricing and theimpact of lower investment rates earned on longer-termdeposits, mitigated by pricing actions in certain deposit cate-gories. BMO’s operating groups earn a spread on both their loansand deposits; however, net interest margin represents netinterest income as a percentage of assets. Since P&C ChicagolandBanking loan growth has surpassed its deposit growth over time,its net interest margin has been negatively affected.
Revenue increased $2 million or 1.2% from the first quarterprimarily due to loan growth, improved deposit spread and theacquisition of Villa Park Trust and Savings Bank. Net interestmargin rose 5 basis points due to improved deposit spread,partially offset by a decrease in loan spreads caused by competi-tive pressures. Year to date, revenue increased $8 million or1.8% to $452 million, but increased $37 million or 8.2%
excluding the impact of the weaker U.S. dollar. The increase wasdue to strong loan growth, improved deposit spread, acquisitionsand new branches, partially offset by the impact of lower loanspreads.
Non-interest expense of $174 million in the second quarter wasup $4 million or 2.1% from a year ago, but increased $18 millionor 10% excluding the impact of the weaker U.S. dollar. Expensesincreased $14 million or 9.0% from the first quarter. Year to date,non-interest expense was up $8 million or 2.3% to $334 million,but increased $29 million or 8.7% excluding the impact of theweaker U.S. dollar. These increases were primarily due toacquisitions and associated integration costs, new branches,increased credit origination and marketing expenses and costsassociated with Harris Connect, our initiative to enhance ourbranch technology platform.
P&C Chicagoland Banking productivity ratio in the quarterdeteriorated 184 basis points from a year ago and 548 basispoints from the first quarter to 76.6%, due primarily to increasedexpenses. Year to date, the productivity ratio deteriorated by40 basis points to 73.9% and the cash productivity ratio deterio-rated by 61 basis points to 70.6% for the same reason.
P&C Chicagoland Banking net income represented 9.4% oftotal Personal and Commercial Client Group net income in thesecond quarter of 2006, compared with 10.6% in the prior yearand 11.3% in the first quarter. Year to date, P&C ChicagolandBanking earnings represented 10.4% of the Group’s net income,compared with 10.6% in the comparable period of 2005.
BMO’s corporate banking operations in the United States areconcentrated among mid-market corporate clients, which BMOmanages and reports in its Investment Banking Group operationsbecause of the enhanced opportunities to cross-sell products.BMO’s North American peer group typically includes similarbusinesses in their personal and commercial banking units. The
BMO Q2 06 Eng_v03.qxd 6/3/06 1:10 AM Page 18
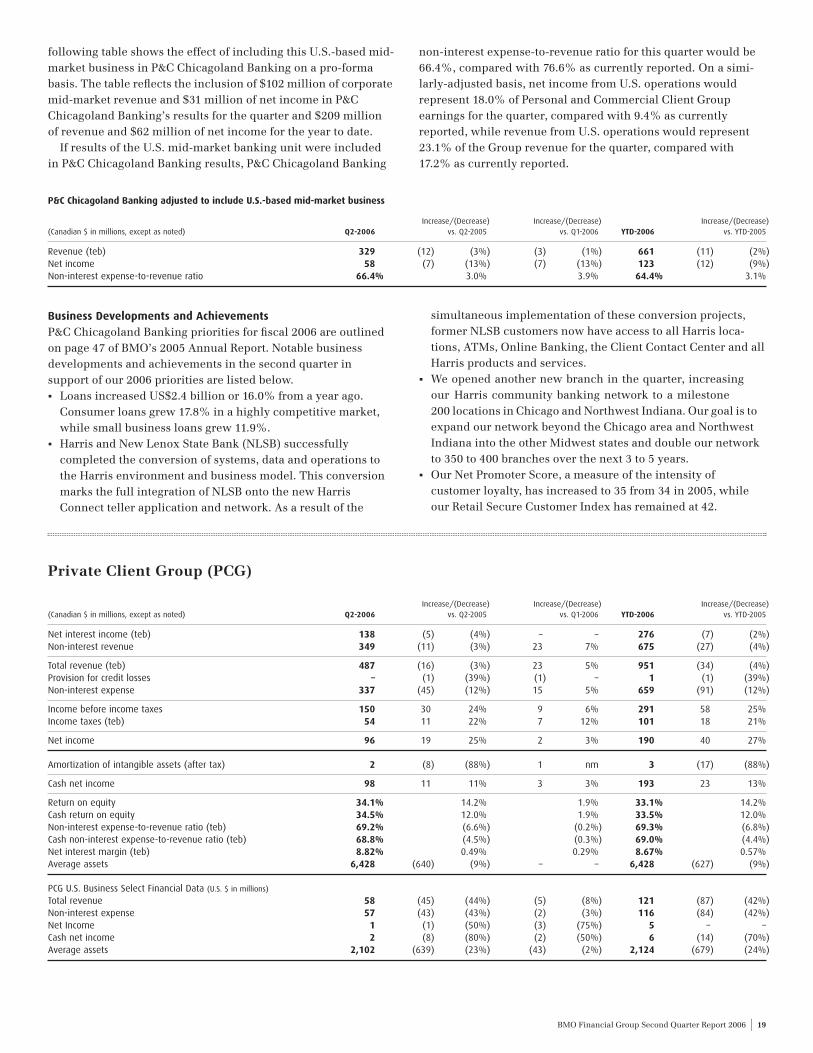
BMO Financial Group Second Quarter Report 2006 | 19
following table shows the effect of including this U.S.-based mid-market business in P&C Chicagoland Banking on a pro-formabasis. The table reflects the inclusion of $102 million of corporatemid-market revenue and $31 million of net income in P&CChicagoland Banking’s results for the quarter and $209 millionof revenue and $62 million of net income for the year to date.
If results of the U.S. mid-market banking unit were includedin P&C Chicagoland Banking results, P&C Chicagoland Banking
non-interest expense-to-revenue ratio for this quarter would be66.4%, compared with 76.6% as currently reported. On a simi-larly-adjusted basis, net income from U.S. operations wouldrepresent 18.0% of Personal and Commercial Client Group earnings for the quarter, compared with 9.4% as currentlyreported, while revenue from U.S. operations would represent23.1% of the Group revenue for the quarter, compared with17.2% as currently reported.
P&C Chicagoland Banking adjusted to include U.S.-based mid-market business
Increase/(Decrease) Increase/(Decrease) Increase/(Decrease)(Canadian $ in millions, except as noted) Q2-2006 vs. Q2-2005 vs. Q1-2006 YTD-2006 vs. YTD-2005
Revenue (teb) 329 (12) (3%) (3) (1%) 661 (11) (2%)Net income 58 (7) (13%) (7) (13%) 123 (12) (9%)Non-interest expense-to-revenue ratio 66.4% 3.0% 3.9% 64.4% 3.1%
Business Developments and AchievementsP&C Chicagoland Banking priorities for fiscal 2006 are outlinedon page 47 of BMO’s 2005 Annual Report. Notable businessdevelopments and achievements in the second quarter insupport of our 2006 priorities are listed below.� Loans increased US$2.4 billion or 16.0% from a year ago.
Consumer loans grew 17.8% in a highly competitive market,while small business loans grew 11.9%.
� Harris and New Lenox State Bank (NLSB) successfullycompleted the conversion of systems, data and operations tothe Harris environment and business model. This conversionmarks the full integration of NLSB onto the new HarrisConnect teller application and network. As a result of the
simultaneous implementation of these conversion projects,former NLSB customers now have access to all Harris loca-tions, ATMs, Online Banking, the Client Contact Center and allHarris products and services.
� We opened another new branch in the quarter, increasingour Harris community banking network to a milestone200 locations in Chicago and Northwest Indiana. Our goal is toexpand our network beyond the Chicago area and NorthwestIndiana into the other Midwest states and double our networkto 350 to 400 branches over the next 3 to 5 years.
� Our Net Promoter Score, a measure of the intensity ofcustomer loyalty, has increased to 35 from 34 in 2005, whileour Retail Secure Customer Index has remained at 42.
Increase/(Decrease) Increase/(Decrease) Increase/(Decrease)(Canadian $ in millions, except as noted) Q2-2006 vs. Q2-2005 vs. Q1-2006 YTD-2006 vs. YTD-2005
Net interest income (teb) 138 (5) (4%) – – 276 (7) (2%)Non-interest revenue 349 (11) (3%) 23 7% 675 (27) (4%)
Total revenue (teb) 487 (16) (3%) 23 5% 951 (34) (4%)Provision for credit losses – (1) (39%) (1) – 1 (1) (39%)Non-interest expense 337 (45) (12%) 15 5% 659 (91) (12%)
Income before income taxes 150 30 24% 9 6% 291 58 25%Income taxes (teb) 54 11 22% 7 12% 101 18 21%
Net income 96 19 25% 2 3% 190 40 27%
Amortization of intangible assets (after tax) 2 (8) (88%) 1 nm 3 (17) (88%)
Cash net income 98 11 11% 3 3% 193 23 13%
Return on equity 34.1% 14.2% 1.9% 33.1% 14.2%Cash return on equity 34.5% 12.0% 1.9% 33.5% 12.0%Non-interest expense-to-revenue ratio (teb) 69.2% (6.6%) (0.2%) 69.3% (6.8%)Cash non-interest expense-to-revenue ratio (teb) 68.8% (4.5%) (0.3%) 69.0% (4.4%)Net interest margin (teb) 8.82% 0.49% 0.29% 8.67% 0.57%Average assets 6,428 (640) (9%) – – 6,428 (627) (9%)
PCG U.S. Business Select Financial Data (U.S. $ in millions)
Total revenue 58 (45) (44%) (5) (8%) 121 (87) (42%)Non-interest expense 57 (43) (43%) (2) (3%) 116 (84) (42%)Net Income 1 (1) (50%) (3) (75%) 5 – –Cash net income 2 (8) (80%) (2) (50%) 6 (14) (70%)Average assets 2,102 (639) (23%) (43) (2%) 2,124 (679) (24%)
Private Client Group (PCG)
BMO Q2 06 Eng_v03.qxd 6/3/06 1:10 AM Page 19

20 | BMO Financial Group Second Quarter Report 2006
Management’s Discussion and Analysis
Financial Performance ReviewNet income in the second quarter increased $19 million or 25%from a year ago to $96 million. Earnings growth was achieved byincreasing operating revenue across all the Group’s lines of busi-ness, adjusting for the impact of the sale of Harrisdirect. Relativeto the first quarter, net income increased $2 million or 2.5%, andon a year-to-date basis, net income improved $40 million or 27%from the comparable period in 2005 to $190 million.
Revenue of $487 million in the second quarter declined$16 million from a year ago, but increased $37 million or 8.1%excluding the operating results of Harrisdirect and by$43 million or 9.4% after also excluding the impact of theweaker U.S. dollar. Strong revenue growth was driven byincreased client trade volumes in direct investing and highercommission and fee-based revenue in full-service investing.The mutual fund businesses continue to grow revenue throughpositive net sales and increasing managed asset levels. Higherdeposit spreads and moderate balance growth also contributedto increased revenues. Investment securities gains in the currentquarter included a $6 million ($4 million after tax) gain on theredemption of seed capital in our mutual fund businesses;however, this impact was offset by $8 million ($5 million aftertax) of incremental expenses associated with Harris InsightFunds incurred prior to our alliance with The PhoenixCompanies, Inc.
Relative to the first quarter, revenue increased $23 millionor 4.9%, due primarily to higher commission and fee-basedrevenue in full-service investing and increased client tradevolumes in direct investing. Year to date, revenue declined$34 million from the comparable period in 2005, but increased$74 million or 8.4% excluding the operating results ofHarrisdirect and by $84 million or 9.6% after also excluding theimpact of the weaker U.S. dollar. The Group’s focus on revenuegrowth and enhancing product offerings, combined withfavourable market fundamentals, drove higher operatingrevenue across all lines of business.
Non-interest expense of $337 million in the second quarterdeclined $45 million from a year ago, but increased $13 millionor 3.9% excluding Harrisdirect and by $18 million or 5.5% afteralso excluding the impact of the weaker U.S. dollar. Higherexpense levels were primarily attributable to increased revenue-based costs. Our productivity ratio improved 665 basis pointsfrom a year ago, or by 277 basis points excluding Harrisdirect.Relative to the first quarter, expenses grew $15 million or 4.6%due to higher revenue-based costs and increased investment inour businesses to drive future revenue growth. Year to date,expenses decreased $91 million from the comparable period in2005, but increased $24 million, in line with revenue, excludingthe operating results of Harrisdirect and by $32 million or 5.1%after also excluding the impact of the weaker U.S. dollar.
All amounts in this paragraph discussing U.S. operations arestated in U.S. dollars. Our U.S. operations are comprised ofprivate banking, investment management and mutual funds.Excluding Harrisdirect, revenue decreased $3 million from theprior year due to the $7 million reimbursement of a portion ofadministration fees related to the Harris Insight Funds, partiallyoffset by moderate revenue growth in private banking. ExcludingHarrisdirect, net income declined $3 million from the prior year,primarily due to the incremental expenses associated with HarrisInsight Funds and increased investment in our investmentmanagement business.
Business Developments and AchievementsThe Group’s priorities for fiscal 2006 are outlined on page 51 ofBMO’s 2005 Annual Report. Notable business developments andachievements in the second quarter in support of the Group’s2006 objectives are listed below.� The Group’s $273 billion of assets under management and
administration, including term deposits, declined $17 billion or 6.0% year-over-year. Assets under management increased16.1% and assets under administration increased 15.8%,excluding the effect of the weaker U.S. dollar and the sale ofHarrisdirect (including a final transfer of assets completed thisquarter). Term investment products were relatively unchanged.
� BMO Mutual Funds continued to outperform the mutual fundindustry in quarterly net sales and our asset growth exceededthe average of the industry and the other major Canadianbanks. In the past three years, BMO Mutual Funds assets havegrown by over 85%.
� Guardian Group of Funds launched two new funds in thequarter, the Small Cap Growth & Income Fund and the GlobalDiversified Fund.
� BMO Investorline was ranked the number one broker in TheGlobe and Mail’s 2006 RRSP ranking for the fifth consecutiveyear. BMO Investorline was described as “a top choice foranyone, but especially those looking for a little direction,” withonline access to bonds and GICs, commission-free mutualfunds and useful tools for designing RRSP portfolios.
� Harris Investment Management, Inc. announced the approvalof its strategic alliance in which The Phoenix Companies, Inc.become the investment adviser, distributor and administratorof the Harris Insight Funds. However, Harris InvestmentManagement continues to manage the majority of the InsightFunds as sub-adviser and becomes the sub-adviser to severalexisting Phoenix Funds.
BMO Q2 06 Eng_v03.qxd 6/3/06 1:10 AM Page 20

BMO Financial Group Second Quarter Report 2006 | 21
Increase/(Decrease) Increase/(Decrease) Increase/(Decrease)(Canadian $ in millions, except as noted) Q2-2006 vs. Q2-2005 vs. Q1-2006 YTD-2006 vs. YTD-2005
Net interest income (teb) 174 (98) (36%) (33) (16%) 381 (167) (30%)Non-interest revenue 552 144 36% 16 3% 1,088 248 30%
Total revenue (teb) 726 46 7% (17) (2%) 1,469 81 6%Provision for credit losses 20 (5) (21%) – – 40 (10) (20%)Non-interest expense 409 50 14% (2) (1%) 820 89 12%
Income before income taxes 297 1 1% (15) (5%) 609 2 1%Income taxes (teb) 52 (38) (41%) (32) (37%) 136 (28) (17%)
Net income 245 39 19% 17 7% 473 30 7%
Amortization of intangible assets (after tax) – (1) nm (1) nm 1 – –
Cash net income 245 38 19% 16 7% 474 30 7%
Return on equity 21.9% 1.0% 2.2% 20.8% (1.3%)Cash return on equity 21.9% 1.0% 2.2% 20.8% (1.3%)Non-interest expense-to-revenue ratio (teb) 56.3% 3.4% 1.0% 55.8% 3.1%Cash non-interest expense-to-revenue ratio (teb) 56.2% 3.4% 0.9% 55.8% 3.1%Net interest margin (teb) 0.43% (0.22%) (0.08%) 0.47% (0.19%)Average assets 167,056 (5,921) (3%) 5,956 4% 164,029 (2,932) (2%)
IBG U.S. Business Select Financial Data (U.S. $ in millions)
Revenue 297 31 12% (10) (3%) 604 66 12%Non-interest expense 153 25 20% (13) (8%) 319 85 36%Net income 79 (3) (4%) – – 158 (16) (9%)Average assets 42,106 5,473 15% (1,348) (3%) 42,791 6,958 19%
nm - not meaningful
Financial Performance ReviewNet income for the second quarter of 2006 of $245 millionincreased $39 million or 19% from the second quarter of 2005,and $17 million or 7.3% from the first quarter. Year to date, netincome was $473 million, an increase of $30 million or 6.8%. Thesecond quarter of 2005 benefited from $44 million ($37 millionafter tax) of revenue recognized on the restructuring of VIEs.Excluding this item, net income in the current quarter increased$76 million or 45% from a year ago, as the benefits of increasedrevenues and a low effective tax rate were only partially offset byhigher expenses. Excluding the VIE revenue, net income for thecurrent year to date increased $67 million or 17%.
Revenue for the second quarter of 2006 increased $46 millionor 6.8% from a year ago, but increased $90 million or 14%excluding the VIE revenue recognized last year and by$117 million or 18% after also excluding the impact of theweaker U.S. dollar. The revenue mix changed from a year ago, aslower net interest income was more than offset by considerablyhigher non-interest revenue due to increased commodity, equityand foreign exchange trading revenues. Strong debt and equityunderwriting contributed to the revenue increase, while mergersand acquisitions fees and commission revenue also rose. Netinvestment securities gains were $19 million in the quarter, upfrom a relatively low $10 million of gains in the second quarterof 2005. There was continued growth in corporate loans, but itsimpact was more than offset by reductions in spreads due tocompetitive market conditions, while spreads were also lower insome of our interest-rate-sensitive businesses. There were lowercash collections on previously impaired loans and further reduc-tions in non-core assets.
Net interest income includes interest earned on trading assetsand the associated costs of funding those assets. The differencebetween these two amounts represents our trading net interestincome. Most of the revenue related to these trading assetsconsists of mark-to-market gains. These gains are included innon-interest trading revenues and are significantly higher thantrading net interest income. Trading net interest income wasmarginally negative this quarter, as compared with positivetrading net interest income in the second quarter of last year andpositive, but low, trading net interest income in the first quarter,due primarily to increased funding costs. The changescontributed to reductions in the Group’s net interest margin.Total trading revenues were very strong in the second quarter,with results up from the prior year but down from the recordtrading revenue of the first quarter.
Net interest income in the second quarter and for the year todate declined from the comparable periods in 2005 due to lowertrading net interest income, the continuing effect of compressedspreads in interest-rate-sensitive businesses, the run-off of non-core assets and reduced spreads on corporate loans in thecompetitive environment. These factors also contributed to adecline in net interest margin. The Group’s net interest marginwas lowered by 9 basis points in the second quarter of 2005 and inthe first six months of 2005 because of the inclusion of $21 billionof VIE assets in IBG’s balance sheet. As such, excluding theimpact of VIE assets, the Group’s net interest margin for thequarter was 31 basis points lower than in the second quarter of2005 and the net interest margin for the year to date was 28 basispoints lower than in the comparable period last year.
Investment Banking Group (IBG)
BMO Q2 06 Eng_v03.qxd 6/3/06 1:10 AM Page 21

Revenue declined $17 million or 2.3% from the first quarter,reflecting reductions in trading revenues, mergers and acquisi-tions fees and cash collections on previously impaired loans.There were increases in equity and debt underwriting fees andsecurities commissions.
Year to date, revenue increased $81 million or 5.9%, butincreased $125 million or 9.4% from the comparable period ayear ago excluding the VIE revenue and by $171 million or 13%after also excluding the impact of the weaker U.S. dollar. Tradingrevenues were appreciably higher than in 2005, particularlycommodity derivatives trading revenues, which have benefitedfrom favourable trading conditions and increased client activi-ties associated with high volatility in energy prices. Significantlyhigher mergers and acquisitions fees and improved commissionrevenue and equity and debt underwriting contributed to therevenue increase. Strong corporate loan growth was more thanoffset by reductions in spreads, while investment securities gainswere lower and there were further reductions in non-core assets,as planned.
Non-interest expense of $409 million in the second quarterincreased $50 million or 14% relative to a year ago, butincreased $61 million or 17% excluding the impact of the weakerU.S. dollar. The increase was primarily due to higher perform-ance-based compensation costs. Relative to the first quarter,expenses declined $2 million or 1%, due to reduced salariesand benefits costs. Year to date, non-interest expense was$820 million, up $89 million or 12% from a year ago and up$108 million or 15% excluding the impact of the weakerU.S. dollar. The increase was largely due to higher performance-based costs. Stronger revenues in 2006 were concentrated inbusinesses with relatively higher variable costs.
The Group’s productivity ratio for the quarter deteriorated by342 basis points from a year ago and by 93 basis points from thefirst quarter to 56.3%. Year to date, the Group’s productivity ratiodeteriorated by 310 basis points to 55.8%.
Net income from U.S. operations of US$79 million wasUS$3 million lower than in the prior year. Excluding theUS$23 million of net income recognized in U.S. results on therestructuring of VIEs in the prior year, net income improvedUS$20 million as increased trading revenues were only partiallyoffset by higher expenses. Net income from U.S. operations wasunchanged from the first quarter, as improved commissionrevenues and lower expenses were offset by lower commodityderivatives trading revenues. Net income from U.S. operationsrepresented 36% of Group net income this quarter, comparedwith 49% a year ago and 40% in the first quarter.
Our U.S. investment banking operations are primarily directedat mid-market corporations having revenues that range fromUS$50 million to US$1 billion. In the quarter, the revenue fromour mid-market portfolio represented 14% of total Grouprevenue and 30% of our U.S. revenue. Often such activities areincluded in personal and commercial banking units by our NorthAmerican peers. Pro-forma results reflecting our U.S.-based mid-market business as part of P&C Chicagoland Banking businessare included in that operating segment’s section of the MD&A.
Business Developments and AchievementsThe Group’s priorities for fiscal 2006 are outlined on page 54 ofBMO’s 2005 Annual Report. Notable business developments andachievements in the second quarter in support of the Group’s2006 priorities are listed below.� During the quarter, BMO Nesbitt Burns participated in
140 new issues that raised a total of $36.3 billion. Theyincluded 40 corporate debt deals, five issues of preferredshares, 77 common equity transactions and 18 governmentdebt issues.
� BMO Nesbitt Burns was one of six firms, and the onlyCanadian investment bank, awarded a mandate to lead a$10 billion IPO for Bank of China, that country’s secondbiggest financial institution. BMO plans to open an investmentbanking office in Beijing in June and intends to compete formore underwriting mandates. The assignment is a strongsignal that BMO is recognized as a firm that can deliverglobally and help Chinese institutions.
� M&A transactions of note that were announced in the quarterincluded Penn West Energy Trust’s acquisition of PetrofundEnergy Trust for $2,966 million and Vincor International’s saleto Constellation Brands for $1,279 million.
� Harris Nesbitt served as lead arranger and administrativeagent for a $450 million syndicated unsecured revolving creditfacility with a $100 million multi-currency carve-outsupporting Jones Lang LaSalle, the world’s leading real estateservice and money management firm. The facility wasexpanded from $325 million to $450 million with a highlyflexible covenant package.
� Harris Nesbitt served as sole provider for $180 million ofexport letter of credit, advising and documentary collectionservices for Gold Kist Inc. Trade Finance’s Tradevenue Directallowed Gold Kist to automate its processes and accommodategrowing international sales. They have chosen Harris Nesbittto process their documents and effect payment to them for allforeign sales.
� Harris Nesbitt served as the advisor on the sale of JLG’sGradall Excavator Product Line to Alamo Group, Inc.
� Financially, the second quarter was the U.S. Securitizationgroup’s best revenue-generating quarter ever. The groupclosed ten conduit transactions during the quarter (adding fivenew clients) and completed two balance sheet loans and fiveterm transactions, acting as co-manager on all.
� Harris Nesbitt’s U.S. Securitization group and PrivatePlacements group acted as sole agent in raising $80 millionof private equity for Flagship Credit Corporation. Flagship isa new automotive finance company based in Chadds Ford, PAthat focuses on non-prime customers.
22 | BMO Financial Group Second Quarter Report 2006
Management’s Discussion and Analysis
BMO Q2 06 Eng_v03.qxd 6/3/06 1:10 AM Page 22

Increase/(Decrease) Increase/(Decrease) Increase/(Decrease)(Canadian $ in millions, except as noted) Q2-2006 vs. Q2-2005 vs. Q1-2006 YTD-2006 vs. YTD-2005
Net interest income (teb) (56) 4 6% (13) (33%) (99) 24 19%Non-interest revenue 22 (12) (35%) (5) (18%) 49 (12) (20%)
Total revenue (teb) (34) (8) (31%) (18) (+100%) (50) 12 17%Provision for (recovery of) credit losses (40) 56 58% 15 26% (95) 58 38%Non-interest expense 23 (34) (60%) (11) (36%) 57 (31) (35%)
Income before taxes and non-controlling interest in subsidiaries (17) (30) (+100%) (22) (+100%) (12) (15) (+100%)
Income taxes (teb) (53) (28) (+100%) (31) (+100%) (75) (28) (57%)Non-controlling interest in subsidiaries 19 5 35% – – 38 10 35%
Net income (loss) 17 (7) (33%) 9 +100% 25 3 6%
Corporate Support U.S. Business Select Financial Data (U.S. $ in millions)
Revenue (13) 9 41% 13 50% (39) 7 15%Provision for credit losses (9) 27 75% 9 50% (27) 32 54%Non-interest expense 3 (28) (90%) 1 50% 5 (36) (88%)Income taxes (7) 10 59% 5 42% (19) 21 53%Net income (loss) (4) – – (1) (33%) (7) (10) (+100%)Average assets 4,505 (107) (2%) 16 – 4,497 (300) (6%)
BMO Financial Group Second Quarter Report 2006 | 23
Corporate SupportCorporate Support includes the corporate units that provideexpertise and governance support to BMO Financial Group inareas such as strategic planning, law, finance, internal audit, riskmanagement, corporate communications, economics, humanresources and learning. Operating results include revenues andexpenses associated with certain securitization activities, thehedging of foreign-source earnings, and activities related to themanagement of certain balance sheet positions and BMO’soverall asset-liability structure.
Technology and SolutionsTechnology and Solutions (T&S) manages, maintains andprovides governance over information technology, operationsservices, real estate and sourcing for BMO Financial Group.The Group focuses on enterprise-wide priorities that improveservice quality and efficiency to deliver an excellent customerexperience.
Financial Performance ReviewTechnology and Solutions operating results are included withCorporate Support for reporting purposes. Costs of its servicesare transferred to the client groups (P&C, PCG and IBG) and onlyrelatively minor variance amounts are retained withinTechnology and Solutions. As such, results in this section largelyreflect Corporate Support activities.
Net income for the quarter was $17 million, compared with$24 million in the second quarter of 2005. Results improvedby $3 million excluding the prior year’s $10 million net impactof a $40 million ($26 million after tax) reduction in the generalallowance for credit losses and a $25 million ($16 million aftertax) litigation provision. The $3 million increase was attributableto higher tax benefits and reduced expenses, partially offset bya reduced recovery of credit losses.
Relative to the first quarter, net income increased $9 milliondue to BMO’s low tax rate and reduced expenses. For the year todate, net income increased $3 million to $25 million, butincreased $13 million excluding the $10 million of significantitems that increased earnings in 2005. The increase was due tothe factors that contributed to the second quarter increase rela-tive to a year ago as well as higher net interest income.
Corporate Support is generally charged (or credited) withdifferences between the periodic provisions for credit lossescharged to the client groups under our expected loss provi-sioning methodology and the required periodic provisionscharged by the consolidated organization under GAAP.
Business Developments and AchievementsT&S focuses on improving profitability by applying the mostefficient and effective technology and processes for BMO. Thefollowing notable business development was supported by T&Sin the second quarter of 2006.� BMO’s new state-of-the-art data centre and office building, the
Barrie Computer Centre, is on schedule for occupancy in thesummer of 2006. This facility will enhance BMO’s highlyefficient processing infrastructure, providing technologicaladvancements in a geographically separated, dual processing-site with split operations. It will also enable BMO to rapidlyadapt and respond to risks and opportunities while maintainingcontinuous business operations.
Corporate Support, Including Technology and Solutions
BMO Q2 06 Eng_v03.qxd 6/3/06 1:10 AM Page 23

24 | BMO Financial Group Second Quarter Report 2006
Consolidated Financial Statements
Consolidated Statement of Income
(Unaudited) (Canadian $ in millions, except as noted) For the three months ended For the six months ended
April 30, January 31, October 31, July 31, April 30, April 30, April 30,
2006 2006 2005 2005 2005 2006 2005
Interest, Dividend and Fee IncomeLoans $ 2,340 $ 2,242 $ 2,098 $ 1,989 $ 1,843 $ 4,582 $ 3,641 Securities 473 509 457 484 461 982 889 Deposits with banks 172 167 164 170 160 339 272
2,985 2,918 2,719 2,643 2,464 5,903 4,802
Interest Expense Deposits 1,308 1,213 1,074 961 875 2,521 1,668 Subordinated debt 41 42 47 56 52 83 99 Preferred shares and capital trust securities 25 25 25 21 26 50 51 Other liabilities 498 456 379 391 330 954 605
1,872 1,736 1,525 1,429 1,283 3,608 2,423
Net Interest Income 1,113 1,182 1,194 1,214 1,181 2,295 2,379 Provision for credit losses (Note 3) 66 52 57 73 6 118 49
Net Interest Income After Provision for Credit Losses 1,047 1,130 1,137 1,141 1,175 2,177 2,330
Non-Interest RevenueSecurities commissions and fees 292 252 272 255 299 544 565 Deposit and payment service charges 179 180 187 188 180 359 359 Trading revenues 180 221 169 83 60 401 161 Lending fees 77 78 76 89 73 155 148 Card fees 94 91 60 98 88 185 176 Investment management and custodial fees 69 76 77 79 74 145 149 Mutual fund revenues 126 115 116 113 106 241 208 Securitization revenues 4 20 34 26 33 24 53 Underwriting and advisory fees 113 98 101 92 77 211 164 Investment securities gains 30 18 79 37 12 48 49 Foreign exchange, other than trading 49 43 48 42 45 92 90 Insurance income 51 46 38 44 39 97 80 Other 96 61 169 51 130 157 227
1,360 1,299 1,426 1,197 1,216 2,659 2,429
Net Interest Income and Non-Interest Revenue 2,407 2,429 2,563 2,338 2,391 4,836 4,759
Non-Interest ExpenseEmployee compensation (Note 6) 943 965 962 933 925 1,908 1,851 Premises and equipment 296 288 334 315 312 584 615 Amortization of intangible assets 12 11 22 24 24 23 48 Travel and business development 63 50 69 68 60 113 110 Communications 31 25 33 29 32 56 60 Business and capital taxes 25 27 28 29 26 52 50 Professional fees 72 58 65 58 59 130 120 Other 129 121 123 123 141 250 258
Total Non-Interest Expense 1,571 1,545 1,636 1,579 1,579 3,116 3,112
Income Before Provision for Income Taxes andNon-Controlling Interest in Subsidiaries 836 884 927 759 812 1,720 1,647
Income taxes 173 235 254 204 198 408 417
663 649 673 555 614 1,312 1,230 Non-controlling interest in subsidiaries 19 19 16 14 14 38 28
Net Income $ 644 $ 630 $ 657 $ 541 $ 600 $ 1,274 $ 1,202
Preferred share dividends $ 8 $ 8 $ 8 $ 6 $ 8 $ 16 $ 16 Net income available to common shareholders $ 636 $ 622 $ 649 $ 535 $ 592 $ 1,258 $ 1,186 Average common shares (in thousands) 502,502 501,374 500,383 499,152 499,415 501,929 500,357 Average diluted common shares (in thousands) 512,743 511,600 510,378 509,384 510,237 512,146 511,611
Earnings Per Share (Canadian $)
Basic $ 1.27 $ 1.24 $ 1.30 $ 1.07 $ 1.19 $ 2.51 $ 2.37 Diluted 1.24 1.22 1.27 1.05 1.16 2.46 2.32 Dividends Declared Per Common Share 0.53 0.49 0.49 0.46 0.46 1.02 0.90
The accompanying notes to consolidated financial statements are an integral part of these statements.
BMO Q2 06 Eng_v03.qxd 6/3/06 1:10 AM Page 24

BMO Financial Group Second Quarter Report 2006 | 25
(Unaudited) (Canadian $ in millions) As at
April 30, January 31, October 31, July 31, April 30,
2006 2006 2005 2005 2005
AssetsCash Resources $ 19,560 $ 19,933 $ 20,721 $ 20,402 $ 21,141
Securities Investment 13,075 12,032 12,936 14,175 15,698 Trading 45,850 49,644 44,309 43,146 43,717 Loan substitutes 11 11 11 11 11
58,936 61,687 57,256 57,332 59,426
Loans Residential mortgages 63,055 62,652 60,871 59,737 57,703 Consumer instalment and other personal 28,873 28,206 27,929 27,241 26,714 Credit cards 4,874 4,709 4,648 4,717 4,557 Businesses and governments 52,121 48,289 47,803 48,181 47,716 Securities borrowed or purchased under resale agreements 33,116 29,853 28,280 27,259 31,357
182,039 173,709 169,531 167,135 168,047 Customers’ liability under acceptances 6,639 5,988 5,934 5,683 5,814 Allowance for credit losses (Note 3) (1,117) (1,115) (1,128) (1,200) (1,220)
187,561 178,582 174,337 171,618 172,641
Other Assets Derivative financial instruments 31,523 30,664 31,517 26,174 23,031 Premises and equipment 1,841 1,818 1,847 1,863 1,875 Goodwill 1,098 1,109 1,091 1,604 1,632 Intangible assets 172 186 196 426 462 Other 11,719 11,786 10,567 10,970 12,148
46,353 45,563 45,218 41,037 39,148
Total Assets $ 312,410 $ 305,765 $ 297,532 $ 290,389 $ 292,356
Liabilities and Shareholders’ EquityDepositsBanks $ 23,394 $ 25,940 $ 25,473 $ 25,265 $ 23,536 Businesses and governments 94,234 90,783 92,437 87,462 89,698 Individuals 76,860 76,536 75,883 76,023 77,811
194,488 193,259 193,793 188,750 191,045
Other Liabilities Derivative financial instruments 30,413 28,810 28,868 24,972 21,862 Acceptances 6,639 5,988 5,934 5,683 5,814 Securities sold but not yet purchased 15,653 14,161 16,142 14,703 13,674 Securities lent or sold under repurchase agreements 31,467 31,005 22,657 26,159 28,694 Other 14,713 14,299 12,203 11,826 12,887
98,885 94,263 85,804 83,343 82,931
Subordinated Debt (Note 7) 3,025 2,456 2,469 3,099 3,420
Preferred Share Liability (Note 8) 450 450 450 450 450
Capital Trust Securities 1,150 1,150 1,150 1,150 1,150
Shareholders’ Equity Share capital (Note 8) 4,741 4,716 4,618 4,585 4,512 Contributed surplus 26 23 20 18 15 Net unrealized foreign exchange loss (806) (740) (612) (483) (380)Retained earnings 10,451 10,188 9,840 9,477 9,213
14,412 14,187 13,866 13,597 13,360
Total Liabilities and Shareholders’ Equity $ 312,410 $ 305,765 $ 297,532 $ 290,389 $ 292,356
The accompanying notes to consolidated financial statements are an integral part of these statements.
Consolidated Balance Sheet
BMO Q2 06 Eng_v03.qxd 6/3/06 1:10 AM Page 25
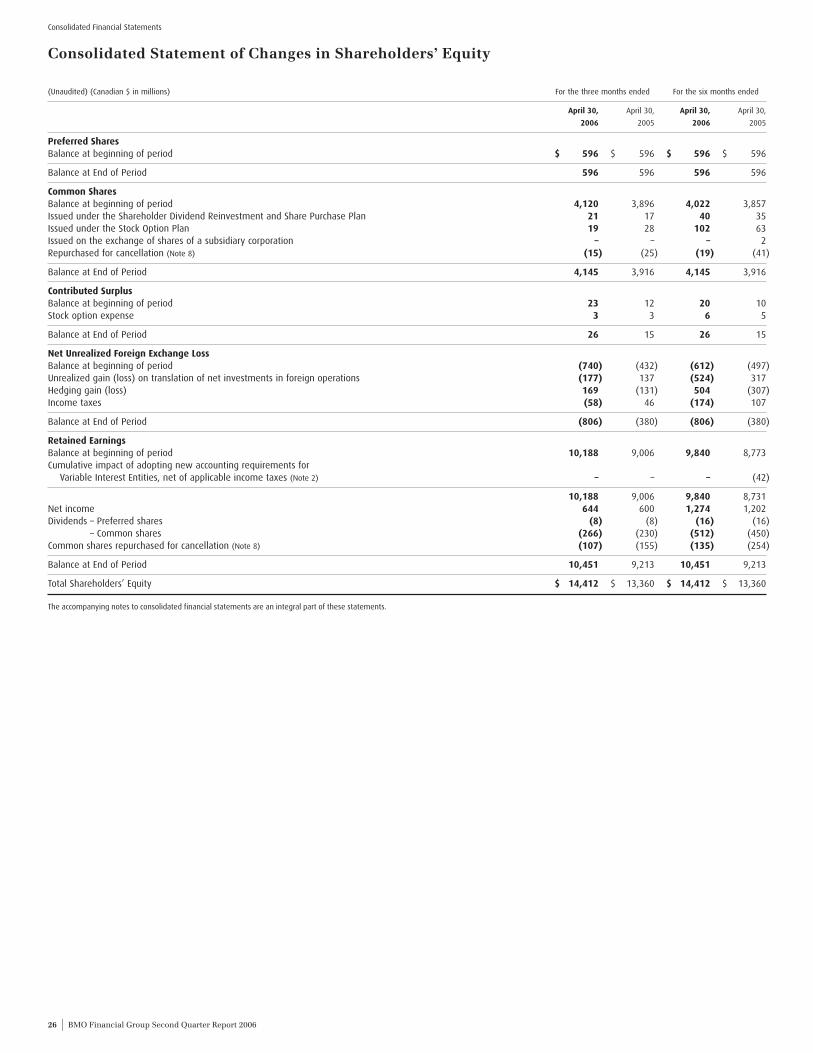
26 | BMO Financial Group Second Quarter Report 2006
Consolidated Financial Statements
(Unaudited) (Canadian $ in millions) For the three months ended For the six months ended
April 30, April 30, April 30, April 30,
2006 2005 2006 2005
Preferred SharesBalance at beginning of period $ 596 $ 596 $ 596 $ 596
Balance at End of Period 596 596 596 596
Common Shares Balance at beginning of period 4,120 3,896 4,022 3,857 Issued under the Shareholder Dividend Reinvestment and Share Purchase Plan 21 17 40 35 Issued under the Stock Option Plan 19 28 102 63 Issued on the exchange of shares of a subsidiary corporation – – – 2 Repurchased for cancellation (Note 8) (15) (25) (19) (41)
Balance at End of Period 4,145 3,916 4,145 3,916
Contributed SurplusBalance at beginning of period 23 12 20 10 Stock option expense 3 3 6 5
Balance at End of Period 26 15 26 15
Net Unrealized Foreign Exchange LossBalance at beginning of period (740) (432) (612) (497)Unrealized gain (loss) on translation of net investments in foreign operations (177) 137 (524) 317 Hedging gain (loss) 169 (131) 504 (307)Income taxes (58) 46 (174) 107
Balance at End of Period (806) (380) (806) (380)
Retained Earnings Balance at beginning of period 10,188 9,006 9,840 8,773 Cumulative impact of adopting new accounting requirements for
Variable Interest Entities, net of applicable income taxes (Note 2) – – – (42)
10,188 9,006 9,840 8,731 Net income 644 600 1,274 1,202 Dividends – Preferred shares (8) (8) (16) (16)
– Common shares (266) (230) (512) (450)Common shares repurchased for cancellation (Note 8) (107) (155) (135) (254)
Balance at End of Period 10,451 9,213 10,451 9,213
Total Shareholders’ Equity $ 14,412 $ 13,360 $ 14,412 $ 13,360
The accompanying notes to consolidated financial statements are an integral part of these statements.
Consolidated Statement of Changes in Shareholders’ Equity
BMO Q2 06 Eng_v03.qxd 6/3/06 1:10 AM Page 26

BMO Financial Group Second Quarter Report 2006 | 27
(Unaudited) (Canadian $ in millions) For the three months ended For the six months ended
April 30, April 30, April 30, April 30,
2006 2005 2006 2005
Cash Flows from Operating ActivitiesNet income $ 644 $ 600 $ 1,274 $ 1,202 Adjustments to determine net cash flows provided by (used in) operating activities
Write-down of investment securities – – 8 7Net gain on investment securities (30) (12) (56) (56)Net (increase) decrease in trading securities 3,474 (5,390) (2,518) (7,663)Provision for credit losses 66 6 118 49 Loss (gain) on sale of securitized loans (Note 4) 2 (23) (12) (42)Change in derivative financial instruments
(Increase) decrease in derivative asset (1,670) (563) (699) 2,093 Increase (decrease) in derivative liability 2,445 259 2,303 (1,837)
Amortization of premises and equipment 89 90 177 185 Amortization of intangible assets 12 24 23 48 Future income tax (benefit) expense (34) (11) 8 40 Net decrease in current income taxes (137) (65) (235) (344)Change in accrued interest
Increase in interest receivable (32) (113) (38) (151)Increase (decrease) in interest payable 74 89 (10) 84
Changes in other items and accruals, net 806 1,812 1,463 39
Net Cash Provided by (Used in) Operating Activities 5,709 (3,297) 1,806 (6,346)
Cash Flows from Financing ActivitiesNet increase in deposits 2,481 7,386 4,482 12,273 Net increase (decrease) in securities sold but not yet purchased 1,515 1,868 (436) 3,180 Net increase in securities lent or sold under repurchase agreements 758 5,047 9,626 6,846 Net increase in liabilities of subsidiaries 395 734 723 497 Repayment of subordinated debt (Note 7) (125) – (125) – Proceeds from issuance of subordinated debt (Note 7) 700 500 700 1,000 Proceeds from issuance of common shares 40 45 142 98 Common shares repurchased for cancellation (Note 8) (122) (180) (154) (295)Dividends paid (274) (238) (528) (466)
Net Cash Provided by Financing Activities 5,368 15,162 14,430 23,133
Cash Flows from Investing Activities Net (increase) decrease in interest bearing deposits with banks (31) (1,299) 891 (2,673)Purchases of investment securities (4,203) (4,011) (6,375) (8,322)Maturities of investment securities 1,472 1,742 3,369 3,860 Proceeds from sales of investment securities 1,530 1,909 2,392 4,377 Net increase in loans, customers’ liability under acceptances and loan substitute securities (7,776) (5,121) (12,040) (7,329)Proceeds from securitization of loans (Note 4) 1,279 695 1,775 1,438 Net increase in securities borrowed or purchased under resale agreements (3,457) (6,649) (5,467) (8,278)Proceeds from sales of land and buildings – 148 – 148 Premises and equipment – net purchases (122) (90) (198) (139)Acquisitions (Note 5) (1) – (76) (194)
Net Cash Used in Investing Activities (11,309) (12,676) (15,729) (17,112)
Effect of Exchange Rate Changes on Cash and Cash Equivalents (75) 125 (169) 208
Net Increase (Decrease) in Cash and Cash Equivalents (307) (686) 338 (117)Cash and Cash Equivalents at Beginning of Period 3,057 3,175 2,412 2,606
Cash and Cash Equivalents at End of Period $ 2,750 $ 2,489 $ 2,750 $ 2,489
The accompanying notes to consolidated financial statements are an integral part of these statements.Certain comparative figures have been reclassified to conform with the current period’s presentation.
Consolidated Statement of Cash Flows
BMO Q2 06 Eng_v03.qxd 6/3/06 1:10 AM Page 27

28 | BMO Financial Group Second Quarter Report 2006
Notes to Consolidated Financial Statements For the six months ended April 30, 2006 (Unaudited)
These consolidated financial statements should be read in conjunctionwith the notes to our consolidated financial statements for the yearended October 31, 2005 as set out on pages 96 to 133 of our 2005Annual Report. These consolidated financial statements have been
prepared in accordance with Canadian generally accepted accountingprinciples (“GAAP”) using the same accounting policies and methodsof computation as were used for our consolidated financial statementsfor the year ended October 31, 2005.
Variable Interest Entities On November 1, 2004, we adopted the Canadian Institute of CharteredAccountant’s (“CICA”) new accounting requirements on the consolida-tion of variable interest entities (“VIEs”). As a result, we consolidatedour customer securitization vehicles as of November 1, 2004. Theimpact on our Consolidated Balance Sheet on November 1, 2004 wasan increase in other assets of $21,160 million, a decrease in derivativefinancial instrument assets of $67 million, an increase in other liabili-ties of $21,150 million, a decrease in derivative financial instrumentliabilities of $15 million and a decrease in opening retained earningsof $42 million.
The impact on opening retained earnings arose because interestrate swaps held by our VIEs to hedge their exposure to interest raterisk did not qualify for hedge accounting prior to consolidation. Sincethe new rules required us to reflect the results of the consolidatedVIEs as if they had always been consolidated, without restatement of
prior periods, the amount of mark-to-market losses prior to November1, 2004 was recognized through our opening retained earnings. Thesederivatives qualified for hedge accounting while the VIEs wereconsolidated.
On April 29, 2005, we completed the restructuring of our customersecuritization VIEs and as a result they no longer met the criteria forconsolidation. The impact on the Consolidated Statement of Incomeof deconsolidating these entities on April 29, 2005 was an increase innon-interest revenue, other, of $44 million, an increase in incometaxes of $7 million and an increase in net income of $37 million,representing the reversal of the unamortized mark-to-market losses on swaps that had been charged against retained earnings.
Our involvement with these and other VIEs is summarized inNote 8 to our consolidated financial statements for the year endedOctober 31, 2005, as set out on pages 105 and 106 of our 2005 AnnualReport.
Note 1 � Basis of Presentation
Note 2 � Changes in Accounting Policy
The allowance for credit losses recorded in our Consolidated BalanceSheet is maintained at a level that we consider adequate to absorbcredit-related losses on our loans, customers’ liability under accept-ances and other credit instruments. The portion related to other credit
instruments is recorded in other liabilities in our ConsolidatedBalance Sheet.
A continuity of our allowance for credit losses is as follows:
Note 3 � Allowance for Credit Losses
During the quarter ended April 30, 2006, we securitized residentialmortgages totalling $1,304 million for total cash proceeds of $1,279million ($1,804 million and $1,775 million respectively, for the sixmonths ended April 30, 2006). The key weighted average assumptionsused to value the deferred purchase price for these securitizationswas an average term of 4.2 years, a prepayment rate of 8.00%, aninterest rate of 4.64% and a discount rate of 4.26% (4.4 years and9.72%, 4.74% and 4.10% respectively, for the six months ended April 30, 2006). There were no expected credit losses as the mort-gages are guaranteed by third parties. We retained responsibility
for servicing these mortgages. We recorded $11 million of losses innon-interest revenue, securitization revenues, $36 million of deferredpurchase price in other assets and $10 million of servicing liability inother liabilities related to the securitization of those loans ($10 million,$50 million and $13 million respectively, for the six months endedApril 30, 2006).
In addition, gains on sales of loans sold to all revolving securitiza-tion vehicles were $9 million, for the quarter ended April 30, 2006(gains of $22 million for the six months ended April 30, 2006).
Note 4 � Securitization
(Canadian $ in millions) For the three months ended For the six months ended
Specific allowance General allowance Total Specific allowance General allowance Total
April 30, April 30, April 30, April 30, April 30, April 30, April 30, April 30, April 30, April 30, April 30, April 30,
2006 2005 2006 2005 2006 2005 2006 2005 2006 2005 2006 2005
Balance at beginning of period $ 170 $ 297 $ 945 $ 1,017 $ 1,115 $ 1,314 $ 169 $ 298 $ 959 $ 1,010 $ 1,128 $ 1,308 Provision for credit losses 66 46 – (40) 66 6 118 89 – (40) 118 49 Recoveries 35 15 – – 35 15 55 31 – – 55 31 Write-offs (91) (107) – – (91) (107) (162) (179) – – (162) (179)Foreign exchange and other (2) 3 (6) 6 (8) 9 (2) 15 (20) 13 (22) 28
Balance at end of period $ 178 $ 254 $ 939 $ 983 $ 1,117 $ 1,237 $ 178 $ 254 $ 939 $ 983 $ 1,117 $ 1,237
Comprised of:Loans $ 178 $ 237 $ 939 $ 983 $ 1,117 $ 1,220 $ 178 $ 237 $ 939 $ 983 $ 1,117 $ 1,220 Other credit instruments – 17 – – – 17 – 17 – – – 17
BMO Q2 06 Eng_v03.qxd 6/3/06 1:10 AM Page 28

BMO Financial Group Second Quarter Report 2006 | 29
Villa Park Trust and Savings BankOn December 1, 2005, we completed the acquisition of Chicago-basedVilla Park Trust and Savings Bank (“Villa Park”), a community bank,for total cash consideration of $76 million. The results of Villa Park’soperations have been included in our consolidated financial state-ments since that date. The acquisition of Villa Park provides us withthe opportunity to expand our banking services in the Chicago,Illinois market. As part of this acquisition, we acquired a core depositintangible asset, which will be amortized on an accelerated basis over10 years. Goodwill related to this acquisition is not deductible for taxpurposes. Villa Park is part of our Personal and Commercial ClientGroup – Chicagoland Banking reporting segment.
The estimated fair values of the assets acquired and the liabilitiesassumed at the date of acquisition are as follows:
(Canadian $ in millions) Villa Park
Cash resources $ 16Securities 54Loans 247Premises and equipment 4Goodwill 44Core deposit intangible asset 7Other assets 4
Total assets 376
Deposits 296Other liabilities 4
Total liabilities 300
Purchase price $ 76
The purchase price allocation is subject to refinement as we complete the valuation of the assetsacquired and liabilities assumed.
During the quarter ended January 31, 2005, we acquired MercantileBancorp, Inc., a community bank, for total cash consideration of$194 million.
Note 5 � Acquisition
Stock OptionsDuring the six months ended April 30, 2006, we granted a total of1,379,100 stock options. The weighted-average fair value of these optionswas $10.18 per option and was determined using a trinomial optionpricing model, based on the following weighted-average assumptions:
For stock options granted during the six months ended April 30, 2006
Expected dividend yield 3.1%Expected share price volatility 20.2%Risk-free rate of return 4.0%Expected period until exercise 7.2 years
Future Change in Accounting PolicyDuring the quarter ended April 30, 2006, the CICA issued proposed require-ments for comment on stock-based compensation. Under these proposedrequirements, stock-based compensation granted to employees eligible toretire should be expensed at the time of grant. Stock-based compensationgranted to employees eligible to retire during the vesting period should beexpensed over the period from the grant date to the date that the employeeis eligible to retire. Currently, these amounts are expensed over the vestingperiod. The effective date has not been finalized; however, we expect toadopt these new requirements in the year ended October 31, 2006 on aretroactive basis. We do not expect this change to have a material impact onour Consolidated Statement of Income for the year ending October 31, 2006.
Note 6 � Employee Compensation
(Canadian $ in millions) Pension benefit plans Other employee future benefit plans
For the three months ended For the three months ended
April 30, 2006 April 30, 2005 April 30, 2006 April 30, 2005
Benefits earned by employees $ 35 $ 31 $ 5 $ 4Interest cost on accrued benefit liability 52 50 11 11Actuarial loss recognized in expense 21 17 3 3Amortization of plan amendment costs 2 1 – (2)Expected return on plan assets (64) (57) (1) (1)
Benefits expense 46 42 18 15Canada and Quebec pension plan expense 15 14 – –Defined contribution expense 3 3 – –
Total pension and other employee future benefit expenses $ 64 $ 59 $ 18 $ 15
(Canadian $ in millions) Pension benefit plans Other employee future benefit plans
For the six months ended For the six months ended
April 30, 2006 April 30, 2005 April 30, 2006 April 30, 2005
Benefits earned by employees $ 69 $ 62 $ 10 $ 8Interest cost on accrued benefit liability 104 101 22 22Actuarial loss recognized in expense 42 33 7 6Amortization of plan amendment costs 3 2 (2) (3)Expected return on plan assets (126) (114) (2) (2)
Benefits expense 92 84 35 31Canada and Quebec pension plan expense 28 26 – –Defined contribution expense 6 6 – –
Total pension and other employee future benefit expenses $ 126 $ 116 $ 35 $ 31
Pension and Other Employee Future Benefit ExpensesWe recorded pension and other employee future benefit expenses as follows:
BMO Q2 06 Eng_v03.qxd 6/3/06 1:10 AM Page 29

30 | BMO Financial Group Second Quarter Report 2006
On March 14, 2006, we redeemed all of our 7.40% Debentures, Series19, due 2011, totalling $125 million. The debentures were redeemed ata redemption price of 100 per cent of the principal amount plusunpaid accrued interest to the redemption date.
On April 21, 2006, we issued $700 million of subordinated debtunder our Canadian Medium-Term Note Program. The issue, Series DMedium-Term Notes, First Tranche, is due April 2021. Interest on this
issue is payable semi-annually at a fixed rate of 5.10% until April 21,2016, and at a floating rate equal to the rate on three month Bankers’Acceptances plus 1.00%, paid quarterly, thereafter to maturity.
On May 9, 2006, we redeemed all of our 8.15% Debentures, Series21, due 2011, totalling $300 million. The debentures were redeemed at a redemption price of 100 per cent of the principal amount plusunpaid accrued interest to the redemption date.
During the quarter ended April 30, 2006, we repurchased 1,861,300common shares at an average cost of $65.63 per share, totalling $122million. During the quarter ended April 30, 2005, we repurchased3,252,800 common shares at an average cost of $55.48 per share,totalling $180 million. During the six months ended April 30, 2006,we repurchased 2,399,500 common shares at an average cost of$64.45 per share, totalling $154 million. During the six months ended
April 30, 2005, we repurchased 5,299,300 common shares at anaverage cost of $55.74 per share, totalling $295 million.
There have been 3,215,800 common shares repurchased under theexisting normal course issuer bid that expires on September 5, 2006and pursuant to which we are permitted to repurchase up to15,000,000 common shares.
Share Capital Outstanding (a)(Canadian $ in millions, except as noted) April 30, 2006
PrincipalNumber Amount Convertible into…
Preferred Shares – classified as liabilitiesClass B – Series 4 8,000,000 $ 200 common shares (b)
Class B – Series 6 10,000,000 250 common shares (b)
Preferred Shares – classified as liabilities 450
Preferred Shares – classified as equityClass B – Series 5 8,000,000 200 –Class B – Series 10 (c) 12,000,000 396 common shares (b)
Preferred Shares – classified as equity 596Common Shares 501,652,267 4,145 –
Total outstanding share capital – classified as equity $ 4,741
Stock options issued under stock option plan n/a 25,068,526 common shares
Note 7 � Subordinated Debt
Note 8 � Share Capital
During the quarter ended January 31, 2006, we adopted the newUnited States accounting standard on stock-based compensationprospectively, beginning with grants issued in the quarter. UnderUnited States GAAP, stock-based compensation granted toemployees eligible to retire should be expensed at the time of grant.The impact of adopting this standard was to decrease non-interest
expense by $4 million ($2 million after tax) in the quarter endedApril 30, 2006 and increase non-interest expense by $38 million($27 million after tax) in the six months ended April 30, 2006. UnderCanadian GAAP, stock-based compensation is expensed over thevesting period.
Note 9 � United States Generally Accepted Accounting Principles
(a) For additional information refer to Notes 20 and 21 to our consolidated financial statements forthe year ended October 31, 2005 on pages 118 to 120 of our 2005 Annual Report.
(b) The number of shares issuable on conversion is not determinable until the date of conversion.
(c) Face value is US$300 million.
n/a – not applicable
Notes to Consolidated Financial Statements
Reporting under United States GAAP would have resulted in the following:
(Canadian $ in millions, except earnings per share figures) For the three months ended For the six months ended
April 30, 2006 April 30, 2005 April 30, 2006 April 30, 2005
Net Income – Canadian GAAP $ 644 $ 600 $ 1,274 $ 1,202 United States GAAP adjustments 5 (34) (56) (86)
Net Income – United States GAAP $ 649 $ 566 $ 1,218 $ 1,116
Earnings Per ShareBasic – Canadian GAAP $ 1.27 $ 1.19 $ 2.51 $ 2.37 Basic – United States GAAP 1.27 1.12 2.39 2.20 Diluted – Canadian GAAP 1.24 1.16 2.46 2.32 Diluted – United States GAAP 1.25 1.09 2.35 2.15
BMO Q2 06 Eng_v03.qxd 6/3/06 1:10 AM Page 30

BMO Financial Group Second Quarter Report 2006 | 31
Operating GroupsWe conduct our business through operating groups, each of whichhas a distinct mandate. We determine operating groups based on ourmanagement structure and therefore our groups and results attributedto our groups may not be comparable with those of other financialservices companies. We evaluate the performance of our groups usingmeasures such as net income, return on equity, net economic profitand non-interest expense-to-revenue (productivity) ratio.
Beginning in the quarter ended January 31, 2006, we have amendedour segment information to include both Personal and CommercialClient Group – Canada and Personal and Commercial Client Group –Chicagoland Banking as reporting segments. Prior period informationhas been restated to reflect this new reporting basis.
Personal and Commercial Client GroupPersonal and Commercial Client Group is comprised of two operatingsegments – Personal and Commercial Client Group – Canada andPersonal and Commercial Client Group – Chicagoland Banking.
Personal and Commercial Client Group – CanadaPersonal and Commercial Client Group – Canada (“P&C Canada”)offers a full range of products and services to personal and businessclients in Canada through branches and direct banking channels suchas telephone banking, online banking and a network of automatedbanking machines.
Personal and Commercial Client Group – Chicagoland BankingPersonal and Commercial Client Group – Chicagoland Banking (“P&CChicagoland Banking”) offers a full range of products and services topersonal and business clients in the United States, primarily in theChicago area and Northwest Indiana, through branches and directbanking channels such as telephone banking, online banking and anetwork of automated banking machines.
Private Client GroupPrivate Client Group (“PCG”) brings together all of our wealth manage-ment businesses. Operating primarily in Canada and the United States,PCG serves a full range of North American client segments, from main-stream to ultra-high net worth, as well as select institutional marketsegments. PCG offers its clients a broad range of wealth managementproducts and services, including full-service and direct investing,private banking and investment products, providing the tools theyneed to accumulate, protect and grow their financial assets.
Investment Banking GroupInvestment Banking Group (“IBG”) combines all of our businessesserving corporate, institutional and government clients. In Canada, itsclient base comprises large corporations and institutions across abroad range of industry sectors. In the United States, it serves middle-market and institutional clients in selected sectors. IBG also servesinstitutional and government clients in the United Kingdom, Europeand Asia. It offers clients complete financial solutions across the entirebalance sheet, including public and private debt and equity under-writing, cash management, corporate lending, securitization, foreignexchange and trade finance. The Group also offers financial advisoryservices in mergers and acquisitions and restructurings, whileproviding investing clients with research, sales and trading services.
Corporate SupportCorporate Support includes Technology and Solutions (“T&S”) andthe Corporate units that provide expertise and governance support inareas such as strategic planning, law, finance, internal audit, riskmanagement, corporate communications, economics, corporatemarketing, human resources and learning. Operating results forCorporate Support include revenues and expenses associated withcertain securitization activities, the hedging of foreign-source earn-ings and activities related to the management of certain balance sheetpositions and our overall asset liability structure.
T&S manages, maintains and provides governance over informa-tion technology, real estate, operations services and sourcing for theBank. The unit focuses on enterprise-wide priorities that improvequality and efficiency.
Operating results for T&S are included with Corporate Support forreporting purposes. However, costs of T&S services are transferred toP&C, PCG, and IBG and only minor amounts are retained in T&S’sresults. As such, results for Corporate Support largely reflect oper-ating results of Corporate units.
Corporate Support also includes residual revenues and expensesrepresenting the differences between actual amounts earned orincurred and the amounts allocated to operating groups.
Basis of PresentationThe results of these operating groups are based on our internal finan-cial reporting systems. The accounting policies used in these groupsare generally consistent with those followed in the preparation of theconsolidated financial statements as disclosed in Notes 1 and 2.Notable accounting measurement differences are the taxable equiva-lent basis adjustment and the provision for credit losses, as describedbelow.
Taxable Equivalent BasisWe analyze net interest income on a taxable equivalent basis (“teb”).This basis includes an adjustment which increases GAAP revenuesand the GAAP provision for income taxes by an amount that wouldraise revenues on certain tax-exempt securities to a level that wouldincur tax at the statutory rate.
Analysis on a teb basis neutralizes the impact of investing in tax-exempt or tax-advantaged securities rather than fully taxable securitieswith higher yields. It reduces distortions in net interest income relatedto the choice of tax-advantaged and taxable investments.
Provisions for Credit LossesProvisions for credit losses are generally allocated to each groupbased on expected losses for that group over an economic cycle.Differences between expected loss provisions and provisions requiredunder GAAP are included in Corporate Support.
Inter-Group AllocationsVarious estimates and allocation methodologies are used in thepreparation of the operating groups’ financial information. We allo-cate expenses directly related to earning revenue to the groups thatearned the related revenue. Expenses not directly related to earningrevenue, such as overhead expenses, are allocated to operatinggroups using allocation formulas applied on a consistent basis.Operating group net interest income reflects internal funding chargesand credits on the groups’ assets, liabilities and capital, at marketrates, taking into account relevant terms and currency considerations.The offset of the net impact of these charges and credits is reflected inCorporate Support.
Geographic InformationWe operate primarily in Canada and the United States but also haveoperations in the United Kingdom, Europe, the Caribbean and Asia,which are grouped in Other Countries. We allocate our results bygeographic region based on the location of the unit responsible formanaging the related assets, liabilities, revenues and expenses,except for the consolidated provision for credit losses, which is allo-cated based upon the country of ultimate risk.
Prior periods have been restated to give effect to the current period’sorganization structure and presentation changes.
Note 10 � Operating and Geographic Segmentation
BMO Q2 06 Eng_v03.qxd 6/3/06 1:10 AM Page 31

32 | BMO Financial Group Second Quarter Report 2006
Our results and average assets, allocated by operating segment, are as follows:
(Canadian $ in millions)
P&CP&C Chicagoland Corporate Total Teb Total
For the three months ended April 30, 2006 Canada Banking PCG IBG Support (1) (teb basis)(2) adjustments (GAAP basis)
Net interest income $ 700 $ 187 $ 138 $ 174 $ (56) $ 1,143 $ (30) $ 1,113 Non-interest revenue 397 40 349 552 22 1,360 – 1,360
Total Revenue 1,097 227 487 726 (34) 2,503 (30) 2,473 Provision for credit losses 79 7 – 20 (40) 66 – 66 Non-interest expense 628 174 337 409 23 1,571 – 1,571
Income before taxes and non-controlling interest in subsidiaries 390 46 150 297 (17) 866 (30) 836 Income taxes 131 19 54 52 (53) 203 (30) 173 Non-controlling interest in subsidiaries – – – – 19 19 – 19
Net Income $ 259 $ 27 $ 96 $ 245 $ 17 $ 644 $ – $ 644
Average Assets $ 113,878 $ 21,936 $ 6,428 $ 167,056 $ 4,788 $ 314,086 $ – $ 314,086
Goodwill (As At) $ 93 $ 581 $ 324 $ 98 $ 2 $ 1,098 $ – $ 1,098
P&CP&C Chicagoland Corporate Total Teb Total
For the three months ended April 30, 2005 Canada Banking PCG IBG Support (1) (teb basis)(2) adjustments (GAAP basis)
Net interest income $ 672 $ 185 $ 143 $ 272 $ (60) $ 1,212 $ (31) $ 1,181 Non-interest revenue 371 43 360 408 34 1,216 – 1,216
Total Revenue 1,043 228 503 680 (26) 2,428 (31) 2,397 Provision for credit losses 68 8 1 25 (96) 6 – 6 Non-interest expense 611 170 382 359 57 1,579 – 1,579
Income before taxes and non-controlling interest in subsidiaries 364 50 120 296 13 843 (31) 812 Income taxes 101 20 43 90 (25) 229 (31) 198 Non-controlling interest in subsidiaries – – – – 14 14 – 14
Net Income $ 263 $ 30 $ 77 $ 206 $ 24 $ 600 $ – $ 600
Average Assets $ 104,408 $ 21,287 $ 7,068 $ 172,977 $ 5,122 $ 310,862 $ – $ 310,862
Goodwill (As At) $ 93 $ 599 $ 834 $ 103 $ 3 $ 1,632 $ – $ 1,632
P&CP&C Chicagoland Corporate Total Teb Total
For the six months ended April 30, 2006 Canada Banking PCG IBG Support (1) (teb basis)(2) adjustments (GAAP basis)
Net interest income $ 1,426 $ 372 $ 276 $ 381 $ (99) $ 2,356 $ (61) $ 2,295 Non-interest revenue 767 80 675 1,088 49 2,659 – 2,659
Total Revenue 2,193 452 951 1,469 (50) 5,015 (61) 4,954 Provision for credit losses 157 15 1 40 (95) 118 – 118 Non-interest expense 1,246 334 659 820 57 3,116 – 3,116
Income before taxes and non-controlling interest in subsidiaries 790 103 291 609 (12) 1,781 (61) 1,720 Income taxes 265 42 101 136 (75) 469 (61) 408 Non-controlling interest in subsidiaries – – – – 38 38 – 38
Net Income $ 525 $ 61 $ 190 $ 473 $ 25 $ 1,274 $ – $ 1,274
Average Assets $ 112,653 $ 21,778 $ 6,428 $ 164,029 $ 4,670 $ 309,558 $ – $ 309,558
Goodwill (As At) $ 93 $ 581 $ 324 $ 98 $ 2 $ 1,098 $ – $ 1,098
P&CP&C Chicagoland Corporate Total Teb Total
For the six months ended April 30, 2005 Canada Banking PCG IBG Support (1) (teb basis)(2) adjustments (GAAP basis)
Net interest income $ 1,371 $ 359 $ 283 $ 548 $ (123) $ 2,438 $ (59) $ 2,379 Non-interest revenue 741 85 702 840 61 2,429 – 2,429
Total Revenue 2,112 444 985 1,388 (62) 4,867 (59) 4,808 Provision for credit losses 135 15 2 50 (153) 49 – 49 Non-interest expense 1,217 326 750 731 88 3,112 – 3,112
Income before taxes and non-controlling interest in subsidiaries 760 103 233 607 3 1,706 (59) 1,647 Income taxes 234 42 83 164 (47) 476 (59) 417 Non-controlling interest in subsidiaries – – – – 28 28 – 28
Net Income $ 526 $ 61 $ 150 $ 443 $ 22 $ 1,202 $ – $ 1,202
Average Assets $ 104,001 $ 20,293 $ 7,055 $ 166,961 $ 5,076 $ 303,386 $ – $ 303,386
Goodwill (As At) $ 93 $ 599 $ 834 $ 103 $ 3 $ 1,632 $ – $ 1,632
(1) Corporate Support includes Technology and Solutions.
(2) Taxable equivalent basis – see Basis of Presentation section.
Note 10 � Operating and Geographic Segmentation (cont’d)
Notes to Consolidated Financial Statements
BMO Q2 06 Eng_v03.qxd 6/3/06 1:10 AM Page 32

BMO Financial Group Second Quarter Report 2006 | 33
Our results and average assets, allocated by geographic region, are as follows:
(Canadian $ in millions), Taxable equivalent basis (1)
Other For the three months ended April 30, 2006 Canada United States Countries Total
Net interest income $ 817 $ 296 $ 30 $ 1,143 Non-interest revenue 995 319 46 1,360
Total Revenue 1,812 615 76 2,503 Provision for credit losses 56 11 (1) 66 Non-interest expense 1,119 417 35 1,571
Income before taxes and non-controlling interest in subsidiaries 637 187 42 866 Income taxes 137 69 (3) 203 Non-controlling interest in subsidiaries 13 6 – 19
Net Income $ 487 $ 112 $ 45 $ 644
Average Assets $ 211,779 $ 77,501 $ 24,806 $ 314,086
Other For the three months ended April 30, 2005 Canada United States Countries Total
Net interest income $ 857 $ 331 $ 24 $ 1,212 Non-interest revenue 854 326 36 1,216
Total Revenue 1,711 657 60 2,428 Provision for credit losses 32 (15) (11) 6 Non-interest expense 1,056 491 32 1,579
Income before taxes and non-controlling interest in subsidiaries 623 181 39 843 Income taxes 199 47 (17) 229 Non-controlling interest in subsidiaries 9 5 – 14
Net Income $ 415 $ 129 $ 56 $ 600
Average Assets $ 208,314 $ 75,576 $ 26,972 $ 310,862
Other For the six months ended April 30, 2006 Canada United States Countries Total
Net interest income $ 1,683 $ 605 $ 68 $ 2,356 Non-interest revenue 1,934 633 92 2,659
Total Revenue 3,617 1,238 160 5,015 Provision for credit losses 105 14 (1) 118 Non-interest expense 2,208 839 69 3,116
Income before taxes and non-controlling interest in subsidiaries 1,304 385 92 1,781 Income taxes 336 135 (2) 469 Non-controlling interest in subsidiaries 27 11 – 38
Net Income $ 941 $ 239 $ 94 $ 1,274
Average Assets $ 205,656 $ 78,537 $ 25,365 $ 309,558
Other For the six months ended April 30, 2005 Canada United States Countries Total
Net interest income $ 1,745 $ 643 $ 50 $ 2,438 Non-interest revenue 1,685 660 84 2,429
Total Revenue 3,430 1,303 134 4,867 Provision for credit losses 84 (17) (18) 49 Non-interest expense 2,145 908 59 3,112
Income before taxes and non-controlling interest in subsidiaries 1,201 412 93 1,706 Income taxes 401 116 (41) 476 Non-controlling interest in subsidiaries 17 11 – 28
Net Income $ 783 $ 285 $ 134 $ 1,202
Average Assets $ 205,814 $ 73,361 $ 24,211 $ 303,386
(1) Taxable equivalent basis – see Basis of Presentation section.
BMO Q2 06 Eng_v03.qxd 6/3/06 1:10 AM Page 33

Shareholder Dividend Reinvestment and Share Purchase PlanAverage market priceFebruary 2006 $ 68.86March 2006 $ 65.91April 2006 $ 64.29
For dividend information, change in shareholder address or to advise of duplicate mailings, please contactComputershare Trust Company of Canada100 University Avenue, 9th FloorToronto, Ontario M5J 2Y1Telephone: 1-800-340-5021 (Canada and the United States)Telephone: (514) 982-7800 (international)Fax: 1-888-453-0330 (Canada and the United States)Fax: (416) 263-9394 (international)E-mail: [email protected]
For other shareholder information, please contactBank of MontrealShareholder ServicesCorporate Secretary’s DepartmentOne First Canadian Place, 21st FloorToronto, Ontario M5X 1A1Telephone: (416) 867-6785Fax: (416) 867-6793E-mail: [email protected]
For further information on this report, please contactBank of MontrealInvestor Relations DepartmentP.O. Box 1, One First Canadian Place, 18th FloorToronto, Ontario M5X 1A1
To review financial results online, please visit our web site atwww.bmo.com
® Registered trade-mark of Bank of Montreal
BMO Q2 06 Eng_v03.qxd 6/3/06 1:10 AM Page 34