second quarter 2014 results presentation
TRANSCRIPT

Second Quarter Earnings Call | July 30, 2014
Cautionary Statement
Newmont Mining Corporation Slide 2
Cautionary Statement Regarding Forward Looking Statements, Including Outlook:
This presentation contains “forward-looking statements” within the meaning of Section 27A of the Securities Act of 1933, as amended, and Section
21E of the Securities Exchange Act of 1934, as amended, which are intended to be covered by the safe harbor created by such sections and other
applicable laws. Such forward-looking statements may include, without limitation: (i) estimates of future production and sales; (ii) estimates of
future costs applicable to sales and All-in sustaining costs; (iii) estimates of future consolidated and attributable capital expenditures; (iv) plans and
expectations relating to saving or reductions in costs and expenditures; (v) expectations regarding decisions regarding future exploration or
development projects and the development, growth and funding potential of the projects including, without limitation, Merian; (vi) expectations
regarding future dividend payments, and (vii) expectations regarding future asset sales and financial flexibility. Forward-looking statements often
include words such as "anticipates," "estimates," "expects," "projects," "intends," "plans," "believes" and words and terms of similar substance in
connection with discussions of future operating or financial performance. Estimates or expectations of future events or results are based upon
certain assumptions, which may prove to be incorrect. Such assumptions, include, but are not limited to: (i) there being no significant change to
current geotechnical, metallurgical, hydrological and other physical conditions; (ii) permitting, development, operations and expansion of the
Company’s projects being consistent with current expectations and mine plans; (iii) political developments in any jurisdiction in which the Company
operates being consistent with its current expectations; (iv) certain exchange rate assumptions for the Australian dollar to the U.S. dollar, as well
as other the exchange rates being approximately consistent with current levels; (v) certain price assumptions for gold, copper and oil; (vi) prices for
key supplies being approximately consistent with current levels; and (vii) the accuracy of our current mineral reserve and mineral resource
estimates. Where the Company expresses or implies an expectation or belief as to future events or results, such expectation or belief is expressed
in good faith and believed to have a reasonable basis. However, such statements are subject to risks, uncertainties and other factors, which could
cause actual results to differ materially from future results expressed, projected or implied by the “forward-looking statements”. Such risks include,
but are not limited to, gold and other metals price volatility, currency fluctuations, increased production costs and variances in ore grade or
recovery rates from those assumed in mining plans, political and operational risks, community relations, conflict resolution and outcome of projects
or oppositions and governmental regulation and judicial outcomes. For a more detailed discussion of such risks and other factors, see the
Company’s 2013 Annual Report on Form 10-K, filed on February 21, 2014, with the Securities and Exchange Commission, as well as the
Company’s other SEC filings. The Company does not undertake any obligation to release publicly revisions to any “forward-looking statement,”
including, without limitation, outlook, to reflect events or circumstances after the date of this presentation, or to reflect the occurrence of
unanticipated events, except as may be required under applicable securities laws. Investors should not assume that any lack of update to a
previously issued “forward-looking statement” constitutes a reaffirmation of that statement. Continued reliance on “forward-looking statements” is
at investors' own risk.
This presentation should be read in conjunction with Newmont’s Second Quarter Form 10-Q filed with the Securities and Exchange Commission
on or about July 29, 2014 (available at www.newmont.com).
July 30, 2014
Overview
Maintaining safe and efficient operations
Carlin welding shop, Nevada
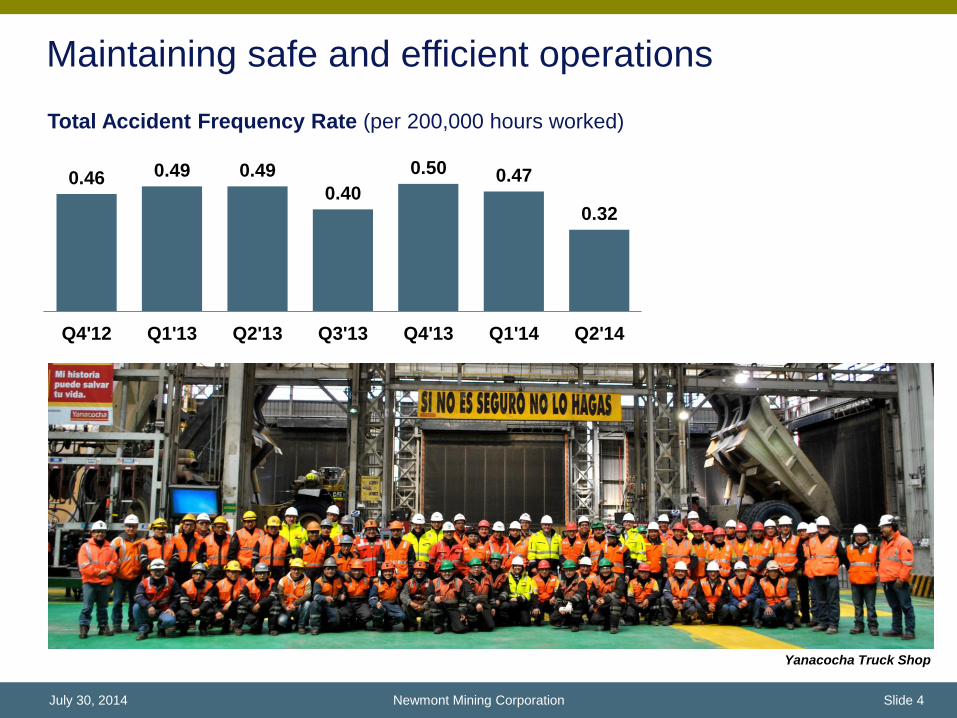
0.46 0.49 0.49
0.40
0.50 0.47
0.32
Q4'12 Q1'13 Q2'13 Q3'13 Q4'13 Q1'14 Q2'14
Total Accident Frequency Rate (per 200,000 hours worked)
Yanacocha Truck Shop
Newmont Mining Corporation Slide 4 July 30, 2014
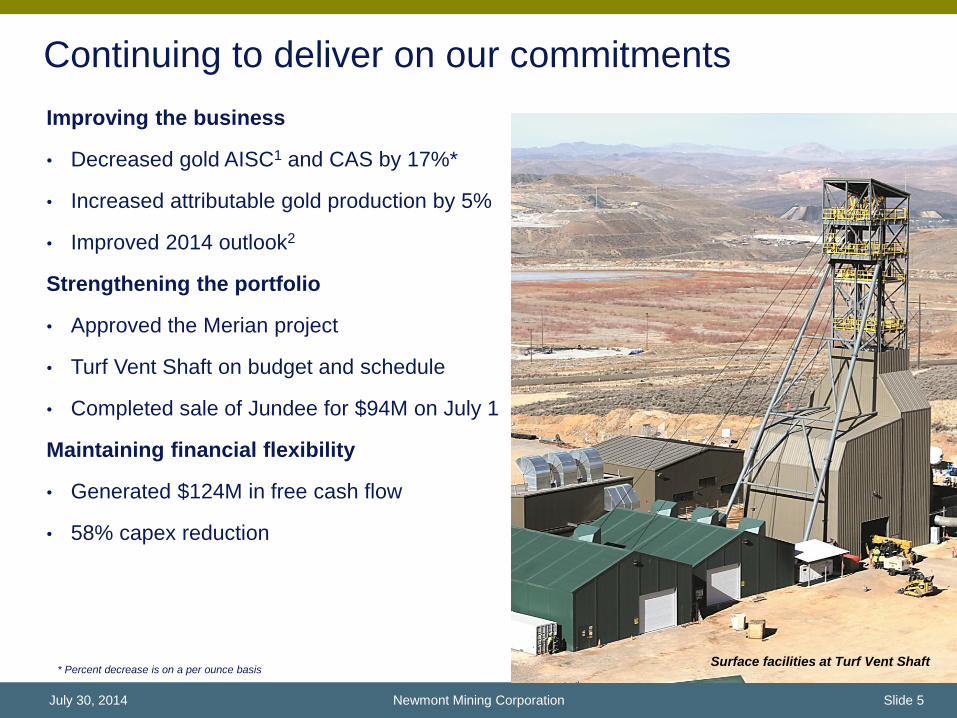
Continuing to deliver on our commitments
Improving the business
• Decreased gold AISC1 and CAS by 17%*
• Increased attributable gold production by 5%
• Improved 2014 outlook2
Strengthening the portfolio
• Approved the Merian project
• Turf Vent Shaft on budget and schedule
• Completed sale of Jundee for $94M on July 1
Maintaining financial flexibility
• Generated $124M in free cash flow
• 58% capex reduction
Surface facilities at Turf Vent Shaft
Newmont Mining Corporation Slide 5 July 30, 2014
* Percent decrease is on a per ounce basis
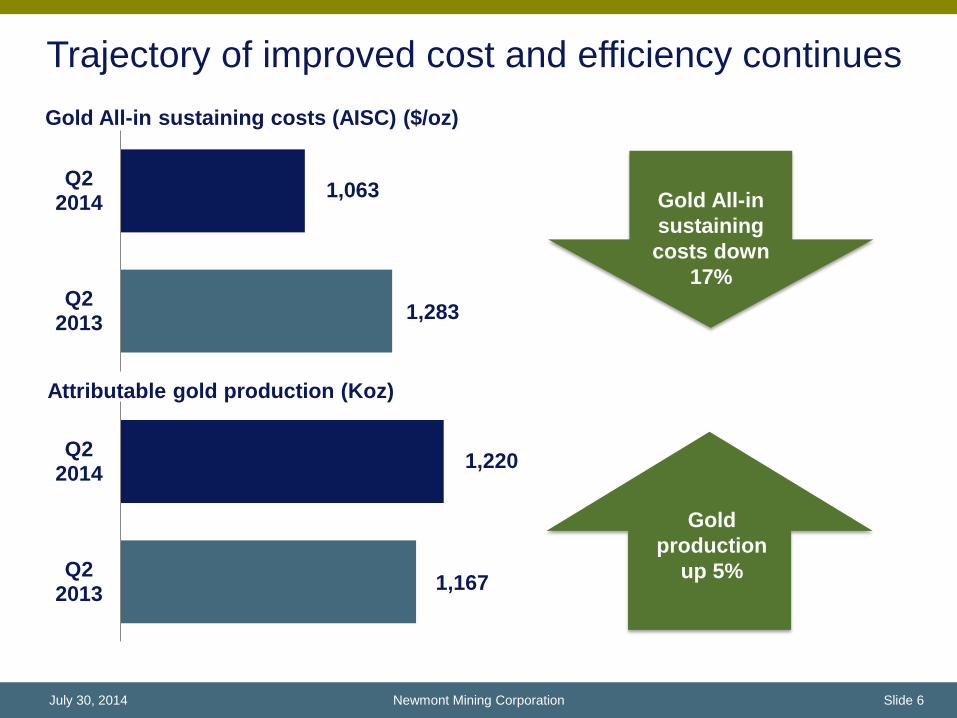
1,167
1,220
Q22013
Q22014
Trajectory of improved cost and efficiency continues
Attributable gold production (Koz)
Gold
production
up 5%
1,283
1,063
Q22013
Q22014
Gold All-in sustaining costs (AISC) ($/oz)
Gold All-in
sustaining
costs down
17%
Newmont Mining Corporation Slide 6 July 30, 2014
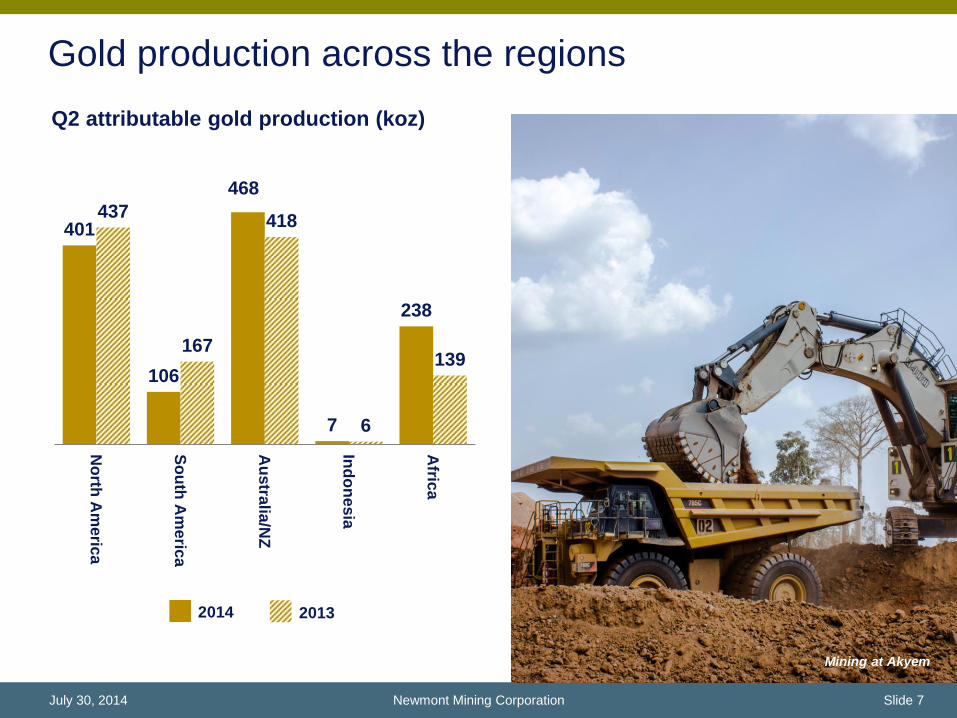
Gold production across the regions
401
106
468
7
238
437
167
418
6
139
No
rth A
meric
a
So
uth
Am
eric
a
Au
stra
lia/N
Z
Ind
on
esia
Afric
a
Q2 attributable gold production (koz)
2014 2013
Newmont Mining Corporation Slide 7 July 30, 2014
Gold pour at Ahafo Mining at Akyem
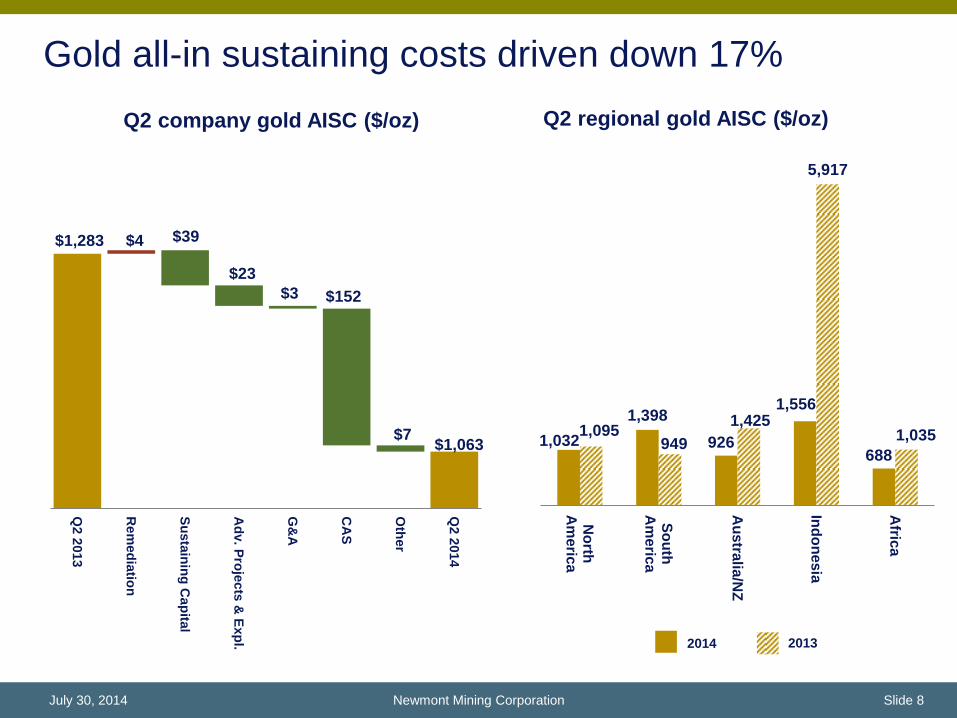
1,032
1,398
926
1,556
688
1,095 949
1,425
5,917
1,035
No
rthA
me
rica
So
uth
Am
eric
a
Au
stra
lia/N
Z
Ind
on
esia
Afric
a
$1,283
$1,063
$4 $39
$23
$3 $152
$7
Q2 2
013
Re
med
iatio
n
Su
sta
inin
g C
ap
ital
Ad
v. P
roje
cts
& E
xp
l.
G&
A
CA
S
Oth
er
Q2 2
014
Gold all-in sustaining costs driven down 17%
Q2 company gold AISC ($/oz) Q2 regional gold AISC ($/oz)
2014 2013
Newmont Mining Corporation Slide 8 July 30, 2014
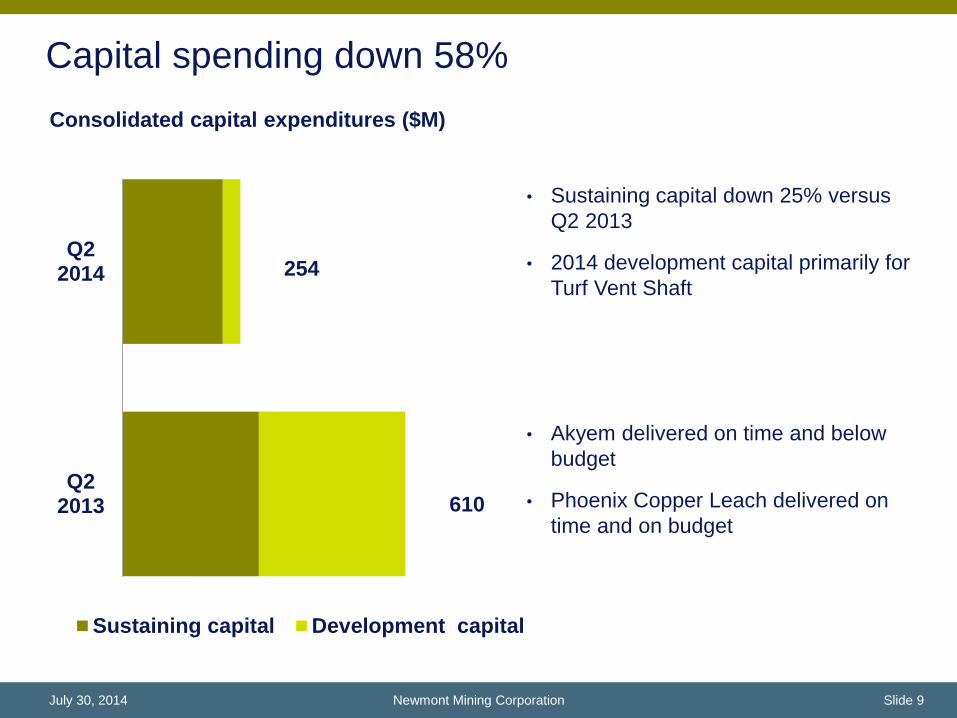
Q22013
Q22014
Sustaining capital Development capital
Consolidated capital expenditures ($M)
Capital spending down 58%
• Sustaining capital down 25% versus
Q2 2013
• 2014 development capital primarily for
Turf Vent Shaft
• Akyem delivered on time and below
budget
• Phoenix Copper Leach delivered on
time and on budget
254
610
Newmont Mining Corporation Slide 9 July 30, 2014
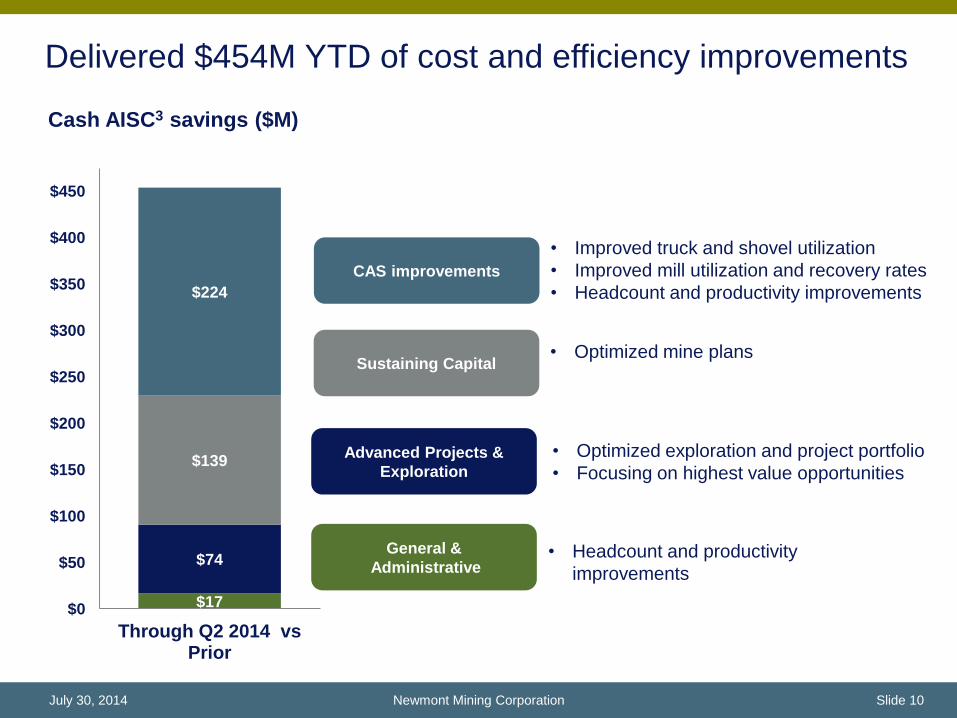
$17
$74
$139
$224
$0
$50
$100
$150
$200
$250
$300
$350
$400
$450
Through Q2 2014 vsPrior
General &
Administrative • Headcount and productivity
improvements
Advanced Projects &
Exploration
• Optimized exploration and project portfolio
• Focusing on highest value opportunities
Sustaining Capital • Optimized mine plans
CAS improvements
• Improved truck and shovel utilization
• Improved mill utilization and recovery rates
• Headcount and productivity improvements
Vision for the future
Cash AISC3 savings ($M)
Delivered $454M YTD of cost and efficiency improvements
Newmont Mining Corporation Slide 10 July 30, 2014

Continuing to seek resolution in Indonesia
Batu Hijau, Indonesia
• Operations entered “care and
maintenance” June 5; force majeure
declared
• Arbitration announced July 1, will seek
injunctive relief
• Ongoing discussions with government
• Concentrate inventories will continue to
ship to PT Smelting
• Revised guidance reflects export permits
received January 2015
• Final 7% interest divestiture pending
Newmont Mining Corporation Slide 11 July 30, 2014

Financial Results
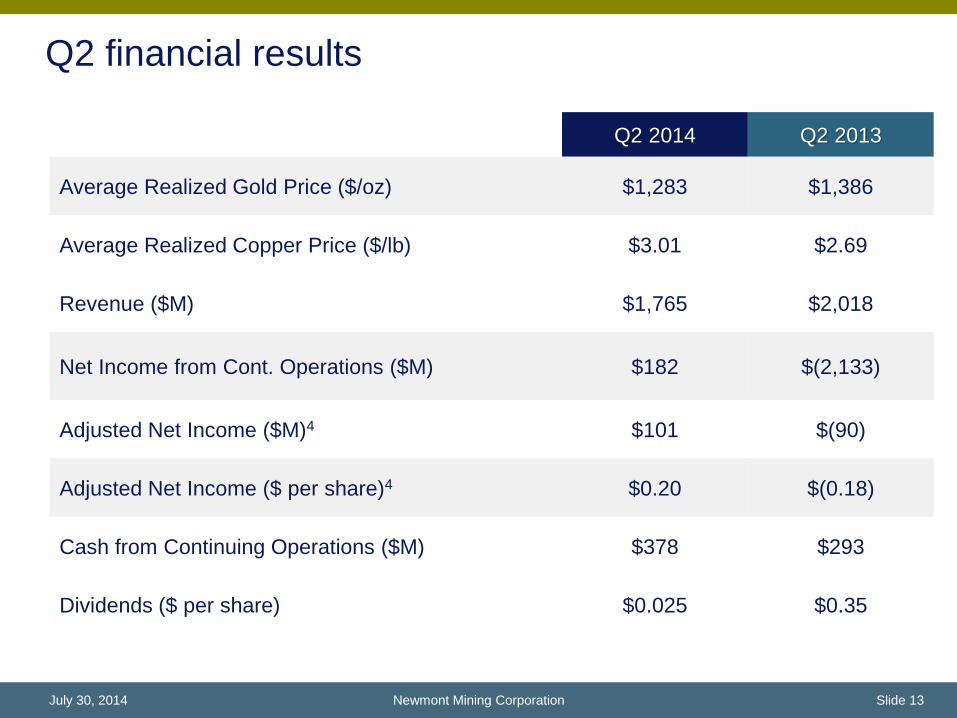
Q2 financial results
Q2 2014 Q2 2013
Average Realized Gold Price ($/oz) $1,283 $1,386
Average Realized Copper Price ($/lb) $3.01 $2.69
Revenue ($M) $1,765 $2,018
Net Income from Cont. Operations ($M) $182 $(2,133)
Adjusted Net Income ($M)4 $101 $(90)
Adjusted Net Income ($ per share)4 $0.20 $(0.18)
Cash from Continuing Operations ($M) $378 $293
Dividends ($ per share) $0.025 $0.35
Newmont Mining Corporation Slide 13 July 30, 2014

Q2 adjusted net income above prior year
($M)
Newmont Mining Corporation Slide 14 July 30, 2014
$90
$101
- - $183
$28 -
$91
$2
$17
$24
$72
($250)
($200)
($150)
($100)
($50)
$0
$50
$100
$150
201
3 A
NI
Au
/Cu
Vo
lum
e
Co
mm
od
ity P
rice
Co
st a
pp
licab
le to
Sa
les
Sto
ck
pile
Re
va
lua
tion
s
Ad
va
nc
ed
Pro
jec
ts a
nd
Ex
pl
Oth
er
Tax
Ra
te
201
4 A
NI
Ad
juste
d N
et
Inco
me
($
mil
lio
n)
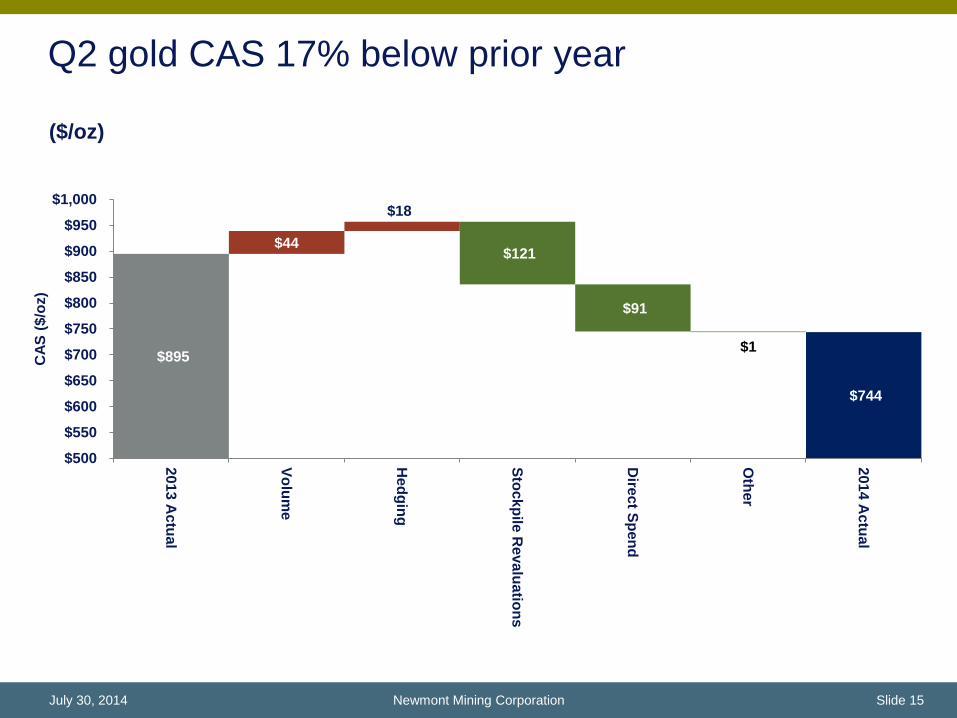
Q2 gold CAS 17% below prior year
($/oz)
Newmont Mining Corporation Slide 15 July 30, 2014
$895
$744
$44
$18
$121
$91
$1
$500
$550
$600
$650
$700
$750
$800
$850
$900
$950
$1,000
201
3 A
ctu
al
Vo
lum
e
He
dg
ing
Sto
ck
pile
Re
va
lua
tion
s
Dire
ct S
pen
d
Oth
er
201
4 A
ctu
al
CA
S (
$/o
z)
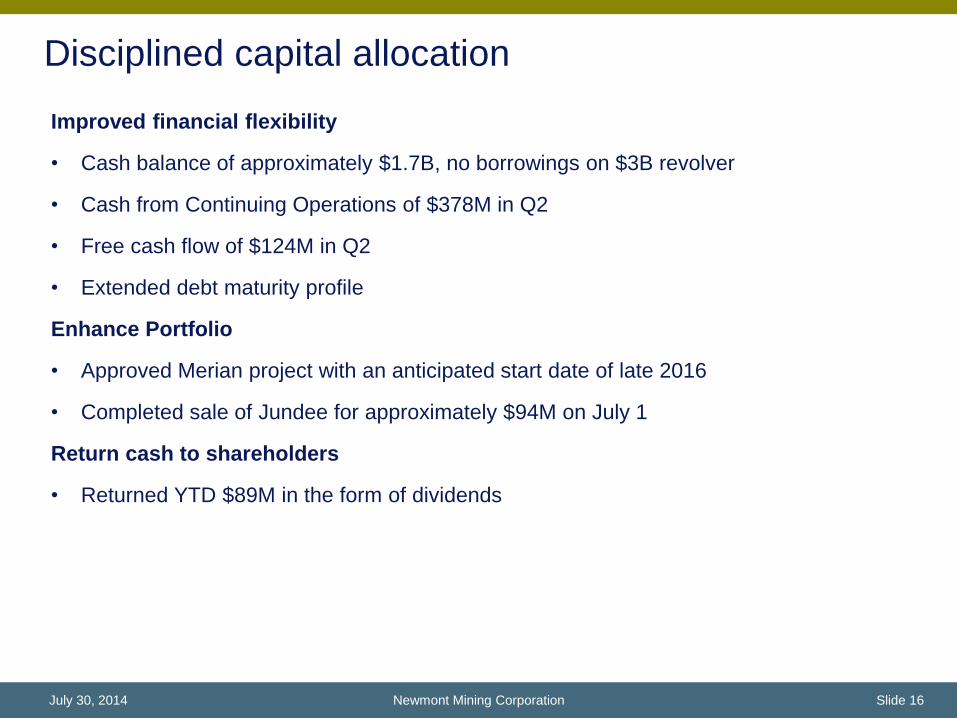
Improved financial flexibility
• Cash balance of approximately $1.7B, no borrowings on $3B revolver
• Cash from Continuing Operations of $378M in Q2
• Free cash flow of $124M in Q2
• Extended debt maturity profile
Enhance Portfolio
• Approved Merian project with an anticipated start date of late 2016
• Completed sale of Jundee for approximately $94M on July 1
Return cash to shareholders
• Returned YTD $89M in the form of dividends
Disciplined capital allocation
Newmont Mining Corporation Slide 16 July 30, 2014
Outlook
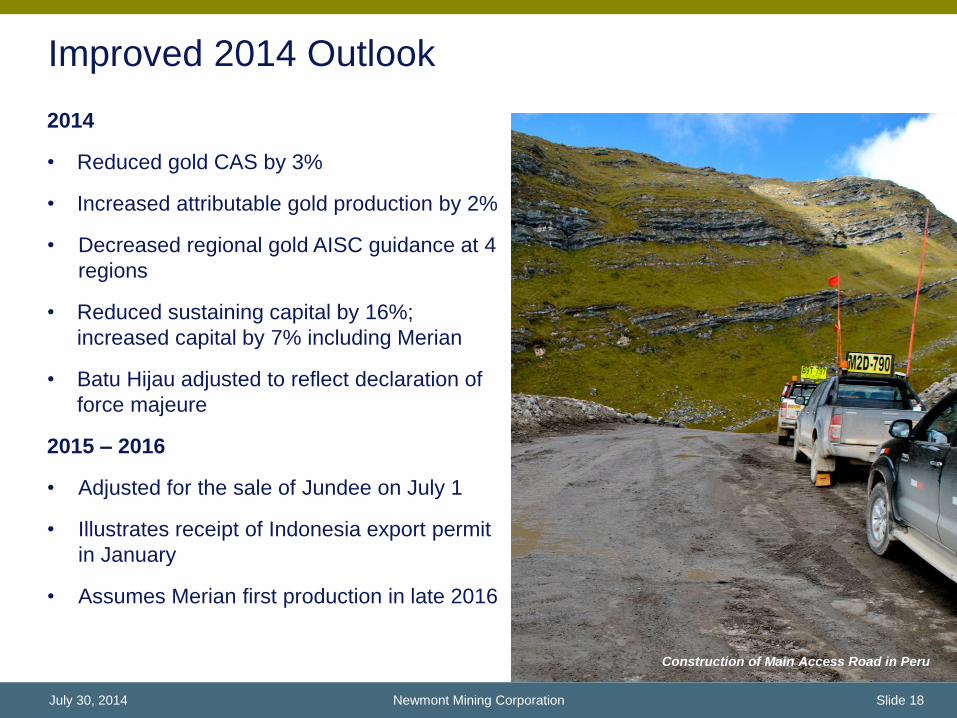
Improved 2014 Outlook
2014
• Reduced gold CAS by 3%
• Increased attributable gold production by 2%
• Decreased regional gold AISC guidance at 4
regions
• Reduced sustaining capital by 16%;
increased capital by 7% including Merian
• Batu Hijau adjusted to reflect declaration of
force majeure
2015 – 2016
• Adjusted for the sale of Jundee on July 1
• Illustrates receipt of Indonesia export permit
in January
• Assumes Merian first production in late 2016
Subika underground project, Ghana
Newmont Mining Corporation Slide 18 July 30, 2014
Construction of Main Access Road in Peru
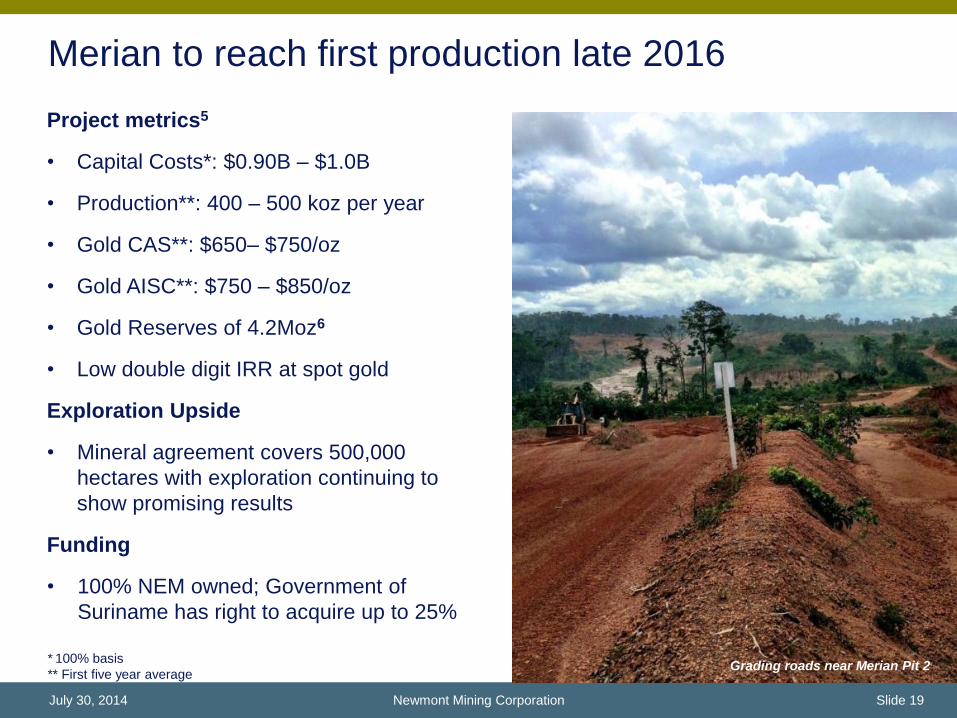
Merian to reach first production late 2016
* 100% basis
** First five year average
Project metrics5
• Capital Costs*: $0.90B – $1.0B
• Production**: 400 – 500 koz per year
• Gold CAS**: $650– $750/oz
• Gold AISC**: $750 – $850/oz
• Gold Reserves of 4.2Moz6
• Low double digit IRR at spot gold
Exploration Upside
• Mineral agreement covers 500,000
hectares with exploration continuing to
show promising results
Funding
• 100% NEM owned; Government of
Suriname has right to acquire up to 25%
Merian pit
Newmont Mining Corporation Slide 19 July 30, 2014
Grading roads near Merian Pit 2

Exploration/
Conceptual
Scoping Pre
Feasibility
Feasibility/
Engineering
Execution
Organic growth pipeline optimized and actionable
Turf Vent Shaft
Western
Oxides I
Ahafo Mill
Expansion
Ahafo
North
Subika
Underground
Waihi
Correnso
Greater Leeville
Chaqui Sulfides
Long Canyon
Phase 1
Merian
Gold Gold/Copper
Conga
Newmont Mining Corporation Slide 20 July 30, 2014
Federation
Exodus Bull Moose
Yanacocha Sulfides
NA
NA
SA
AZ
NA
SA
AF
AF
AF
SA
NA
NA
SA
SA AZ
SA – South America NA – North America AF – Africa AZ – Australia New Zealand

Why Newmont?
• Strong asset portfolio
• Stable production base
• Sharp focus on core competencies
• Continuous cost improvement
• Clear capital allocation priorities
• Prospective development options
Newmont Mining Corporation Slide 21 July 30, 2014
Boddington conveyor

Questions

Appendix

2014 Outlooka
Newmont Mining Corporation Slide 24 July 30, 2014
aThe outlook ranges presented herein
represent forward looking statements,
which are subject to certain risks and
uncertainties. See cautionary statement at
the end of this release. Additionally,
individual site ranges in the table above
may not sum to total regional or Company
levels to provide for portfolio flexibility.
PTNNT does not currently have approvals
necessary for export. bAll-in sustaining cost (“AISC”) is a non-
GAAP metric defined as the sum of cost
applicable to sales (including all direct and
indirect costs related to current gold
production incurred to execute on the
current mine plan), remediation costs
(including operating accretion and
amortization of asset retirement costs),
G&A, exploration expense, advanced
projects and R&D, treatment and refining
costs, other expense, net of one-time
adjustments and sustaining capital. cIncludes Lone Tree operations. dIncludes GTRJV operations. eBoth consolidated and attributable
production are shown on a pro-rata basis
with a 44% ownership interest for La
Herradura and a 50% ownership for
KCGM. fConsolidated production for Yanacocha is
presented on a total production basis for
the mine site; whereas attributable
production represents a 51.35% ownership
interest. gLa Zanja and Duketon are not included in
the consolidated figures above; attributable
production figures are presented based
upon a 46.94% ownership interest at La
Zanja and a 19.45% ownership interest in
Duketon. hConsolidated production for Batu Hijau is
presented on a total production basis for
the mine site; whereas attributable
production represents an expected
44.5625% ownership interest in 2014
outlook (which assumes completion of the
remaining share divestiture). PTNNT does
not currently have approvals necessary for
export. When and whether PTNNT is able
to resume export in 2014 will impact
outlook.
2014 Consolidated
Production
2014 Attributable
Production
2014 Consolidated
CAS
2014 All-in
Sustaining Costsb
2014 Consolidated Capital
Expenditures
(Kozs, Kt) (Kozs, kt) ($/oz, $/lb) ($/oz, $/t) ($M)
830 - 910 830 - 910 $850 - $930 $270 - $295
195 - 215 195 - 215 $655 - $715 $30 - $40
330 - 360 330 - 360 $550 - $600 $110 - $130
185 - 200 185 - 200 $800 - $875 $90 - $100
$30 - $40
1,550 - 1,650 1,550 - 1,650 $750 - $810 $1,000 - $1,100 $500 - $550
895 - 985 460 - 500 $660 - $720 $135 - $150
50 - 60
$225 - $270
895 - 985 510 - 560 $660 - $720 $1,090 - $1,180 $360 - $400
665 - 725 665 - 725 $880 - $960 $90 - $100
320 - 350 320 - 350 $700 - $765 $100 - $110
138 - 140 138 - 140 $610 - $620 $15
120 - 130 120 - 130 $560 - $610 $25 - $30
300 - 330 300 - 330 $895 - $980 $30 - $40
40 - 50
$5 - $15
1,575 - 1,675 1,625 - 1,725 $805 - $880 $990 - $1,080 $275 - $300
30 - 35 15 - 20 $1,435 - $1,570 $2,060 - $2,250 $50 - $55
415 - 440 415 - 440 $580 - $650 $100 - $115
440 - 480 440 - 480 $400 - $445 $15 - $25
855 - 920 855 - 920 $495 - $540 $660 - $725 $115 - $140
$20 - $25
5,100 - 5,400 4,725 - 5,000 $720 - $760 $1,075 - $1,175 $1,400 - $1,485
15 - 25 15 - 25 $2.10 - $2.30
25 - 35 25 - 35 $2.50 - $2.80
35 - 40 15 - 20 $3.50 - $3.80
80 - 95 55 - 80 $2.80 - $3.10 $3.80 - $4.10
Region
Twin Creeks1
Tanami
South America
Boddington
Duketon5
Australia/New Zealand
Carlin
Other North America
North America
Yanacocha4
Africa
Batu Hijau, Indonesia6
Ahafo
Phoenix2
KCGM3
Other South America
Other Australia/NZ
La Herradura3
La Zanja5
Jundee
Waihi
Akyem
Total Copper
Boddington
Batu Hijau6
Corporate/Other
Total Gold
Phoenix

2014 – 2016 Outlook*
Newmont Mining Corporation Slide 25 July 30, 2014
Consolidated CAS ($/oz, $/lb)
Region
North America $750 - $810 $740 - $810 $680 - $740
South America $660 - $720 $560 - $615 $770 - $840
Australia/New Zealand $805 - $880 $865 - $950 $850 - $925
Batu Hijau, Indonesia $1,435 - $1,570 $490 - $540 $440 - $480
Africa $495 - $540 $695 - $760 $730 - $800
Total Gold $720 - $760 $690 - $740 $720 - $760
Total Copper $2.80 - $3.10 $1.50 - $1.65 $1.25 - $1.35
2015 Outlook 2016 Outlook2014 Outlook
Consolidated AISC ($/oz, $/lb)
Region
North America $1,000 - $1,100 $955 - $1,045 $835 - $925
South America $1,090 - $1,180 $900 - $990 $1,180 - $1,290
Australia/New Zealand $990 - $1,080 $1,040 - $1,140 $985 - $1,075
Batu Hijau, Indonesia $2,060 - $2,250 $710 - $770 $600 - $655
Africa $660 - $725 $875 - $955 $885 - $965
Total Gold $1,075 - $1,175 $1,000 - $1,100 $985 - $1,085
Total Copper $3.80 - $4.10 $2.0 - $2.20 $1.60 - $1.80
2015 Outlook 2016 Outlook2014 Outlook
Consolidated Captial Expenditures ($M) 2014 - 2016
Region
North America $500 - $550 $430 - $475 $270 - $295
South America $360 - $400 $600 - $655 $420 - $455
Australia/New Zealand $275 - $300 $220 - $245 $190 - $210
Batu Hijau, Indonesia $50 - $55 $150 - $165 $155 - $170
Africa $115 - $140 $80 - $90 $80 - $90
Total $1,400 - $1,485 $1,550 - $1,650 $1,250 - $1,300
Note: South America now includes Merian and is not comparable to prior guidance.
2014 Outlook 2015 Outlook 2016 Outlook
*PTNNT does not currently have approvals necessary for export. For illustration purposes, outlook assumes Batu Hijau receives export approvals on January 1, 2015. No assurances can
be made that export issues will be resolved as of such date. To the extent that PTNNT continues to be unable to export, it will impact Newmont’s ability to achieve outlook.
Consolidated and Attributable Production (Moz, kt) 2014 - 2016
Gold (Consolidated Moz) 5,100 - 5,400 5,010 - 5,490 5,700 - 6,100
Gold (Attributable Moz) 4,725 - 5,000 4,600 - 4,900 5,100 - 5,400
Copper (Consolidated kt) 80 - 95 220 - 240 260 - 270
Copper (Attributable kt) 55 - 80 125 - 135 140 - 150
2014 Outlook 2015 Outlook 2016 Outlook

Adjusted net income Non-GAAP Financial Measures
Non-GAAP financial measures are intended to provide additional information only and do not have any standard meaning prescribed by generally
accepted accounting principles (“GAAP”). These measures should not be considered in isolation or as a substitute for measures of performance
prepared in accordance with GAAP.
Adjusted net income (loss)
Management of the Company uses Adjusted net income (loss) to evaluate the Company’s operating performance, and for planning and forecasting
future business operations. The Company believes the use of Adjusted net income (loss) allows investors and analysts to compare results of the
continuing operations of the Company and its direct and indirect subsidiaries relating to the production and sale of minerals to similar operating
results of other mining companies, by excluding exceptional or unusual items. Management’s determination of the components of Adjusted net
income (loss) are evaluated periodically and based, in part, on a review of non-GAAP financial measures used by mining industry analysts. Net
income (loss) attributable to Newmont stockholders is reconciled to Adjusted net income (loss) as follows:
Newmont Mining Corporation Slide 26 July 30, 2014
Three Months Ended June 30,
Six Months Ended June 30,
2014
2013 2014 2013
Net income (loss) attributable to Newmont stockholders $ 180 $ (2,059) $ 280 $ (1,745)
Loss (income) from discontinued operations
2 (74) 19 (74)
Impairments and loss provisions
5 1,497 7 1,501
Tax valuation allowance
(98) 535 (98) 535
Restructuring and other
4 11 7 16
Asset sales
(1) - (14) -
Abnormal production costs at Batu Hijau
9 - 9 -
TMAC transaction costs
- - - 30
Adjusted net income (loss) $ 101 $ (90) $ 210 $ 263
Adjusted net income (loss) per share, basic $ 0.20 $ (0.18) $ 0.42 $ 0.53
Adjusted net income (loss) per share, diluted $ 0.20 $ (0.18) $ 0.42 $ 0.53
All-in sustaining costs
All-In Sustaining Costs
Newmont has worked to develop a metric that expands on GAAP measures
such as cost of goods sold and non-GAAP measures to provide visibility into
the economics of our gold mining operations related to expenditures,
operating performance and the ability to generate cash flow from operations.
Current GAAP-measures used in the gold industry, such as cost of goods
sold, do not capture all of the expenditures incurred to discover, develop, and
sustain gold production. Therefore, we believe that All-in sustaining costs and
attributable All-in sustaining costs are non-GAAP measures that provide
additional information to management, investors, and analysts that aid in the
understanding of the economics of our operations and performance compared
to other gold producers and in the investor’s visibility by better defining the
total costs associated with producing gold.
All-in sustaining cost (“AISC”) amounts are intended to provide additional
information only and do not have any standardized meaning prescribed by
GAAP and should not be considered in isolation or as a substitute for
measures of performance prepared in accordance with GAAP. The measures
are not necessarily indicative of operating profit or cash flow from operations
as determined under GAAP. Other companies may calculate these measures
differently as a result of differences in the underlying accounting principles,
policies applied and in accounting frameworks such as in International
Financial Reporting Standards (“IFRS”), or by reflecting the benefit from
selling non-gold metals as a reduction to AISC. Differences may also arise
related to definitional differences of sustaining versus development capital
activities based upon each company’s internal policies.
The following disclosure provides information regarding the adjustments made
in determining the All-in sustaining costs measure:
Cost Applicable to Sales - Includes all direct and indirect costs related to
current gold production incurred to execute the current mine plan. Costs
Applicable to Sales (“CAS”) includes by-product credits from certain metals
obtained during the process of extracting and processing the primary ore-
body. CAS is accounted for on an accrual basis and excludes Amortization
and Reclamation and remediation, which is consistent with our presentation of
CAS on the Statement of Consolidated Income. In determining All-in
sustaining costs, only the CAS associated with producing and selling an ounce
of gold is included in the measure. Therefore, the amount of gold CAS
included in AISC is derived from the CAS presented in the Company’s
Statement of Consolidated Income less the amount of CAS attributable to the
production of copper at our Phoenix, Boddington, and Batu Hijau mines. The
copper CAS at those mine sites is disclosed in Note 3 – Segments that
accompanies the Consolidated Financial Statements. The allocation of CAS
between gold and copper at the Phoenix, Boddington, and Batu Hijau mines is
based upon the relative sales percentage of copper and gold sold during the
period.
Remediation Costs - Includes accretion expense related to asset retirement
obligations (“ARO”) and the amortization of the related Asset Retirement Cost
(“ARC”) for the Company’s operating properties recorded as an ARC asset.
Accretion related to ARO and the amortization of the ARC assets for
reclamation and remediation do not reflect annual cash outflows but are
calculated in accordance with GAAP. The accretion and amortization reflect
the periodic costs of reclamation and remediation associated with current gold
production and are therefore included in the measure. The allocation of these
costs to gold and copper is determined using the same allocation used in the
allocation of CAS between gold and copper at the Phoenix, Boddington, and
Batu Hijau mines.
Advanced Projects and Exploration - Includes incurred expenses related to
projects that are designed to increase or enhance current gold production and
gold exploration. We note that as current resources are depleted, exploration
and advance projects are necessary for us to replace the depleting reserves
or enhance the recovery and processing of the current reserves. As this
relates to sustaining our gold production, and is considered a continuing cost
of a mining company, these costs are included in the AISC measure. These
costs are derived from the Advanced projects, research and development and
Exploration amounts presented in the Company’s Statement of Consolidated
Income less the amount attributable to the production of copper at our
Phoenix, Boddington, and Batu Hijau mines. The allocation of these costs to
gold and copper is determined using the same allocation used in the allocation
of CAS between gold and copper at the Phoenix, Boddington, and Batu Hijau
mines.
General and Administrative - Includes cost related to administrative tasks not
directly related to current gold production, but rather related to support our
corporate structure and fulfilling our obligations to operate as a public
company. Including these expenses in the AISC metric provides visibility of
the impact that general and administrative activities have on current
operations and profitability on a per ounce basis.
Other Expense, net - Includes costs related to regional administration and
community development to support current gold production. We exclude
certain exceptional or unusual expenses from Other expense, net, such as
restructuring, as these are not indicative to sustaining our current gold
operations. Furthermore, this adjustment to Other expense, net is also
consistent with the nature of the adjustments made to Net income (loss) as
disclosed in the Company’s non-GAAP financial measure Adjusted net income
(loss). The allocation of these costs to gold and copper is determined using
the same allocation used in the allocation of CAS between gold and copper at
the Phoenix, Boddington, and Batu Hijau mines.
Treatment and Refining Costs - Includes costs paid to smelters for treatment
and refining of our concentrates to produce the salable precious metal. These
costs are presented net as a reduction of Sales.
Sustaining Capital - We determined sustaining capital as those capital
expenditures that are necessary to maintain current gold production and
execute the current mine plan. Capital expenditures to develop new
operations, or related to projects at existing operations where these projects
will enhance gold production or reserves, are considered development. We
determined the breakout of sustaining and development capital costs based
on a systematic review of our project portfolio in light of the nature of each
project. Sustaining capital costs are relevant to the AISC metric as these are
needed to maintain the Company’s current gold operations and provide
improved transparency related to our ability to finance these expenditures
from current operations. The allocation of these costs to gold and copper is
determined using the same allocation used in the allocation of CAS between
gold and copper at the Phoenix, Boddington, and Batu Hijau mines.
All-In Sustaining Costs
Newmont has worked to develop a metric that expands on GAAP measures such as cost of goods sold and non-GAAP measures to provide visibility into the economics of our mining operations related to
expenditures, operating performance and the ability to generate cash flow from operations.
Current GAAP-measures used in the mining industry, such as cost of goods sold, do not capture all of the expenditures incurred to discover, develop, and sustain gold production. Therefore, we believe that
All-in sustaining costs and attributable All-in sustaining costs are non-GAAP measures that provide additional information to management, investors, and analysts that aid in the understanding of the economics
of our operations and performance compared to other producers and in the investor’s visibility by better defining the total costs associated with production.
All-in sustaining cost (“AISC”) amounts are intended to provide additional information only and do not have any standardized meaning prescribed by GAAP and should not be considered in isolation or as a
substitute for measures of performance prepared in accordance with GAAP. The measures are not necessarily indicative of operating profit or cash flow from operations as determined under GAAP. Other
companies may calculate these measures differently as a result of differences in the underlying accounting principles, policies applied and in accounting frameworks such as in International Financial Reporting
Standards (“IFRS”), or by reflecting the benefit from selling non-gold metals as a reduction to AISC. Differences may also arise related to definitional differences of sustaining versus development capital
activities based upon each company’s internal policies.
The following disclosure provides information regarding the adjustments made in determining Newmont’s All-in sustaining costs measure:
Cost Applicable to Sales - Includes all direct and indirect costs related to current production incurred to execute the current mine plan. Costs Applicable to Sales (“CAS”) includes by-product credits from certain
metals obtained during the process of extracting and processing the primary ore-body. CAS is accounted for on an accrual basis and excludes Amortization and Reclamation and remediation, which is
consistent with our presentation of CAS on the Condensed Consolidated Statements of Income. In determining All-in sustaining costs, only the CAS associated with producing and selling an ounce of gold or a
pound of copper is included in the measure. Therefore, the amount of CAS included in AISC is derived from the CAS presented in the Company’s Condensed Consolidated Statements of Income. The allocation
of CAS between gold and copper at the Phoenix, Boddington, and Batu Hijau mines is based upon the relative production percentage of copper and gold sold during the period.
Remediation Costs - Includes accretion expense related to asset retirement obligations (“ARO”) and the amortization of the related Asset Retirement Cost (“ARC”) for the Company’s operating properties
recorded as an ARC asset. Accretion related to ARO and the amortization of the ARC assets for reclamation and remediation do not reflect annual cash outflows but are calculated in accordance with GAAP.
The accretion and amortization reflect the periodic costs of reclamation and remediation associated with current gold production and are therefore included in the measure. The allocation of these costs to gold
and copper is determined using the same allocation used in the allocation of CAS between gold and copper at the Phoenix, Boddington, and Batu Hijau mines.
Advanced Projects and Exploration - Includes incurred expenses related to projects that are designed to increase or enhance current gold production and gold exploration. We note that as current resources are
depleted, exploration and advance projects are necessary for us to replace the depleting reserves or enhance the recovery and processing of the current reserves. As this relates to sustaining our gold
production, and is considered a continuing cost of a mining company, these costs are included in the AISC measure. These costs are derived from the Advanced projects, research and development and
Exploration amounts presented in the Company’s Condensed Consolidated Statements of Income. The allocation of these costs to gold and copper is determined using the same allocation used in the
allocation of CAS between gold and copper at the Phoenix, Boddington, and Batu Hijau mines.
General and Administrative - Includes cost related to administrative tasks not directly related to current gold production, but rather related to support our corporate structure and fulfilling our obligations to
operate as a public company. Including these expenses in the AISC metric provides visibility of the impact that general and administrative activities have on current operations and profitability on a per ounce
basis.
Other Expense, net - Includes costs related to regional administration and community development to support current production. We exclude certain exceptional or unusual expenses from Other expense, net,
such as restructuring, as these are not indicative to sustaining our current operations. Furthermore, this adjustment to Other expense, net is also consistent with the nature of the adjustments made to Net
income (loss) as disclosed in the Company’s non-GAAP financial measure Adjusted net income (loss). The allocation of these costs to gold and copper is determined using the same allocation used in the
allocation of CAS between gold and copper at the Phoenix, Boddington, and Batu Hijau mines.
Treatment and Refining Costs - Includes costs paid to smelters for treatment and refining of our concentrates to produce the salable precious metal. These costs are presented net as a reduction of Sales.
Sustaining Capital - We determined sustaining capital as those capital expenditures that are necessary to maintain current gold production and execute the current mine plan. Capital expenditures to develop
new operations, or related to projects at existing operations where these projects will enhance gold production or reserves, are considered development. We determined the breakout of sustaining and
development capital costs based on a systematic review of our project portfolio in light of the nature of each project. Sustaining capital costs are relevant to the AISC metric as these are needed to maintain the
Company’s current gold operations and provide improved transparency related to our ability to finance these expenditures from current operations. The allocation of these costs to gold and copper is determined
using the same allocation used in the allocation of CAS between gold and copper at the Phoenix, Boddington, and Batu Hijau mines.
Newmont Mining Corporation Slide 27 July 30, 2014

All-in sustaining costs
(1) Excludes Depreciation and amortization and
Reclamation and remediation.
(2) Includes by-product credits of $24.
(3) Includes planned stockpile and leach pad inventory
adjustments of $32 at Carlin, $2 at Twin Creeks, $20 at
Yanacocha, $15 at Boddington, and $2 at Batu Hijau.
(4) Remediation costs include operating accretion of $18
and amortization of asset retirement costs of $25.
(5) Other expense, net is adjusted for restructuring costs
of $6.
(6) Excludes development capital expenditures,
capitalized interest, and the increase in accrued capital
of $34. The following are major development projects:
Turf Vent Shaft, Conga, and Merian for 2014.
Newmont Mining Corporation Slide 28 July 30, 2014
Costs Advanced Other Treatment
and All-In Ounces (000)/
All-In Sustaining
Three Months Ended Applicable Remediation Projects and General and Expense, Refining Sustaining Sustaining Pounds
(millions) Costs
June 30, 2014 to
Sales(1)(2)(3) Costs
(4) Exploration
Administrative Net
(5)
Costs
Capital
(6)
Costs
Sold per oz/lb
GOLD
Carlin $ 209 $ 1 $ 7 $ - $ 3 $ - $ 35 $ 255 209 $ 1,220
Phoenix 35 1 - - - 3 1 40 57 702
Twin Creeks 49 - 3 - - - 29 81 96 844
La Herradura 26 - 2 - - - 9 37 46 804
Other North America - - 6 - 1 - 1 8 - -
North America 319 2 18 - 4 3 75 421 408 1,032
Yanacocha 184 29 9 - 8 - 20 250 186 1,344
Other South America - - 9 - 1 - - 10 - -
South America 184 29 18 - 9 - 20 260 186 1,398
Boddington 133 2 - - - 1 21 157 148 1,061
Tanami 63 1 4 - - - 17 85 92 924
Jundee 43 2 - - 1 - 9 55 76 724
Waihi 19 - 1 - 1 - 1 22 41 537
Kalgoorlie 65 - 2 - - 1 4 72 75 960 Other Australia/New Zealand - - 1 - 3 - 5 9 - -
Australia/New Zealand 323 5 8 - 5 2 57 400 432 926
Batu Hijau 9 - - - 1 - 3 13 9 1,444
Other Indonesia - - - - 1 - - 1 - -
Indonesia 9 - - - 2 - 3 14 9 1,556
Ahafo 65 1 5 - 1 - 36 108 121 893
Akyem 44 1 - - 2 - - 47 113 416
Other Africa - - 3 - 3 - - 6 - -
Africa 109 2 8 - 6 - 36 161 234 688
Corporate and Other - - 30 48 12 - 3 93 - -
Total Gold 944 38 82 48 38 5 194 1,349 1,269 1,063
COPPER
Phoenix 30 1 - - 1 2 7 $ 41 13 $ 3.15
Boddington 32 1 - - - 5 5 43 13 3.31
Batu Hijau 54 3 1 - 6 4 14 82 19 4.32
Total Copper 116 5 1 - 7 11 26 166 45 3.69
Consolidated $ 1,060 $ 43 $ 83 $ 48 $ 45 $ 16 $ 220 $ 1,515
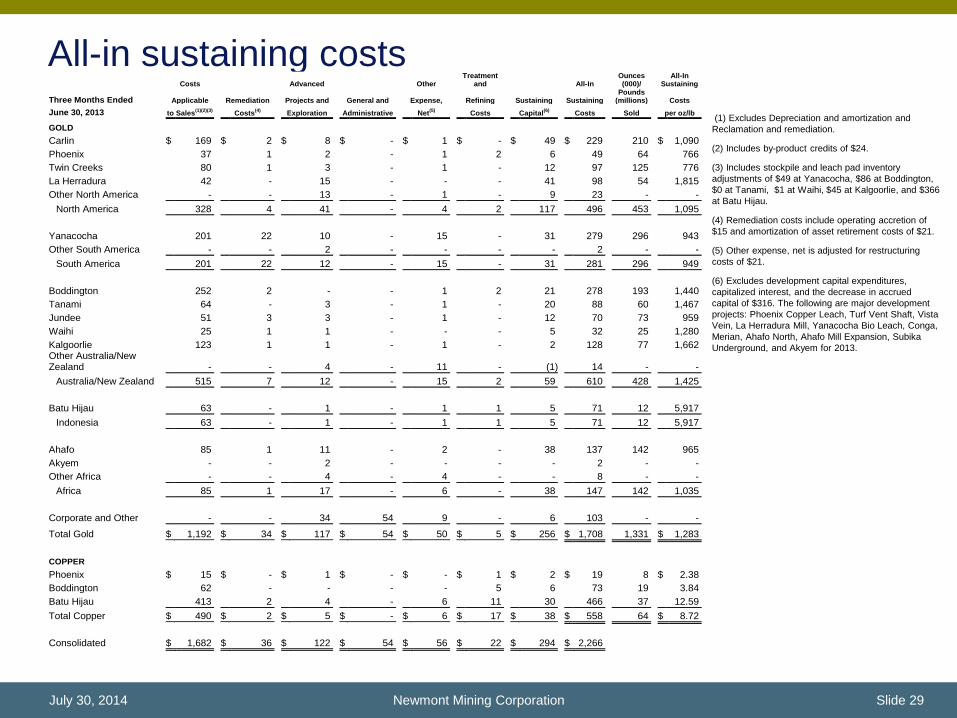
All-in sustaining costs
(1) Excludes Depreciation and amortization and
Reclamation and remediation.
(2) Includes by-product credits of $24.
(3) Includes stockpile and leach pad inventory
adjustments of $49 at Yanacocha, $86 at Boddington,
$0 at Tanami, $1 at Waihi, $45 at Kalgoorlie, and $366
at Batu Hijau.
(4) Remediation costs include operating accretion of
$15 and amortization of asset retirement costs of $21.
(5) Other expense, net is adjusted for restructuring
costs of $21.
(6) Excludes development capital expenditures,
capitalized interest, and the decrease in accrued
capital of $316. The following are major development
projects: Phoenix Copper Leach, Turf Vent Shaft, Vista
Vein, La Herradura Mill, Yanacocha Bio Leach, Conga,
Merian, Ahafo North, Ahafo Mill Expansion, Subika
Underground, and Akyem for 2013.
Newmont Mining Corporation Slide 29 July 30, 2014
Costs Advanced Other Treatment
and All-In Ounces (000)/
All-In Sustaining
Three Months Ended Applicable Remediation Projects and General and Expense, Refining Sustaining Sustaining Pounds
(millions) Costs
June 30, 2013 to Sales(1)(2)(3) Costs
(4) Exploration
Administrative Net
(5)
Costs
Capital
(6)
Costs
Sold per oz/lb
GOLD
Carlin $ 169 $ 2 $ 8 $ - $ 1 $ - $ 49 $ 229 210 $ 1,090
Phoenix 37 1 2 - 1 2 6 49 64 766
Twin Creeks 80 1 3 - 1 - 12 97 125 776
La Herradura 42 - 15 - - - 41 98 54 1,815
Other North America - - 13 - 1 - 9 23 - -
North America 328 4 41 - 4 2 117 496 453 1,095
Yanacocha 201 22 10 - 15 - 31 279 296 943
Other South America - - 2 - - - - 2 - -
South America 201 22 12 - 15 - 31 281 296 949
Boddington 252 2 - - 1 2 21 278 193 1,440
Tanami 64 - 3 - 1 - 20 88 60 1,467
Jundee 51 3 3 - 1 - 12 70 73 959
Waihi 25 1 1 - - - 5 32 25 1,280
Kalgoorlie 123 1 1 - 1 - 2 128 77 1,662 Other Australia/New Zealand - - 4 - 11 - (1) 14 - -
Australia/New Zealand 515 7 12 - 15 2 59 610 428 1,425
Batu Hijau 63 - 1 - 1 1 5 71 12 5,917
Indonesia 63 - 1 - 1 1 5 71 12 5,917
Ahafo 85 1 11 - 2 - 38 137 142 965
Akyem - - 2 - - - - 2 - -
Other Africa - - 4 - 4 - - 8 - -
Africa 85 1 17 - 6 - 38 147 142 1,035
Corporate and Other - - 34 54 9 - 6 103 - -
Total Gold $ 1,192 $ 34 $ 117 $ 54 $ 50 $ 5 $ 256 $ 1,708 1,331 $ 1,283
COPPER
Phoenix $ 15 $ - $ 1 $ - $ - $ 1 $ 2 $ 19 8 $ 2.38
Boddington 62 - - - - 5 6 73 19 3.84
Batu Hijau 413 2 4 - 6 11 30 466 37 12.59
Total Copper $ 490 $ 2 $ 5 $ - $ 6 $ 17 $ 38 $ 558 64 $ 8.72
Consolidated $ 1,682 $ 36 $ 122 $ 54 $ 56 $ 22 $ 294 $ 2,266
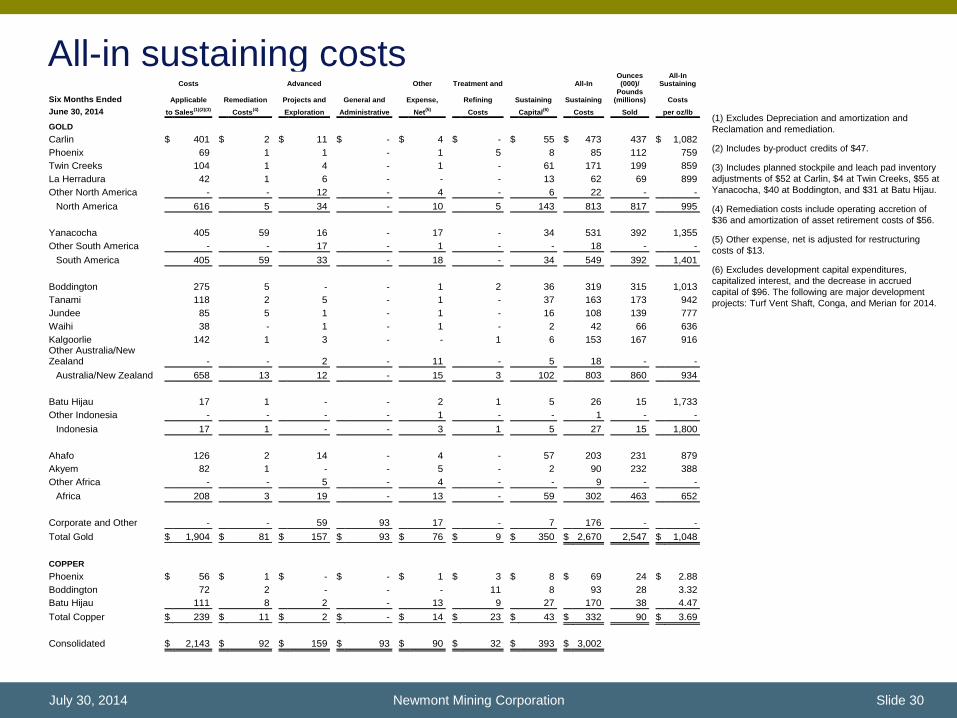
All-in sustaining costs
(1) Excludes Depreciation and amortization and
Reclamation and remediation.
(2) Includes by-product credits of $47.
(3) Includes planned stockpile and leach pad inventory
adjustments of $52 at Carlin, $4 at Twin Creeks, $55 at
Yanacocha, $40 at Boddington, and $31 at Batu Hijau.
(4) Remediation costs include operating accretion of
$36 and amortization of asset retirement costs of $56.
(5) Other expense, net is adjusted for restructuring
costs of $13.
(6) Excludes development capital expenditures,
capitalized interest, and the decrease in accrued
capital of $96. The following are major development
projects: Turf Vent Shaft, Conga, and Merian for 2014.
Newmont Mining Corporation Slide 30 July 30, 2014
Costs Advanced Other Treatment and All-In Ounces (000)/
All-In Sustaining
Six Months Ended Applicable Remediation Projects and General and Expense, Refining Sustaining Sustaining Pounds
(millions) Costs
June 30, 2014 to Sales(1)(2)(3) Costs
(4) Exploration
Administrative Net
(5)
Costs
Capital
(6)
Costs
Sold per oz/lb
GOLD
Carlin $ 401 $ 2 $ 11 $ - $ 4 $ - $ 55 $ 473 437 $ 1,082
Phoenix 69 1 1 - 1 5 8 85 112 759
Twin Creeks 104 1 4 - 1 - 61 171 199 859
La Herradura 42 1 6 - - - 13 62 69 899
Other North America - - 12 - 4 - 6 22 - -
North America 616 5 34 - 10 5 143 813 817 995
Yanacocha 405 59 16 - 17 - 34 531 392 1,355
Other South America - - 17 - 1 - - 18 - -
South America 405 59 33 - 18 - 34 549 392 1,401
Boddington 275 5 - - 1 2 36 319 315 1,013
Tanami 118 2 5 - 1 - 37 163 173 942
Jundee 85 5 1 - 1 - 16 108 139 777
Waihi 38 - 1 - 1 - 2 42 66 636
Kalgoorlie 142 1 3 - - 1 6 153 167 916 Other Australia/New Zealand - - 2 - 11 - 5 18 - -
Australia/New Zealand 658 13 12 - 15 3 102 803 860 934
Batu Hijau 17 1 - - 2 1 5 26 15 1,733
Other Indonesia - - - - 1 - - 1 - -
Indonesia 17 1 - - 3 1 5 27 15 1,800
Ahafo 126 2 14 - 4 - 57 203 231 879
Akyem 82 1 - - 5 - 2 90 232 388
Other Africa - - 5 - 4 - - 9 - -
Africa 208 3 19 - 13 - 59 302 463 652
Corporate and Other - - 59 93 17 - 7 176 - -
Total Gold $ 1,904 $ 81 $ 157 $ 93 $ 76 $ 9 $ 350 $ 2,670 2,547 $ 1,048
COPPER
Phoenix $ 56 $ 1 $ - $ - $ 1 $ 3 $ 8 $ 69 24 $ 2.88
Boddington 72 2 - - - 11 8 93 28 3.32
Batu Hijau 111 8 2 - 13 9 27 170 38 4.47
Total Copper $ 239 $ 11 $ 2 $ - $ 14 $ 23 $ 43 $ 332 90 $ 3.69
Consolidated $ 2,143 $ 92 $ 159 $ 93 $ 90 $ 32 $ 393 $ 3,002

All-in sustaining costs (1) Excludes Depreciation and amortization and
Reclamation and remediation.
(2) Includes by-product credits of $54.
(3) Includes stockpile and leach pad inventory
adjustments of $53 at Yanacocha, $86 at Boddington,
$1 at Tanami, $3 at Waihi, $45 at Kalgoorlie, and $366
at Batu Hijau.
(4) Remediation costs include operating accretion of
$30 and amortization of asset retirement costs of $45.
(5) Other expense, net is adjusted for restructuring
costs of $30 and TMAC transaction costs of $45.
(6) Excludes development capital expenditures,
capitalized interest, and the decrease in accrued
capital of $588. The following are major development
projects: Phoenix Copper Leach, Turf Vent Shaft, Vista
Vein, La Herradura Mill, Yanacocha Bio Leach, Conga,
Merian, Ahafo North, Ahafo Mill Expansion, Subika
Underground, and Akyem for 2013.
Newmont Mining Corporation Slide 31 July 30, 2014
Costs Advanced Other Treatment
and All-In Ounces (000)/
All-In Sustaining
Six Months Ended Applicable Remediation Projects and General and Expense, Refining Sustaining Sustaining Pounds
(millions) Costs
June 30, 2013 to Sales(1)(2)(3) Costs
(4) Exploration
Administrative Net
(5)
Costs
Capital
(6)
Costs
Sold per oz/lb
GOLD
Carlin $ 348 $ 3 $ 19 $ - $ 3 $ - $ 83 $ 456 431 $ 1,058
Phoenix 78 1 5 - 2 4 7 97 98 990
Twin Creeks 132 2 6 - 2 - 31 173 221 783
La Herradura 82 - 21 - - - 50 153 109 1,404
Other North America - - 21 - 3 - 12 36 - -
North America 640 6 72 - 10 4 183 915 859 1,065
Yanacocha 361 45 23 - 25 - 68 522 575 908
Other South America - - 5 - - - - 5 - -
South America 361 45 28 - 25 - 68 527 575 917
Boddington 426 4 - - 1 3 43 477 393 1,214
Tanami 139 1 5 - 1 - 43 189 121 1,562
Jundee 105 7 7 - 1 - 24 144 149 966
Waihi 53 2 2 - - - 7 64 55 1,164
Kalgoorlie 198 3 2 - 1 - 4 208 151 1,377 Other Australia/New Zealand - - 8 - 20 - - 28 - -
Australia/New Zealand 921 17 24 - 24 3 121 1,110 869 1,277
Batu Hijau 70 - 2 - 3 2 8 85 19 4,474
Indonesia 70 - 2 - 3 2 8 85 19 4,474
Ahafo 151 2 24 - 2 - 80 259 261 992
Akyem - - 5 - - - - 5 - -
Other Africa - - 6 - 11 - - 17 - -
Africa 151 2 35 - 13 - 80 281 261 1,077
Corporate and Other - - 61 110 15 - 8 194 - -
Total Gold $ 2,143 $ 70 $ 222 $ 110 $ 90 $ 9 $ 468 $ 3,112 2,583 $ 1,205
COPPER
Phoenix $ 26 $ - $ 2 $ - $ - $ 2 $ 3 $ 33 12 $ 2.75
Boddington 110 1 - - - 10 11 132 39 3.38
Batu Hijau 460 4 9 - 11 17 50 551 60 9.18
Total Copper $ 596 $ 5 $ 11 $ - $ 11 $ 29 $ 64 $ 716 111 $ 6.45
Consolidated $ 2,739 $ 75 $ 233 $ 110 $ 101 $ 38 $ 532 $ 3,828

Investors are encouraged to read the information contained in this presentation in conjunction with the following notes, the Cautionary Statement on
slide 2 and the factors described under the “Risk Factors” section of the Company’s most recent Form 10-K, filed with the SEC on February 21, 2014,
and disclosure in the Company’s recent SEC filings including the Form 10-Q.
1. AISC or All-in sustaining cost is a non-GAAP metric. See pages 27 to 31 for more information and a reconciliation to the nearest GAAP metric.
2. 2014 and 2014 - 2016 Outlook projections used in this presentation (“Outlook”) are considered “forward-looking statements” and represent
management’s good faith estimates or expectations of future production results as of June 30, 2014, and are based upon certain assumptions,
including, but not limited to, metal prices, oil prices, Australian dollar exchange rate, and those set forth on slide 2. Consequently, Outlook cannot
be guaranteed. Investors are cautioned that the Company does not undertake to subsequently reaffirm, provide comfort or otherwise update
Outlook to reflect events or circumstances after the date hereof or to reflect the occurrence of unanticipated events. Investors should not assume
that any lack of update constitutes a current reaffirmation of Outlook. See pages 24– 25.
3. Cash AISC is a non-GAAP metric. Cash AISC is AISC less NRVs of $182 for the six months ended June 30, 2014 and $554 for the six months
ended June 30, 2013. See pages 27 to 31 for more information and a reconciliation of AISC to the nearest GAAP metric.
4. Non-GAAP metric. See page 26 for reconciliation.
5. Development of the project remains subject to receipt of the Right of Exploitation and certain other factors. The project metrics presented for the
Merian project are based upon management’s reasonable good faith belief as of the date of this presentation and are presented on a consolidated
basis. The listed project metrics constitute forward-looking statements and are subject to certain risks and uncertainties. See slide 2 for the
cautionary statement regarding forward-looking statements.
6. Reserves are presented as of December 31, 2013 on a consolidated basis. On such basis, reserves at Merian were estimated at 108,250 ktonnes
of Probable Reserves, grading 1.22 gpt for 4.2Moz, using a $1,300/oz gold price assumption. See http://www.newmont.com/our-
investors/reserves-and-resources for the Company’s 2013 Reserves and Resources and additional information.
Endnotes
Newmont Mining Corporation Slide 32 July 30, 2014