second quarter fiscal 2021 december 30, 2020
TRANSCRIPT

Second Quarter Fiscal 2021December 30, 2020

SAFE HARBOR
This presentation contains certain forward-looking statements
concerning Matrix Service Company’s operations, economic
performance and management’s best judgment as to what
may occur in the future. The actual results for the current and
future periods and other corporate developments will depend
upon a number of economic, competitive and other
influences, many of which are beyond the control of the
Company, and any one of which, or a combination of which,
could materially affect the results of the Company’s
operations. Such forward-looking statements are subject to a
number of risks and uncertainties as identified in the
Company’s most recent Annual Report on Form 10-K and in
subsequent filings made by the Company with the SEC. To
the extent the Company utilizes non-GAAP measures,
reconciliations will be provided in various press releases and
on the Company’s website.
2

SAFETY MOMENT

BUSINESS DISCUSSION

• Overall cost reduction and organizational restructuring
• Positioned the Company to support accelerated drive
by the energy and infrastructure markets to reduce
carbon emissions
• Implemented new reporting segmentation and changed
our GICS code from Energy/Equipment and Services to
Industrial/Construction and Engineering, better
reflecting our business and end markets
• Continue to maintain a strong balance sheet to support
the needs of the business including working capital and
letters of credit
Our focus and discipline has kept our balance sheet strong and supports the needs of the business as awards and revenue volumes improve
ACCOMPLISHMENTS
5

Advance work on important ESG initiatives, critical to:
• Attracting and retaining best-in-class people
• Supporting projects and business objectives of our
clients and investors
• Identifying and acting on strategic opportunities
• Ensuring organizational resilience and long-term
sustainable growth
First Sustainability Report will be published in the Fall 2021
ENVIRONMENT, SOCIAL, AND GOVERNANCE
6

OPERATING SEGMENTS
UTILITY &
POWER INFRA-
STRUCTURE
PROCESS &
INDUSTRIAL
FACILITIES
STORAGE &
TERMINAL
SOLUTIONS
• LNG peak shaving
• Power delivery
• Grid connectivity
• Renewable power
• Power generation
• Battery storage
• Data cabling
• Data centers
• Midstream natural gas
• Renewables/Biofuels
• Mining and minerals
• Chemical / petrochemical
• Aerospace
• Refineries
• Fertilizer
• Industrial facilities
• LNG storage and
bunkering
• NGLS
• Specialty vessels
• Renewable energy
• Crude tanks and terminals
• Aftermarket storage
products
7
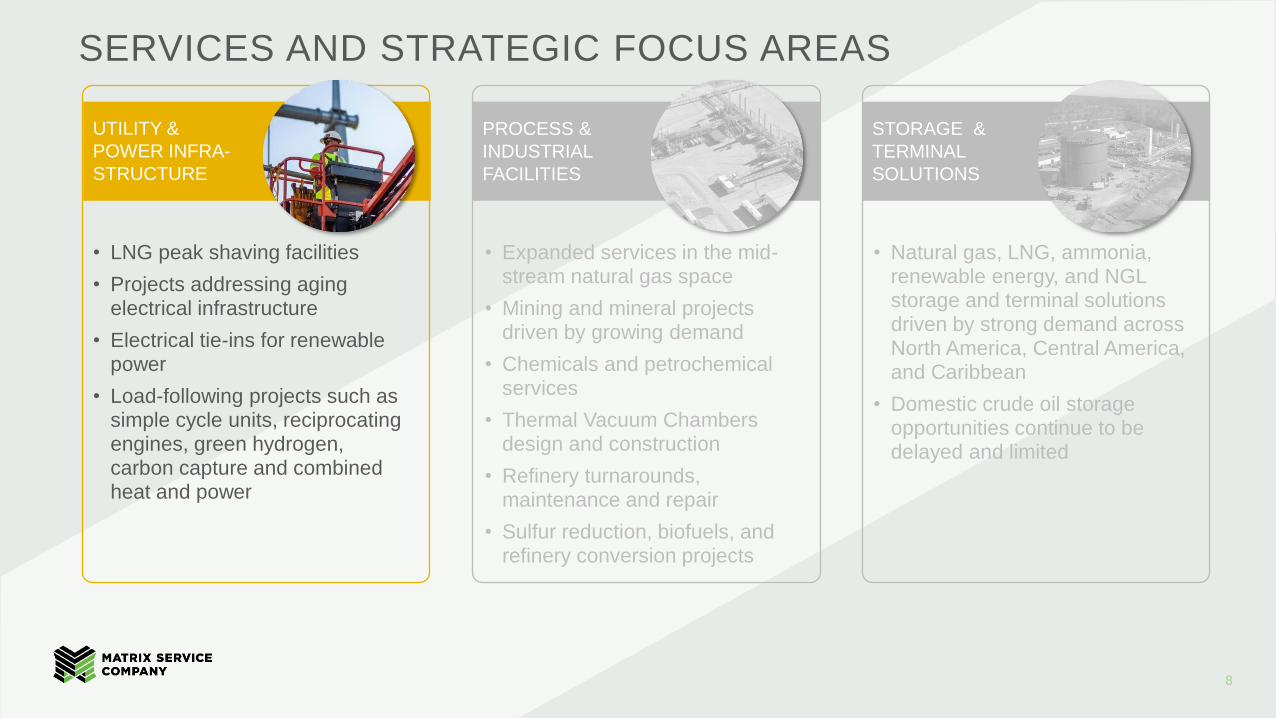
SERVICES AND STRATEGIC FOCUS AREAS
UTILITY &
POWER INFRA-
STRUCTURE
PROCESS &
INDUSTRIAL
FACILITIES
STORAGE &
TERMINAL
SOLUTIONS
• LNG peak shaving facilities
• Projects addressing aging electrical infrastructure
• Electrical tie-ins for renewable power
• Load-following projects such as simple cycle units, reciprocating engines, green hydrogen, carbon capture and combined heat and power
• Natural gas, LNG, ammonia, renewable energy, and NGL storage and terminal solutions driven by strong demand across North America, Central America, and Caribbean
• Domestic crude oil storage opportunities continue to be delayed and limited
8
• Expanded services in the mid-stream natural gas space
• Mining and mineral projects driven by growing demand
• Chemicals and petrochemical services
• Thermal Vacuum Chambers design and construction
• Refinery turnarounds, maintenance and repair
• Sulfur reduction, biofuels, and refinery conversion projects
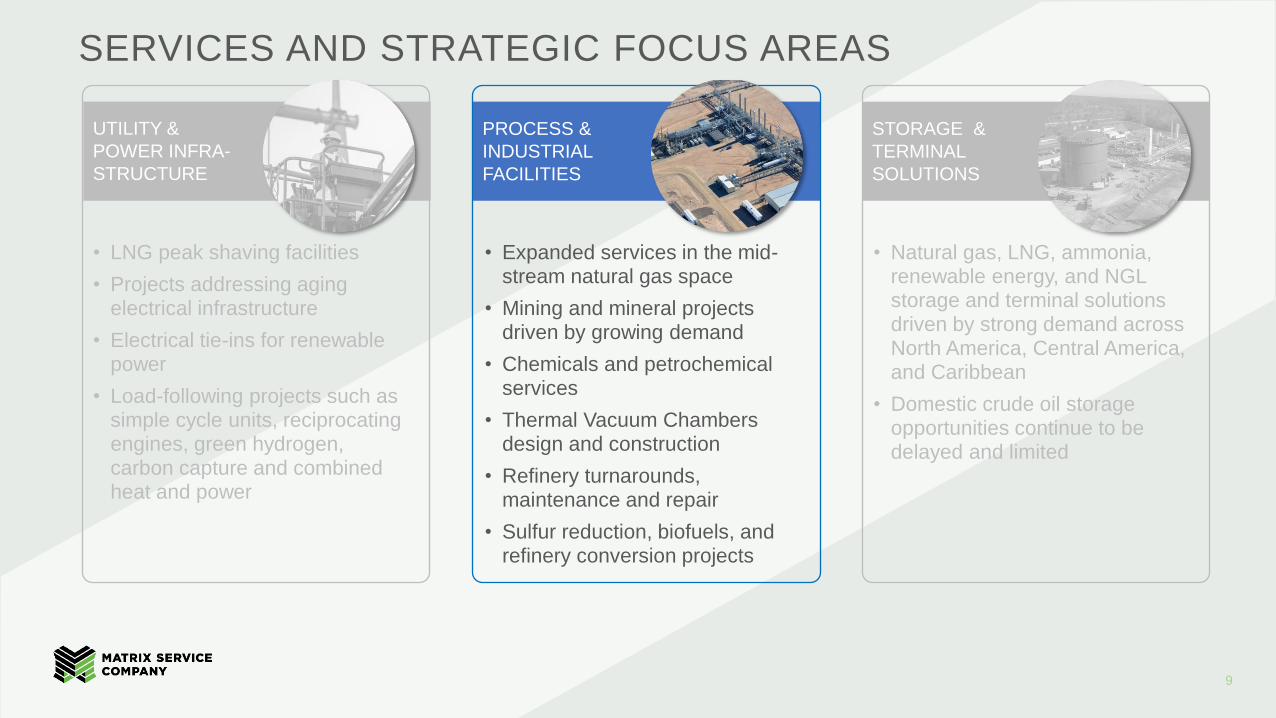
SERVICES AND STRATEGIC FOCUS AREAS
UTILITY &
POWER INFRA-
STRUCTURE
PROCESS &
INDUSTRIAL
FACILITIES
STORAGE &
TERMINAL
SOLUTIONS
• LNG peak shaving facilities
• Projects addressing aging electrical infrastructure
• Electrical tie-ins for renewable power
• Load-following projects such as simple cycle units, reciprocating engines, green hydrogen, carbon capture and combined heat and power
• Expanded services in the mid-stream natural gas space
• Mining and mineral projects driven by growing demand
• Chemicals and petrochemical services
• Thermal Vacuum Chambers design and construction
• Refinery turnarounds, maintenance and repair
• Sulfur reduction, biofuels, and refinery conversion projects
• Natural gas, LNG, ammonia, renewable energy, and NGL storage and terminal solutions driven by strong demand across North America, Central America, and Caribbean
• Domestic crude oil storage opportunities continue to be delayed and limited
9

SERVICES AND STRATEGIC FOCUS AREAS
UTILITY &
POWER INFRA-
STRUCTURE
PROCESS &
INDUSTRIAL
FACILITIES
STORAGE &
TERMINAL
SOLUTIONS
• LNG peak shaving facilities
• Projects addressing aging electrical infrastructure
• Electrical tie-ins for renewable power
• Load-following projects such as simple cycle units, reciprocating engines, green hydrogen, carbon capture and combined heat and power
• Natural gas, LNG, ammonia, renewable energy, and NGL storage and terminal solutions driven by strong demand across North America, Central America, and Caribbean
• Domestic crude oil storage opportunities continue to be delayed and limited
10
• Expanded services in the mid-stream natural gas space
• Mining and mineral projects driven by growing demand
• Chemicals and petrochemical services
• Thermal Vacuum Chambers design and construction
• Refinery turnarounds, maintenance and repair
• Sulfur reduction, biofuels, and refinery conversion projects

Diversification allows for significant growth and provides protection against seasonal and other market cyclicality. Focus on low carbon energy, renewables ,and electrical
supports our clients drive to reduce their carbon footprint
STRATEGIC TRANSITION AND DIVERSIFICATION
70%
30%40%
60%
2011 CURRENT
Crude Oil Non-Crude Oil
AVERAGE BUSINESS PORTFOLIO MIX
11
• Expand gas value chain services
• Develop presence in chemical/petrochemical
• Grow electrical infrastructure
• Renewable energy services
• Protect crude market service offering
• International deployment
• Strengthen engineering and process
capabilities across all segments

THE ROLE OF HYDROGEN
SOURCE: U.S. Department of Energy, Hydrogen
Strategy – Enabling a Low-Carbon Economy
12
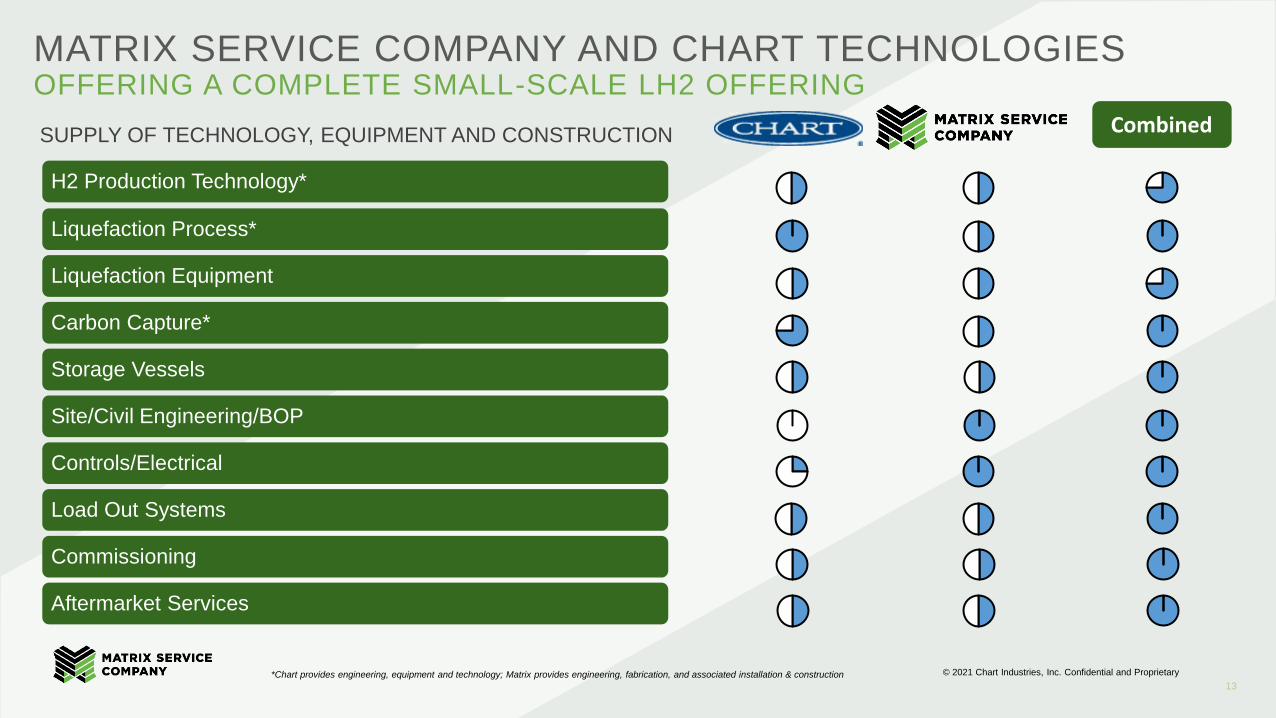
MATRIX SERVICE COMPANY AND CHART TECHNOLOGIESOFFERING A COMPLETE SMALL-SCALE LH2 OFFERING
© 2021 Chart Industries, Inc. Confidential and Proprietary
H2 Production Technology*
Liquefaction Process*
Liquefaction Equipment
Carbon Capture*
Storage Vessels
Site/Civil Engineering/BOP
Controls/Electrical
Load Out Systems
Commissioning
Aftermarket Services
SUPPLY OF TECHNOLOGY, EQUIPMENT AND CONSTRUCTION Combined
*Chart provides engineering, equipment and technology; Matrix provides engineering, fabrication, and associated installation & construction
13

ADJUSTED DILUTED EARNINGS PER SHARE($ in thousands, except EPS)
December 31 December 31 December 31 December 31
2020 2019 2020 2019
Net loss, as reported (4,591)$ (28,008)$ (7,628)$ (21,857)$
Restructuring costs incurred 5,045 - 4,725 -
Goodwill and intangible asset impairments - 38,515 - 38,515
Tax impact of adjustments and other net tax items (1,299) (5,275) (1,217) (5,275)
Adjusted net income (loss) (845)$ 5,232$ (4,120)$ 11,383$
Loss per fully diluted share, as reported (0.17)$ (1.04)$ (0.29)$ (0.81)$
Adjusted earnings (loss) per fully diluted share (0.03)$ 0.19$ (0.16)$ 0.41$
Three Months Ended Six Months Ended
14
15
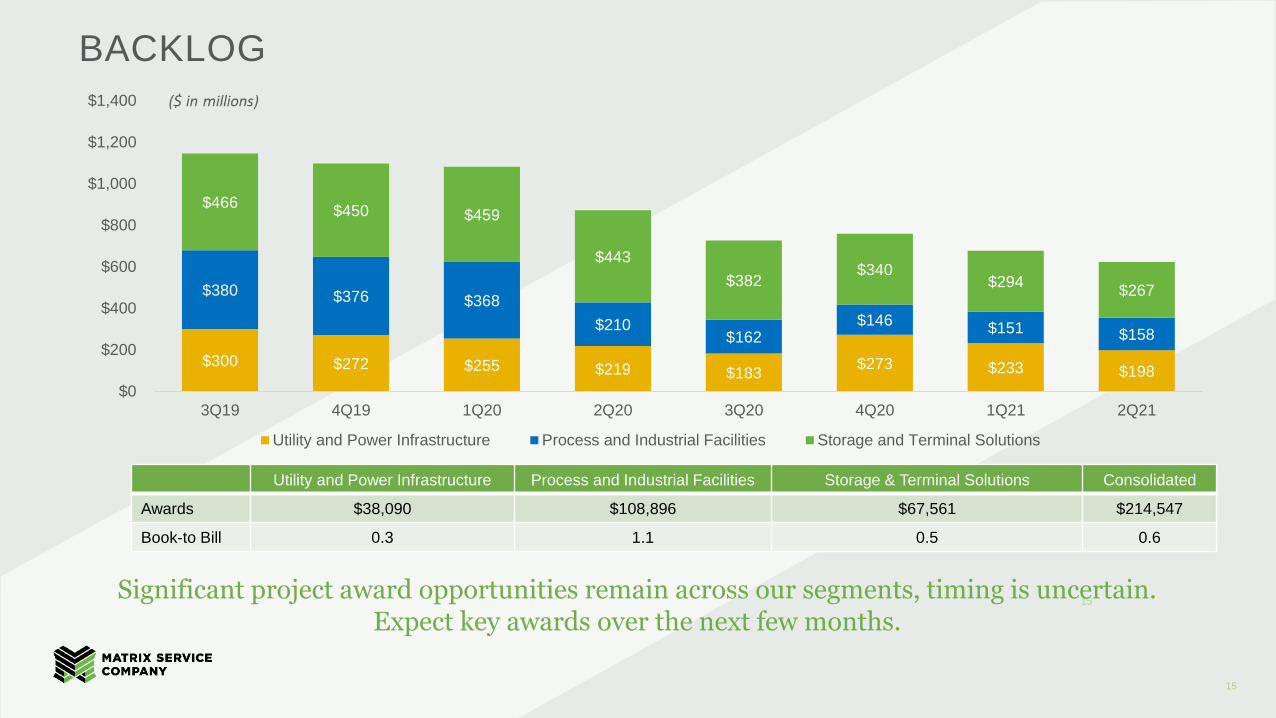
BACKLOG
Significant project award opportunities remain across our segments, timing is uncertain. Expect key awards over the next few months.
Utility and Power Infrastructure Process and Industrial Facilities Storage & Terminal Solutions Consolidated
Awards $38,090 $108,896 $67,561 $214,547
Book-to Bill 0.3 1.1 0.5 0.6
$300 $272 $255 $219 $183 $273 $233 $198
$380 $376 $368
$210 $162
$146 $151 $158
$466 $450 $459
$443
$382 $340
$294 $267
$0
$200
$400
$600
$800
$1,000
$1,200
$1,400
3Q19 4Q19 1Q20 2Q20 3Q20 4Q20 1Q21 2Q21
Utility and Power Infrastructure Process and Industrial Facilities Storage and Terminal Solutions
15
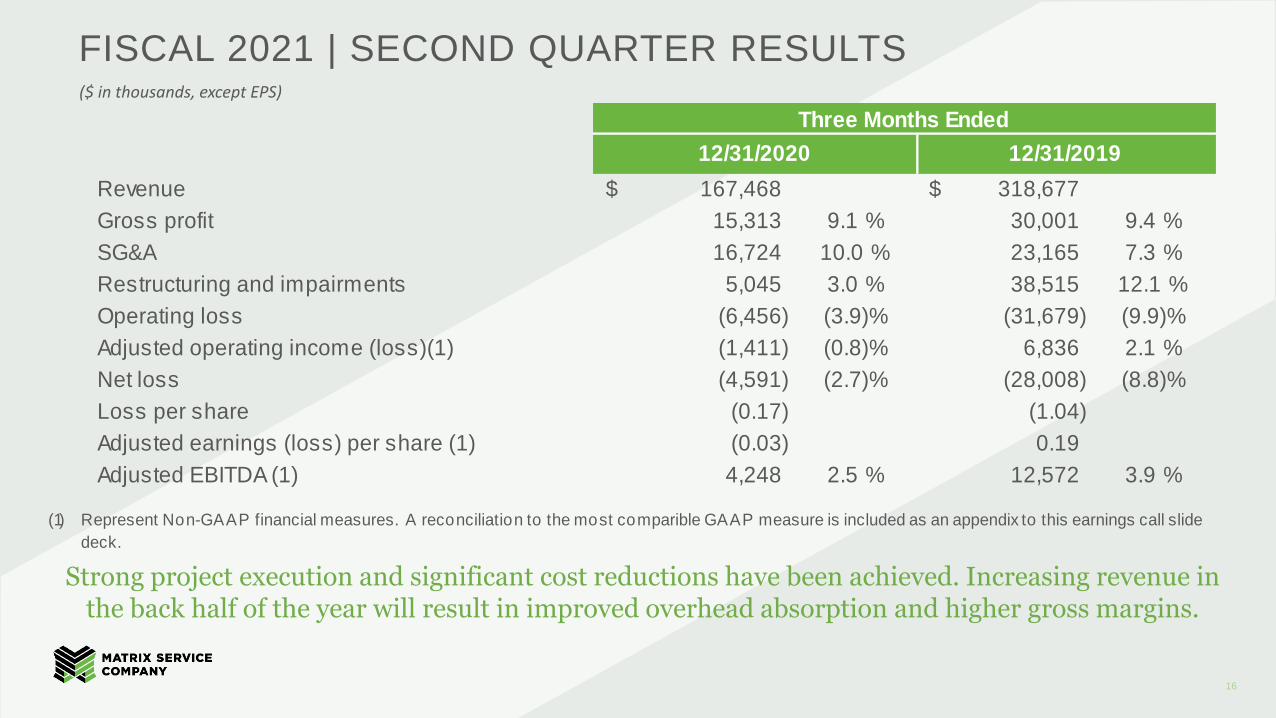
($ in thousands, except EPS)
FISCAL 2021 | SECOND QUARTER RESULTS
Revenue 167,468$ 318,677$
Gross profit 15,313 9.1 % 30,001 9.4 %
SG&A 16,724 10.0 % 23,165 7.3 %
Restructuring and impairments 5,045 3.0 % 38,515 12.1 %
Operating loss (6,456) (3.9)% (31,679) (9.9)%
Adjusted operating income (loss)(1) (1,411) (0.8)% 6,836 2.1 %
Net loss (4,591) (2.7)% (28,008) (8.8)%
Loss per share (0.17) (1.04)
Adjusted earnings (loss) per share (1) (0.03) 0.19
Adjusted EBITDA (1) 4,248 2.5 % 12,572 3.9 %
(1)
12/31/2020 12/31/2019
Three Months Ended
Represent Non-GAAP financial measures. A reconciliation to the most comparible GAAP measure is included as an appendix to this earnings call slide
deck.
16
Strong project execution and significant cost reductions have been achieved. Increasing revenue in the back half of the year will result in improved overhead absorption and higher gross margins.

Q2 FY21 SEGMENT RESULTS($ in thousands)
2Q FY21
Utility and
Power
Infrastructure
Process and
Industrial
Facilities
Storage and
Termnial
Solutions
Corporate TOTAL
Revenue 52,023$ 51,262$ 64,183$ 167,468$
Gross profit 5,597$ 7,864$ 1,852$ 15,313$
Gross margin 10.8% 15.3% 2.9% 9.1%
Restucturing 812$ 3,364$ 641$ 228$ 5,045$
Operating income (loss) 2,209$ 1,113$ (2,708)$ (7,070)$ (6,456)$
Adjusted operating income (loss)(1) 3,021$ 4,477$ (2,067)$ (6,842)$ (1,411)$
Backlog 198,212$ 157,428$ 267,133$ 622,773$
Awards 16,772$ 58,100$ 36,942$ 111,814$
Book-to-bill ratio 0.3 1.1 0.6 0.7
2Q FY20
Utility and
Power
Infrastructure
Process and
Industrial
Facilities
Storage and
Termnial
Solutions
Corporate TOTAL
Revenue 49,155$ 142,883$ 126,639$ 318,677$
Gross profit (loss) (1,226)$ 13,838$ 18,026$ (637)$ 30,001$
Gross margin (2.5%) 9.7% 14.2% 9.4%
Impairments 24,900$ 13,615$ 38,515$
Operating income (28,904)$ (7,162)$ 11,235$ (6,848)$ (31,679)$
Adjusted operating income (loss)(1) (4,004)$ 6,453$ 11,235$ (6,848)$ 6,836$
Backlog 219,255$ 209,722$ 443,258$ 872,235$
Awards 13,506$ 72,734$ 111,042$ 197,282$
Book-to-bill ratio 0.3 0.5 0.9 0.6
(1) Represents a Non-GAAP financial measure. A reconciliation to the most comparible GAAP measure is included as an appendix to this earnings call slide deck.
38%
31%
31%
40%
15%
45%
2Q, FY2021
2Q, FY2020
Utility and Power Infrastructure
Process and Industrial Facilities
Storage and Terminal Solutions
REVENUE
17
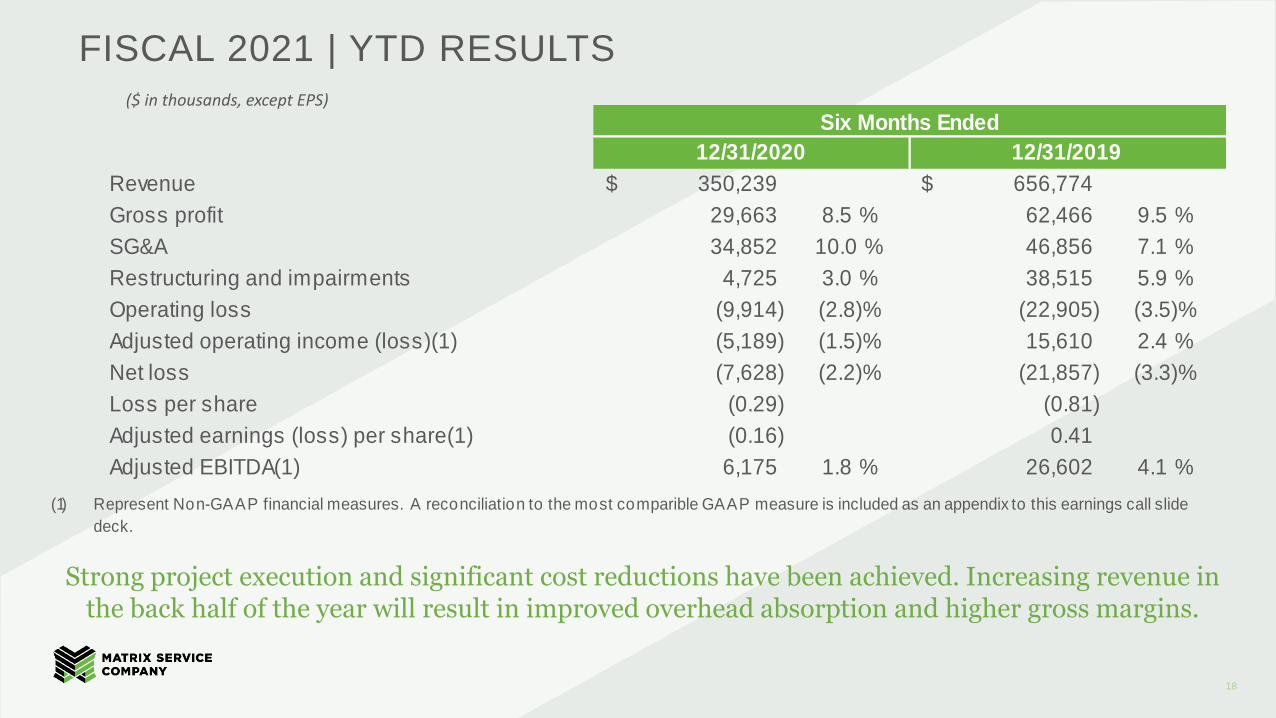
($ in thousands, except EPS)
FISCAL 2021 | YTD RESULTS
Revenue 350,239$ 656,774$
Gross profit 29,663 8.5 % 62,466 9.5 %
SG&A 34,852 10.0 % 46,856 7.1 %
Restructuring and impairments 4,725 3.0 % 38,515 5.9 %
Operating loss (9,914) (2.8)% (22,905) (3.5)%
Adjusted operating income (loss)(1) (5,189) (1.5)% 15,610 2.4 %
Net loss (7,628) (2.2)% (21,857) (3.3)%
Loss per share (0.29) (0.81)
Adjusted earnings (loss) per share(1) (0.16) 0.41
Adjusted EBITDA(1) 6,175 1.8 % 26,602 4.1 %
(1)
12/31/2020 12/31/2019
Six Months Ended
Represent Non-GAAP financial measures. A reconciliation to the most comparible GAAP measure is included as an appendix to this earnings call slide
deck.
18
Strong project execution and significant cost reductions have been achieved. Increasing revenue in the back half of the year will result in improved overhead absorption and higher gross margins.
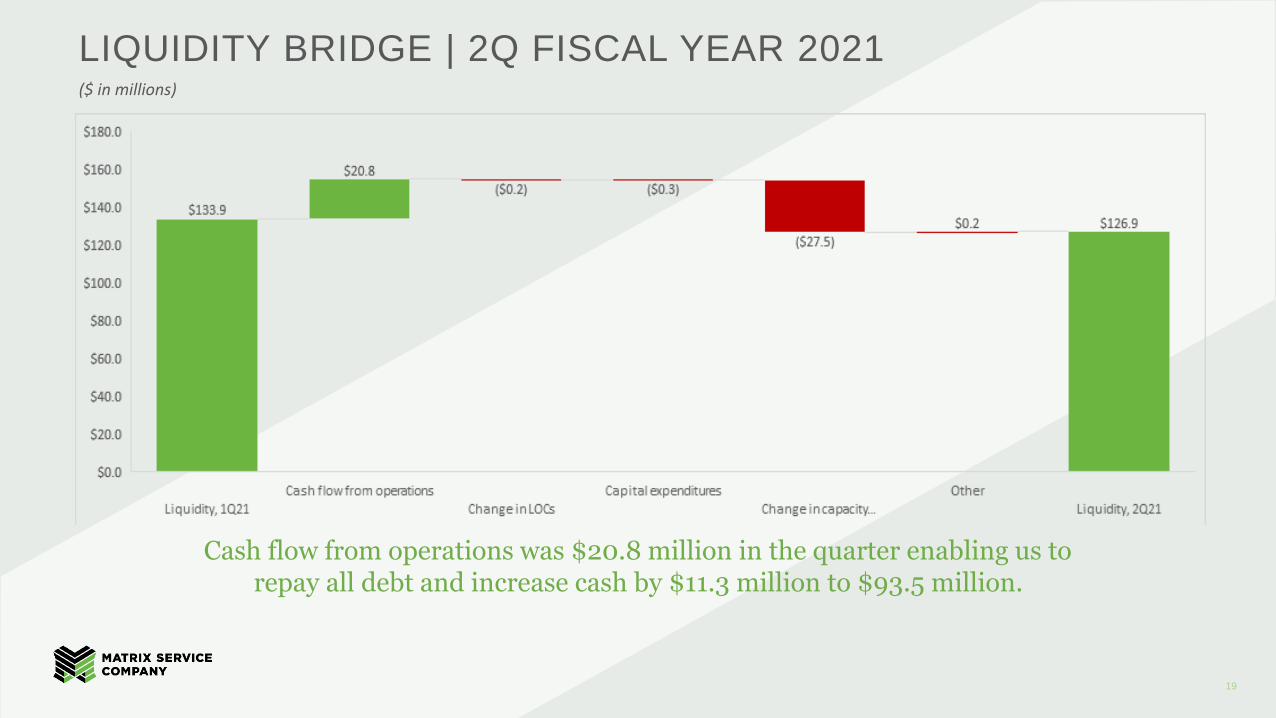
LIQUIDITY BRIDGE | 2Q FISCAL YEAR 2021
Cash flow from operations was $20.8 million in the quarter enabling us to repay all debt and increase cash by $11.3 million to $93.5 million.
($ in millions)
19

Q&A
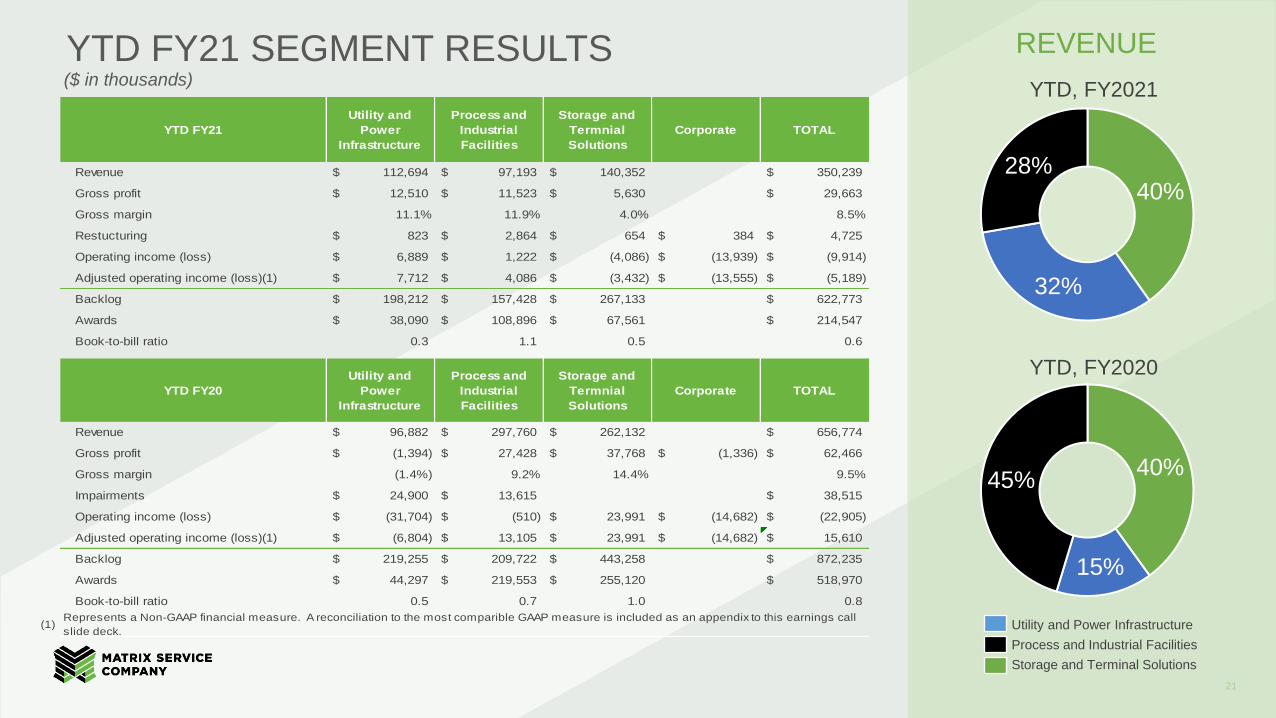
YTD FY21 SEGMENT RESULTS($ in thousands)
YTD FY21
Utility and
Power
Infrastructure
Process and
Industrial
Facilities
Storage and
Termnial
Solutions
Corporate TOTAL
Revenue 112,694$ 97,193$ 140,352$ 350,239$
Gross profit 12,510$ 11,523$ 5,630$ 29,663$
Gross margin 11.1% 11.9% 4.0% 8.5%
Restucturing 823$ 2,864$ 654$ 384$ 4,725$
Operating income (loss) 6,889$ 1,222$ (4,086)$ (13,939)$ (9,914)$
Adjusted operating income (loss)(1) 7,712$ 4,086$ (3,432)$ (13,555)$ (5,189)$
Backlog 198,212$ 157,428$ 267,133$ 622,773$
Awards 38,090$ 108,896$ 67,561$ 214,547$
Book-to-bill ratio 0.3 1.1 0.5 0.6
YTD FY20
Utility and
Power
Infrastructure
Process and
Industrial
Facilities
Storage and
Termnial
Solutions
Corporate TOTAL
Revenue 96,882$ 297,760$ 262,132$ 656,774$
Gross profit (1,394)$ 27,428$ 37,768$ (1,336)$ 62,466$
Gross margin (1.4%) 9.2% 14.4% 9.5%
Impairments 24,900$ 13,615$ 38,515$
Operating income (loss) (31,704)$ (510)$ 23,991$ (14,682)$ (22,905)$
Adjusted operating income (loss)(1) (6,804)$ 13,105$ 23,991$ (14,682)$ 15,610$
Backlog 219,255$ 209,722$ 443,258$ 872,235$
Awards 44,297$ 219,553$ 255,120$ 518,970$
Book-to-bill ratio 0.5 0.7 1.0 0.8
(1)Represents a Non-GAAP financial measure. A reconciliation to the most comparible GAAP measure is included as an appendix to this earnings call
slide deck.
40%
32%
28%
40%
15%
45%
YTD, FY2021
YTD, FY2020
Utility and Power Infrastructure
Process and Industrial Facilities
Storage and Terminal Solutions
REVENUE
21

APPENDIX
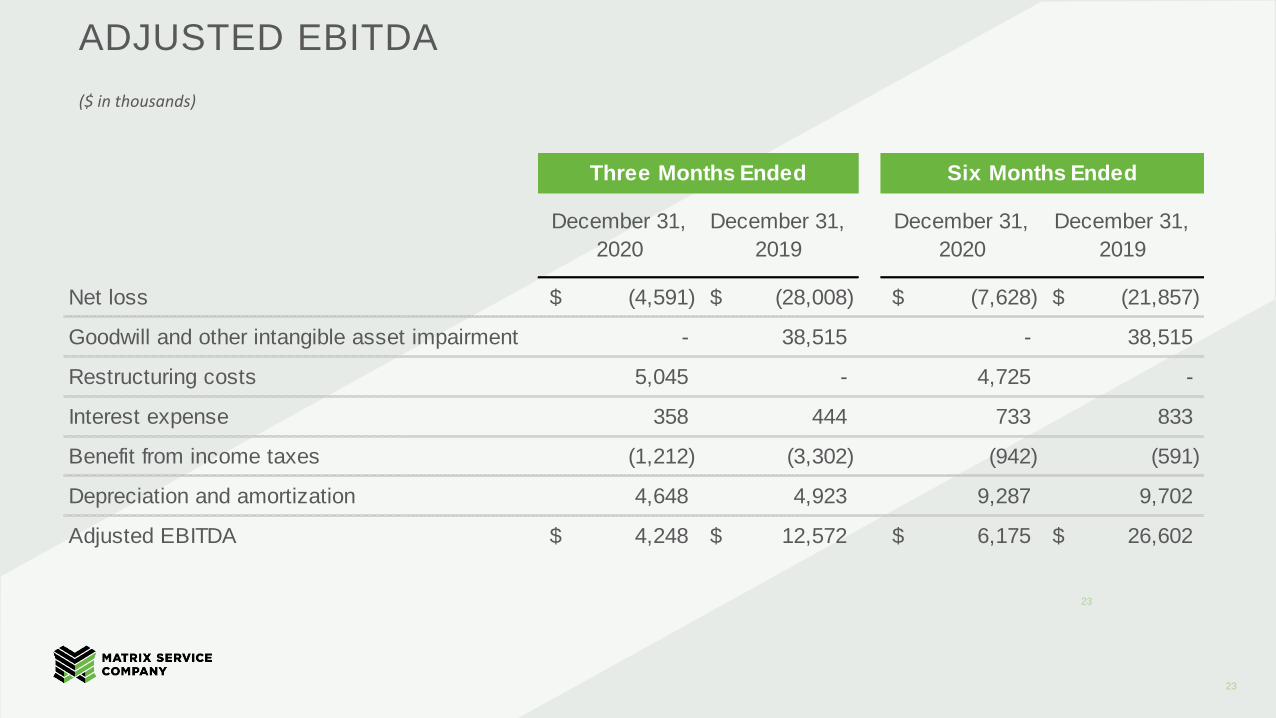
ADJUSTED EBITDA
($ in thousands)
23
December 31,
2020
December 31,
2019
December 31,
2020
December 31,
2019
Net loss (4,591)$ (28,008)$ (7,628)$ (21,857)$
Goodwill and other intangible asset impairment - 38,515 - 38,515
Restructuring costs 5,045 - 4,725 -
Interest expense 358 444 733 833
Benefit from income taxes (1,212) (3,302) (942) (591)
Depreciation and amortization 4,648 4,923 9,287 9,702
Adjusted EBITDA 4,248$ 12,572$ 6,175$ 26,602$
Three Months Ended Six Months Ended
23

ADJUSTED OPERATING INCOME – YTD($ in thousands)
FY21 YTD
Utility and
Power
Infrastructure
Process and
Industrial
Facilities
Storage and
Termnial
Solutions
Corporate TOTAL
Operating income (loss) 6,889$ 1,222$ (4,086)$ (13,939)$ (9,914)$
Add: Restucturing costs 823 2,864 654 384 4,725
Adjusted operating income (loss) 7,712$ 4,086$ (3,432)$ (13,555)$ (5,189)$
FY 20 YTD
Utility and
Power
Infrastructure
Process and
Industrial
Facilities
Storage and
Termnial
Solutions
Corporate TOTAL
Operating income (loss) (31,704)$ (510)$ 23,991$ (14,682)$ (22,905)$
Add: Impairments 24,900 13,615 38,515
Adjusted operating income (loss) (6,804)$ 13,105$ 23,991$ (14,682)$ 15,610$
24

ADJUSTED OPERATING INCOME – SECOND QUARTER($ in thousands)
2Q FY21
Utility and
Power
Infrastructure
Process and
Industrial
Facilities
Storage and
Termnial
Solutions
Corporate TOTAL
Operating income (loss) 2,209$ 1,113$ (2,708)$ (7,070)$ (6,456)$
Add: Restucturing costs 812 3,364 641 228 5,045
Adjusted operating income (loss) 3,021$ 4,477$ (2,067)$ (6,842)$ (1,411)$
2Q FY20
Utility and
Power
Infrastructure
Process and
Industrial
Facilities
Storage and
Termnial
Solutions
Corporate TOTAL
Operating income (loss) (28,904)$ (7,162)$ 11,235$ (6,848)$ (31,679)$
Add: Impairments 24,900 13,615 38,515
Adjusted operating income (loss) (4,004)$ 6,453$ 11,235$ (6,848)$ 6,836$
25