earnings release & fact sheet second quarter, … · earnings release & fact sheet second...
TRANSCRIPT
Earnings Release & Fact Sheet Second Quarter, Fiscal 2017
Page 1 of 14
Earnings Release & Fact Sheet Second Quarter, Fiscal 2017
November 9, 2016
Earnings Release & Fact Sheet Second Quarter, Fiscal 2017
Page 2 of 14
1.Earnings Release – Q2 FY17 …..…....……………………….3
2.Performance Highlights – Q2 FY17…………………………7
3.Financial Statements – Q2 FY17……………………………11
4. Contact Information………………………………………..….14
Certain statements in this release concerning our future growth prospects are forward-looking statements, which involve a number of risks, and uncertainties that could cause our actual results to differ materially from those in such forward-looking statements. L&T Infotech does not undertake to update any forward-looking statement that may be made from time to time by us or on our behalf.
Recent Deal Wins, Business Highlights and Awards and Recognitions section in this release include relevant disclosures between our last earnings release and this release.
Safe Harbour
Co
nte
nts
Earnings Release & Fact Sheet Second Quarter, Fiscal 2017
Page 3 of 14
Mumbai, India: November 9, 2016: L&T Infotech (BSE code: 540005, NSE: LTI), a global IT services and solutions provider, announced its Q2 FY17 results today.
In US Dollars:
Revenue at USD 239.7 million; growth of 3.7% QoQ and 7.0% YoY
Constant Currency Revenue growth of 3.6% QoQ and 7.2% YoY
In Indian Rupees:
Revenue at Rs 16,020 million; growth at 3.0% QoQ and 9.1% YoY
Net Income at Rs 2,326 million; Net Income growth at (1.3)% QoQ and 11.3% YoY
Net Income Margin at 14.3%, down 58bps QoQ and up 52bps YoY
"I am happy to report a strong quarter-on-quarter growth of 3.7% in the top line. This solid
performance is result of our investments in new service lines, partnerships and building a robust
sales and marketing engine. We announced the acquisition of AugmentIQ in big data and analytics
space last month which positions us to enable accelerated data monetization for clients across
verticals. Our client-centric approach has helped us win critical engagements in five growth areas
of – Digital, Analytics, IoT, Cloud Apps and Automation, many of them against significantly larger
and global incumbents. We will remain focused on implementing our LTI 2.0 strategy."
- Sanjay Jalona, Chief Executive Officer & Managing Director
Earnings Release – Q2 FY17 Results
L&T Infotech Posts Strong 3.7% QoQ Growth in USD revenue; driven by Digital services
Declares interim dividend of Rs 6.85 per share
Earnings Release & Fact Sheet Second Quarter, Fiscal 2017
Page 4 of 14
Recent Deal Wins:
AGF Investments Inc. Canada selected L&T Infotech Financial Services Technologies as its primary provider for transfer agency function
Won an applications managed services engagement with Hartford Steam Boiler (HSB), a leading specialty insurer with 150 years of industry leadership in equipment breakdown insurance and a subsidiary of Munich Re.
Multi-year, application & infrastructure outsourcing engagement with a large crude oil refinery company in Saudi Arabia
Multi-year, multi-service engagement with one of America’s largest corporations dealing in automotive interiors
A Global Fortune 100 Bank holding company selected us as a vendor for KYC and regulatory reporting
One of the world’s largest networking companies selected us for migrating their Big Data platform and providing Oracle Business Intelligence services
Awarded multi-year contract by one of the world’s largest semiconductor companies
Started working with a global life sciences company in the data analytics space
Selected by a leading Europe-based global media company for testing and assurance services
A US based Media & Entertainment giant selected LTI for Oracle Cloud based engagement
A large investment banking and securities trading firm selected us as a partner for risk and compliance area
A US based construction giant selected us as the partner for end-to-end ServiceNow implementation
Client Testimonial:
LTI is partnering with Terex Corporation for Salesforce based CRM transformation including expansion of Salesforce footprint across business units and complexity reduction through instance consolidation. Stefan Meiser, Director, Global Web Services, Terex Corporation - “LTI’s deep domain knowledge and expertise in implementing Salesforce has helped us design leaner, more responsive customer management channels for both sales and service”
Other Business Highlights
LTI expanded its leadership team with induction of Sudhir Chaturvedi as President-Sales
LTI announced a strategic partnership with Workplace by Facebook, an enterprise collaboration platform that redefines internal communications and changes the way work is done within an enterprise
LTI announced solutions based on Oracle IoT Cloud Service to build and deliver innovative solutions for manufacturing, utilities and construction industries
LTI and WorkFusion became Strategic Consulting Partners for Intelligent Automation
LTI announced a strategic alliance with Pegasystems to deliver advanced Business Process Management & Business Process Automation solutions
LTI and Coupa formed Strategic Partnership to provide Cloud-based Spend Management solutions

Earnings Release & Fact Sheet Second Quarter, Fiscal 2017
Page 5 of 14
Awards and Recognitions:
Named as a “ Major Player” in IDC MarketScape: Worldwide Oil and Gas Professional Services 2016 Vendor Assessment Doc #US40842116, Aug 2016
LTI cited as a "Contender" in The Forrester Wave™: Services Providers for Next-Generation Oracle Application Projects, Q3 2016
Mentioned in “Representative List: IoT Service Provider Summary”, “Representative Provider IoT Practice Summary”, and “Representative Provider Solutions/Business Outcome Focus” in Gartner’s report on Market Guide for IoT Service Providers, 2016*
Named as a "Major Player" in IDC MarketScape: Worldwide Life Science Sales and Marketing Digital Transformation 2016 Vendor Assessment Doc # US40510716, July 2016
Positioned as a ‘Leader’ in the NelsonHall Software Testing NEAT in the Overall Category
Positioned as a 'Major Contender' in Everest Group’s Digital Services PEAK MatrixTM Assessment, 2016
Positioned in the leadership zone in Zinnov Zones 2016, IoT Technology Services Report.
Featured in the HfS Blueprint Grid on Emerging Blockchain Services
Featured as a “Major Contender” in Everest Group’s Global Banking & Capital Markets AO PEAK MatrixTM 2016
Listed as one of the Consulting and SI Partners for Cloud Service in the Gartner’s Market Guide for IoT Platforms, 2016*
*Disclaimer: Gartner does not endorse any vendor, product or service depicted in its research publications, and does not advise technology users to select only those vendors with the highest ratings or other designation. Gartner research publications consist of the opinions of Gartner's research organization and should not be construed as statements of fact. Gartner disclaims all warranties, expressed or implied, with respect to this research, including any warranties of merchantability or fitness for a particular purpose.
Earnings Release & Fact Sheet Second Quarter, Fiscal 2017
Page 6 of 14
About L&T Infotech
L&T Infotech, a subsidiary of $16 Bn Larsen & Toubro group, is a global IT services and solutions provider with presence in 23 countries. We solve complex business challenges at the convergence of digital and physical with our real-world expertise and client centricity. We enable our clients to build innovative business models, enhance operational efficiencies and create captivating customer experiences.
We provide a comprehensive portfolio of solutions and services for various sectors like Banking & Financial Services, Insurance; Consumer Products, Media & Entertainment, Technology, Oil & Gas and Manufacturing. Our comprehensive services include Digital, Analytics, Automation, IIoT, ERP, Testing, and Infrastructure Management.
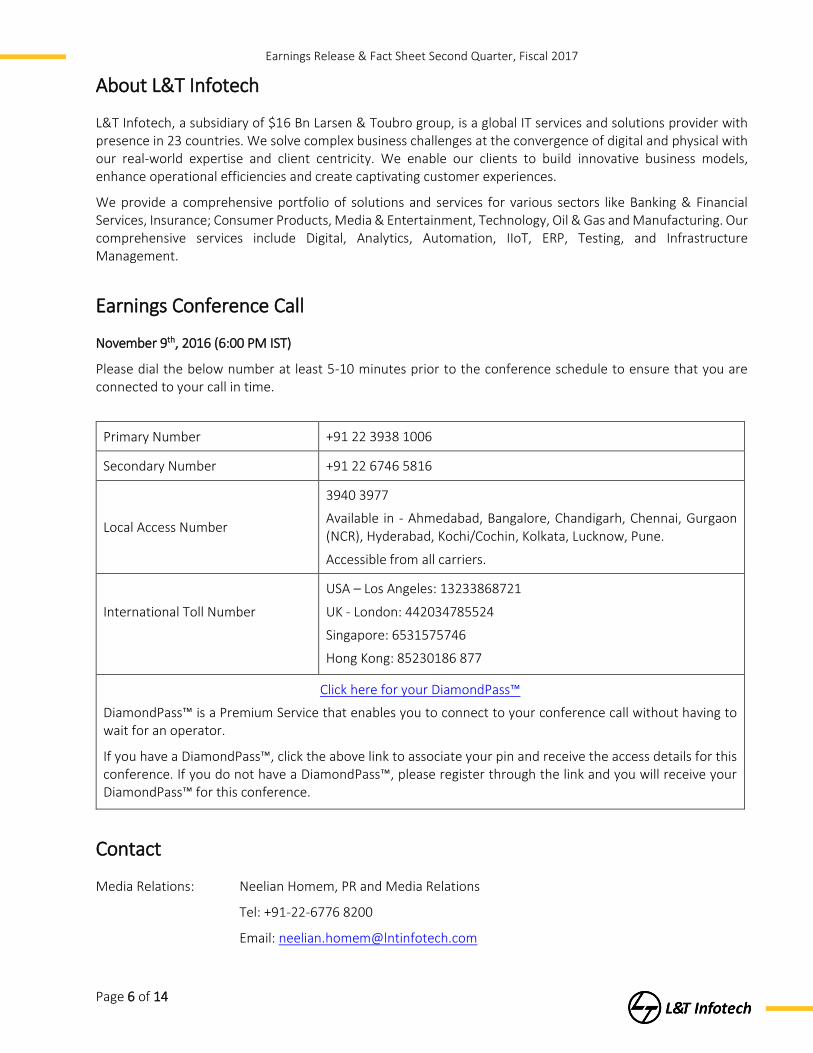
Earnings Conference Call
November 9th, 2016 (6:00 PM IST)
Please dial the below number at least 5-10 minutes prior to the conference schedule to ensure that you are connected to your call in time.
Primary Number +91 22 3938 1006
Secondary Number +91 22 6746 5816
Local Access Number
3940 3977
Available in - Ahmedabad, Bangalore, Chandigarh, Chennai, Gurgaon (NCR), Hyderabad, Kochi/Cochin, Kolkata, Lucknow, Pune.
Accessible from all carriers.
International Toll Number
USA – Los Angeles: 13233868721
UK - London: 442034785524
Singapore: 6531575746
Hong Kong: 85230186 877
Click here for your DiamondPass™
DiamondPass™ is a Premium Service that enables you to connect to your conference call without having to wait for an operator.
If you have a DiamondPass™, click the above link to associate your pin and receive the access details for this conference. If you do not have a DiamondPass™, please register through the link and you will receive your DiamondPass™ for this conference.
Contact
Media Relations: Neelian Homem, PR and Media Relations
Tel: +91-22-6776 8200
Email: [email protected]

Earnings Release & Fact Sheet Second Quarter, Fiscal 2017
Page 7 of 14
Financial Highlights
Q2FY16 Q1FY17 Q2FY17 QoQ
Growth YoY
Growth
Revenue (USD million) 223.9 231.1 239.7 3.7% 7.0%
Revenue Constant Currency 3.6% 7.2%
Revenue by Vertical #
Q2FY16 Q1FY17 Q2FY17 QoQ
Growth YoY
Growth
BFS 26.7% 25.3% 26.1% 7.0% 4.8%
Insurance 20.3% 21.9% 21.4% 1.4% 13.1%
Energy & Process 13.0% 11.9% 11.5% (0.1%) (5.6%)
CPG, Retail & Pharma 8.6% 8.0% 7.8% 0.8% (3.1%)
High-Tech, Media & Entertainment 11.5% 11.5% 11.3% 1.5% 4.7%
Auto Aero & Others 19.9% 21.3% 21.9% 6.6% 17.9%
Total 100% 100% 100%
Amount in INR million
Q2FY16 Q1FY17 Q2FY17 QoQ
Growth YoY
Growth
Revenue 14,682 15,550 16,020 3.0% 9.1%
Revenue Related Foreign Exchange Gains/(loss)
525 339 293
Total Income 15,208 15,889 16,313 2.7% 7.3%
EBITDA Margin 19.4% 21.3% 20.5% (87) bps 101 bps
EBIT Margin 16.6% 18.6% 17.6% (102) bps 98 bps
Net Income 2,090 2,358 2,326 (1.3%) 11.3%
Net Income Margin 13.7% 14.8% 14.3% (58) bps 52 bps
DSO 74 70 74
Performance Highlights – Q2 FY17
Earnings Release & Fact Sheet Second Quarter, Fiscal 2017
Page 8 of 14
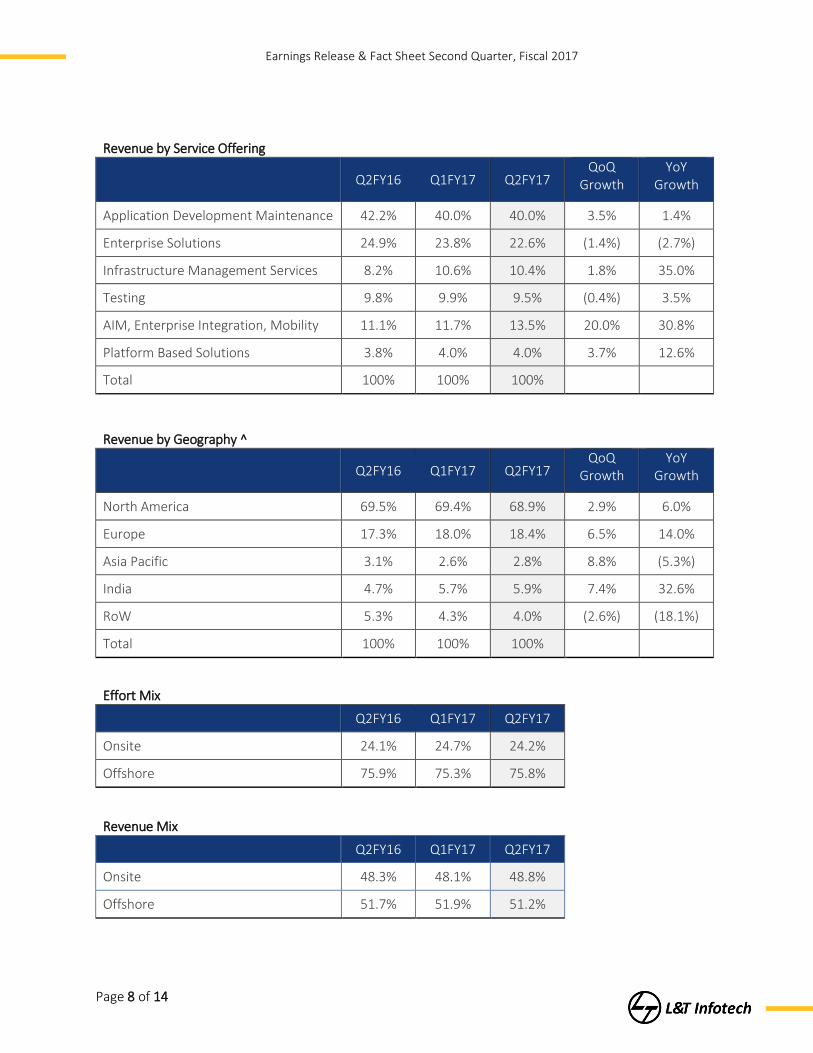
Revenue by Service Offering
Q2FY16 Q1FY17 Q2FY17 QoQ
Growth YoY
Growth
Application Development Maintenance 42.2% 40.0% 40.0% 3.5% 1.4%
Enterprise Solutions 24.9% 23.8% 22.6% (1.4%) (2.7%)
Infrastructure Management Services 8.2% 10.6% 10.4% 1.8% 35.0%
Testing 9.8% 9.9% 9.5% (0.4%) 3.5%
AIM, Enterprise Integration, Mobility 11.1% 11.7% 13.5% 20.0% 30.8%
Platform Based Solutions 3.8% 4.0% 4.0% 3.7% 12.6%
Total 100% 100% 100%
Revenue by Geography ^
Q2FY16 Q1FY17 Q2FY17 QoQ
Growth YoY
Growth
North America 69.5% 69.4% 68.9% 2.9% 6.0%
Europe 17.3% 18.0% 18.4% 6.5% 14.0%
Asia Pacific 3.1% 2.6% 2.8% 8.8% (5.3%)
India 4.7% 5.7% 5.9% 7.4% 32.6%
RoW 5.3% 4.3% 4.0% (2.6%) (18.1%)
Total 100% 100% 100%
Effort Mix
Q2FY16 Q1FY17 Q2FY17
Onsite 24.1% 24.7% 24.2%
Offshore 75.9% 75.3% 75.8%
Revenue Mix
Q2FY16 Q1FY17 Q2FY17
Onsite 48.3% 48.1% 48.8%
Offshore 51.7% 51.9% 51.2%
Earnings Release & Fact Sheet Second Quarter, Fiscal 2017
Page 9 of 14
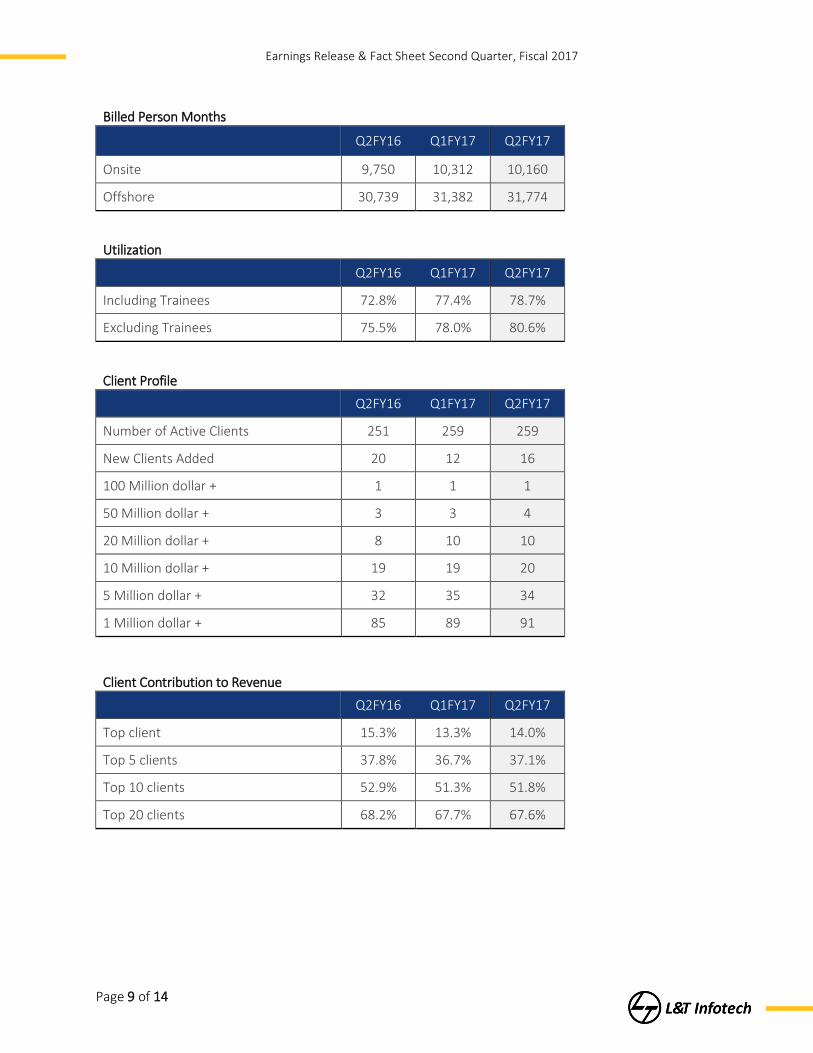
Billed Person Months
Q2FY16 Q1FY17 Q2FY17
Onsite 9,750 10,312 10,160
Offshore 30,739 31,382 31,774
Utilization
Q2FY16 Q1FY17 Q2FY17
Including Trainees 72.8% 77.4% 78.7%
Excluding Trainees 75.5% 78.0% 80.6%
Client Profile
Q2FY16 Q1FY17 Q2FY17
Number of Active Clients 251 259 259
New Clients Added 20 12 16
100 Million dollar + 1 1 1
50 Million dollar + 3 3 4
20 Million dollar + 8 10 10
10 Million dollar + 19 19 20
5 Million dollar + 32 35 34
1 Million dollar + 85 89 91
Client Contribution to Revenue
Q2FY16 Q1FY17 Q2FY17
Top client 15.3% 13.3% 14.0%
Top 5 clients 37.8% 36.7% 37.1%
Top 10 clients 52.9% 51.3% 51.8%
Top 20 clients 68.2% 67.7% 67.6%
Earnings Release & Fact Sheet Second Quarter, Fiscal 2017
Page 10 of 14
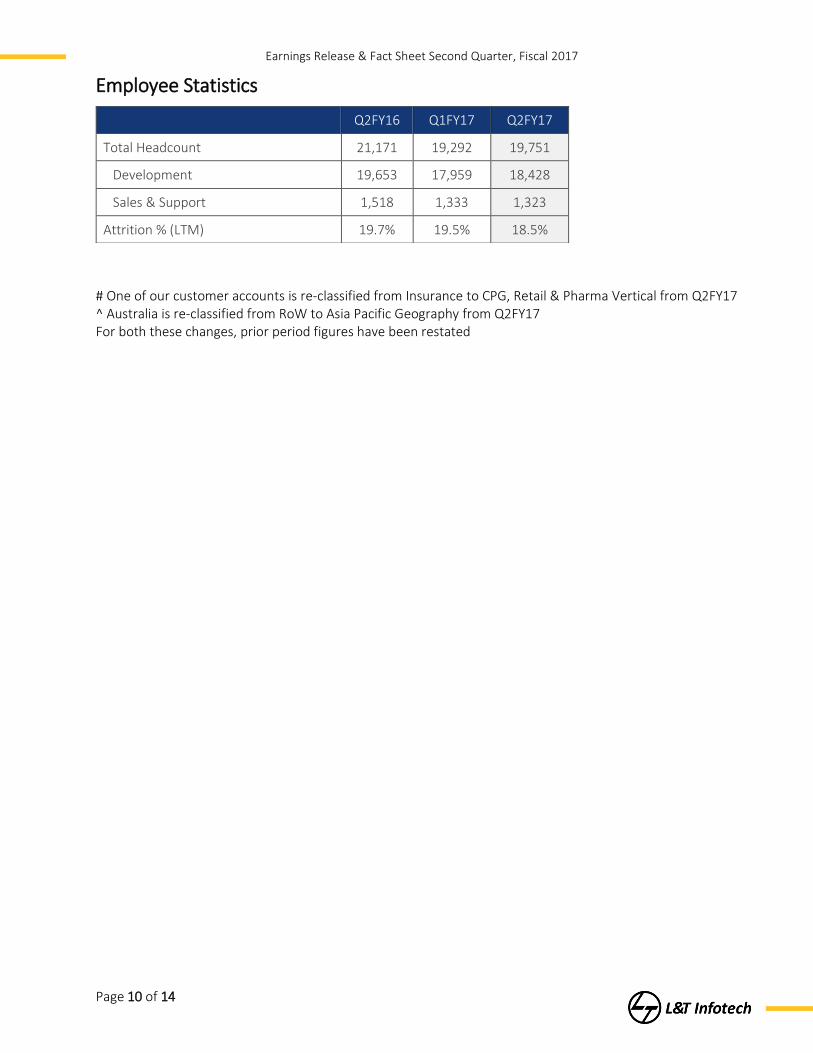
Employee Statistics
# One of our customer accounts is re-classified from Insurance to CPG, Retail & Pharma Vertical from Q2FY17 ^ Australia is re-classified from RoW to Asia Pacific Geography from Q2FY17 For both these changes, prior period figures have been restated
Q2FY16 Q1FY17 Q2FY17
Total Headcount 21,171 19,292 19,751
Development 19,653 17,959 18,428
Sales & Support 1,518 1,333 1,323
Attrition % (LTM) 19.7% 19.5% 18.5%
Earnings Release & Fact Sheet Second Quarter, Fiscal 2017
Page 11 of 14
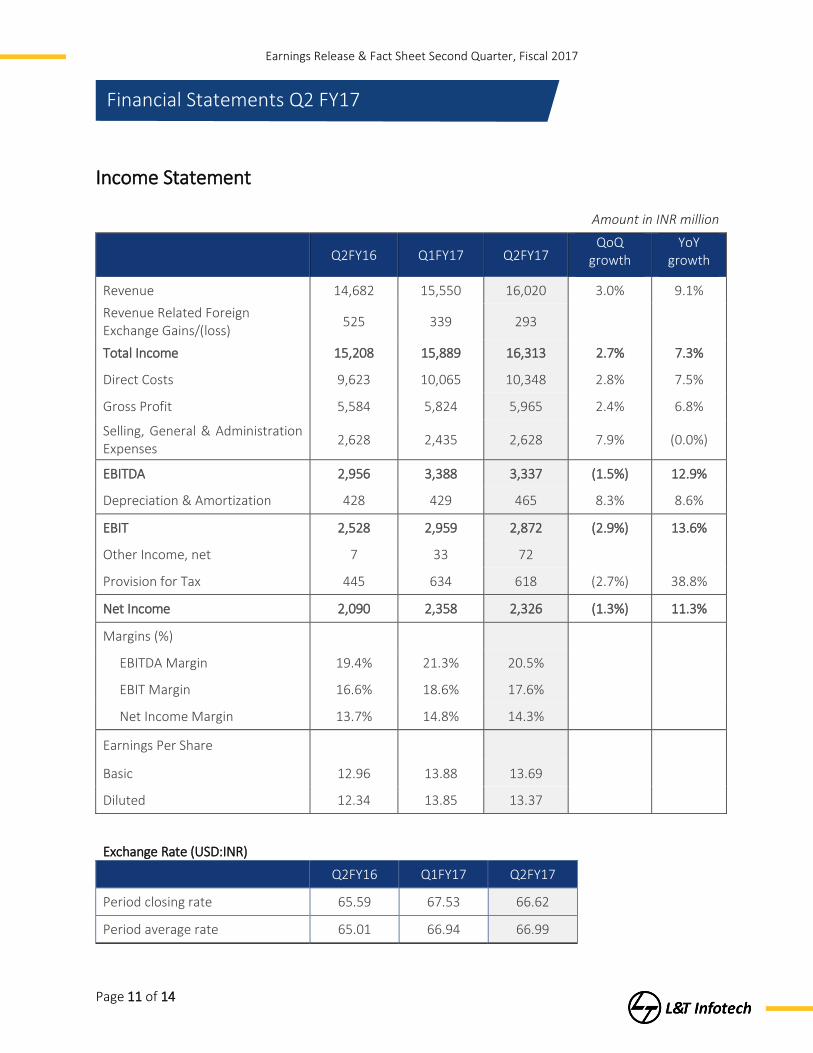
Income Statement
Amount in INR million
Q2FY16 Q1FY17 Q2FY17 QoQ
growth YoY
growth
Revenue 14,682 15,550 16,020 3.0% 9.1%
Revenue Related Foreign Exchange Gains/(loss)
525 339 293
Total Income 15,208 15,889 16,313 2.7% 7.3%
Direct Costs 9,623 10,065 10,348 2.8% 7.5%
Gross Profit 5,584 5,824 5,965 2.4% 6.8%
Selling, General & Administration Expenses
2,628 2,435 2,628 7.9% (0.0%)
EBITDA 2,956 3,388 3,337 (1.5%) 12.9%
Depreciation & Amortization 428 429 465 8.3% 8.6%
EBIT 2,528 2,959 2,872 (2.9%) 13.6%
Other Income, net 7 33 72
Provision for Tax 445 634 618 (2.7%) 38.8%
Net Income 2,090 2,358 2,326 (1.3%) 11.3%
Margins (%)
EBITDA Margin 19.4% 21.3% 20.5%
EBIT Margin 16.6% 18.6% 17.6%
Net Income Margin 13.7% 14.8% 14.3%
Earnings Per Share
Basic 12.96 13.88 13.69
Diluted 12.34 13.85 13.37
Exchange Rate (USD:INR)
Q2FY16 Q1FY17 Q2FY17
Period closing rate 65.59 67.53 66.62
Period average rate 65.01 66.94 66.99
Financial Statements Q2 FY17
Earnings Release & Fact Sheet Second Quarter, Fiscal 2017
Page 12 of 14
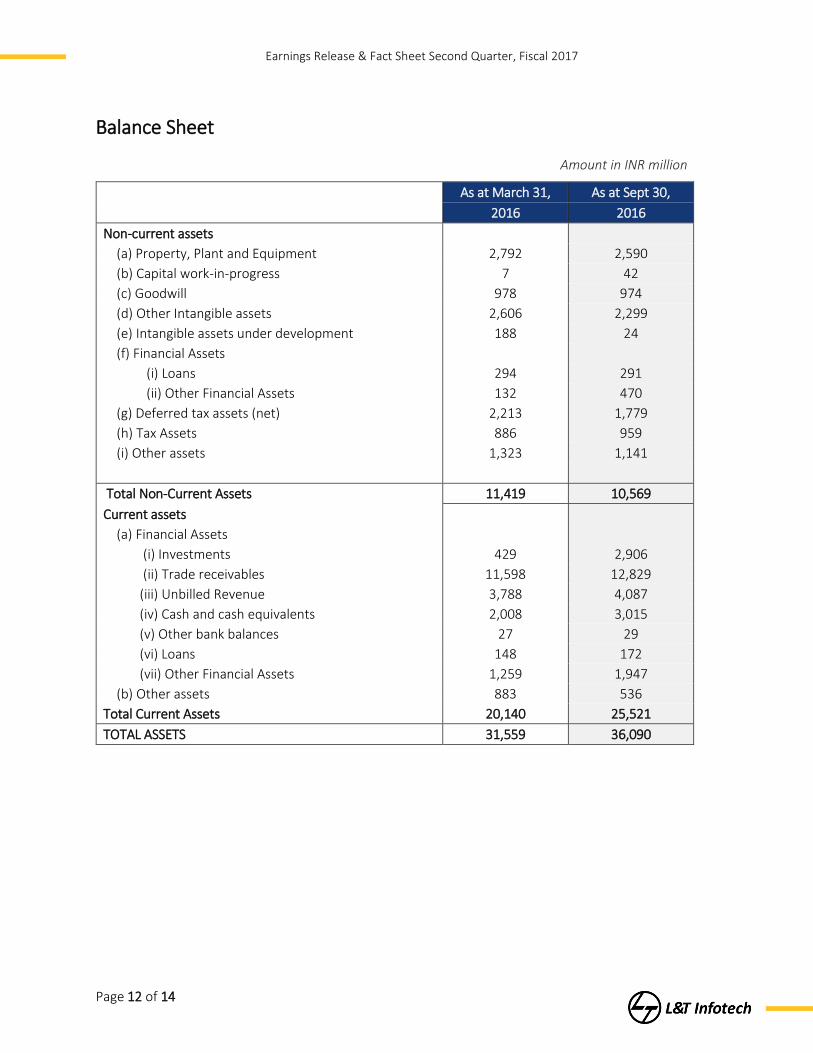
Balance Sheet
Amount in INR million
As at March 31, As at Sept 30,
2016 2016
Non-current assets
(a) Property, Plant and Equipment 2,792 2,590
(b) Capital work-in-progress 7 42
(c) Goodwill 978 974
(d) Other Intangible assets 2,606 2,299
(e) Intangible assets under development 188 24
(f) Financial Assets (i) Loans 294 291
(ii) Other Financial Assets 132 470
(g) Deferred tax assets (net) 2,213 1,779
(h) Tax Assets 886 959
(i) Other assets 1,323 1,141
Total Non-Current Assets 11,419 10,569
Current assets
(a) Financial Assets
(i) Investments 429 2,906
(ii) Trade receivables 11,598 12,829
(iii) Unbilled Revenue 3,788 4,087
(iv) Cash and cash equivalents 2,008 3,015
(v) Other bank balances 27 29
(vi) Loans 148 172
(vii) Other Financial Assets 1,259 1,947
(b) Other assets 883 536
Total Current Assets 20,140 25,521
TOTAL ASSETS 31,559 36,090
Earnings Release & Fact Sheet Second Quarter, Fiscal 2017
Page 13 of 14
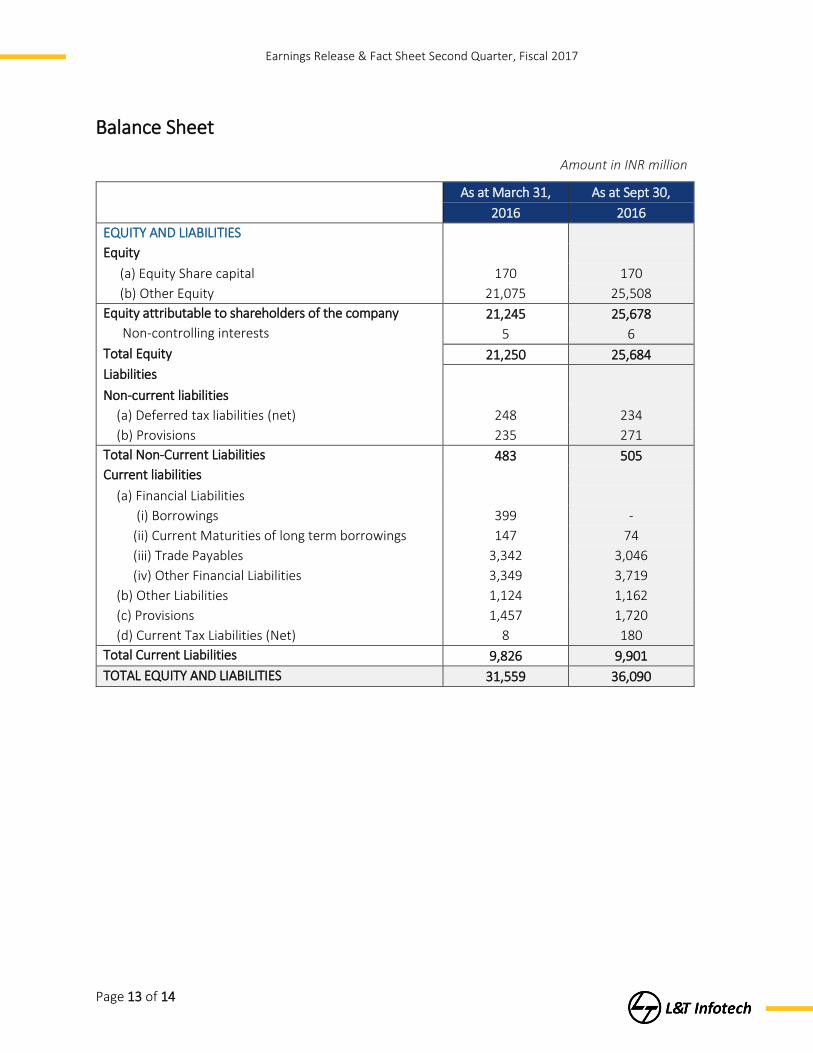
Balance Sheet
Amount in INR million
As at March 31, As at Sept 30,
2016 2016
EQUITY AND LIABILITIES
Equity
(a) Equity Share capital 170 170
(b) Other Equity 21,075 25,508
Equity attributable to shareholders of the company 21,245 25,678
Non-controlling interests 5 6
Total Equity 21,250 25,684
Liabilities
Non-current liabilities
(a) Deferred tax liabilities (net) 248 234
(b) Provisions 235 271
Total Non-Current Liabilities 483 505
Current liabilities
(a) Financial Liabilities
(i) Borrowings 399 -
(ii) Current Maturities of long term borrowings 147 74
(iii) Trade Payables 3,342 3,046
(iv) Other Financial Liabilities 3,349 3,719
(b) Other Liabilities 1,124 1,162
(c) Provisions 1,457 1,720
(d) Current Tax Liabilities (Net) 8 180
Total Current Liabilities 9,826 9,901
TOTAL EQUITY AND LIABILITIES 31,559 36,090
Earnings Release & Fact Sheet Second Quarter, Fiscal 2017
Page 14 of 14
Investor Relations: Nitin Mohta, Head – Investor Relations Tel: +91 22 6776 8146
Email: [email protected]
Registered Office:
L&T House, Ballard Estate,
Mumbai 400001, India
CIN: U72900MH1996PLC104693
http://www.lntinfotech.com
Annual Report Financial Year 2015-16
Contact Information