third quarter 2014 earnings
TRANSCRIPT

Third Quarter 2014 Earnings
October 30, 2014

2
Forward Looking Statements
This document contains “forward-looking statements” about our expected or potential future business
and financial performance. For us forward-looking statements include, but are not limited to,
statements about our future revenue and earnings guidance and other statements about future events
or conditions. Forward-looking statements are not guarantees of future performance and involve risks
and uncertainties that could cause actual results to differ materially from those projected. These risks
and uncertainties include, but are not limited to: mail volumes; the uncertain economic environment;
timely development, market acceptance and regulatory approvals, if needed, of new products;
fluctuations in customer demand; changes in postal regulations; interrupted use of key information
systems; management of outsourcing arrangements; the implementation of a new enterprise resource
planning system; changes in business portfolio; foreign currency exchange rates; changes in our
credit ratings; management of credit risk; changes in interest rates; the financial health of national
posts; and other factors beyond our control as more fully outlined in the Company's 2013 Form 10-K
Annual Report and other reports filed with the Securities and Exchange Commission. Pitney Bowes
assumes no obligation to update any forward-looking statements contained in this document as a
result of new information, events or developments.

3
Third Quarter 2014 Highlights
Total revenue growth of 2%
26% revenue growth in Digital Commerce Solutions
Adjusted EPS from continuing operations of $0.51;
GAAP EPS of $0.65
Increases 2014 guidance for adjusted EPS and
GAAP EPS from continuing operations

4
Third Quarter 2014 – Financial Highlights
Revenue of $942 million
Growth of 2% on a reported and constant currency basis
On a reported basis:
Digital Commerce Solutions revenue growth of 26%
Enterprise Solutions revenue growth of 2%
SMB Solutions revenue decline of 5%
As part of its go-to-market strategy, the Company exited non-core
product lines in Norway and transitioned from a direct sales model to a
dealer sales network for the International Mailing and Production Mail
segments in six smaller European markets.
For comparative purposes, total revenue would have grown 3% in
the third quarter when the results related to these operations are
excluded from the current and prior year.
5
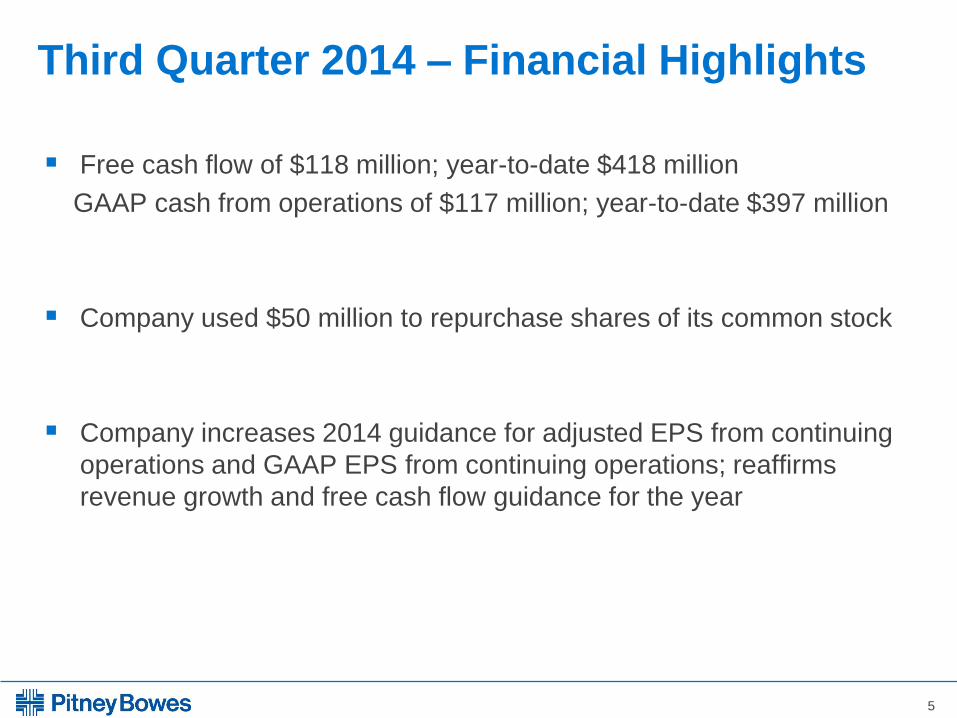
Free cash flow of $118 million; year-to-date $418 million
GAAP cash from operations of $117 million; year-to-date $397 million
Company used $50 million to repurchase shares of its common stock
Company increases 2014 guidance for adjusted EPS from continuing
operations and GAAP EPS from continuing operations; reaffirms
revenue growth and free cash flow guidance for the year
Third Quarter 2014 – Financial Highlights

6
1 The sum of the earnings per share may not equal the totals above due to rounding.
Earnings Per Share Reconciliation 1 Q3 2014 Q3 2013
Adjusted EPS from continuing operations $0.51 $0.47
Investment divestiture $0.05 -
Restructuring charges ($0.01) ($0.11)
GAAP EPS from continuing operations $0.55 $0.36
Discontinued operations – income (loss) $0.10 ($0.39)
GAAP EPS $0.65 ($0.03)
Third Quarter 2014 – Financial Highlights

7
Q3 2014 Q3 2013
Revenue, as reported ($ million) $942 $920
Adjusted EPS
from continuing operations $0.51 $0.47
GAAP EPS
from continuing operations $0.55 $0.36
GAAP EPS $0.65 ($0.03)
Adjusted EBIT ($ millions) 1 $172 $168
Adjusted EBIT Margin 18.3% 18.3%
Adjusted EBITDA
from continuing operations ($ millions) 1 $222 $219
SG&A ($ millions) $342 $352
SG&A: Revenue % 36.3% 38.3%
Free Cash Flow ($ millions) 1 $118 $208
GAAP Cash from Operations $117 $215
1 Reconciliation schedules of GAAP to Non-GAAP measures can be found in the appendix of this presentation
Third Quarter 2014 – Financial Highlights1

8
Pitney Bowes Inc – Q3 2014 Results ($ millions)
Total PBI Q3 2014 YOY Change Change Ex-
Currency
Revenue $942 2% 2%
Adjusted EBIT1 $172 2%
U.S., 73%
Outside U.S., 27%
Revenue by Geography
NA Mailing, 38.6%
Int'l Mailing, 14.0%
Production Mail, 12.1%
Presort Services,
11.8%
Digital Commerce
Solutions, 23.5%
Revenue by Segment
1 Reconciliation schedules of GAAP to Non-GAAP measures can be found in the appendix of this presentation

9
Business Segment Reporting
The Company’s business segment reporting reflects the clients served in each market and
the way it manages these segments. The reporting segment groups are: Small & Medium Business
(SMB) Solutions group; Enterprise Business Solutions group; and the Digital Commerce Solutions
segment.
The Small and Medium Business (SMB) Solutions group offers mailing equipment, financing,
services and supplies for small and medium businesses to efficiently create mail and evidence postage.
This group includes the North America Mailing and International Mailing segments. North America
Mailing includes the operations of U.S. and Canada Mailing. International Mailing includes all other SMB
operations around the world.
The Enterprise Business Solutions group provides mailing equipment and services for large
enterprise clients to process mail, including sortation services to qualify large mail volumes for postal
worksharing discounts. This group includes the global Production Mail and Presort Services segments.
The Digital Commerce Solutions segment leverages digital and mobile channels that make
the Company’s clients’ customer-facing functions more effective. This segment includes ecommerce,
software, shipping and marketing services.
10
Business Results - Q3 2014 ($ millions)
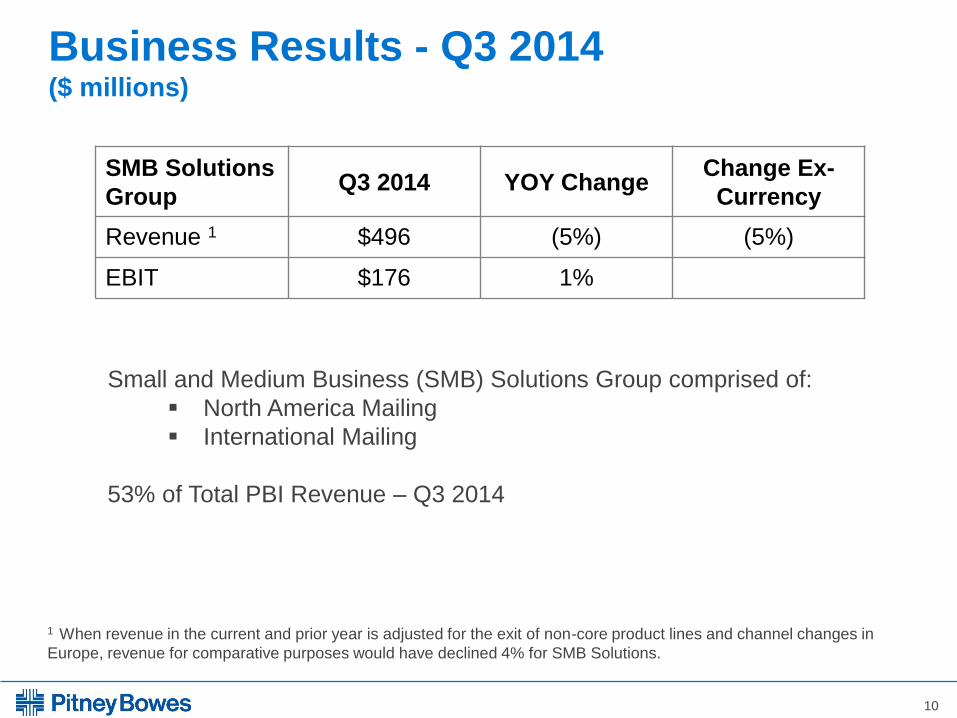
Small and Medium Business (SMB) Solutions Group comprised of:
North America Mailing
International Mailing
53% of Total PBI Revenue – Q3 2014
SMB Solutions
Group Q3 2014 YOY Change
Change Ex-
Currency
Revenue 1 $496 (5%) (5%)
EBIT $176 1%
1 When revenue in the current and prior year is adjusted for the exit of non-core product lines and channel changes in
Europe, revenue for comparative purposes would have declined 4% for SMB Solutions.

11
Business Results - Q3 2014 ($ millions)
Recurring revenue streams declined at a lesser rate than prior periods due to sustained growth in supplies revenue
and a further moderation in financing and rentals revenue.
Equipment sales declined as the Company continues to drive productivity improvements in its transition to expanded
inside sales and web channels.
EBIT margin increased due to on-going benefits from the go-to-market implementation and cost reduction initiatives.
Results reflect the actions related to the segment’s exit of non-core product lines and change in geographic coverage.
Excluding the revenue related to these actions in both the current and prior years, revenue on a comparative basis
would have declined 2%, which is in line with the Company’s stabilization objectives. The Company also continued to
shift additional client accounts to inside sales in the major European markets.
EBIT margin improved due to the changes in go-to-market, including the shift in strategy for smaller markets.
North America
Mailing Q3 2014 YOY Change
Change Ex-
Currency
Revenue $363 (5%) (4%)
EBIT $160 1%
International
Mailing Q3 2014 YOY Change
Change Ex-
Currency
Revenue $132 (6%) (8%)
EBIT $16 3%

12
Business Results - Q3 2014 ($ millions)
Enterprise Solutions Group comprised of:
Production Mail
Presort Services
24% of Total PBI Revenue – Q3 2014
Enterprise
Business
Solutions Group
Q3 2014 YOY Change Change Ex-
Currency
Revenue $225 2% 2%
EBIT $31 2%

13
Business Results - Q3 2014 ($ millions)
On a regional basis, revenues were relatively flat in North America and grew in Europe in large measure due to
increased production print installations.
Revenue declined in Asia Pacific due to fewer installations of inserting and production print equipment when
compared to prior year.
EBIT margin was impacted by the lower revenue and the related margin contribution.
Revenue benefited from improved qualification of mail for presort discounts, in particular in the processing of First
Class mail.
EBIT margin improved due to the revenue growth and on-going operational productivity.
Production
Mail Q3 2014 YOY Change
Change Ex-
Currency
Revenue $113 (3%) (2%)
EBIT $10 (10%)
Presort
Services Q3 2014 YOY Change
Change Ex-
Currency
Revenue $111 6% 6%
EBIT $22 7%
14
Business Results - Q3 2014 ($ millions)
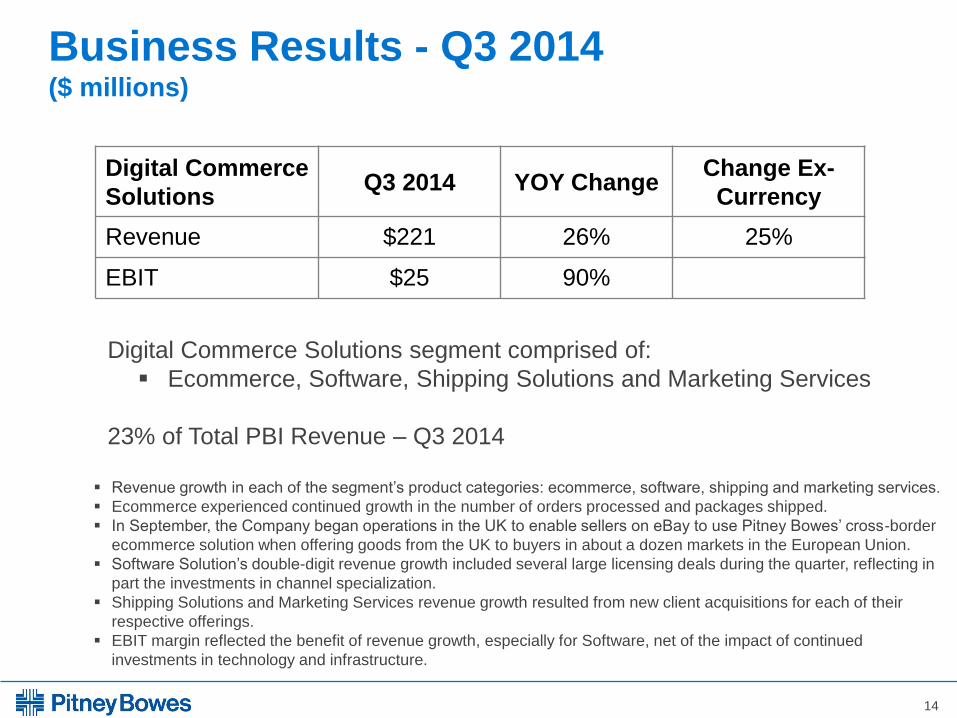
Digital Commerce Solutions segment comprised of:
Ecommerce, Software, Shipping Solutions and Marketing Services
23% of Total PBI Revenue – Q3 2014
Digital Commerce
Solutions Q3 2014 YOY Change
Change Ex-
Currency
Revenue $221 26% 25%
EBIT $25 90%
Revenue growth in each of the segment’s product categories: ecommerce, software, shipping and marketing services.
Ecommerce experienced continued growth in the number of orders processed and packages shipped.
In September, the Company began operations in the UK to enable sellers on eBay to use Pitney Bowes’ cross-border
ecommerce solution when offering goods from the UK to buyers in about a dozen markets in the European Union.
Software Solution’s double-digit revenue growth included several large licensing deals during the quarter, reflecting in
part the investments in channel specialization.
Shipping Solutions and Marketing Services revenue growth resulted from new client acquisitions for each of their
respective offerings.
EBIT margin reflected the benefit of revenue growth, especially for Software, net of the impact of continued
investments in technology and infrastructure.
15
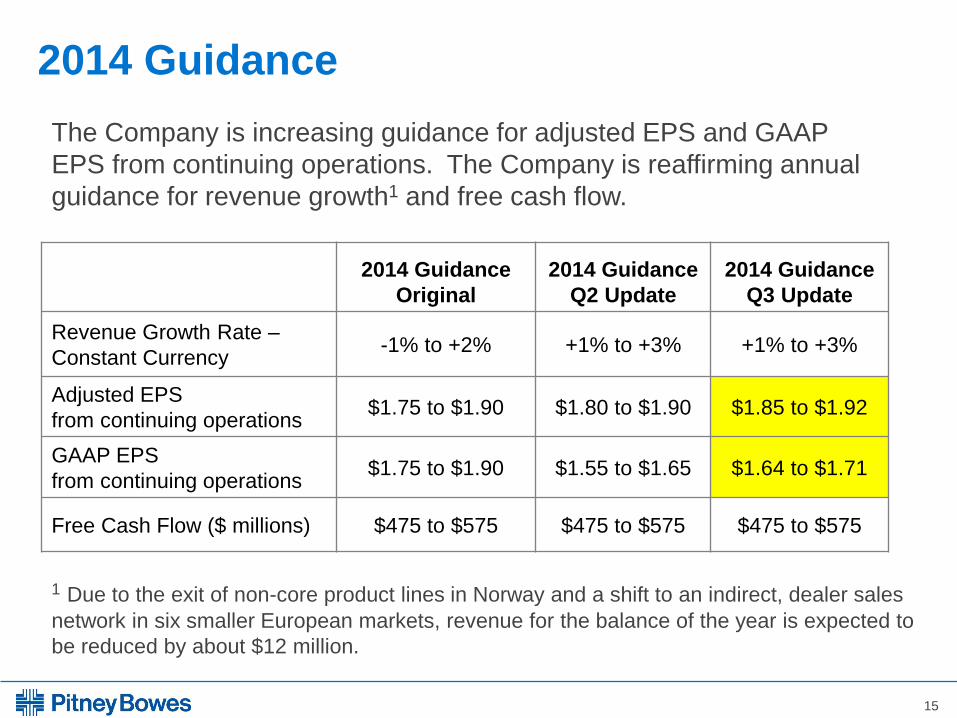
2014 Guidance
2014 Guidance
Original
2014 Guidance
Q2 Update
2014 Guidance
Q3 Update
Revenue Growth Rate –
Constant Currency -1% to +2% +1% to +3% +1% to +3%
Adjusted EPS
from continuing operations $1.75 to $1.90 $1.80 to $1.90 $1.85 to $1.92
GAAP EPS
from continuing operations $1.75 to $1.90 $1.55 to $1.65 $1.64 to $1.71
Free Cash Flow ($ millions) $475 to $575 $475 to $575 $475 to $575
The Company is increasing guidance for adjusted EPS and GAAP
EPS from continuing operations. The Company is reaffirming annual
guidance for revenue growth1 and free cash flow.
1 Due to the exit of non-core product lines in Norway and a shift to an indirect, dealer sales
network in six smaller European markets, revenue for the balance of the year is expected to
be reduced by about $12 million.
16
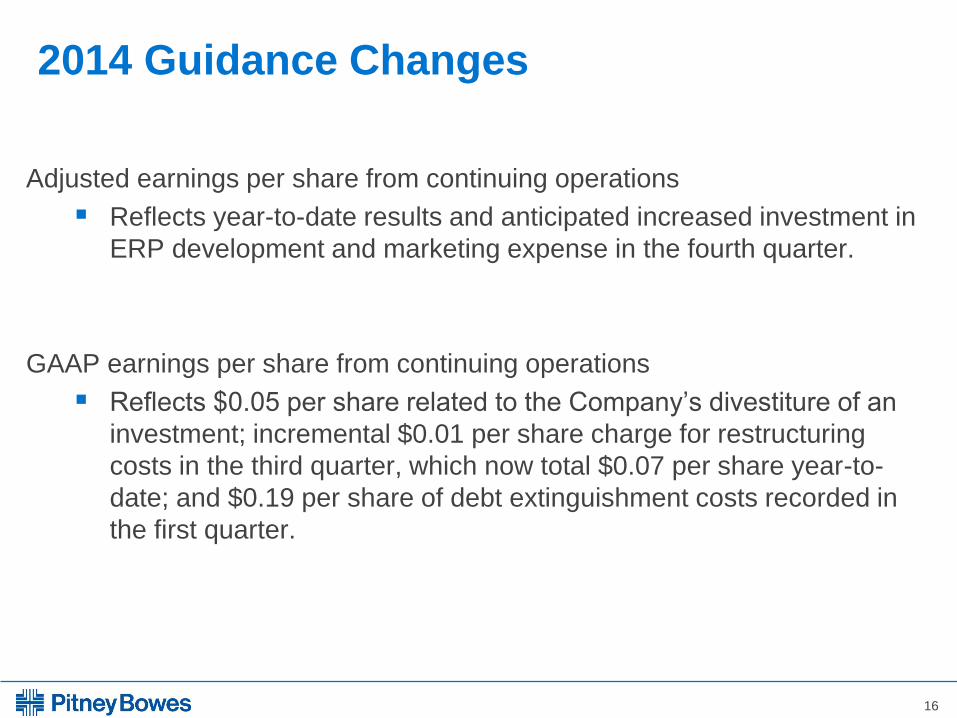
2014 Guidance Changes
Adjusted earnings per share from continuing operations
Reflects year-to-date results and anticipated increased investment in
ERP development and marketing expense in the fourth quarter.
GAAP earnings per share from continuing operations
Reflects $0.05 per share related to the Company’s divestiture of an
investment; incremental $0.01 per share charge for restructuring
costs in the third quarter, which now total $0.07 per share year-to-
date; and $0.19 per share of debt extinguishment costs recorded in
the first quarter.

Appendix
18
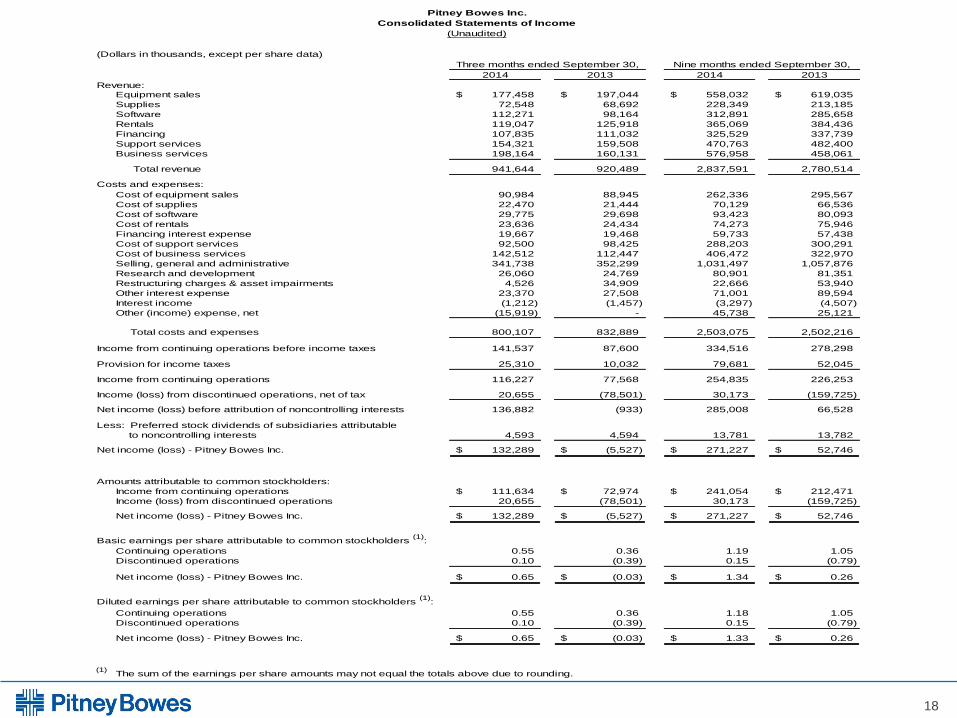
(Dollars in thousands, except per share data)
2014 2013 2014 2013
Revenue:
Equipment sales 177,458$ 197,044$ 558,032$ 619,035$
Supplies 72,548 68,692 228,349 213,185
Software 112,271 98,164 312,891 285,658
Rentals 119,047 125,918 365,069 384,436
Financing 107,835 111,032 325,529 337,739
Support services 154,321 159,508 470,763 482,400
Business services 198,164 160,131 576,958 458,061
Total revenue 941,644 920,489 2,837,591 2,780,514
Costs and expenses:
Cost of equipment sales 90,984 88,945 262,336 295,567
Cost of supplies 22,470 21,444 70,129 66,536
Cost of software 29,775 29,698 93,423 80,093
Cost of rentals 23,636 24,434 74,273 75,946
Financing interest expense 19,667 19,468 59,733 57,438
Cost of support services 92,500 98,425 288,203 300,291
Cost of business services 142,512 112,447 406,472 322,970
Selling, general and administrative 341,738 352,299 1,031,497 1,057,876
Research and development 26,060 24,769 80,901 81,351
Restructuring charges & asset impairments 4,526 34,909 22,666 53,940
Other interest expense 23,370 27,508 71,001 89,594
Interest income (1,212) (1,457) (3,297) (4,507)
Other (income) expense, net (15,919) - 45,738 25,121
Total costs and expenses 800,107 832,889 2,503,075 2,502,216
Income from continuing operations before income taxes 141,537 87,600 334,516 278,298
Provision for income taxes 25,310 10,032 79,681 52,045
Income from continuing operations 116,227 77,568 254,835 226,253
Income (loss) from discontinued operations, net of tax 20,655 (78,501) 30,173 (159,725)
Net income (loss) before attribution of noncontrolling interests 136,882 (933) 285,008 66,528
Less: Preferred stock dividends of subsidiaries attributable
to noncontrolling interests 4,593 4,594 13,781 13,782
Net income (loss) - Pitney Bowes Inc. 132,289$ (5,527)$ 271,227$ 52,746$
Amounts attributable to common stockholders:
Income from continuing operations 111,634$ 72,974$ 241,054$ 212,471$
Income (loss) from discontinued operations 20,655 (78,501) 30,173 (159,725)
Net income (loss) - Pitney Bowes Inc. 132,289$ (5,527)$ 271,227$ 52,746$
Basic earnings per share attributable to common stockholders (1)
:
Continuing operations 0.55 0.36 1.19 1.05
Discontinued operations 0.10 (0.39) 0.15 (0.79)
Net income (loss) - Pitney Bowes Inc. 0.65$ (0.03)$ 1.34$ 0.26$
Diluted earnings per share attributable to common stockholders (1)
:
Continuing operations 0.55 0.36 1.18 1.05
Discontinued operations 0.10 (0.39) 0.15 (0.79)
Net income (loss) - Pitney Bowes Inc. 0.65$ (0.03)$ 1.33$ 0.26$
(1)The sum of the earnings per share amounts may not equal the totals above due to rounding.
Pitney Bowes Inc.
Consolidated Statements of Income
(Unaudited)
Three months ended September 30, Nine months ended September 30,

19
Assets
September 30,
2014
December 31,
2013 (1)
Current assets:
Cash and cash equivalents 923,676$ 907,806$
Short-term investments 35,348 31,128
Accounts receivable, gross 412,702 482,949
Allowance for doubtful accounts receivable (13,651) (13,149)
Accounts receivable, net 399,051 469,800
Finance receivables 1,040,156 1,127,261
Allowance for credit losses (21,914) (24,340)
Finance receivables, net 1,018,242 1,102,921
Inventories 94,879 103,580
Current income taxes 29,815 28,934
Other current assets and prepayments 135,973 147,067
Assets held for sale 55,118 46,976
Total current assets 2,692,102 2,838,212
Property, plant and equipment, net 266,520 245,171
Rental property and equipment, net 206,394 226,146
Finance receivables 839,912 974,972
Allowance for credit losses (9,323) (12,609)
Finance receivables, net 830,589 962,363
Investment in leveraged leases 32,465 34,410
Goodwill 1,694,987 1,734,871
Intangible assets, net 91,797 120,387
Non-current income taxes 65,092 73,751
Other assets 544,091 537,397
Total assets 6,424,037$ 6,772,708$
Liabilities, noncontrolling interests and stockholders' equity
Current liabilities:
Accounts payable and accrued liabilities 1,428,690$ 1,644,582$
Current income taxes 153,809 157,340
Notes payable and current portion of long-term obligations 274,879 -
Advance billings 399,016 425,833
Total current liabilities 2,256,394 2,227,755
Deferred taxes on income 57,830 39,701
Tax uncertainties and other income tax liabilities 148,119 190,645
Long-term debt 2,962,997 3,346,295
Other non-current liabilities 423,981 466,766
Total liabilities 5,849,321 6,271,162
Noncontrolling interests (Preferred stockholders' equity in subsidiaries) 296,370 296,370
Stockholders' equity:
Cumulative preferred stock, $50 par value, 4% convertible 1 4
Cumulative preference stock, no par value, $2.12 convertible 559 591
Common stock, $1 par value 323,338 323,338
Additional paid-in-capital 174,783 196,977
Retained earnings 4,872,875 4,715,564
Accumulated other comprehensive loss (614,741) (574,556)
Treasury stock, at cost (4,478,469) (4,456,742)
Total Pitney Bowes Inc. stockholders' equity 278,346 205,176
Total liabilities, noncontrolling interests and stockholders' equity 6,424,037$ 6,772,708$
(1) Certain prior year amounts have been revised.
Pitney Bowes Inc.
Consolidated Balance Sheets
(Unaudited in thousands, except per share data)

20
(Dollars in thousands)
%
2014 2013 Change
Revenue
North America Mailing 363,285$ 381,685$ (5%)
International Mailing 132,291 141,332 (6%)
Small & Medium Business Solutions 495,576 523,017 (5%)
Production Mail 113,497 116,477 (3%)
Presort Services 111,434 105,093 6%
Enterprise Business Solutions 224,931 221,570 2%
Digital Commerce Solutions 221,137 175,902 26%
Total revenue 941,644$ 920,489$ 2%
EBIT (1)
North America Mailing 159,638$ 158,692$ 1%
International Mailing 16,079 15,627 3%
Small & Medium Business Solutions 175,717 174,319 1%
Production Mail 9,570 10,620 (10%)
Presort Services 21,927 20,398 7%
Enterprise Business Solutions 31,497 31,018 2%
Digital Commerce Solutions 24,534 12,885 90%
Total EBIT 231,748$ 218,222$ 6%
Unallocated amounts:
Interest, net (2) (41,825) (45,519)
Corporate and other expenses (59,779) (50,194)
Restructuring charges & asset impairments (4,526) (34,909)
Other income, net 15,919 -
Income from continuing operations before income taxes 141,537$ 87,600$
(1)
(2)
Three Months Ended September 30,
Earnings before interest and taxes (EBIT) excludes general corporate expenses and restructuring charges & asset impairments.
Interest, net includes financing interest expense, other interest expense and interest income.
Pitney Bowes Inc.
Revenue and EBIT
Business Segments
September 30, 2014
(Unaudited)

21
(Dollars in thousands)
%
2014 2013 Change
Revenue
North America Mailing 1,115,507$ 1,162,718$ (4%)
International Mailing 438,819 444,665 (1%)
Small & Medium Business Solutions 1,554,326 1,607,383 (3%)
Production Mail 330,469 360,352 (8%)
Presort Services 339,205 322,954 5%
Enterprise Business Solutions 669,674 683,306 (2%)
Digital Commerce Solutions 613,591 489,825 25%
Total revenue 2,837,591$ 2,780,514$ 2%
EBIT (1)
North America Mailing 476,757$ 464,668$ 3%
International Mailing 67,347 53,092 27%
Small & Medium Business Solutions 544,104 517,760 5%
Production Mail 27,865 34,239 (19%)
Presort Services 68,235 65,132 5%
Enterprise Business Solutions 96,100 99,371 (3%)
Digital Commerce Solutions 51,994 27,969 86%
Total EBIT 692,198$ 645,100$ 7%
Unallocated amounts:
Interest, net (2) (127,437) (142,525)
Corporate and other expenses (161,841) (145,216)
Restructuring charges & asset impairments (22,666) (53,940)
Other expense, net (45,738) (25,121)
Income from continuing operations before income taxes 334,516$ 278,298$
(1)
(2)
Nine Months Ended September 30,
Earnings before interest and taxes (EBIT) excludes general corporate expenses and restructuring charges & asset impairments.
Interest, net includes financing interest expense, other interest expense and interest income.
Pitney Bowes Inc.
Revenue and EBIT
Business Segments
September 30, 2014
(Unaudited)

22
2014 2013 2014 2013
GAAP income from continuing operations
after income taxes, as reported 111,634$ 72,974$ 241,054$ 212,471$
Restructuring charges & asset impairments 2,903 22,536 15,161 35,662
Extinguishment of debt - - 37,833 15,324
Investment divestiture (9,774) - (9,774) -
Income from continuing operations
after income taxes, as adjusted 104,763$ 95,510$ 284,274$ 263,457$
GAAP diluted earnings per share from
continuing operations, as reported 0.55$ 0.36$ 1.18$ 1.05$
Restructuring charges & asset impairments 0.01 0.11 0.07 0.18
Extinguishment of debt - - 0.19 0.08
Investment divestiture (0.05) - (0.05) -
Diluted earnings per share from continuing
operations, as adjusted 0.51$ 0.47$ 1.39$ 1.30$
GAAP net cash provided by operating activities,
as reported 116,985$ 214,526$ 397,432$ 493,560$
Capital expenditures (48,920) (29,951) (121,270) (103,392)
Restructuring payments 8,621 14,098 42,151 41,353
Payments related to investment divestiture 53,738 - 53,738 -
Reserve account deposits (12,563) 9,227 (15,919) (16,962)
Extinguishment of debt - - 61,657 25,121
Free cash flow, as adjusted 117,861$ 207,900$ 417,789$ 439,680$
Note: The sum of the earnings per share amounts may not equal the totals above due to rounding.
Pitney Bowes Inc.
Reconciliation of Reported Consolidated Results to Adjusted Results
(Unaudited)
(Dollars in thousands, except per share data)
Three Months Ended September 30, Nine Months Ended September 30,

23
Pitney Bowes Inc.
Reconciliation of Reported Consolidated Results to Adjusted Results
(Unaudited)
2014 2013 2014 2013
GAAP income from continuing operations
after income taxes, as reported 111,634$ 72,974$ 241,054$ 212,471$
Restructuring charges & asset impairments 2,903 22,536 15,161 35,662
Extinguishment of debt - - 37,833 15,324
Investment divestiture (9,774) - (9,774) -
Income from continuing operations
after income taxes, as adjusted 104,763 95,510 284,274 263,457
Provision for income taxes, as adjusted 20,788 22,405 104,865 80,120
Preferred stock dividends of subsidiaries
attributable to noncontrolling interests 4,593 4,594 13,781 13,782
Income from continuing operations before income taxes, as adjusted 130,144 122,509 402,920 357,359
Interest, net 41,825 45,519 127,437 142,525
Adjusted EBIT 171,969 168,028 530,357 499,884
Depreciation and amortization 49,643 50,679 142,506 153,878
Adjusted EBITDA 221,612$ 218,707$ 672,863$ 653,762$
(Dollars in thousands, except per share data)
Three Months Ended September 30, Nine Months Ended September 30,
24
The Company's financial results are reported in accordance with generally accepted accounting
principles (GAAP). The Company uses measures such as adjusted earnings per share, adjusted
income from continuing operations and free cash flow to exclude the impact of special items like
restructuring charges, tax adjustments, and goodwill and asset write-downs, because, while these are
actual Company expenses, they can mask underlying trends associated with its business. Such items
are often inconsistent in amount and frequency and as such, the adjustments allow an investor greater
insight into the current underlying operating trends of the business.
The use of free cash flow provides investors insight into the amount of cash that management could
have available for other discretionary uses. It adjusts GAAP cash from operations for capital
expenditures, as well as special items like cash used for restructuring charges, unusual tax
settlements or payments and contributions to its pension funds. Management uses segment EBIT to
measure profitability and performance at the segment level. EBIT is determined by deducting the
related costs and expenses attributable to the segment. Segment EBIT excludes interest, taxes,
general corporate expenses not allocated to a particular business segment, restructuring charges and
goodwill and asset impairments, which are recognized on a consolidated basis. In addition, financial
results are presented on a constant currency basis to exclude the impact of changes in foreign
currency exchange rates since the prior period under comparison. Constant currency measures are
intended to help investors better understand the underlying operational performance of the business
excluding the impacts of shifts in currency exchange rates over the intervening period.