third quarter 2009 earnings call
TRANSCRIPT
© 2009-2010 Fidelity National Information Services, Inc. and its subsidiaries.
Third Quarter 2009 Earnings CallSupplemental MaterialsOctober 21, 2009
© 2009-2010 Fidelity National Information Services, Inc. and its subsidiaries.
2
Forward Looking Statements
This presentation contains statements related to FIS’ future plans and expectations, and, as such, constitutes “forward-looking statements” within the meaning of the Private Securities Litigation Reform Act of 1995, Section 27A of the Securities Act of 1933, as amended, and Section 21E of the Securities Exchange Act of 1934, as amended. Statements that are not historical facts, including statements about our beliefs and expectations, are forward-looking statements. Forward-looking statements are based on management’s beliefs, as well as assumptions made by, and information currently available to, management. Because such statements are based on expectations as to future economic performance and are not statements of fact, actual results may differ materially from those projected. The risks and uncertainties that forward-looking statements are subject to include, without limitation: changes in general economic, business and political conditions, including changes in the financial markets; the effect of governmental regulations; the effects of our substantial leverage which may limit the funds available to make acquisitions and invest in our business; the risks of reduction in revenue from the elimination of existing and potential customers due to consolidation in the banking, retail and financial services industries or due to financial failures suffered by firms in those industries; failures to adapt our services to changes in technology or in the marketplace; the failure to achieve some or all of the benefits that we expect from the acquisition of Metavante, including the possibility that our acquisition of Metavante may not be accretive to our earnings due to undisclosed liabilities, management or integration issues, loss of customers, the inability to achieve targeted cost savings, or other factors; our potential inability to find suitable acquisition candidates or difficulties in integrating acquisitions; competitive pressures on product pricing and services; and other risks detailed in the “Statement Regarding Forward-Looking Information,” “Risk Factors” and other sections of the Company’s Form 10-K and other filings with the Securities and Exchange Commission (“SEC”) that are available on the SEC’s web site located at www.sec.gov. All forward-looking statements included in this document are based on information available at the time of the document. FIS assumes no obligation to update any forward-looking statement.
© 2009-2010 Fidelity National Information Services, Inc. and its subsidiaries.
3
Use of Non-GAAP Measures
Generally Accepted Accounting Principles (GAAP) is the term used to refer to the standard framework of guidelines for financial accounting. GAAP includes the standards, conventions, and rules accountants follow in recording and summarizing transactions, and in the preparation of financial statements. In addition to reporting financial results in accordance with GAAP, the company has provided non-GAAP financial measures which it believes are useful to help investors better understand its financial performance, competitive position and prospects for the future. These non-GAAP measures include earnings before interest, taxes and depreciation and amortization (EBITDA), adjusted net earnings, and free cash flow. Adjusted EBITDA excludes the impact of merger and acquisition and integration expenses, LPS spin-off related costs, certain stock compensation charges and certain other costs. Adjusted net earnings exclude the after-tax impact of merger and acquisition and integration expenses, LPS spin-off related costs, certain stock compensation charges, acquisition related amortization and certain other costs. Any non-GAAP measures should be considered in context with the GAAP financial presentation and should not be considered in isolation or as a substitute for GAAP net earnings. Further, FIS’s non-GAAP measures may be calculated differently from similarly-titled measures of other companies. A reconciliation of these non-GAAP measures to related GAAP measures is included in the press release attachments.
© 2009-2010 Fidelity National Information Services, Inc. and its subsidiaries.
4
FIS Third Quarter 2009Earnings Conference Call Agenda
•Results Summary and Business Overview
•Financial Review
•Q&A
© 2009-2010 Fidelity National Information Services, Inc. and its subsidiaries.
5
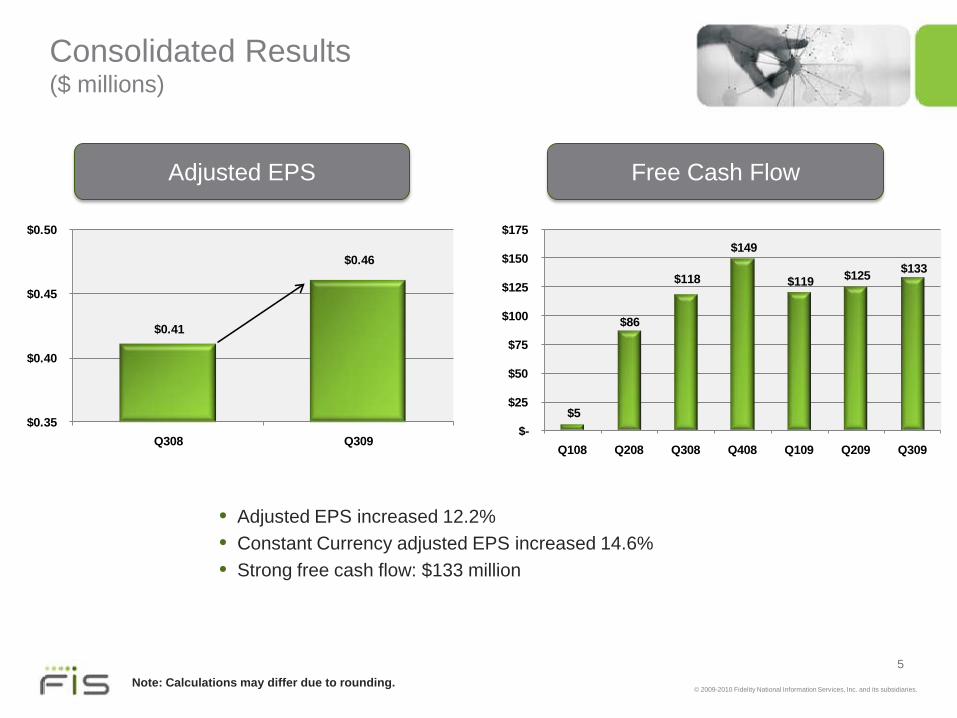
Consolidated Results($ millions)
• Adjusted EPS increased 12.2%• Constant Currency adjusted EPS increased 14.6%• Strong free cash flow: $133 million
$0.41
$0.46
$0.35
$0.40
$0.45
$0.50
Q308 Q309
$5
$86
$118
$149
$119 $125 $133
$-
$25
$50
$75
$100
$125
$150
$175
Q108 Q208 Q308 Q408 Q109 Q209 Q309
Adjusted EPS Free Cash Flow
Note: Calculations may differ due to rounding.
© 2009-2010 Fidelity National Information Services, Inc. and its subsidiaries.
6
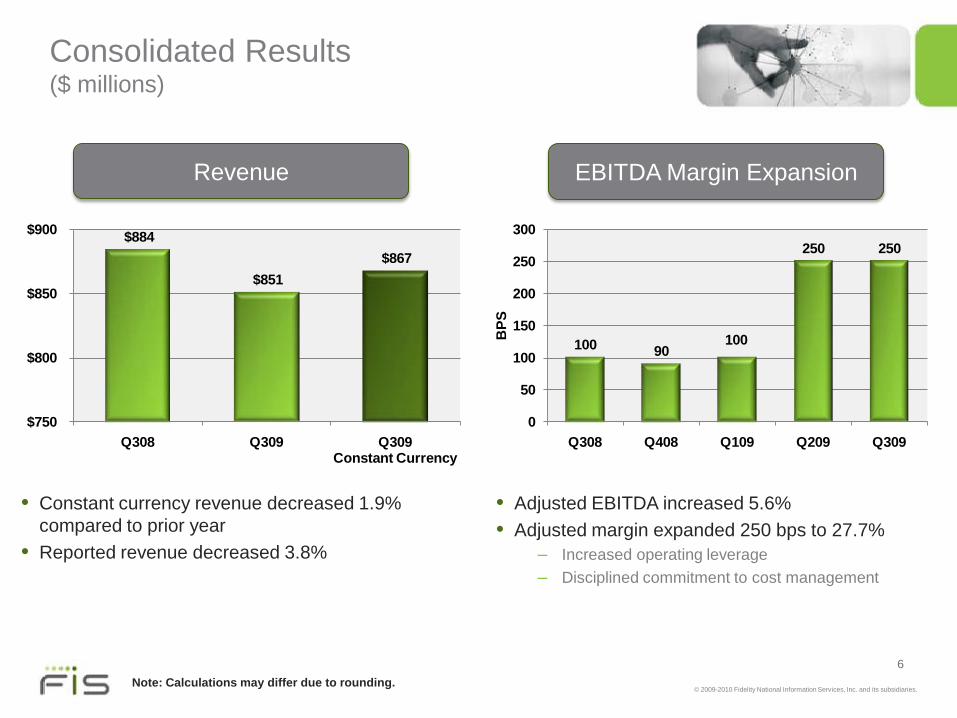
Consolidated Results($ millions)
• Constant currency revenue decreased 1.9% compared to prior year
• Reported revenue decreased 3.8%
• Adjusted EBITDA increased 5.6%• Adjusted margin expanded 250 bps to 27.7%
– Increased operating leverage– Disciplined commitment to cost management
Revenue EBITDA Margin Expansion
$884
$851 $867
$750
$800
$850
$900
Q308 Q309 Q309 Constant Currency
100 90100
250 250
0
50
100
150
200
250
300
Q308 Q408 Q109 Q209 Q309
BPS
Note: Calculations may differ due to rounding.

© 2009-2010 Fidelity National Information Services, Inc. and its subsidiaries.
7
Financial Review
© 2009-2010 Fidelity National Information Services, Inc. and its subsidiaries.
8
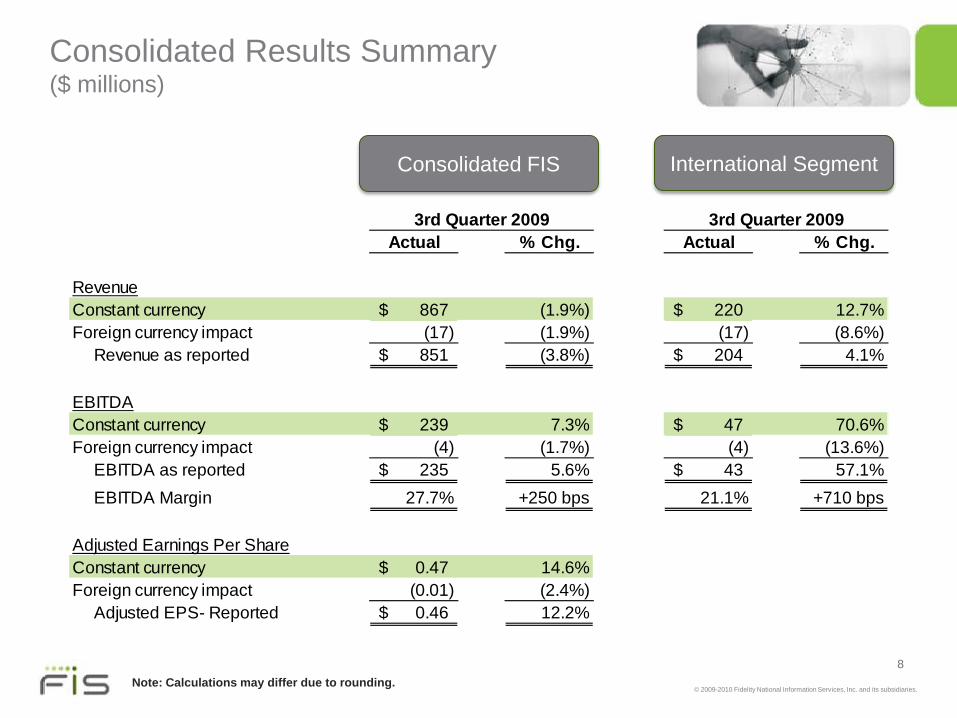
Consolidated Results Summary($ millions)
3rd Quarter 2009 3rd Quarter 2009Actual % Chg. Actual % Chg.
RevenueConstant currency 867$ (1.9%) 220$ 12.7%Foreign currency impact (17) (1.9%) (17) (8.6%) Revenue as reported 851$ (3.8%) 204$ 4.1%
EBITDAConstant currency 239$ 7.3% 47$ 70.6%Foreign currency impact (4) (1.7%) (4) (13.6%) EBITDA as reported 235$ 5.6% 43$ 57.1% EBITDA Margin 27.7% +250 bps 21.1% +710 bps
Adjusted Earnings Per ShareConstant currency 0.47$ 14.6%Foreign currency impact (0.01) (2.4%) Adjusted EPS- Reported 0.46$ 12.2%
Consolidated FIS International Segment
Note: Calculations may differ due to rounding.
© 2009-2010 Fidelity National Information Services, Inc. and its subsidiaries.
9
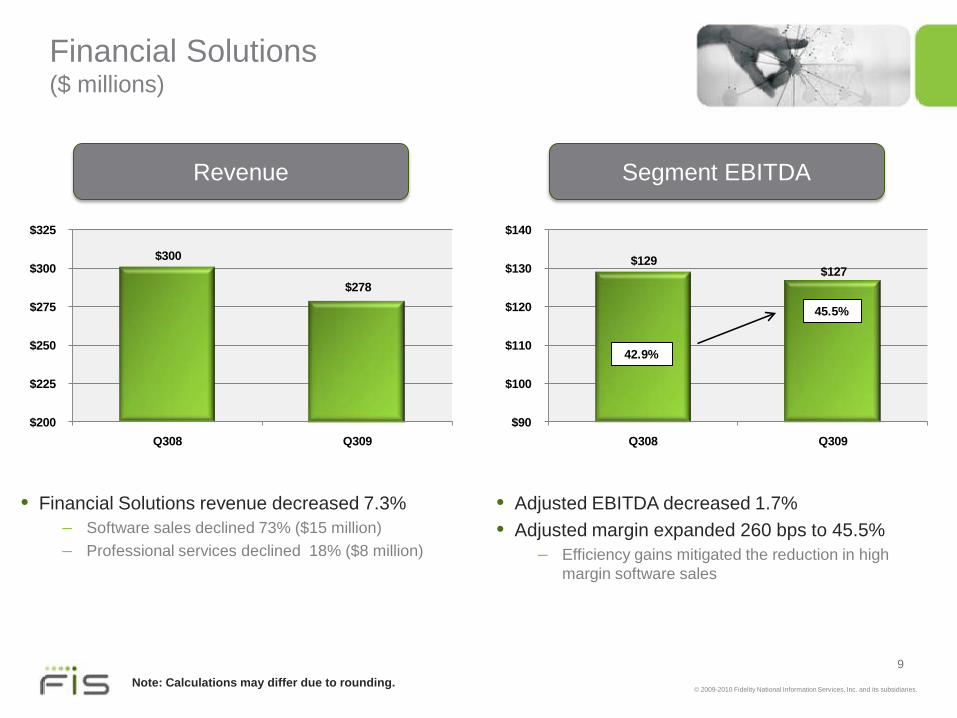
Financial Solutions($ millions)
• Financial Solutions revenue decreased 7.3%– Software sales declined 73% ($15 million)– Professional services declined 18% ($8 million)
• Adjusted EBITDA decreased 1.7%• Adjusted margin expanded 260 bps to 45.5%
– Efficiency gains mitigated the reduction in high margin software sales
Revenue Segment EBITDA
$300
$278
$200
$225
$250
$275
$300
$325
Q308 Q309
$129 $127
$90
$100
$110
$120
$130
$140
Q308 Q309
42.9%
45.5%
Note: Calculations may differ due to rounding.
© 2009-2010 Fidelity National Information Services, Inc. and its subsidiaries.
10
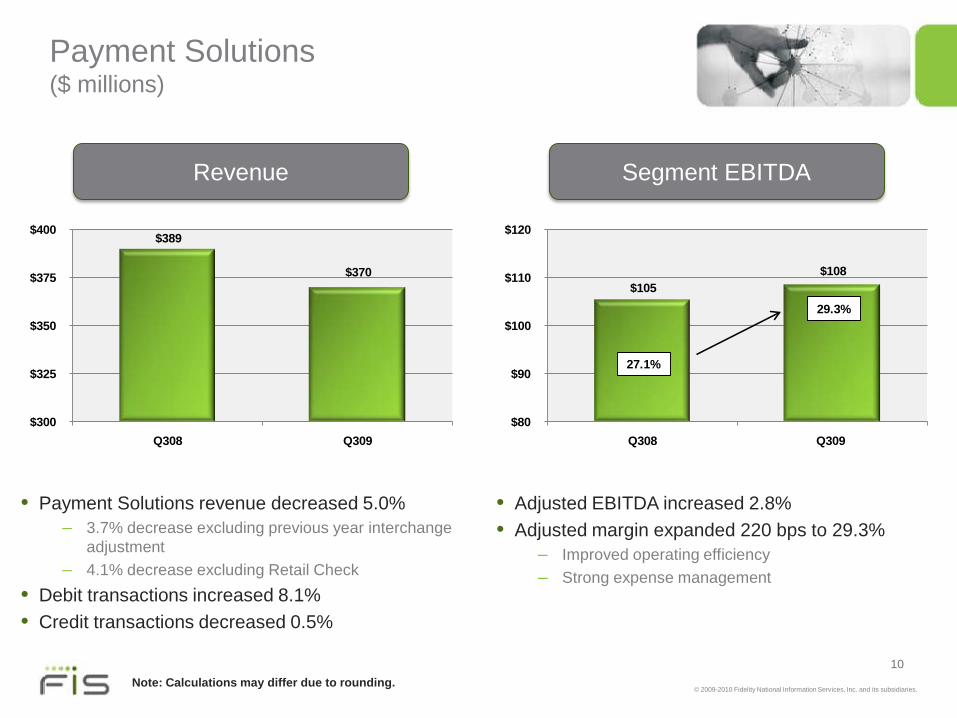
Payment Solutions($ millions)
• Payment Solutions revenue decreased 5.0%– 3.7% decrease excluding previous year interchange
adjustment – 4.1% decrease excluding Retail Check
• Debit transactions increased 8.1%• Credit transactions decreased 0.5%
• Adjusted EBITDA increased 2.8%• Adjusted margin expanded 220 bps to 29.3%
– Improved operating efficiency– Strong expense management
Revenue Segment EBITDA
$389
$370
$300
$325
$350
$375
$400
Q308 Q309
$105 $108
$80
$90
$100
$110
$120
Q308 Q309
27.1%
29.3%
Note: Calculations may differ due to rounding.
© 2009-2010 Fidelity National Information Services, Inc. and its subsidiaries.
11
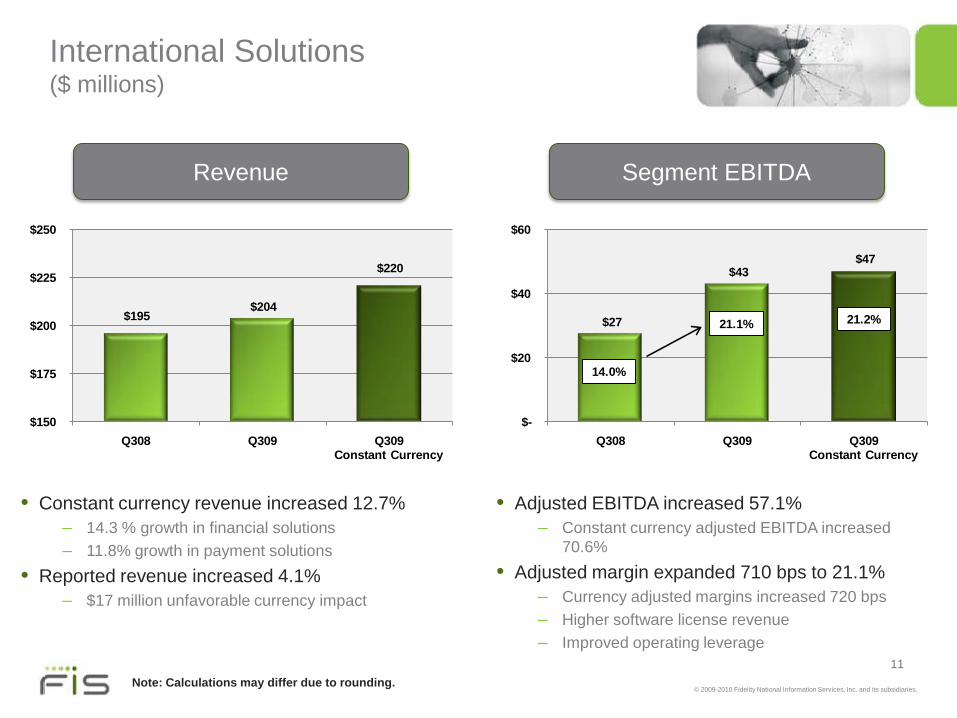
International Solutions($ millions)
• Constant currency revenue increased 12.7%– 14.3 % growth in financial solutions– 11.8% growth in payment solutions
• Reported revenue increased 4.1%– $17 million unfavorable currency impact
• Adjusted EBITDA increased 57.1%– Constant currency adjusted EBITDA increased
70.6%• Adjusted margin expanded 710 bps to 21.1%
– Currency adjusted margins increased 720 bps– Higher software license revenue– Improved operating leverage
Revenue Segment EBITDA
$195 $204
$220
$150
$175
$200
$225
$250
Q308 Q309 Q309 Constant Currency
$27
$43 $47
$-
$20
$40
$60
Q308 Q309 Q309 Constant Currency
14.0%
21.1% 21.2%
Note: Calculations may differ due to rounding.
© 2009-2010 Fidelity National Information Services, Inc. and its subsidiaries.
12
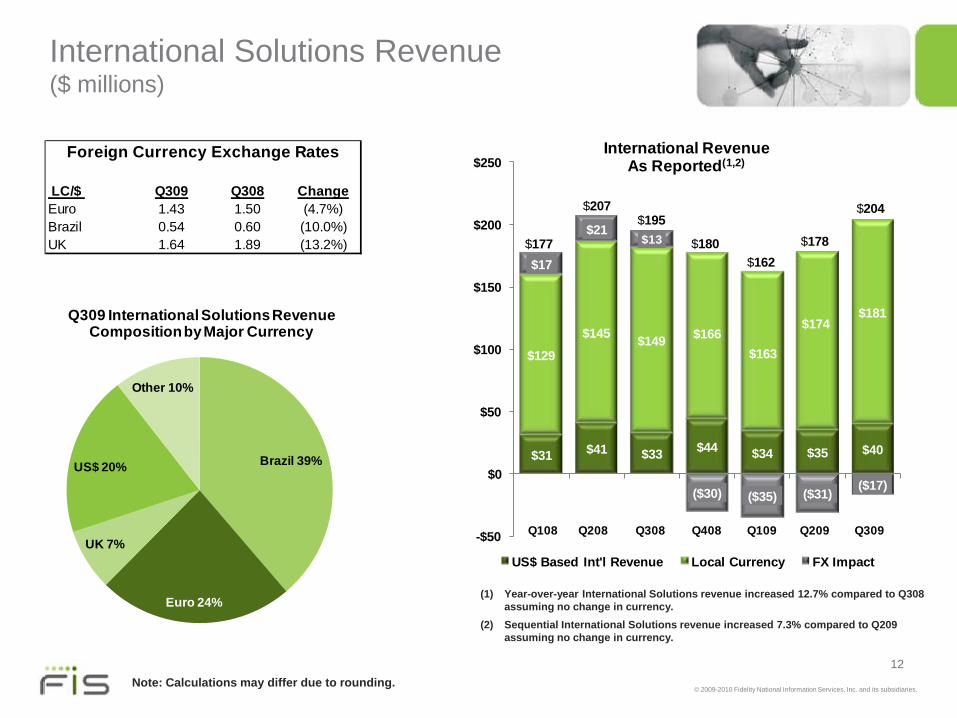
International Solutions Revenue($ millions)
Note: Calculations may differ due to rounding.
Foreign Currency Exchange Rates
LC/$ Q309 Q308 ChangeEuro 1.43 1.50 (4.7%)Brazil 0.54 0.60 (10.0%)UK 1.64 1.89 (13.2%)
Brazil 39%
Euro 24%
UK 7%
US$ 20%
Other 10%
Q309 International Solutions RevenueComposition by Major Currency
$31 $41 $33 $44 $34 $35 $40
$129
$145 $149
$17
$21 $13
($30) ($35) ($31) ($17)
-$50
$0
$50
$100
$150
$200
$250International Revenue
As Reported(1,2)
US$ Based Int'l Revenue Local Currency FX Impact
$177
$207$195
$180
$163$166
Q108 Q208 Q308 Q408 Q109
$162
Q209
$174
$178
Q309
$181
$204
(1) Year-over-year International Solutions revenue increased 12.7% compared to Q308 assuming no change in currency.
(2) Sequential International Solutions revenue increased 7.3% compared to Q209 assuming no change in currency.

© 2009-2010 Fidelity National Information Services, Inc. and its subsidiaries.
13
Results Summary($ millions)
Q3-2009 Q3-2008 % Change
Net Earnings from Continuing Operations 68$ 43$ M&A and Spin-off Related Costs, net of tax 4 11 Net Earnings, excluding other items 71 54 Purchase amortization, net of tax 19 24 Adjusted Net Earnings 90$ 78$ 15.9%
Adjusted Net Earnings Per Share 0.46$ 0.41$ 12.2%
Diluted Weighted Average Shares 194.6 191.8
Note: Calculations may differ due to rounding.
© 2009-2010 Fidelity National Information Services, Inc. and its subsidiaries.
14
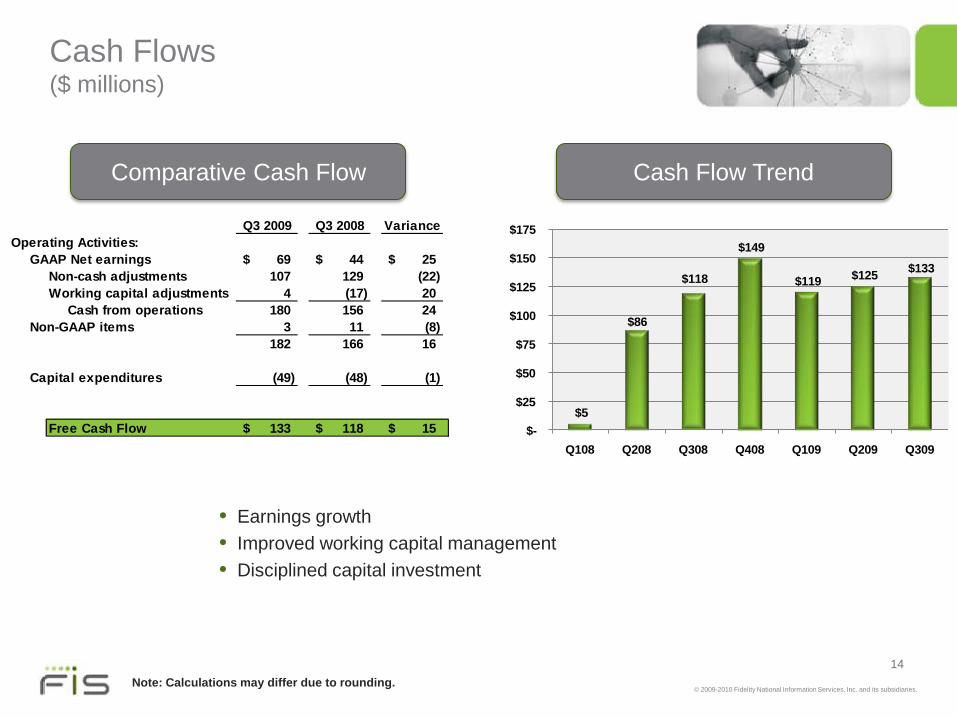
Cash Flows($ millions)
Comparative Cash Flow Cash Flow Trend
$5
$86
$118
$149
$119 $125 $133
$-
$25
$50
$75
$100
$125
$150
$175
Q108 Q208 Q308 Q408 Q109 Q209 Q309
• Earnings growth• Improved working capital management• Disciplined capital investment
Note: Calculations may differ due to rounding.
Q3 2009 Q3 2008 VarianceOperating Activities:
GAAP Net earnings 69$ 44$ 25$ Non-cash adjustments 107 129 (22) Working capital adjustments 4 (17) 20
Cash from operations 180 156 24 Non-GAAP items 3 11 (8)
182 166 16
Capital expenditures (49) (48) (1)
Free Cash Flow 133$ 118$ 15$
© 2009-2010 Fidelity National Information Services, Inc. and its subsidiaries.
15
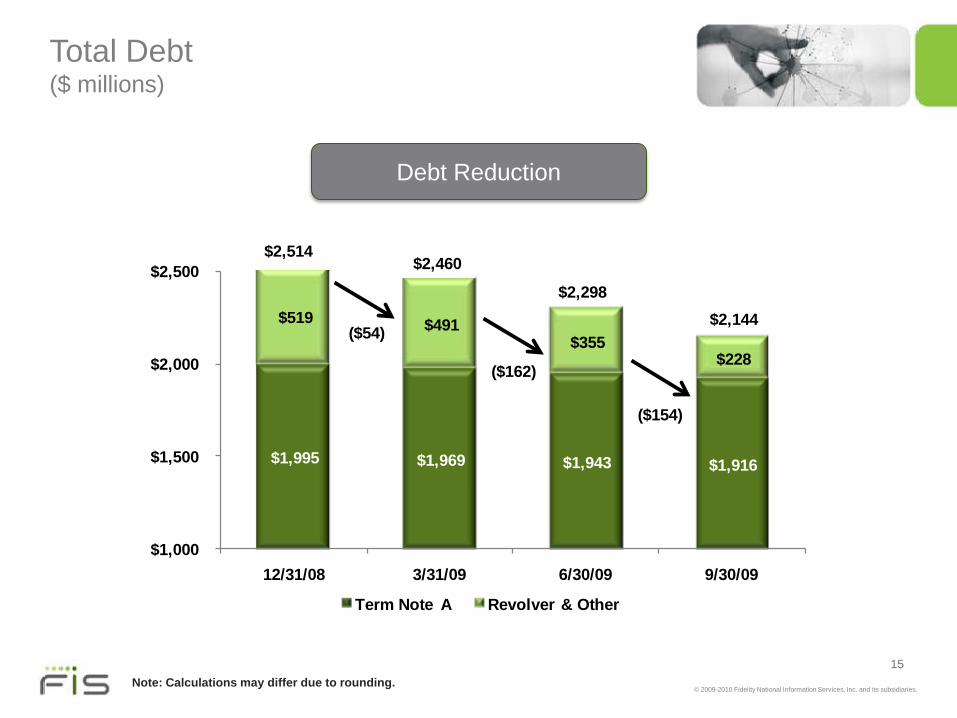
Total Debt($ millions)
Note: Calculations may differ due to rounding.
$1,995 $1,969 $1,943 $1,916
$519 $491 $355
$228
$1,000
$1,500
$2,000
$2,500
12/31/08 3/31/09 6/30/09 9/30/09
Term Note A Revolver & Other
$2,460
$2,298$2,144
$2,514
($54)
($162)
($154)
Debt Reduction
© 2009-2010 Fidelity National Information Services, Inc. and its subsidiaries.
16
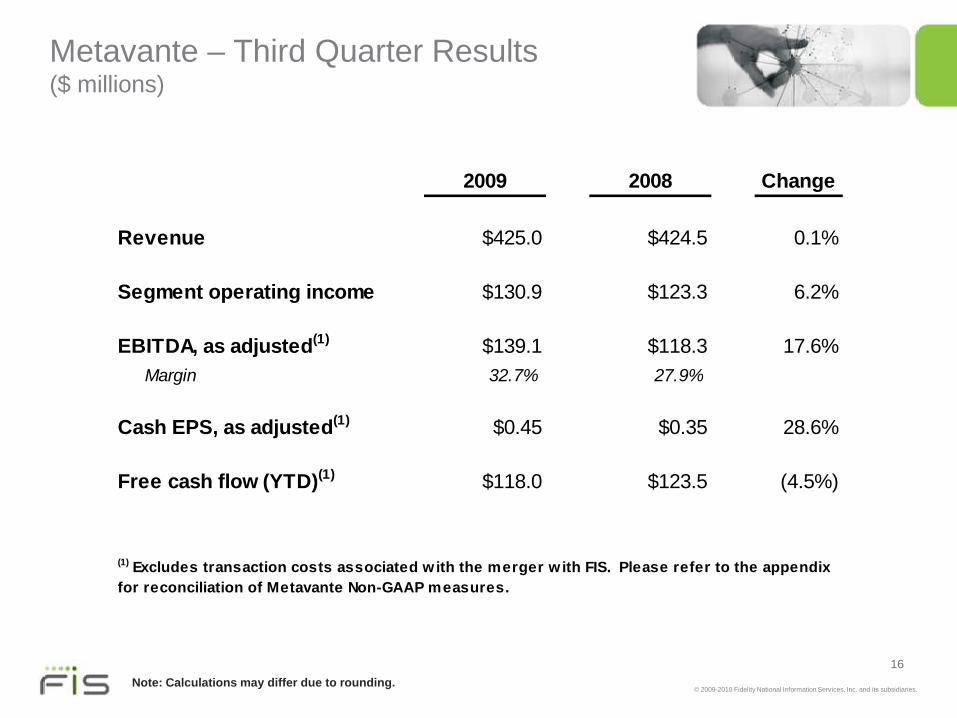
Metavante – Third Quarter Results($ millions)
Note: Calculations may differ due to rounding.
2009 2008 Change
Revenue $425.0 $424.5 0.1%
Segment operating income $130.9 $123.3 6.2%
EBITDA, as adjusted(1) $139.1 $118.3 17.6% Margin 32.7% 27.9%
Cash EPS, as adjusted(1) $0.45 $0.35 28.6%
Free cash flow (YTD)(1) $118.0 $123.5 (4.5%)
(1) Excludes transaction costs associated w ith the merger w ith FIS. Please refer to the appendix for reconciliation of Metavante Non-GAAP measures.

© 2009-2010 Fidelity National Information Services, Inc. and its subsidiaries.
17
Appendix
© 2009-2010 Fidelity National Information Services, Inc. and its subsidiaries.
18
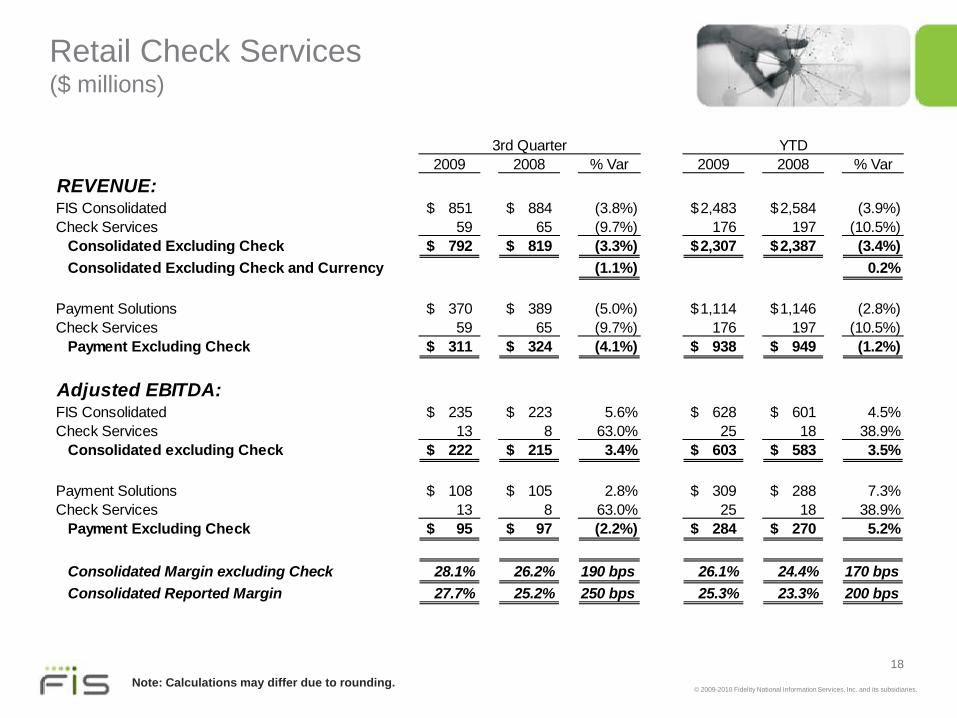
Retail Check Services($ millions)
3rd Quarter YTD2009 2008 % Var 2009 2008 % Var
REVENUE:FIS Consolidated 851$ 884$ (3.8%) 2,483$ 2,584$ (3.9%)Check Services 59 65 (9.7%) 176 197 (10.5%) Consolidated Excluding Check 792$ 819$ (3.3%) 2,307$ 2,387$ (3.4%) Consolidated Excluding Check and Currency (1.1%) 0.2%
Payment Solutions 370$ 389$ (5.0%) 1,114$ 1,146$ (2.8%)Check Services 59 65 (9.7%) 176 197 (10.5%) Payment Excluding Check 311$ 324$ (4.1%) 938$ 949$ (1.2%)
Adjusted EBITDA:FIS Consolidated 235$ 223$ 5.6% 628$ 601$ 4.5%Check Services 13 8 63.0% 25 18 38.9% Consolidated excluding Check 222$ 215$ 3.4% 603$ 583$ 3.5%
Payment Solutions 108$ 105$ 2.8% 309$ 288$ 7.3%Check Services 13 8 63.0% 25 18 38.9% Payment Excluding Check 95$ 97$ (2.2%) 284$ 270$ 5.2%
Consolidated Margin excluding Check 28.1% 26.2% 190 bps 26.1% 24.4% 170 bps Consolidated Reported Margin 27.7% 25.2% 250 bps 25.3% 23.3% 200 bps
Note: Calculations may differ due to rounding.
© 2009-2010 Fidelity National Information Services, Inc. and its subsidiaries.
19
Metavante Use of Non-GAAP Measures
This presentation contains non-GAAP financial measures such as “EBITDA”, “EBITDA, as adjusted”, “Cash Net Income”, “Cash Net Income, as adjusted” and “Free Cash Flow”. These measures should not be considered substitutes for GAAP measures. The following is a specific discussion of each measure:
Earnings Before Interest, Taxes, Depreciation and Amortization (EBITDA) and EBITDA, as adjustedMetavante’s management believes that “EBITDA” and “EBITDA, as adjusted” are useful for evaluating performance against peer companies within its industry, as well as providing investors additional transparency to a financial measure used by management in its financial and operational decision-making. In addition, Metavante utilizes EBITDA and EBITDA, as adjusted in its evaluation and determination of the price of potential acquisition candidates, to explain trends in its operating performance and provides useful information about its ability to incur and service indebtedness. EBITDA, as defined in the financial covenants, also excludes certain non-cash charges, such as impairment charges and stock option expense in addition to the items noted above. EBITDA, as adjusted is defined as EBITDA excluding costs related to the acquisition of Metavante by FIS. Metavante’s definition of EBITDA and EBITDA, as adjusted may be different from definitions used by other companies.
Cash Net Income (Including Per Share Amounts) and Cash Net Income, as adjustedMetavante’s management defines “cash net income” as net income before (1) the amortization of intangible assets resulting from business acquisitions, net of tax, and (2) stock-based compensation expense, net of tax. Diluted cash earnings per share is calculated by dividing cash net income by the average diluted shares for the respective period. “Cash net income, as adjusted” excludes the items described above as well as the costs related to the acquisition of Metavante by FIS. Metavante’s management uses cash net income (including per share amounts) and cash net income, as adjusted to assess business performance and believes that it is useful for evaluating performance against peer companies within its industry, as well as providing investors additional transparency to a financial measure used by management in its financial and operational decision-making. Metavante’s definition of cash net income (including per share amounts) and cash net income, as adjusted may be different from definitions used by other companies.
Free Cash FlowMetavante’s management defines “free cash flow” as cash flows provided by operating activities less capital expenditures. Management believes that free cash flow provides useful information to investors regarding Metavante’sability to generate cash from business operations that is available for acquisitions and other investments, and debt service. This definition of free cash flow may be different from definitions used by other companies.
© 2009-2010 Fidelity National Information Services, Inc. and its subsidiaries.
20
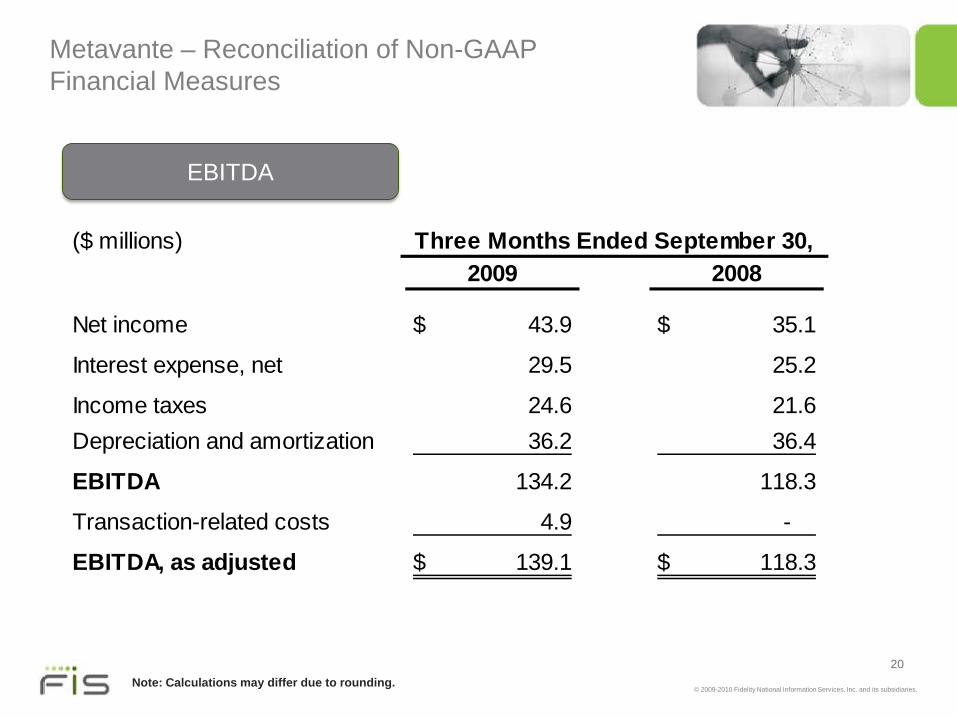
Metavante – Reconciliation of Non-GAAP Financial Measures
Note: Calculations may differ due to rounding.
($ millions)2009 2008
Net income 43.9$ 35.1$
Interest expense, net 29.5 25.2
Income taxes 24.6 21.6 Depreciation and amortization 36.2 36.4
EBITDA 134.2 118.3
Transaction-related costs 4.9 -
EBITDA, as adjusted 139.1$ 118.3$
Three Months Ended September 30,
EBITDA
© 2009-2010 Fidelity National Information Services, Inc. and its subsidiaries.
21
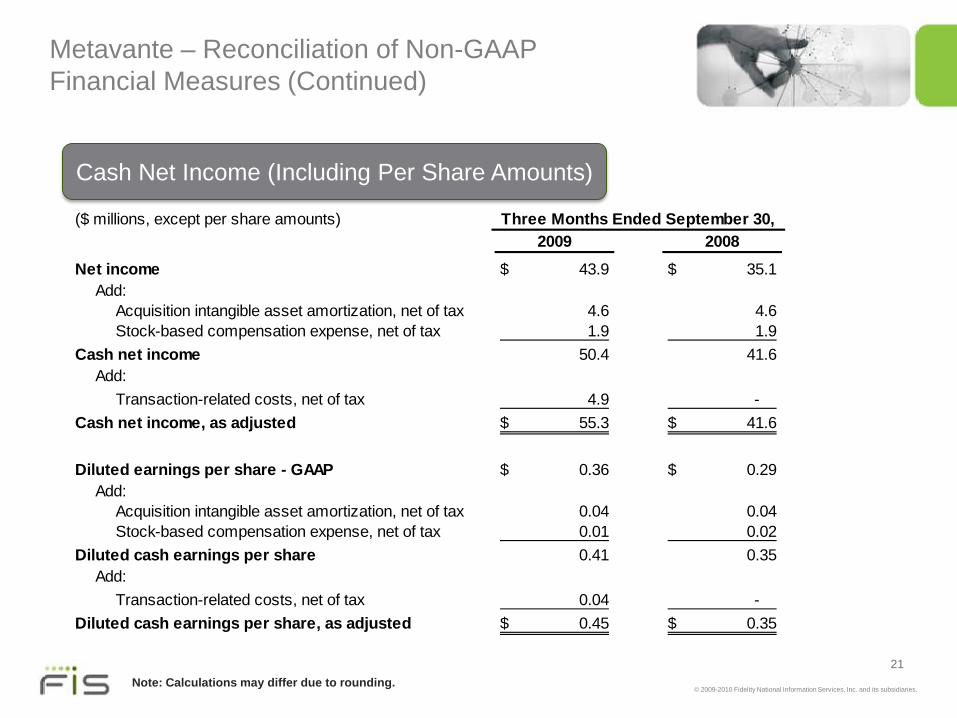
Metavante – Reconciliation of Non-GAAP Financial Measures (Continued)
Note: Calculations may differ due to rounding.
Cash Net Income (Including Per Share Amounts)
($ millions, except per share amounts)2009 2008
Net income 43.9$ 35.1$ Add:
Acquisition intangible asset amortization, net of tax 4.6 4.6 Stock-based compensation expense, net of tax 1.9 1.9
Cash net income 50.4 41.6 Add:
Transaction-related costs, net of tax 4.9 - Cash net income, as adjusted 55.3$ 41.6$
Diluted earnings per share - GAAP 0.36$ 0.29$ Add:
Acquisition intangible asset amortization, net of tax 0.04 0.04 Stock-based compensation expense, net of tax 0.01 0.02
Diluted cash earnings per share 0.41 0.35 Add:
Transaction-related costs, net of tax 0.04 - Diluted cash earnings per share, as adjusted 0.45$ 0.35$
Three Months Ended September 30,
© 2009-2010 Fidelity National Information Services, Inc. and its subsidiaries.
22
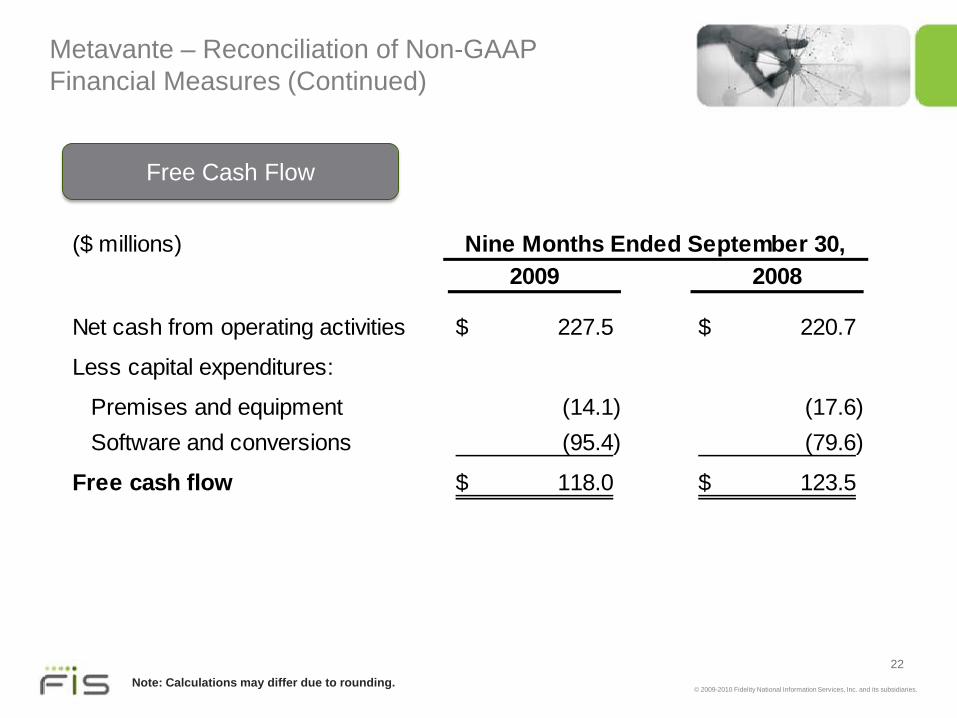
Metavante – Reconciliation of Non-GAAP Financial Measures (Continued)
Note: Calculations may differ due to rounding.
Free Cash Flow
($ millions)2009 2008
Net cash from operating activities 227.5$ 220.7$
Less capital expenditures:
Premises and equipment (14.1) (17.6) Software and conversions (95.4) (79.6)
Free cash flow 118.0$ 123.5$
Nine Months Ended September 30,