third quarter 2006 earnings presentation
TRANSCRIPT

Bank of America Third Quarter 2006 Results
Al de MolinaChief Financial Officer
October 19, 2006
2
Forward Looking StatementsThis presentation contains forward-looking statements, including statements about the financial conditions, results of operations and earnings outlook of Bank of America Corporation. The forward-looking statements involve certain risks and uncertainties. Factors that may cause actual results or earnings to differ materially from such forward-looking statements include, among others, the following: 1) projected business increases following process changes and other investments are lower than expected; 2) competitive pressure among financial services companies increases significantly; 3) general economic conditions are less favorable than expected; 4) political conditions including the threat of future terrorist activity and related actions by the United States abroad may adversely affect the company’s businesses and economic conditions as a whole; 5) changes in the interest rate environment reduce interest margins and impact funding sources; 6) changes in foreign exchange rates increases exposure; 7) changes in market rates and prices may adversely impact the value of financial products; 8) legislation or regulatory environments, requirements or changes adversely affect the businesses in which the company is engaged; 9) changes in accounting standards, rules or interpretations, 10) litigation liabilities, including costs, expenses, settlements and judgments, may adversely affect the company or its businesses; 11) mergers and acquisitions and their integration into the company; and 12) decisions to downsize, sell or close units or otherwise change the business mix of any of the company. For further information regarding Bank of America Corporation, please read the Bank of America reports filed with the SEC and available at www.sec.gov.
3
Important Presentation Format Information
• Information included in following slides is presented in a proformaformat for the total corporation and the Global Consumer & SmallBusiness Bank to include MBNA in all 2005 periods to provide a clearer picture of growth other than acquisitions
• Information that is presented on a proforma basis is also reported on a GAAP basis in the Appendix
• Certain prior period amounts have been reclassified to conform to current period presentation
4
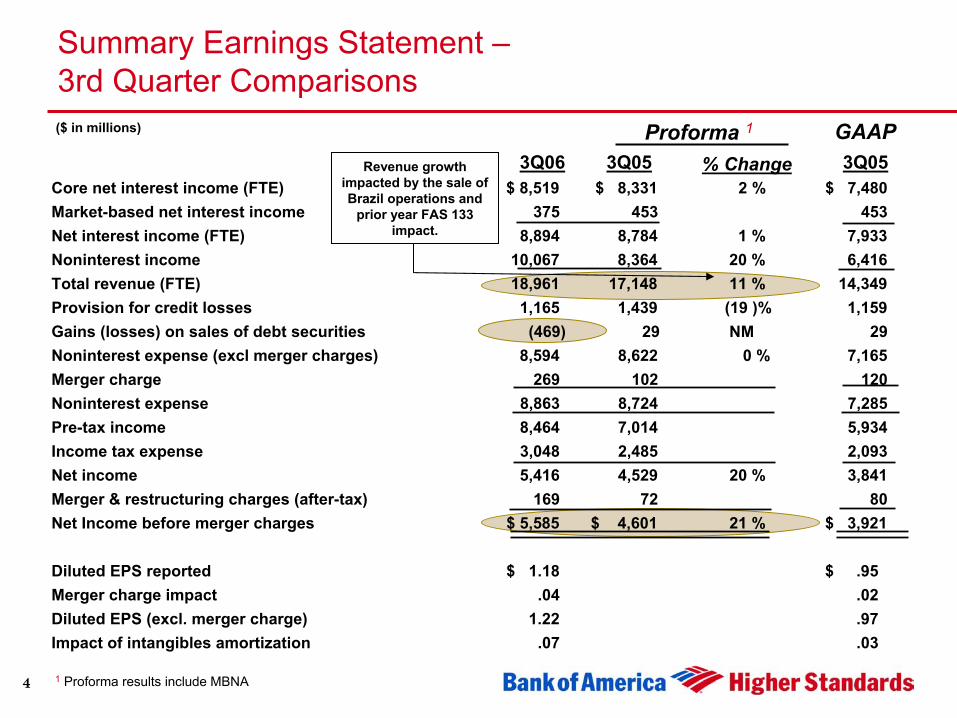
Summary Earnings Statement –3rd Quarter Comparisons
Proforma 1
% Change
1 Proforma results include MBNA
($ in millions) GAAP3Q06 3Q05 3Q05
Core net interest income (FTE) $ 8,519 $ 8,331 2 % $ 7,480Market-based net interest income 375 453 453Net interest income (FTE) 8,894 8,784 1 % 7,933 Noninterest income 10,067 8,364 20 % 6,416 Total revenue (FTE) 18,961 17,148 11 % 14,349 Provision for credit losses 1,165 1,439 (19 )% 1,159 Gains (losses) on sales of debt securities (469) 29 NM 29Noninterest expense (excl merger charges) 8,594 8,622 0 % 7,165Merger charge 269 102 120Noninterest expense 8,863 8,724 7,285Pre-tax income 8,464 7,014 5,934 Income tax expense 3,048 2,485 2,093Net income 5,416 4,529 20 % 3,841 Merger & restructuring charges (after-tax) 169 72 80Net Income before merger charges $ 5,585 $ 4,601 21 % $ 3,921
Diluted EPS reported $ 1.18 $ .95 Merger charge impact .04 .02Diluted EPS (excl. merger charge) 1.22 .97Impact of intangibles amortization .07 .03
Revenue growth impacted by the sale of Brazil operations and
prior year FAS 133 impact.
5
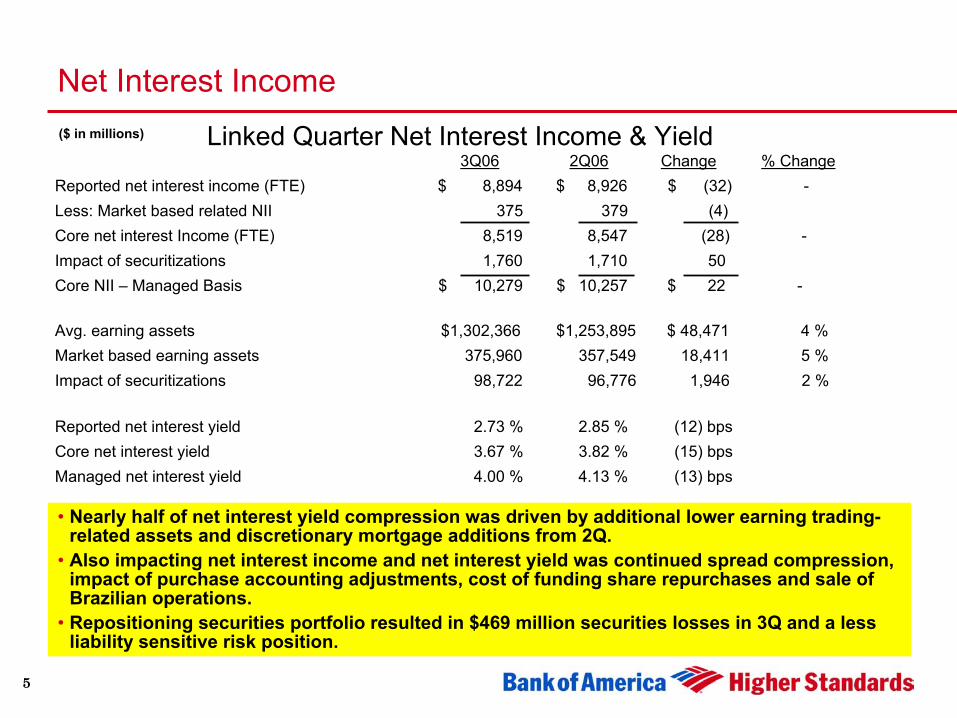
3Q06 2Q06 Change % ChangeReported net interest income (FTE) $ 8,894 $ 8,926 $ (32) -Less: Market based related NII 375 379 (4)Core net interest Income (FTE) 8,519 8,547 (28) -Impact of securitizations 1,760 1,710 50Core NII – Managed Basis $ 10,279 $ 10,257 $ 22 -
Avg. earning assets $1,302,366 $1,253,895 $ 48,471 4 %Market based earning assets 375,960 357,549 18,411 5 % Impact of securitizations 98,722 96,776 1,946 2 %
Reported net interest yield 2.73 % 2.85 % (12) bpsCore net interest yield 3.67 % 3.82 % (15) bpsManaged net interest yield 4.00 % 4.13 % (13) bps
Linked Quarter Net Interest Income & Yield
Net Interest Income($ in millions)
• Nearly half of net interest yield compression was driven by additional lower earning trading-related assets and discretionary mortgage additions from 2Q.
• Also impacting net interest income and net interest yield was continued spread compression, impact of purchase accounting adjustments, cost of funding share repurchases and sale of Brazilian operations.
• Repositioning securities portfolio resulted in $469 million securities losses in 3Q and a less liability sensitive risk position.
6
As of SEPTEMBER 30, 2006
As of JUNE 30, 2006
8
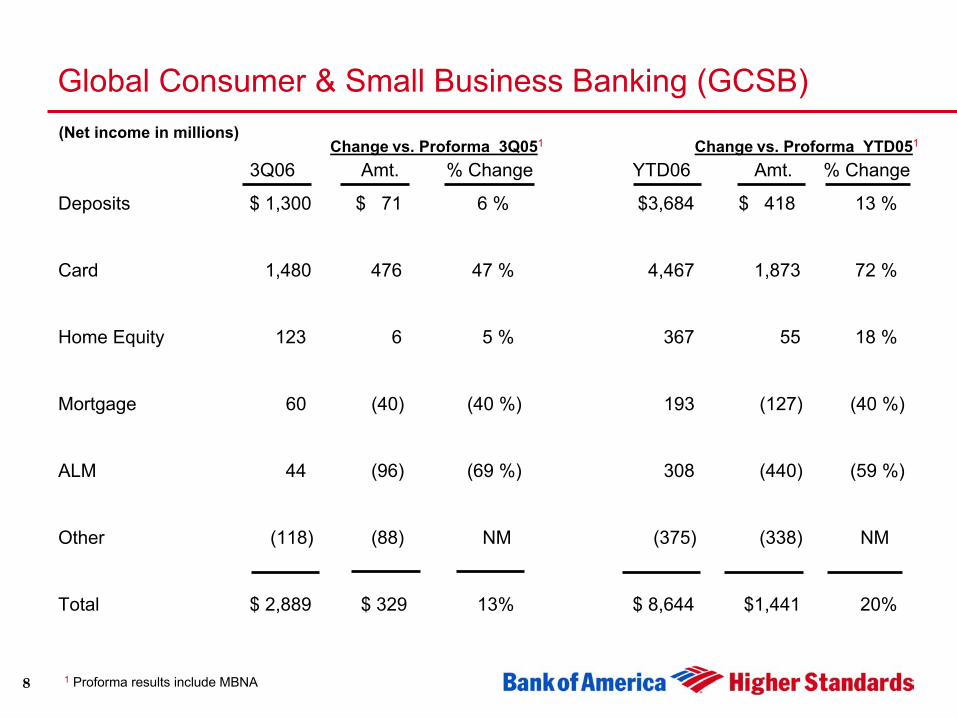
Global Consumer & Small Business Banking (GCSB)
3Q06 Amt. % Change YTD06 Amt. % Change
Deposits $ 1,300 $ 71 6 % $3,684 $ 418 13 %
Card 1,480 476 47 % 4,467 1,873 72 %
Home Equity 123 6 5 % 367 55 18 %
Mortgage 60 (40) (40 %) 193 (127) (40 %)
ALM 44 (96) (69 %) 308 (440) (59 %)
Other (118) (88) NM (375) (338) NM
Total $ 2,889 $ 329 13% $ 8,644 $1,441 20%
1 Proforma results include MBNA
(Net income in millions)Change vs. Proforma 3Q051 Change vs. Proforma YTD051
9
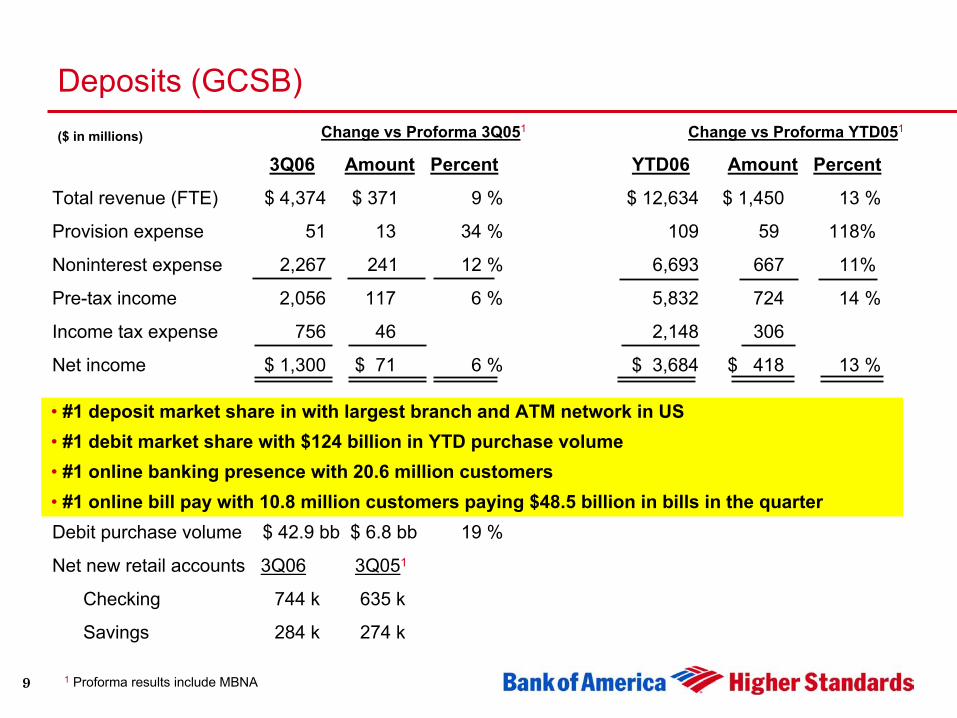
Deposits (GCSB)Change vs Proforma 3Q051 Change vs Proforma YTD051
3Q06 Amount Percent YTD06 Amount Percent
Total revenue (FTE) $ 4,374 $ 371 9 % $ 12,634 $ 1,450 13 %
Provision expense 51 13 34 % 109 59 118%
Noninterest expense 2,267 241 12 % 6,693 667 11%
Pre-tax income 2,056 117 6 % 5,832 724 14 %
Income tax expense 756 46 2,148 306
Net income $ 1,300 $ 71 6 % $ 3,684 $ 418 13 %
Debit purchase volume $ 42.9 bb $ 6.8 bb 19 %
Net new retail accounts 3Q06 3Q051
Checking 744 k 635 k
Savings 284 k 274 k
($ in millions)
• #1 deposit market share in with largest branch and ATM network in US• #1 debit market share with $124 billion in YTD purchase volume• #1 online banking presence with 20.6 million customers• #1 online bill pay with 10.8 million customers paying $48.5 billion in bills in the quarter
1 Proforma results include MBNA

10
Deposits Business Metrics (GCSB) - Proforma5-Quarter trend of deposit indicators:
3Q06 2Q06 1Q06 4Q05 1 3Q05 1
Average balances (in billions)Checking $124.8 $ 127.8 $ 126.4 $ 125.9 $ 124.8Savings 31.2 32.5 32.1 31.9 32.1 MMS 70.3 73.5 76.9 78.4 75.2CDs & IRAs 92.6 88.9 84.8 85.5 93.8Foreign & Other 11.5 11.3 10.1 11.3 12.2
Total GCSB deposits 330.4 334.0 330.3 333.0 338.1Cumulative balances transferred 2 49.2 47.9 46.2 44.0 41.5
Deposit SpreadsChecking 4.23 % 4.21 % 4.18 % 4.16 % 4.17 %Savings 3.42 3.38 3.36 3.53 3.79MMS 2.87 2.75 2.53 2.50 1.89CDs & IRAs 1.20 1.25 1.21 1.01 0.80Foreign & Other 4.08 4.05 3.67 3.50 2.93
Total GCSB deposits 3.00 3.00 2.92 2.86 2.63
1 Proforma results include MBNA2 Qualified customer balances transferred to GWIM segment
11
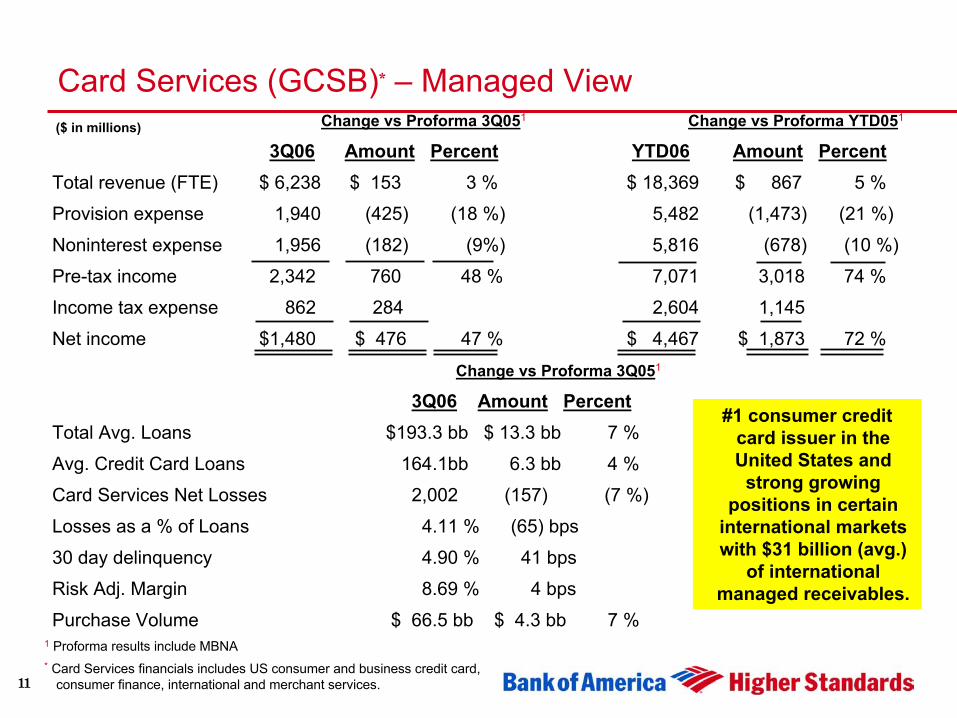
Card Services (GCSB)* – Managed ViewChange vs Proforma 3Q051 Change vs Proforma YTD051
3Q06 Amount Percent YTD06 Amount PercentTotal revenue (FTE) $ 6,238 $ 153 3 % $ 18,369 $ 867 5 %
Provision expense 1,940 (425) (18 %) 5,482 (1,473) (21 %)
Noninterest expense 1,956 (182) (9%) 5,816 (678) (10 %)
Pre-tax income 2,342 760 48 % 7,071 3,018 74 %
Income tax expense 862 284 2,604 1,145
Net income $1,480 $ 476 47 % $ 4,467 $ 1,873 72 %
Change vs Proforma 3Q051
3Q06 Amount PercentTotal Avg. Loans $193.3 bb $ 13.3 bb 7 %
Avg. Credit Card Loans 164.1bb 6.3 bb 4 %
Card Services Net Losses 2,002 (157) (7 %)
Losses as a % of Loans 4.11 % (65) bps
30 day delinquency 4.90 % 41 bps
Risk Adj. Margin 8.69 % 4 bps
Purchase Volume $ 66.5 bb $ 4.3 bb 7 %
#1 consumer credit card issuer in the United States and
strong growing positions in certain
international markets with $31 billion (avg.)
of international managed receivables.
* Card Services financials includes US consumer and business credit card, consumer finance, international and merchant services.
1 Proforma results include MBNA
($ in millions)
12
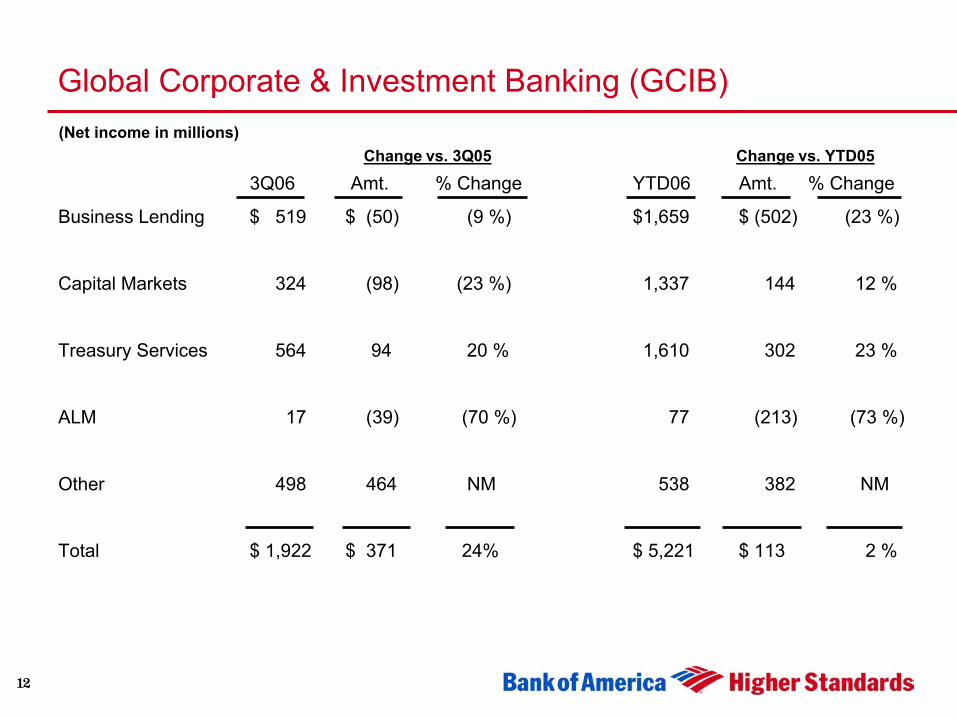
Global Corporate & Investment Banking (GCIB)
3Q06 Amt. % Change YTD06 Amt. % Change
Business Lending $ 519 $ (50) (9 %) $1,659 $ (502) (23 %)
Capital Markets 324 (98) (23 %) 1,337 144 12 %
Treasury Services 564 94 20 % 1,610 302 23 %
ALM 17 (39) (70 %) 77 (213) (73 %)
Other 498 464 NM 538 382 NM
Total $ 1,922 $ 371 24% $ 5,221 $ 113 2 %
(Net income in millions)Change vs. 3Q05 Change vs. YTD05
13
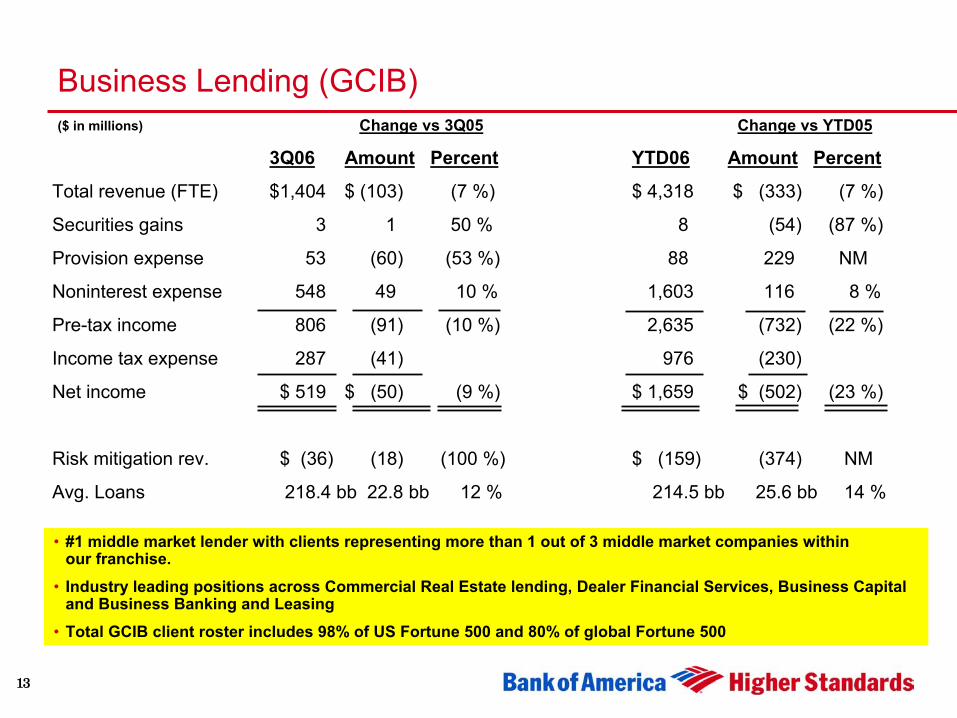
Business Lending (GCIB)($ in millions)
• #1 middle market lender with clients representing more than 1 out of 3 middle market companies within our franchise.
• Industry leading positions across Commercial Real Estate lending, Dealer Financial Services, Business Capital and Business Banking and Leasing
• Total GCIB client roster includes 98% of US Fortune 500 and 80% of global Fortune 500
Change vs 3Q05 Change vs YTD05
3Q06 Amount Percent YTD06 Amount Percent
Total revenue (FTE) $1,404 $ (103) (7 %) $ 4,318 $ (333) (7 %)
Securities gains 3 1 50 % 8 (54) (87 %)
Provision expense 53 (60) (53 %) 88 229 NM
Noninterest expense 548 49 10 % 1,603 116 8 %
Pre-tax income 806 (91) (10 %) 2,635 (732) (22 %)
Income tax expense 287 (41) 976 (230)
Net income $ 519 $ (50) (9 %) $ 1,659 $ (502) (23 %)
Risk mitigation rev. $ (36) (18) (100 %) $ (159) (374) NM
Avg. Loans 218.4 bb 22.8 bb 12 % 214.5 bb 25.6 bb 14 %
14
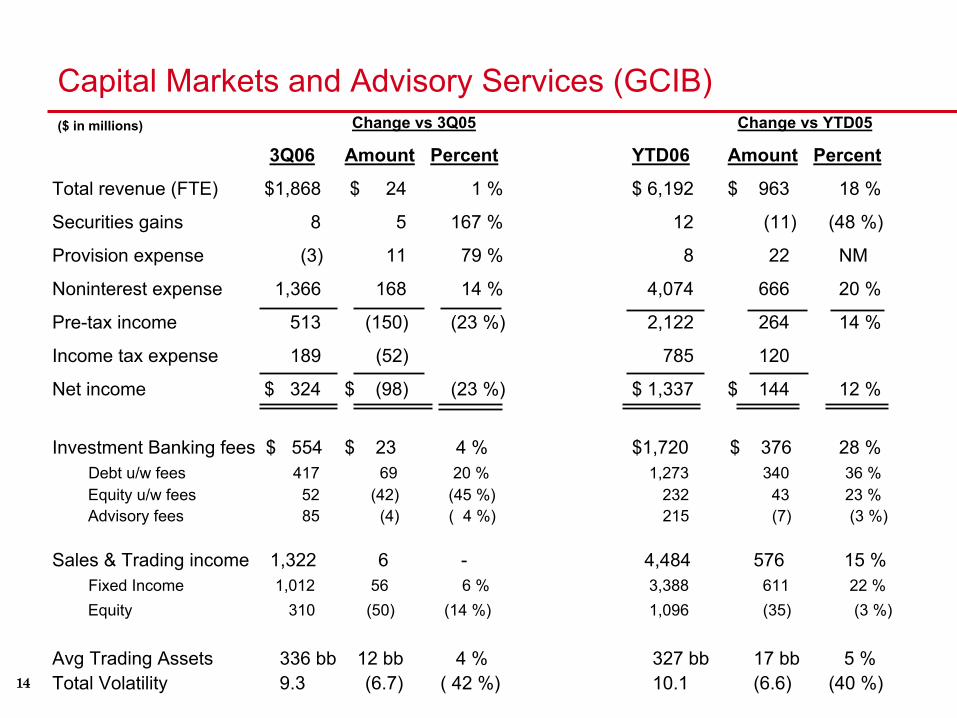
Capital Markets and Advisory Services (GCIB)($ in millions) Change vs 3Q05 Change vs YTD05
3Q06 Amount Percent YTD06 Amount Percent
Total revenue (FTE) $1,868 $ 24 1 % $ 6,192 $ 963 18 %
Securities gains 8 5 167 % 12 (11) (48 %)
Provision expense (3) 11 79 % 8 22 NM
Noninterest expense 1,366 168 14 % 4,074 666 20 %
Pre-tax income 513 (150) (23 %) 2,122 264 14 %
Income tax expense 189 (52) 785 120
Net income $ 324 $ (98) (23 %) $ 1,337 $ 144 12 %
Investment Banking fees $ 554 $ 23 4 % $1,720 $ 376 28 %Debt u/w fees 417 69 20 % 1,273 340 36 %Equity u/w fees 52 (42) (45 %) 232 43 23 %Advisory fees 85 (4) ( 4 %) 215 (7) (3 %)
Sales & Trading income 1,322 6 - 4,484 576 15 %Fixed Income 1,012 56 6 % 3,388 611 22 %Equity 310 (50) (14 %) 1,096 (35) (3 %)
Avg Trading Assets 336 bb 12 bb 4 % 327 bb 17 bb 5 % Total Volatility 9.3 (6.7) ( 42 %) 10.1 (6.6) (40 %)
15
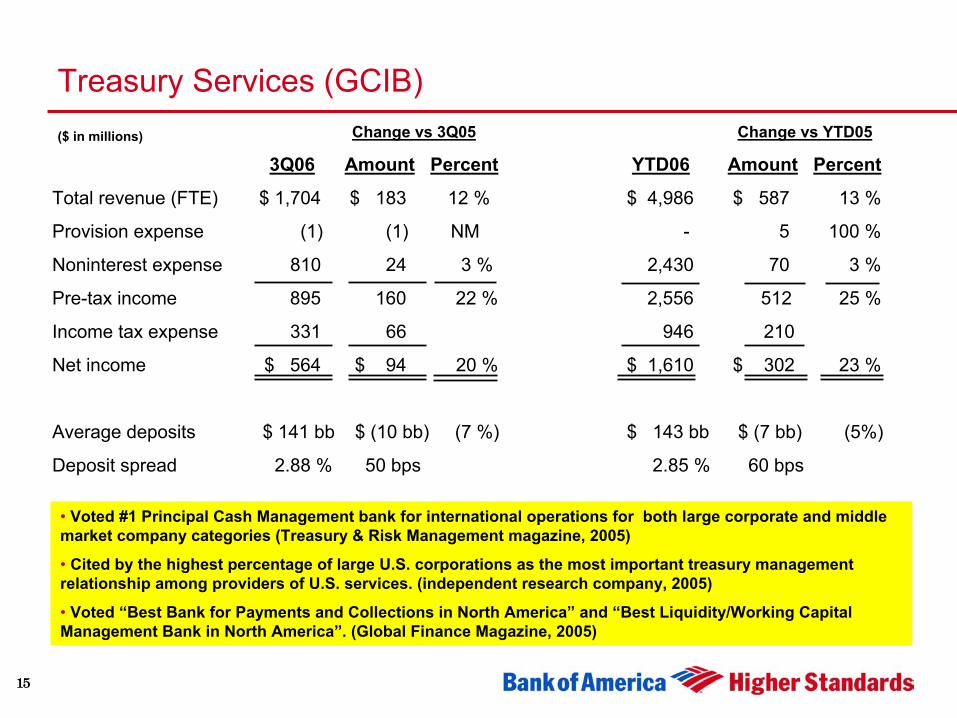
Treasury Services (GCIB)Change vs 3Q05 Change vs YTD05
3Q06 Amount Percent YTD06 Amount Percent
Total revenue (FTE) $ 1,704 $ 183 12 % $ 4,986 $ 587 13 %
Provision expense (1) (1) NM - 5 100 %
Noninterest expense 810 24 3 % 2,430 70 3 %
Pre-tax income 895 160 22 % 2,556 512 25 %
Income tax expense 331 66 946 210
Net income $ 564 $ 94 20 % $ 1,610 $ 302 23 %
Average deposits $ 141 bb $ (10 bb) (7 %) $ 143 bb $ (7 bb) (5%)
Deposit spread 2.88 % 50 bps 2.85 % 60 bps
($ in millions)
• Voted #1 Principal Cash Management bank for international operations for both large corporate and middle market company categories (Treasury & Risk Management magazine, 2005)
• Cited by the highest percentage of large U.S. corporations as the most important treasury management relationship among providers of U.S. services. (independent research company, 2005)
• Voted “Best Bank for Payments and Collections in North America” and “Best Liquidity/Working Capital Management Bank in North America”. (Global Finance Magazine, 2005)
16
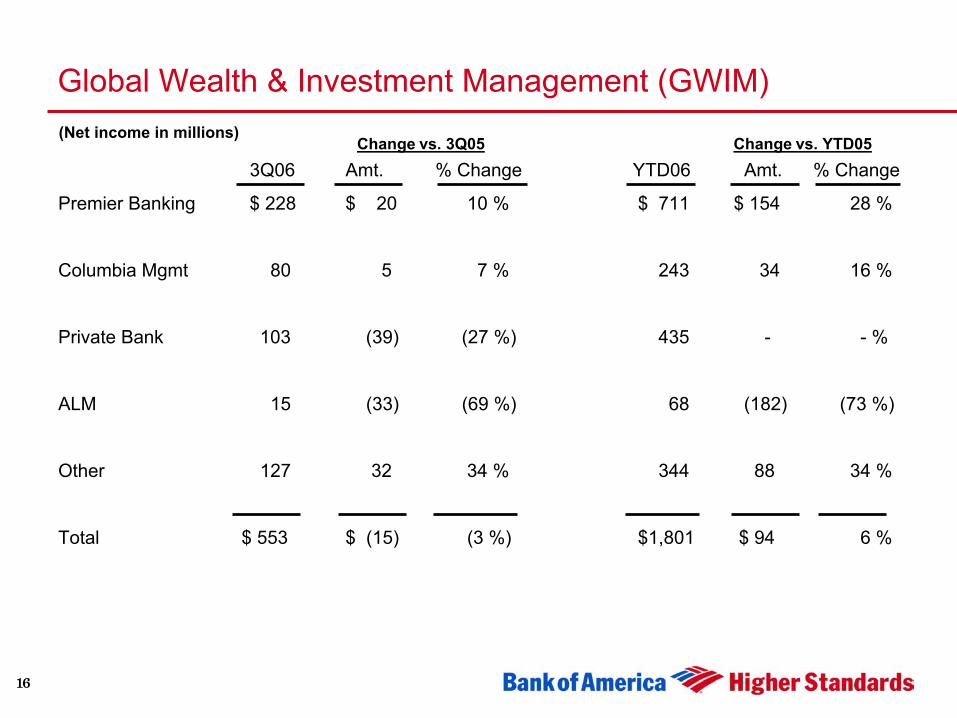
Global Wealth & Investment Management (GWIM)
3Q06 Amt. % Change YTD06 Amt. % Change
Premier Banking $ 228 $ 20 10 % $ 711 $ 154 28 %
Columbia Mgmt 80 5 7 % 243 34 16 %
Private Bank 103 (39) (27 %) 435 - - %
ALM 15 (33) (69 %) 68 (182) (73 %)
Other 127 32 34 % 344 88 34 %
Total $ 553 $ (15) (3 %) $1,801 $ 94 6 %
(Net income in millions)Change vs. 3Q05 Change vs. YTD05
17
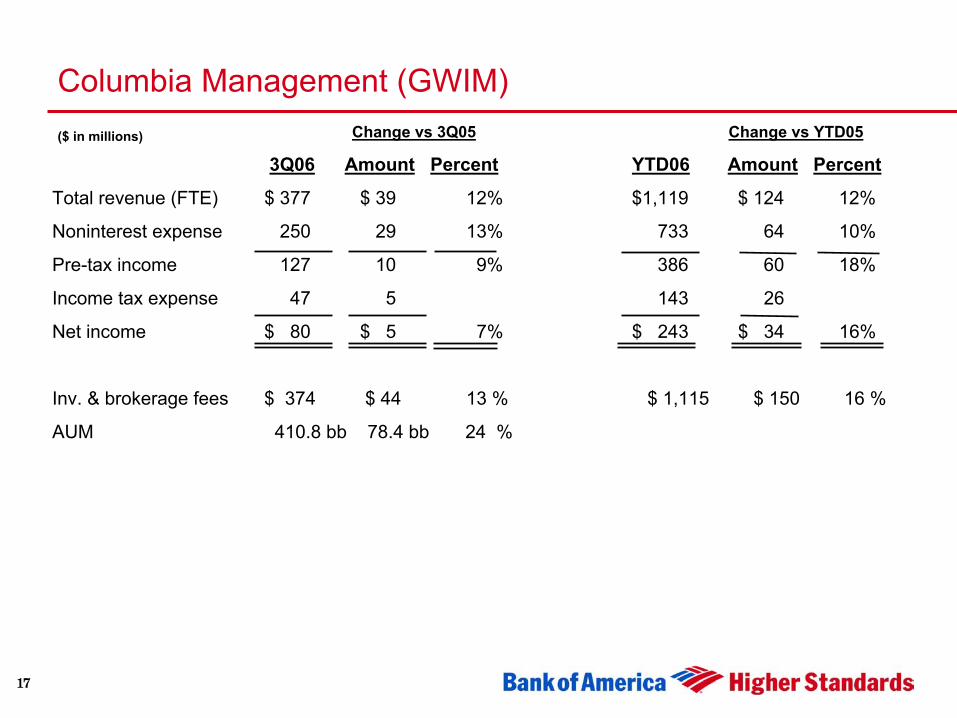
Columbia Management (GWIM)Change vs 3Q05 Change vs YTD05
3Q06 Amount Percent YTD06 Amount Percent
Total revenue (FTE) $ 377 $ 39 12% $1,119 $ 124 12%
Noninterest expense 250 29 13% 733 64 10%
Pre-tax income 127 10 9% 386 60 18%
Income tax expense 47 5 143 26
Net income $ 80 $ 5 7% $ 243 $ 34 16%
Inv. & brokerage fees $ 374 $ 44 13 % $ 1,115 $ 150 16 %
AUM 410.8 bb 78.4 bb 24 %
($ in millions)
18
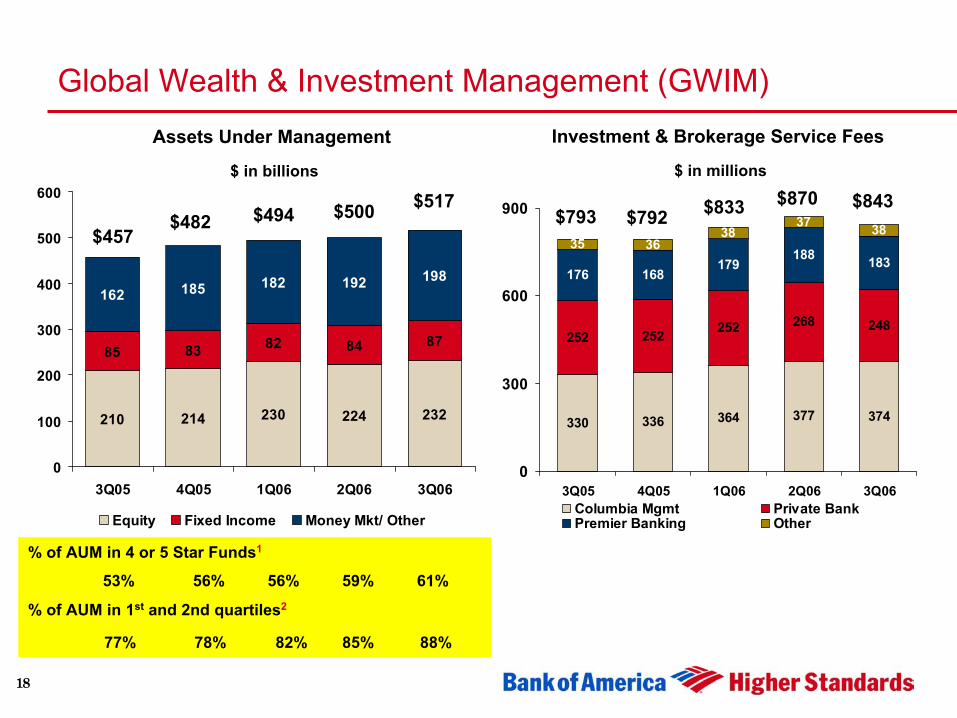
Global Wealth & Investment Management (GWIM)
210 214 230 224 232
85 83 82 84 87
162 185 182 192 198
0
100
200
300
400
500
600
3Q05 4Q05 1Q06 2Q06 3Q06
Equity Fixed Income Money Mkt/ Other
330 336 364 377 374
252 252 252 268 248
176 168179
188 18335 36
3837 38
0
300
600
900
3Q05 4Q05 1Q06 2Q06 3Q06Columbia Mgmt Private BankPremier Banking Other
Assets Under Management
$ in billions
Investment & Brokerage Service Fees
$ in millions
% of AUM in 4 or 5 Star Funds1
53% 56% 56% 59% 61%
% of AUM in 1st and 2nd quartiles2
77% 78% 82% 85% 88%
$500$494$482$457
$793 $792 $833 $870$517 $843

19
Global Wealth & Investment Management (GWIM)
Footnotes for Page 18
(1)Results shown are defined by Columbia Management’s calculation using Morningstar’s Overall Rating criteria for 4 & 5 star rating. The assets under management of the Columbia Funds that had a 4 & 5 star rating were totaled then divided by the assets under management of all the funds in the ranking.
©2006 by Morningstar, Inc. All rights reserved. The information contained herein is the proprietary information of Morningstar, Inc., may not be copied or redistributed for any purpose and may only be used for noncommercial, personal purposes. The information contained herein is not represented or warranted to be accurate, correct, complete or timely. Morningstar, Inc. shall not be responsible for investment decisions, damages or other losses resulting from the use of this information. Past performance is noguarantee of future results.
(2)Results shown are defined by Columbia Management’s calculation of its percentage of assets under management in the top two quartiles of categories based on Morningstar (Equity categories, Lipper ( Fixed Income categories) (iMoneyNet Money Market funds). The category percentile rank was calculated by ranking the three year gross return of share classes within the categories statedabove . The assets of the number of funds within the top 2 quartile results include both were added and then divided by ColumbiaManagements total assets under management. Had fees been included, rankings would have been lower. Past performance is no guarantee of future results.
20
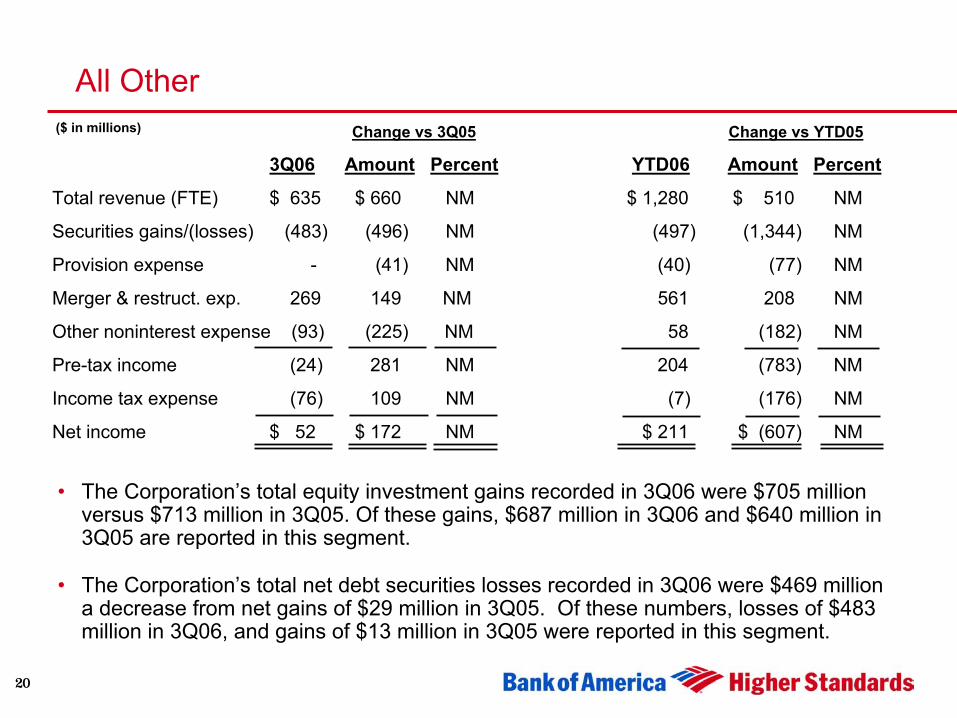
All Other
• The Corporation’s total equity investment gains recorded in 3Q06 were $705 million versus $713 million in 3Q05. Of these gains, $687 million in 3Q06 and $640 million in 3Q05 are reported in this segment.
• The Corporation’s total net debt securities losses recorded in 3Q06 were $469 million a decrease from net gains of $29 million in 3Q05. Of these numbers, losses of $483 million in 3Q06, and gains of $13 million in 3Q05 were reported in this segment.
Change vs 3Q05 Change vs YTD05
3Q06 Amount Percent YTD06 Amount Percent
Total revenue (FTE) $ 635 $ 660 NM $ 1,280 $ 510 NM
Securities gains/(losses) (483) (496) NM (497) (1,344) NM
Provision expense - (41) NM (40) (77) NM
Merger & restruct. exp. 269 149 NM 561 208 NM
Other noninterest expense (93) (225) NM 58 (182) NM
Pre-tax income (24) 281 NM 204 (783) NM
Income tax expense (76) 109 NM (7) (176) NM
Net income $ 52 $ 172 NM $ 211 $ (607) NM
($ in millions)
21
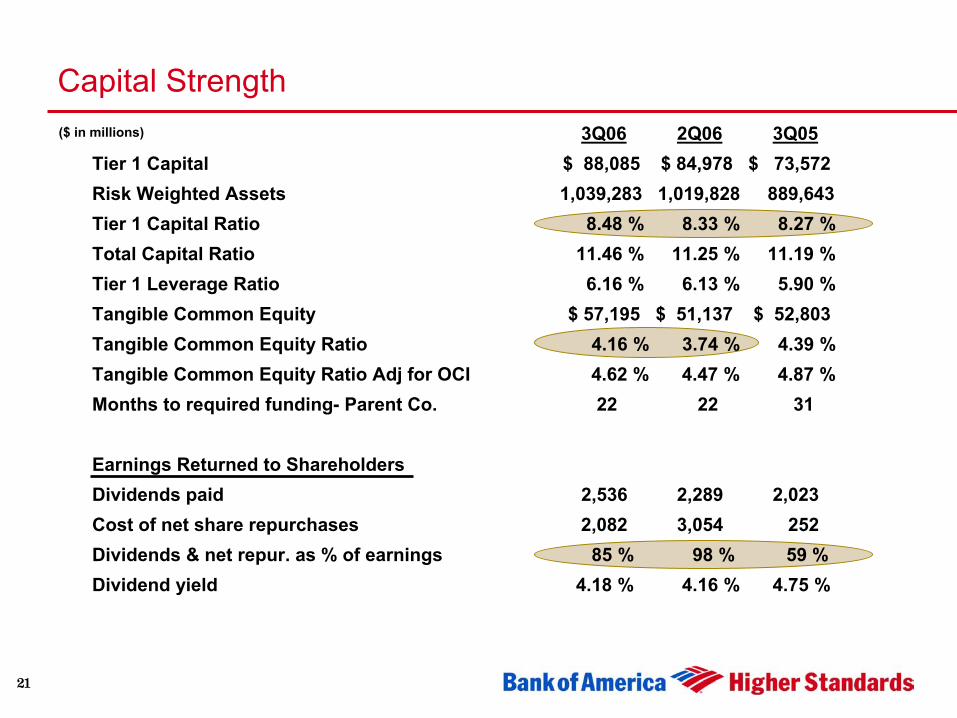
Capital Strength($ in millions) 3Q06 2Q06 3Q05
Tier 1 Capital $ 88,085 $ 84,978 $ 73,572Risk Weighted Assets 1,039,283 1,019,828 889,643Tier 1 Capital Ratio 8.48 % 8.33 % 8.27 % Total Capital Ratio 11.46 % 11.25 % 11.19 %Tier 1 Leverage Ratio 6.16 % 6.13 % 5.90 % Tangible Common Equity $ 57,195 $ 51,137 $ 52,803Tangible Common Equity Ratio 4.16 % 3.74 % 4.39 % Tangible Common Equity Ratio Adj for OCI 4.62 % 4.47 % 4.87 % Months to required funding- Parent Co. 22 22 31
Earnings Returned to ShareholdersDividends paid 2,536 2,289 2,023Cost of net share repurchases 2,082 3,054 252Dividends & net repur. as % of earnings 85 % 98 % 59 %Dividend yield 4.18 % 4.16 % 4.75 %
22
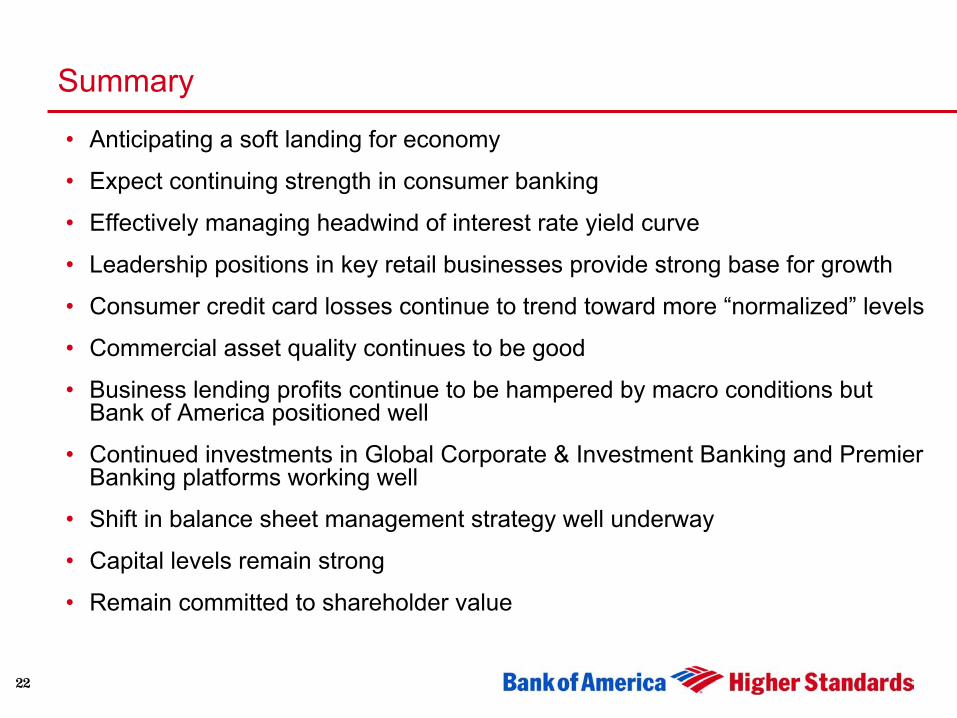
Summary
• Anticipating a soft landing for economy
• Expect continuing strength in consumer banking
• Effectively managing headwind of interest rate yield curve
• Leadership positions in key retail businesses provide strong base for growth
• Consumer credit card losses continue to trend toward more “normalized” levels
• Commercial asset quality continues to be good
• Business lending profits continue to be hampered by macro conditions but Bank of America positioned well
• Continued investments in Global Corporate & Investment Banking and Premier Banking platforms working well
• Shift in balance sheet management strategy well underway
• Capital levels remain strong
• Remain committed to shareholder value

23
APPENDIX
24
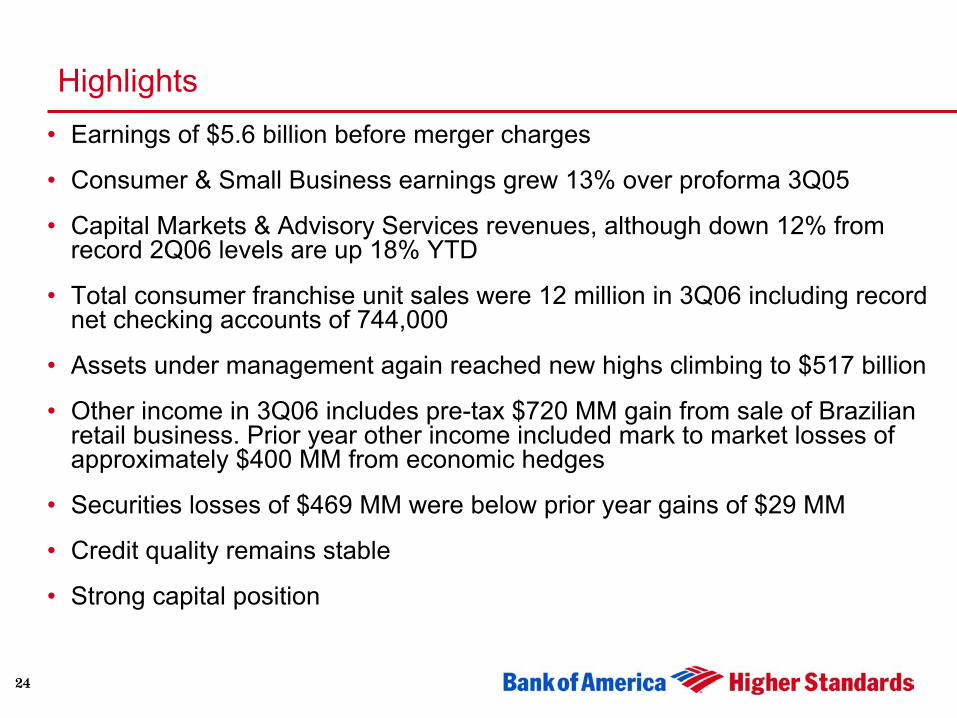
Highlights• Earnings of $5.6 billion before merger charges
• Consumer & Small Business earnings grew 13% over proforma 3Q05
• Capital Markets & Advisory Services revenues, although down 12% from record 2Q06 levels are up 18% YTD
• Total consumer franchise unit sales were 12 million in 3Q06 including record net checking accounts of 744,000
• Assets under management again reached new highs climbing to $517 billion
• Other income in 3Q06 includes pre-tax $720 MM gain from sale of Brazilian retail business. Prior year other income included mark to market losses of approximately $400 MM from economic hedges
• Securities losses of $469 MM were below prior year gains of $29 MM
• Credit quality remains stable
• Strong capital position
25
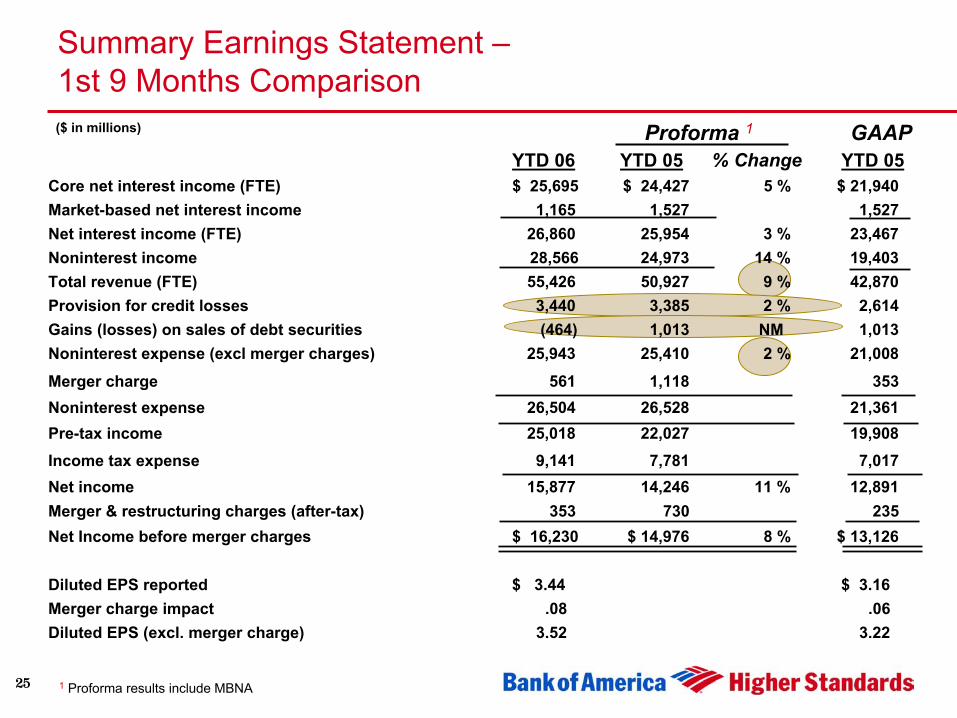
Summary Earnings Statement –1st 9 Months Comparison
Proforma 1
% ChangeGAAP($ in millions)
YTD 06 YTD 05 YTD 05Core net interest income (FTE) $ 25,695 $ 24,427 5 % $ 21,940 Market-based net interest income 1,165 1,527 1,527Net interest income (FTE) 26,860 25,954 3 % 23,467 Noninterest income 28,566 24,973 14 % 19,403 Total revenue (FTE) 55,426 50,927 9 % 42,870Provision for credit losses 3,440 3,385 2 % 2,614Gains (losses) on sales of debt securities (464) 1,013 NM 1,013 Noninterest expense (excl merger charges) 25,943 25,410 2 % 21,008
Merger charge 561 1,118 353Noninterest expense 26,504 26,528 21,361 Pre-tax income 25,018 22,027 19,908 Income tax expense 9,141 7,781 7,017Net income 15,877 14,246 11 % 12,891 Merger & restructuring charges (after-tax) 353 730 235 Net Income before merger charges $ 16,230 $ 14,976 8 % $ 13,126
Diluted EPS reported $ 3.44 $ 3.16 Merger charge impact .08 .06 Diluted EPS (excl. merger charge) 3.52 3.22
1 Proforma results include MBNA
26
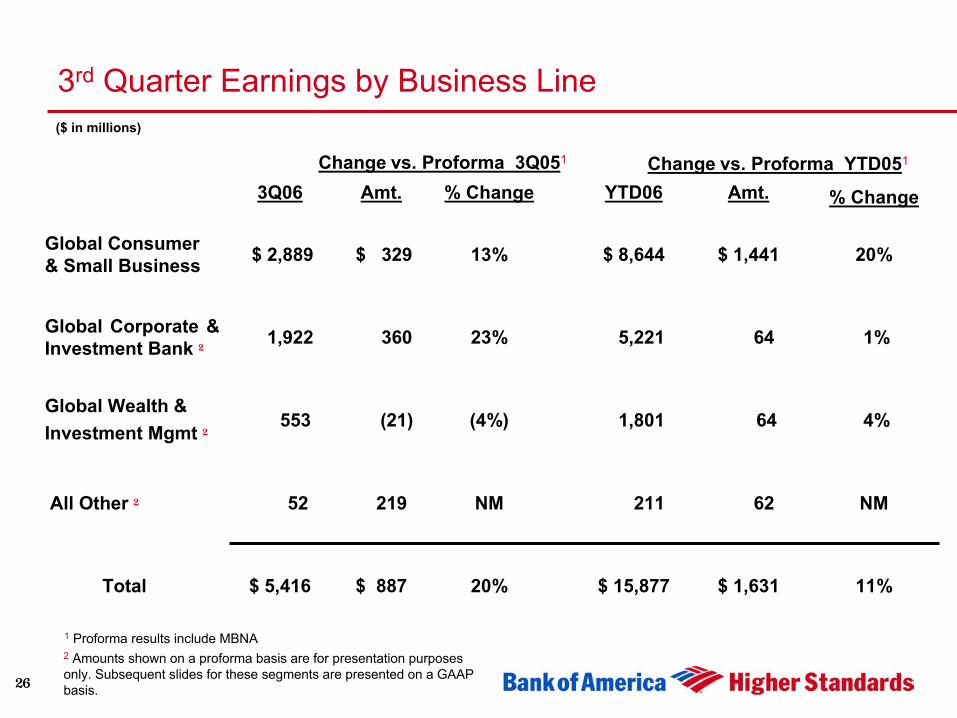
3rd Quarter Earnings by Business Line
11%$ 1,631$ 15,87720%$ 887$ 5,416Total
NM62211NM21952All Other 2
4%641,801(4%)(21)553Global Wealth &Investment Mgmt 2
1%645,22123% 3601,922 Global Corporate &Investment Bank 2
20%$ 1,441$ 8,64413% $ 329$ 2,889Global Consumer& Small Business
% ChangeAmt.YTD06% ChangeAmt.3Q06Change vs. Proforma 3Q051
1 Proforma results include MBNA
Change vs. Proforma YTD051
2 Amounts shown on a proforma basis are for presentation purposes only. Subsequent slides for these segments are presented on a GAAP basis.
($ in millions)
27
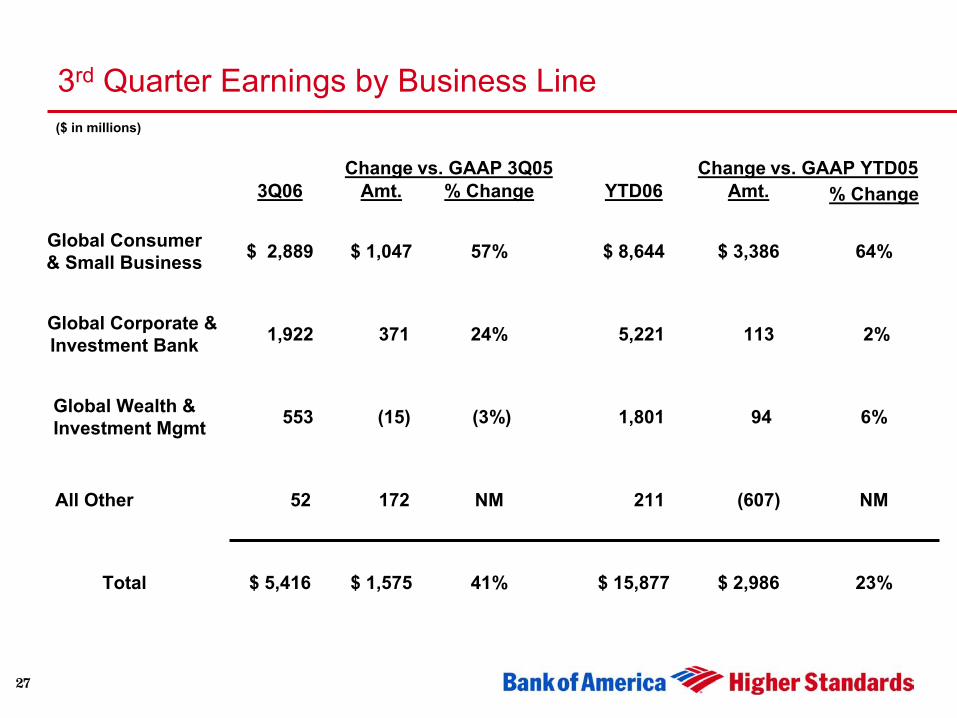
3rd Quarter Earnings by Business Line
23%$ 2,986$ 15,87741%$ 1,575$ 5,416Total
NM(607)211NM17252All Other
6%941,801(3%)(15)553Global Wealth &Investment Mgmt
2%1135,22124%3711,922Global Corporate &Investment Bank
64%$ 3,386$ 8,64457%$ 1,047$ 2,889Global Consumer& Small Business
% ChangeAmt.YTD06% ChangeAmt. 3Q06Change vs. GAAP 3Q05 Change vs. GAAP YTD05
($ in millions)
28
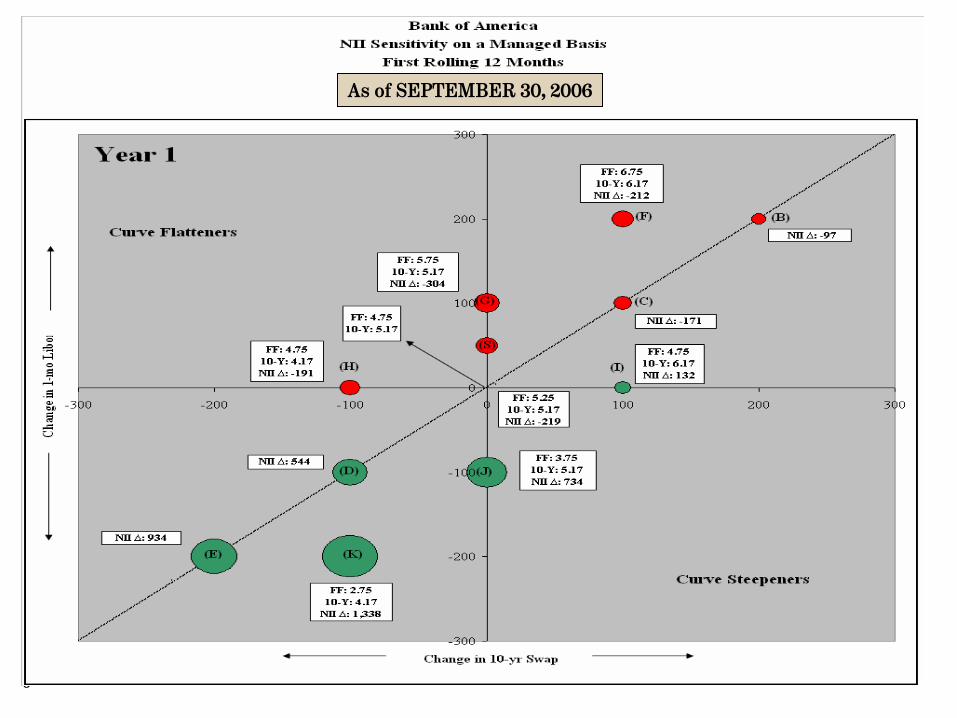
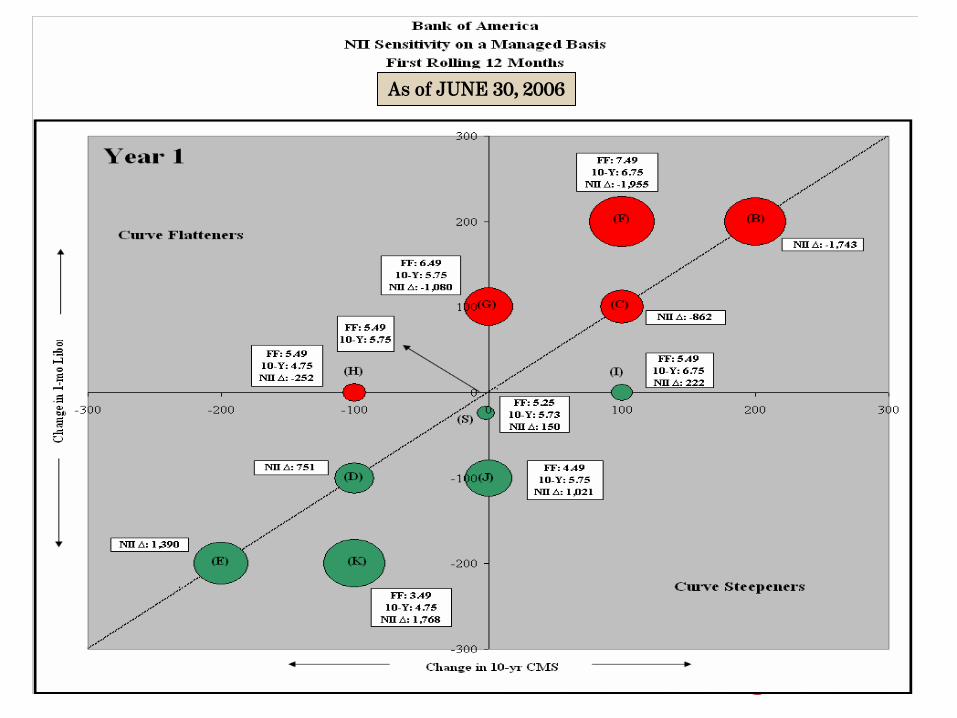
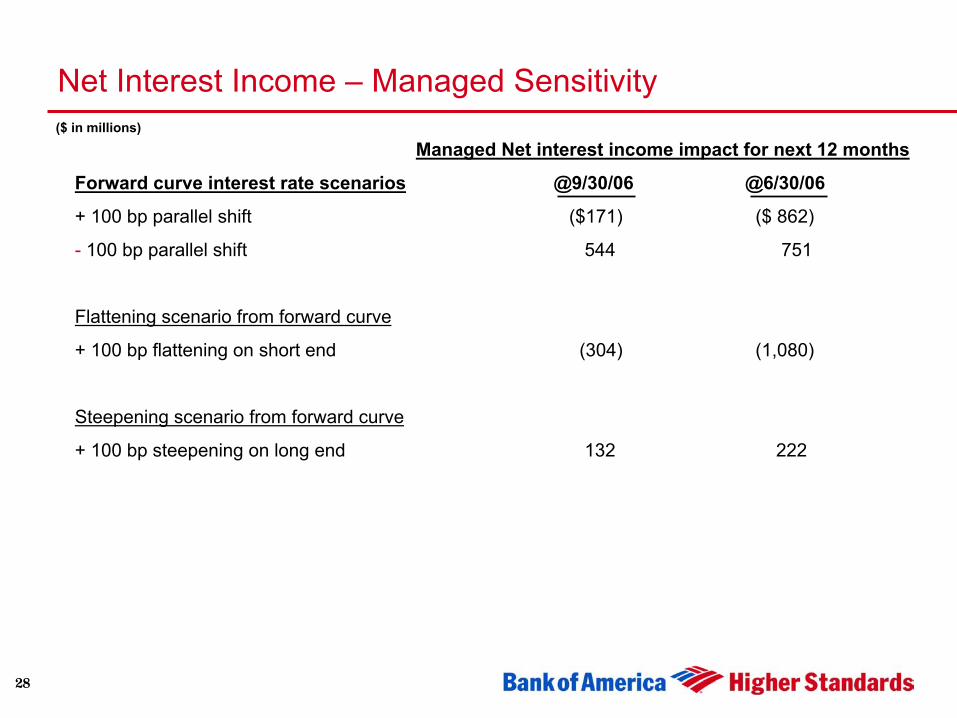
Net Interest Income – Managed Sensitivity
Managed Net interest income impact for next 12 months
Forward curve interest rate scenarios @9/30/06 @6/30/06
+ 100 bp parallel shift ($171) ($ 862)
- 100 bp parallel shift 544 751
Flattening scenario from forward curve
+ 100 bp flattening on short end (304) (1,080)
Steepening scenario from forward curve
+ 100 bp steepening on long end 132 222
($ in millions)
29
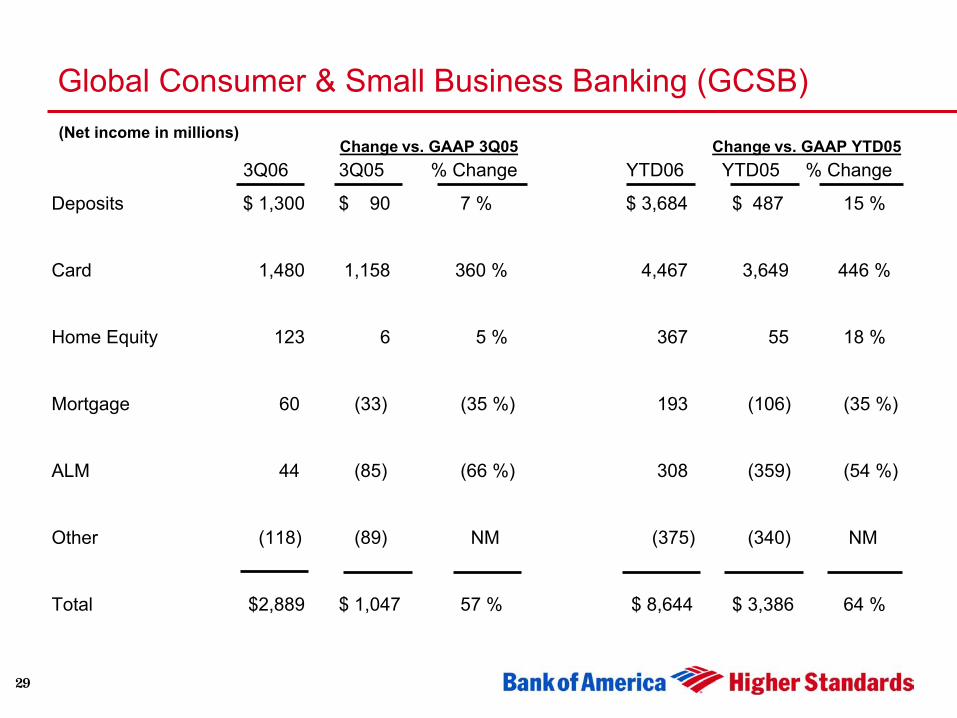
Global Consumer & Small Business Banking (GCSB)
3Q06 3Q05 % Change YTD06 YTD05 % Change
Deposits $ 1,300 $ 90 7 % $ 3,684 $ 487 15 %
Card 1,480 1,158 360 % 4,467 3,649 446 %
Home Equity 123 6 5 % 367 55 18 %
Mortgage 60 (33) (35 %) 193 (106) (35 %)
ALM 44 (85) (66 %) 308 (359) (54 %)
Other (118) (89) NM (375) (340) NM
Total $2,889 $ 1,047 57 % $ 8,644 $ 3,386 64 %
(Net income in millions)Change vs. GAAP 3Q05 Change vs. GAAP YTD05
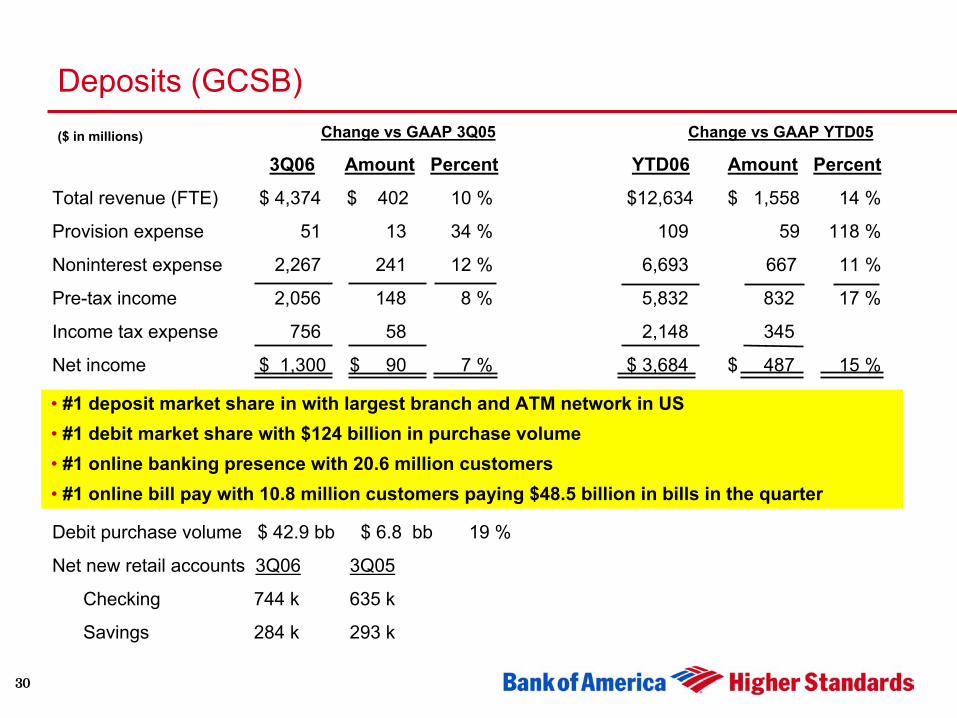
30
Deposits (GCSB)Change vs GAAP 3Q05 Change vs GAAP YTD05
3Q06 Amount Percent YTD06 Amount Percent
Total revenue (FTE) $ 4,374 $ 402 10 % $12,634 $ 1,558 14 %
Provision expense 51 13 34 % 109 59 118 %
Noninterest expense 2,267 241 12 % 6,693 667 11 %
Pre-tax income 2,056 148 8 % 5,832 832 17 %
Income tax expense 756 58 2,148 345
Net income $ 1,300 $ 90 7 % $ 3,684 $ 487 15 %
Debit purchase volume $ 42.9 bb $ 6.8 bb 19 %
Net new retail accounts 3Q06 3Q05
Checking 744 k 635 k
Savings 284 k 293 k
($ in millions)
• #1 deposit market share in with largest branch and ATM network in US• #1 debit market share with $124 billion in purchase volume• #1 online banking presence with 20.6 million customers• #1 online bill pay with 10.8 million customers paying $48.5 billion in bills in the quarter
31
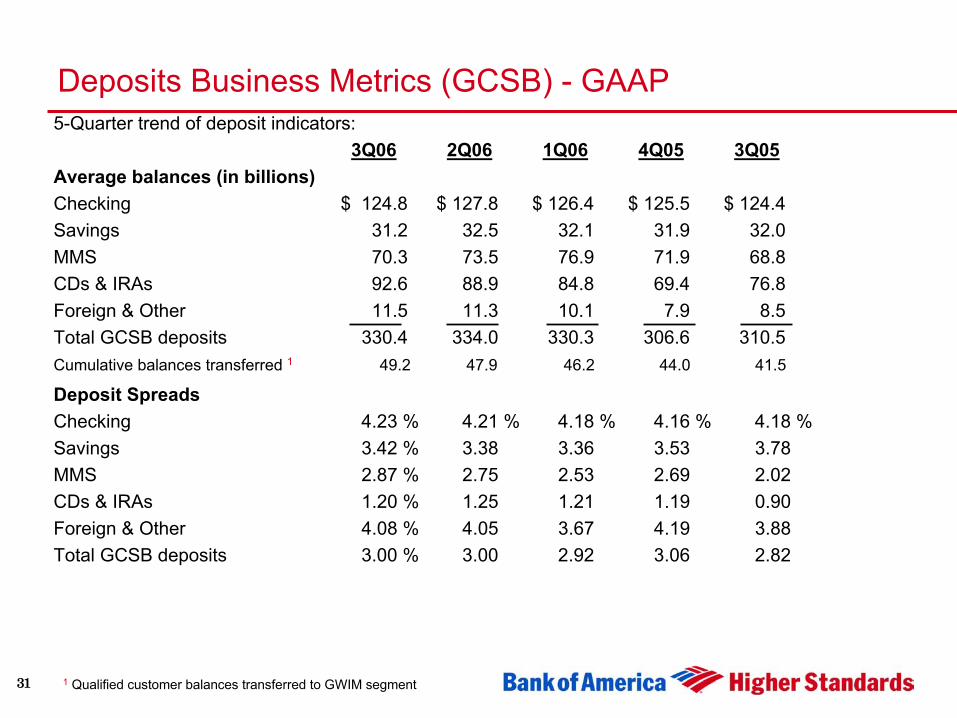
Deposits Business Metrics (GCSB) - GAAP5-Quarter trend of deposit indicators:
3Q06 2Q06 1Q06 4Q05 3Q05Average balances (in billions)Checking $ 124.8 $ 127.8 $ 126.4 $ 125.5 $ 124.4Savings 31.2 32.5 32.1 31.9 32.0MMS 70.3 73.5 76.9 71.9 68.8CDs & IRAs 92.6 88.9 84.8 69.4 76.8Foreign & Other 11.5 11.3 10.1 7.9 8.5Total GCSB deposits 330.4 334.0 330.3 306.6 310.5Cumulative balances transferred 1 49.2 47.9 46.2 44.0 41.5
Deposit SpreadsChecking 4.23 % 4.21 % 4.18 % 4.16 % 4.18 %Savings 3.42 % 3.38 3.36 3.53 3.78MMS 2.87 % 2.75 2.53 2.69 2.02 CDs & IRAs 1.20 % 1.25 1.21 1.19 0.90Foreign & Other 4.08 % 4.05 3.67 4.19 3.88Total GCSB deposits 3.00 % 3.00 2.92 3.06 2.82
1 Qualified customer balances transferred to GWIM segment
32
-20%
-5%
10%
25%
Dec '0
3Feb
'04
Apr '04
Jun '
04Aug
'04
Oct '04
Dec '0
4Feb
'05
Apr '05
Jun '
05Aug
'05
Oct '05
Dec '0
5Feb
'06
Apr '06
Jun '
06Aug
'06
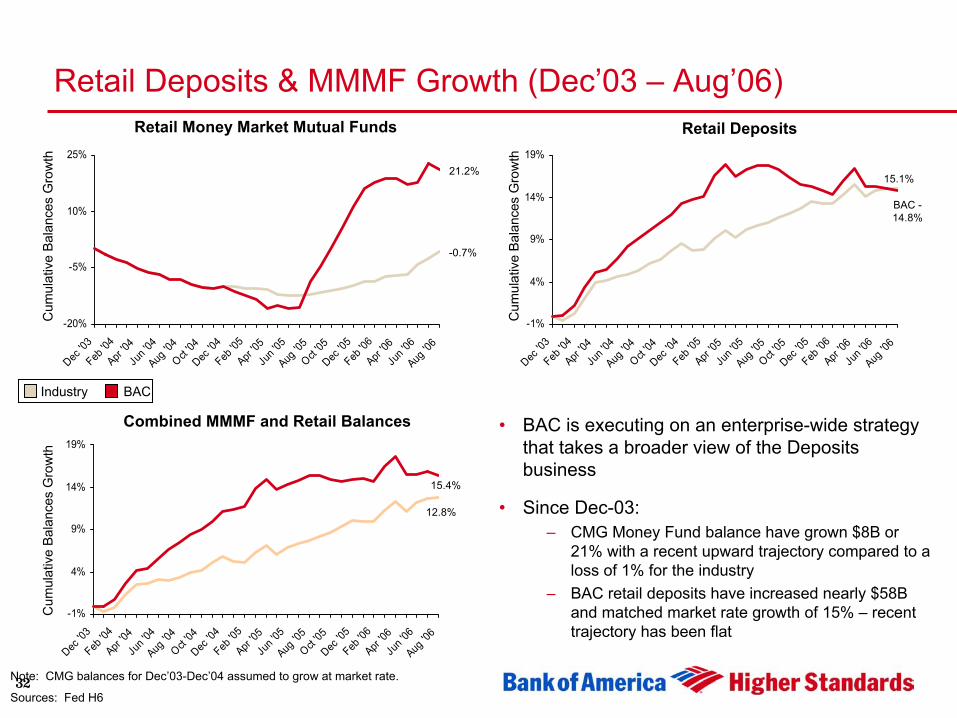
Retail Deposits & MMMF Growth (Dec’03 – Aug’06)Retail Money Market Mutual Funds
Cum
ulat
ive
Bala
nces
Gro
wth
-1%
4%
9%
14%
19%
Dec '0
3Feb
'04
Apr '04
Jun '
04Aug
'04
Oct '04
Dec '0
4Feb
'05
Apr '05
Jun '
05Aug
'05
Oct '05
Dec '0
5Feb
'06
Apr '06
Jun '
06Aug
'06
-1%
4%
9%
14%
19%
Dec '0
3Feb
'04
Apr '04
Jun '
04Aug
'04
Oct '04
Dec '0
4Feb
'05
Apr '05
Jun '
05Aug
'05
Oct '05
Dec '0
5Feb
'06
Apr '06
Jun '
06Aug
'06
Retail Deposits
Combined MMMF and Retail Balances • BAC is executing on an enterprise-wide strategy that takes a broader view of the Deposits business
• Since Dec-03:– CMG Money Fund balance have grown $8B or
21% with a recent upward trajectory compared to a loss of 1% for the industry
– BAC retail deposits have increased nearly $58B and matched market rate growth of 15% – recent trajectory has been flat
Industry BAC
21.2%
Cum
ulat
ive
Bala
nces
Gro
wth
Cum
ulat
ive
Bala
nces
Gro
wth
-0.7%
15.4%
12.8%
BAC -14.8%
15.1%
Note: CMG balances for Dec’03-Dec’04 assumed to grow at market rate.
Sources: Fed H6
33 ^ Risk Adjusted Margin reported at Consumer Card level in 2005.
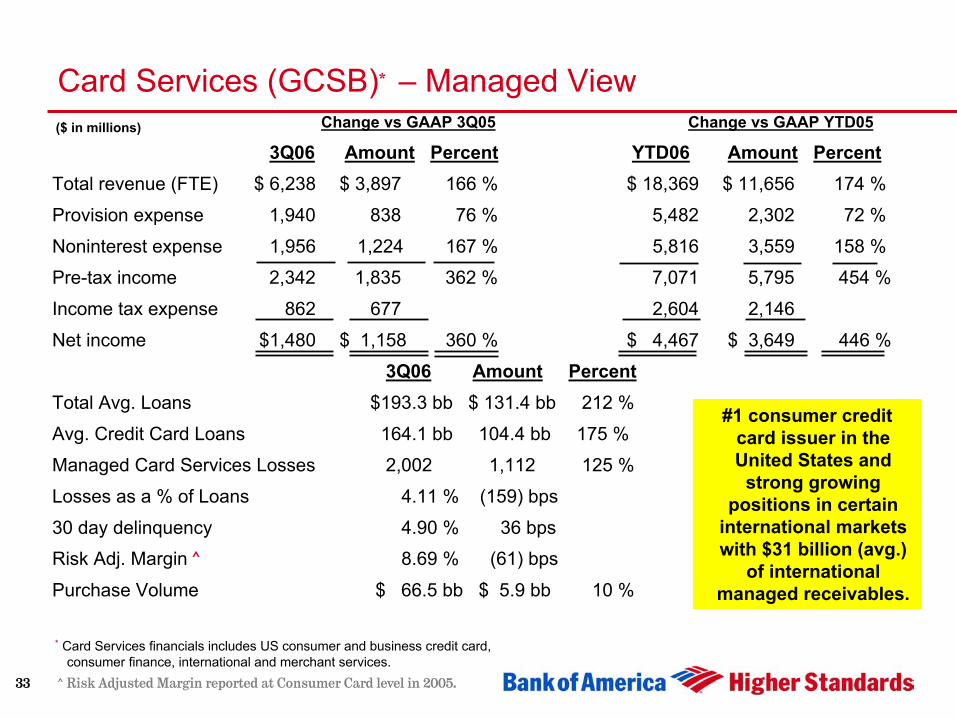
Card Services (GCSB)* – Managed ViewChange vs GAAP 3Q05 Change vs GAAP YTD05
3Q06 Amount Percent YTD06 Amount PercentTotal revenue (FTE) $ 6,238 $ 3,897 166 % $ 18,369 $ 11,656 174 %
Provision expense 1,940 838 76 % 5,482 2,302 72 %
Noninterest expense 1,956 1,224 167 % 5,816 3,559 158 %
Pre-tax income 2,342 1,835 362 % 7,071 5,795 454 %
Income tax expense 862 677 2,604 2,146
Net income $1,480 $ 1,158 360 % $ 4,467 $ 3,649 446 %
3Q06 Amount PercentTotal Avg. Loans $193.3 bb $ 131.4 bb 212 %
Avg. Credit Card Loans 164.1 bb 104.4 bb 175 %
Managed Card Services Losses 2,002 1,112 125 %
Losses as a % of Loans 4.11 % (159) bps
30 day delinquency 4.90 % 36 bps
Risk Adj. Margin ^ 8.69 % (61) bps
Purchase Volume $ 66.5 bb $ 5.9 bb 10 %
#1 consumer credit card issuer in the United States and
strong growing positions in certain
international markets with $31 billion (avg.)
of international managed receivables.
* Card Services financials includes US consumer and business credit card, consumer finance, international and merchant services.
($ in millions)
34
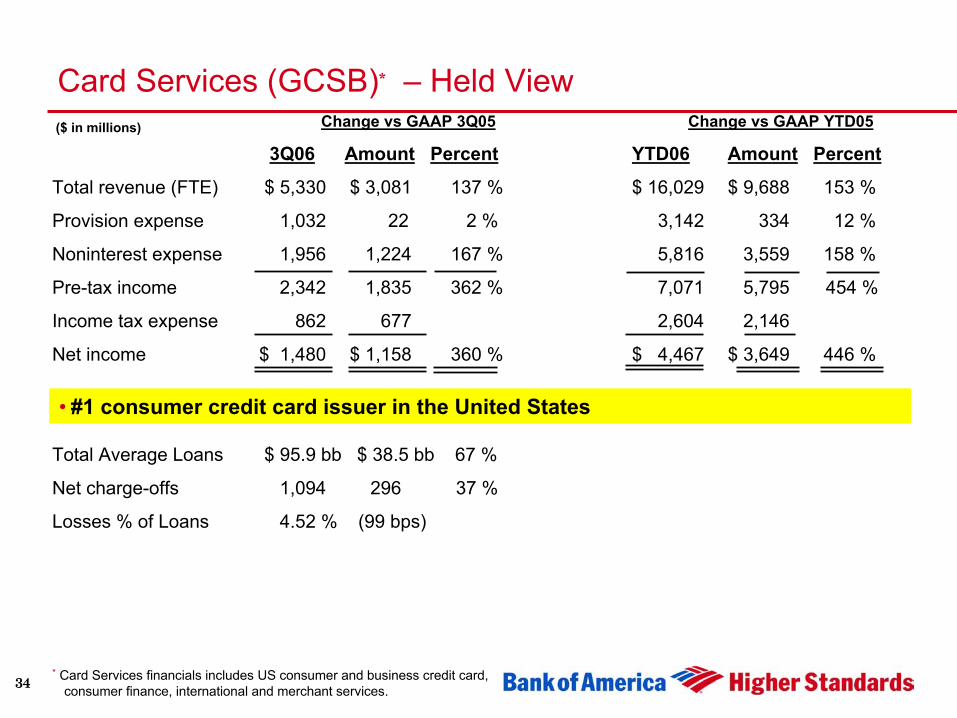
Card Services (GCSB)* – Held ViewChange vs GAAP 3Q05 Change vs GAAP YTD05
3Q06 Amount Percent YTD06 Amount Percent
Total revenue (FTE) $ 5,330 $ 3,081 137 % $ 16,029 $ 9,688 153 %
Provision expense 1,032 22 2 % 3,142 334 12 %
Noninterest expense 1,956 1,224 167 % 5,816 3,559 158 %
Pre-tax income 2,342 1,835 362 % 7,071 5,795 454 %
Income tax expense 862 677 2,604 2,146
Net income $ 1,480 $ 1,158 360 % $ 4,467 $ 3,649 446 %
Total Average Loans $ 95.9 bb $ 38.5 bb 67 %
Net charge-offs 1,094 296 37 %
Losses % of Loans 4.52 % (99 bps)
• #1 consumer credit card issuer in the United States
* Card Services financials includes US consumer and business credit card, consumer finance, international and merchant services.
($ in millions)
35
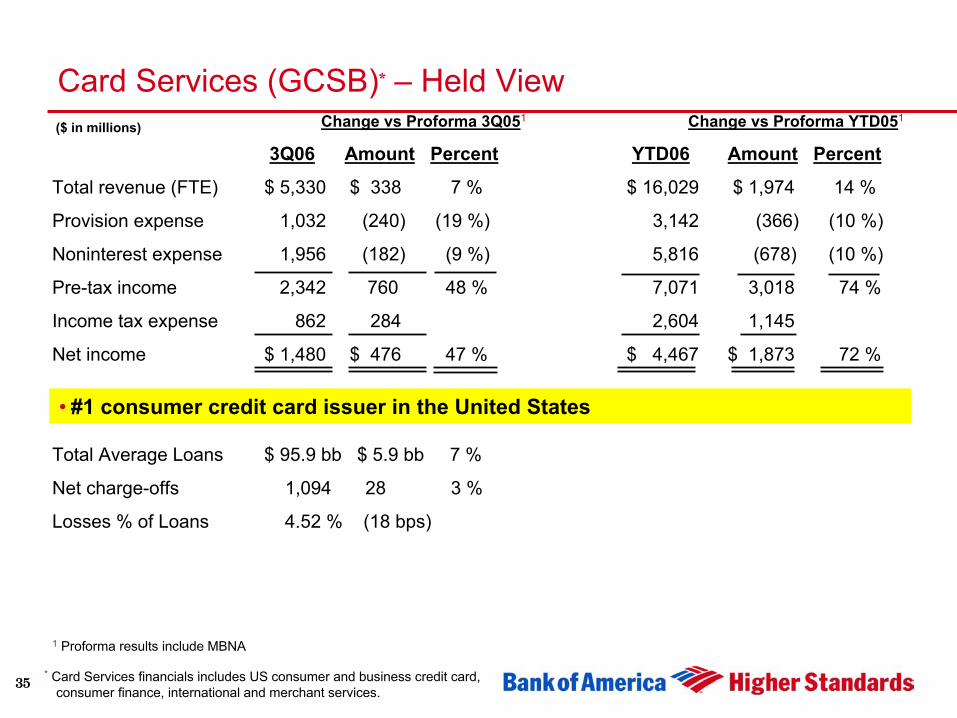
Card Services (GCSB)* – Held ViewChange vs Proforma 3Q051 Change vs Proforma YTD051
3Q06 Amount Percent YTD06 Amount Percent
Total revenue (FTE) $ 5,330 $ 338 7 % $ 16,029 $ 1,974 14 %
Provision expense 1,032 (240) (19 %) 3,142 (366) (10 %)
Noninterest expense 1,956 (182) (9 %) 5,816 (678) (10 %)
Pre-tax income 2,342 760 48 % 7,071 3,018 74 %
Income tax expense 862 284 2,604 1,145
Net income $ 1,480 $ 476 47 % $ 4,467 $ 1,873 72 %
Total Average Loans $ 95.9 bb $ 5.9 bb 7 %
Net charge-offs 1,094 28 3 %
Losses % of Loans 4.52 % (18 bps)
• #1 consumer credit card issuer in the United States
1 Proforma results include MBNA
* Card Services financials includes US consumer and business credit card, consumer finance, international and merchant services.
($ in millions)
36
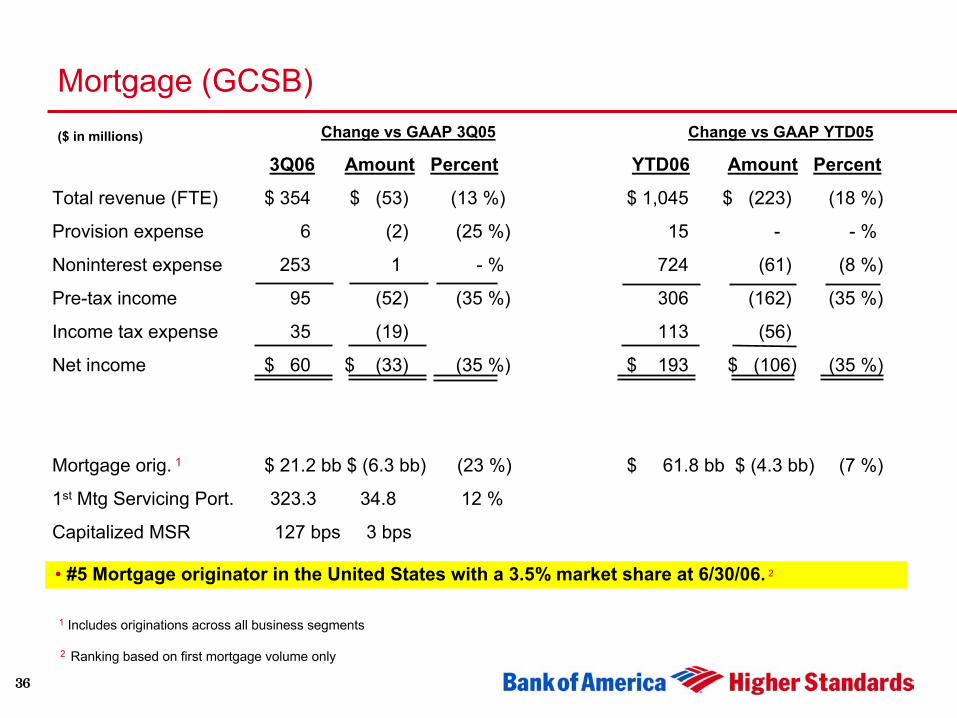
Mortgage (GCSB)Change vs GAAP 3Q05 Change vs GAAP YTD05
3Q06 Amount Percent YTD06 Amount Percent
Total revenue (FTE) $ 354 $ (53) (13 %) $ 1,045 $ (223) (18 %)
Provision expense 6 (2) (25 %) 15 - - %
Noninterest expense 253 1 - % 724 (61) (8 %)
Pre-tax income 95 (52) (35 %) 306 (162) (35 %)
Income tax expense 35 (19) 113 (56)
Net income $ 60 $ (33) (35 %) $ 193 $ (106) (35 %)
Mortgage orig. 1 $ 21.2 bb $ (6.3 bb) (23 %) $ 61.8 bb $ (4.3 bb) (7 %)
1st Mtg Servicing Port. 323.3 34.8 12 %
Capitalized MSR 127 bps 3 bps
($ in millions)
• #5 Mortgage originator in the United States with a 3.5% market share at 6/30/06. 2
1 Includes originations across all business segments
2 Ranking based on first mortgage volume only
37
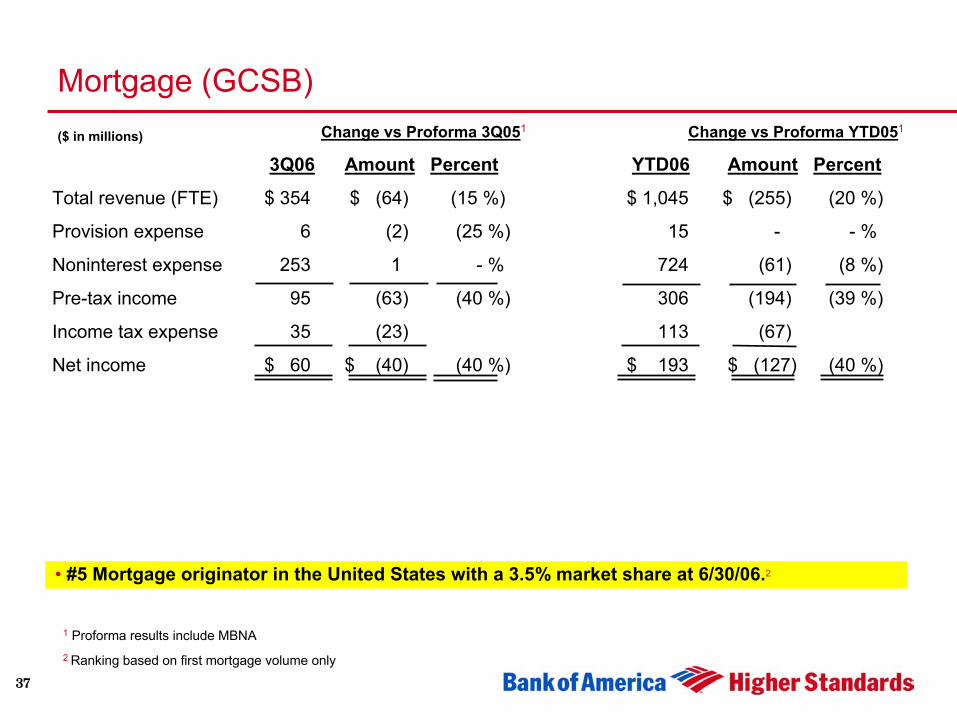
Mortgage (GCSB)Change vs Proforma 3Q051 Change vs Proforma YTD051
3Q06 Amount Percent YTD06 Amount Percent
Total revenue (FTE) $ 354 $ (64) (15 %) $ 1,045 $ (255) (20 %)
Provision expense 6 (2) (25 %) 15 - - %
Noninterest expense 253 1 - % 724 (61) (8 %)
Pre-tax income 95 (63) (40 %) 306 (194) (39 %)
Income tax expense 35 (23) 113 (67)
Net income $ 60 $ (40) (40 %) $ 193 $ (127) (40 %)
($ in millions)
• #5 Mortgage originator in the United States with a 3.5% market share at 6/30/06.2
1 Proforma results include MBNA2 Ranking based on first mortgage volume only
38
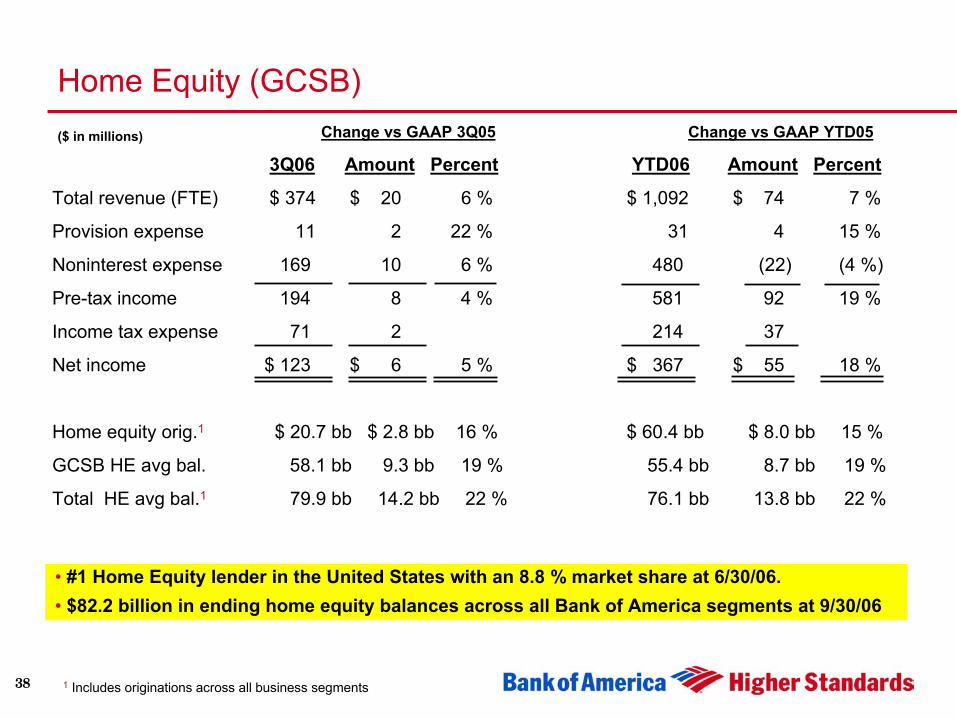
Home Equity (GCSB)Change vs GAAP 3Q05 Change vs GAAP YTD05
3Q06 Amount Percent YTD06 Amount Percent
Total revenue (FTE) $ 374 $ 20 6 % $ 1,092 $ 74 7 %
Provision expense 11 2 22 % 31 4 15 %
Noninterest expense 169 10 6 % 480 (22) (4 %)
Pre-tax income 194 8 4 % 581 92 19 %
Income tax expense 71 2 214 37
Net income $ 123 $ 6 5 % $ 367 $ 55 18 %
Home equity orig.1 $ 20.7 bb $ 2.8 bb 16 % $ 60.4 bb $ 8.0 bb 15 %
GCSB HE avg bal. 58.1 bb 9.3 bb 19 % 55.4 bb 8.7 bb 19 %
Total HE avg bal.1 79.9 bb 14.2 bb 22 % 76.1 bb 13.8 bb 22 %
($ in millions)
• #1 Home Equity lender in the United States with an 8.8 % market share at 6/30/06.• $82.2 billion in ending home equity balances across all Bank of America segments at 9/30/06
1 Includes originations across all business segments
39
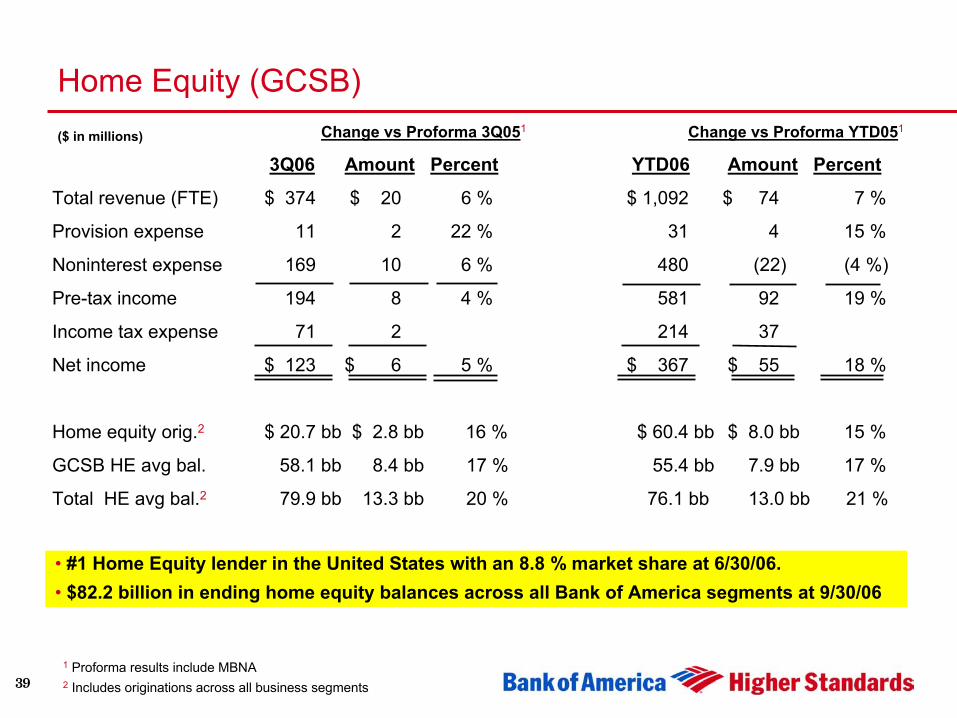
Home Equity (GCSB)Change vs Proforma 3Q051 Change vs Proforma YTD051
3Q06 Amount Percent YTD06 Amount Percent
Total revenue (FTE) $ 374 $ 20 6 % $ 1,092 $ 74 7 %
Provision expense 11 2 22 % 31 4 15 %
Noninterest expense 169 10 6 % 480 (22) (4 %)
Pre-tax income 194 8 4 % 581 92 19 %
Income tax expense 71 2 214 37
Net income $ 123 $ 6 5 % $ 367 $ 55 18 %
Home equity orig.2 $ 20.7 bb $ 2.8 bb 16 % $ 60.4 bb $ 8.0 bb 15 %
GCSB HE avg bal. 58.1 bb 8.4 bb 17 % 55.4 bb 7.9 bb 17 %
Total HE avg bal.2 79.9 bb 13.3 bb 20 % 76.1 bb 13.0 bb 21 %
($ in millions)
• #1 Home Equity lender in the United States with an 8.8 % market share at 6/30/06.• $82.2 billion in ending home equity balances across all Bank of America segments at 9/30/06
2 Includes originations across all business segments
1 Proforma results include MBNA
40
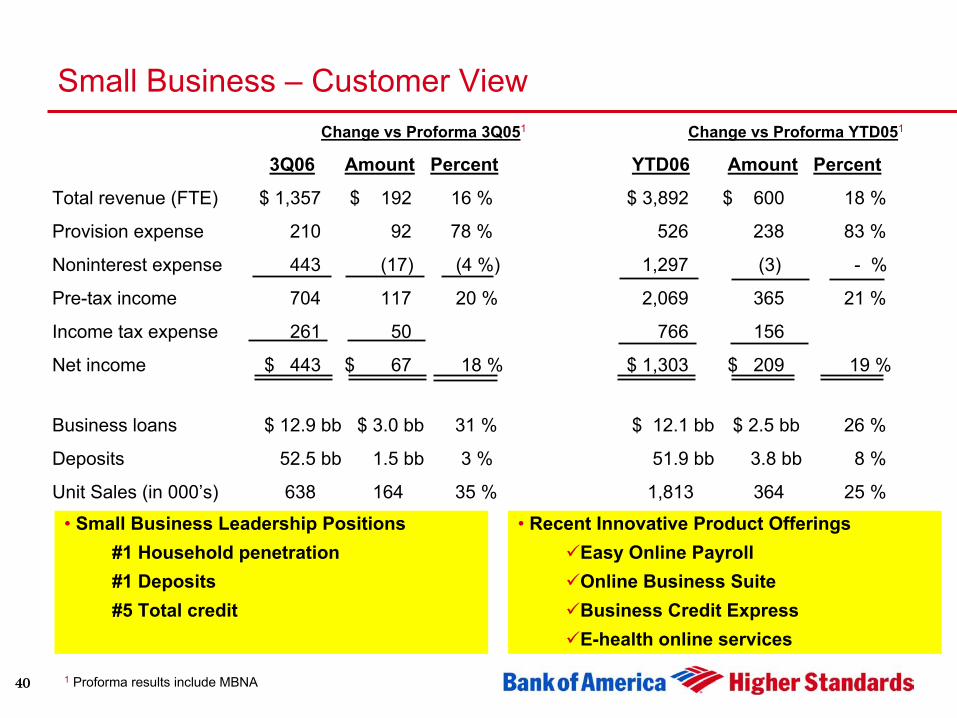
Small Business – Customer ViewChange vs Proforma 3Q051 Change vs Proforma YTD051
3Q06 Amount Percent YTD06 Amount Percent
Total revenue (FTE) $ 1,357 $ 192 16 % $ 3,892 $ 600 18 %
Provision expense 210 92 78 % 526 238 83 %
Noninterest expense 443 (17) (4 %) 1,297 (3) - %
Pre-tax income 704 117 20 % 2,069 365 21 %
Income tax expense 261 50 766 156
Net income $ 443 $ 67 18 % $ 1,303 $ 209 19 %
Business loans $ 12.9 bb $ 3.0 bb 31 % $ 12.1 bb $ 2.5 bb 26 %
Deposits 52.5 bb 1.5 bb 3 % 51.9 bb 3.8 bb 8 %
Unit Sales (in 000’s) 638 164 35 % 1,813 364 25 %
• Small Business Leadership Positions#1 Household penetration#1 Deposits#5 Total credit
• Recent Innovative Product Offerings Easy Online PayrollOnline Business SuiteBusiness Credit ExpressE-health online services
1 Proforma results include MBNA
41
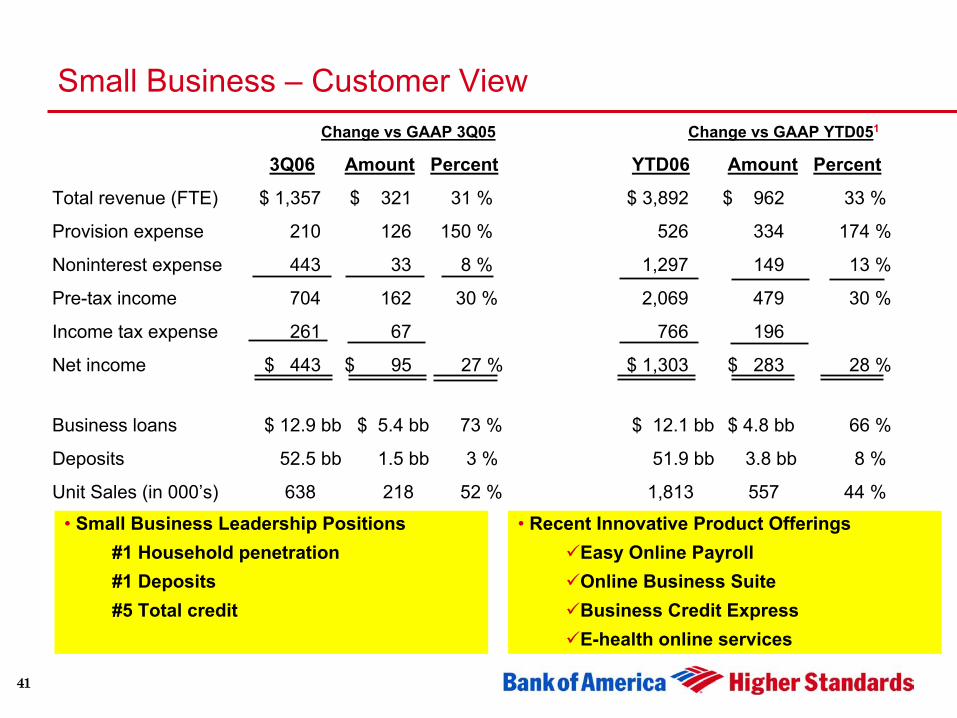
Small Business – Customer ViewChange vs GAAP 3Q05 Change vs GAAP YTD051
3Q06 Amount Percent YTD06 Amount Percent
Total revenue (FTE) $ 1,357 $ 321 31 % $ 3,892 $ 962 33 %
Provision expense 210 126 150 % 526 334 174 %
Noninterest expense 443 33 8 % 1,297 149 13 %
Pre-tax income 704 162 30 % 2,069 479 30 %
Income tax expense 261 67 766 196
Net income $ 443 $ 95 27 % $ 1,303 $ 283 28 %
Business loans $ 12.9 bb $ 5.4 bb 73 % $ 12.1 bb $ 4.8 bb 66 %
Deposits 52.5 bb 1.5 bb 3 % 51.9 bb 3.8 bb 8 %
Unit Sales (in 000’s) 638 218 52 % 1,813 557 44 %
• Small Business Leadership Positions#1 Household penetration#1 Deposits#5 Total credit
• Recent Innovative Product Offerings Easy Online PayrollOnline Business SuiteBusiness Credit ExpressE-health online services
42
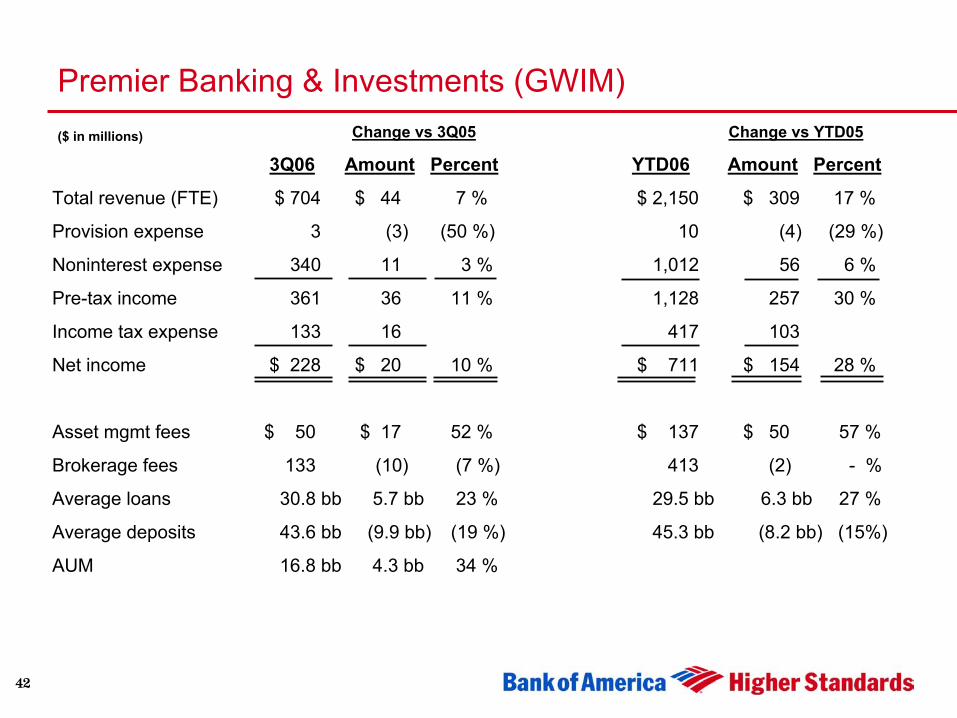
Premier Banking & Investments (GWIM)Change vs 3Q05 Change vs YTD05
3Q06 Amount Percent YTD06 Amount Percent
Total revenue (FTE) $ 704 $ 44 7 % $ 2,150 $ 309 17 %
Provision expense 3 (3) (50 %) 10 (4) (29 %)
Noninterest expense 340 11 3 % 1,012 56 6 %
Pre-tax income 361 36 11 % 1,128 257 30 %
Income tax expense 133 16 417 103
Net income $ 228 $ 20 10 % $ 711 $ 154 28 %
Asset mgmt fees $ 50 $ 17 52 % $ 137 $ 50 57 %
Brokerage fees 133 (10) (7 %) 413 (2) - %
Average loans 30.8 bb 5.7 bb 23 % 29.5 bb 6.3 bb 27 %
Average deposits 43.6 bb (9.9 bb) (19 %) 45.3 bb (8.2 bb) (15%)
AUM 16.8 bb 4.3 bb 34 %
($ in millions)
43
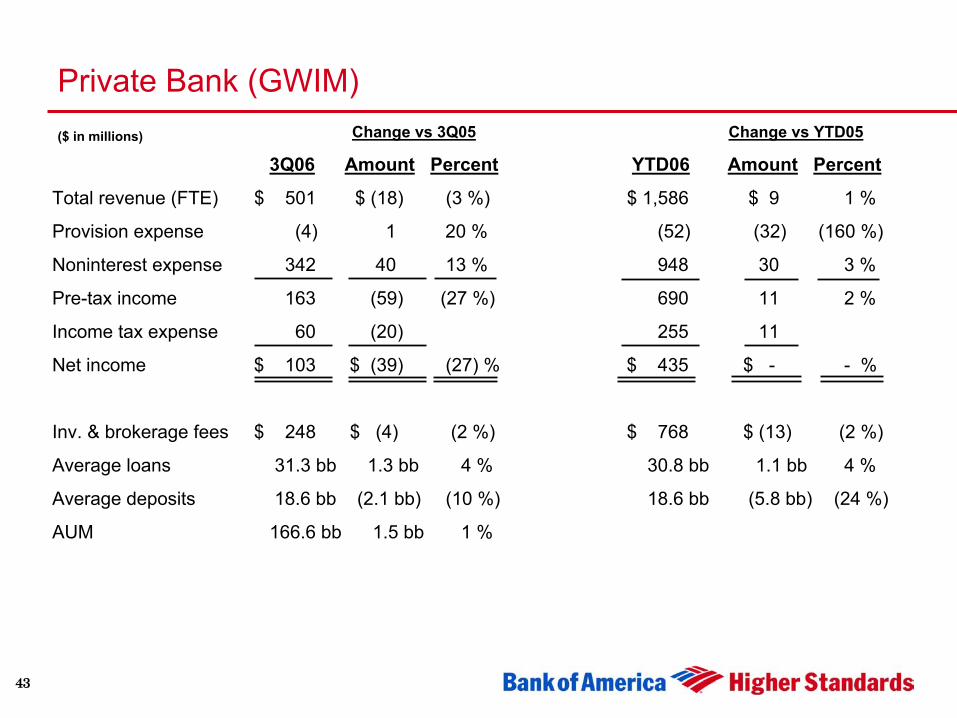
Private Bank (GWIM)Change vs 3Q05 Change vs YTD05
3Q06 Amount Percent YTD06 Amount Percent
Total revenue (FTE) $ 501 $ (18) (3 %) $ 1,586 $ 9 1 %
Provision expense (4) 1 20 % (52) (32) (160 %)
Noninterest expense 342 40 13 % 948 30 3 %
Pre-tax income 163 (59) (27 %) 690 11 2 %
Income tax expense 60 (20) 255 11
Net income $ 103 $ (39) (27) % $ 435 $ - - %
Inv. & brokerage fees $ 248 $ (4) (2 %) $ 768 $ (13) (2 %)
Average loans 31.3 bb 1.3 bb 4 % 30.8 bb 1.1 bb 4 %
Average deposits 18.6 bb (2.1 bb) (10 %) 18.6 bb (5.8 bb) (24 %)
AUM 166.6 bb 1.5 bb 1 %
($ in millions)
44
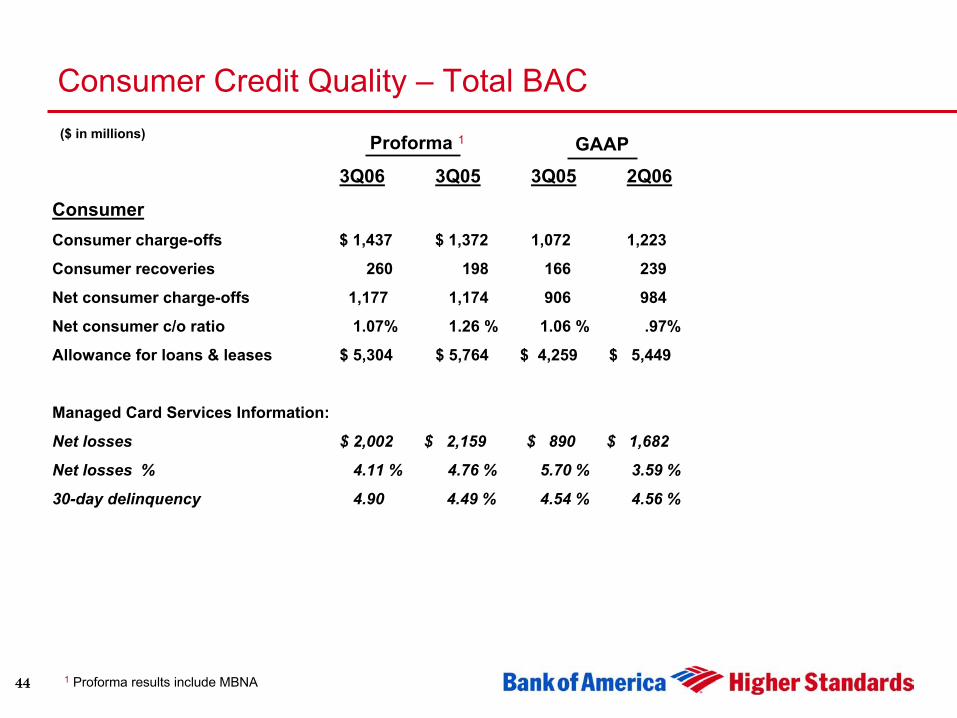
Consumer Credit Quality – Total BAC
3Q06 3Q05 3Q05 2Q06
ConsumerConsumer charge-offs $ 1,437 $ 1,372 1,072 1,223
Consumer recoveries 260 198 166 239
Net consumer charge-offs 1,177 1,174 906 984
Net consumer c/o ratio 1.07% 1.26 % 1.06 % .97%
Allowance for loans & leases $ 5,304 $ 5,764 $ 4,259 $ 5,449
Managed Card Services Information:
Net losses $ 2,002 $ 2,159 $ 890 $ 1,682
Net losses % 4.11 % 4.76 % 5.70 % 3.59 %
30-day delinquency 4.90 4.49 % 4.54 % 4.56 %
($ in millions) Proforma 1 GAAP
1 Proforma results include MBNA

45
3Q06 3Q05 2Q06
Commercial 1
Commercial charge-offs $ 200 $ 391 $ 184
Commercial recoveries 100 133 145
Net commercial charge-offs 100 258 39
Nonperforming assets 699 867 789
Criticized exposure 7,553 7,685 7,246
% of Utilized exposure 2.22% 2.54% 2.17%
Net commercial c/o ratio .17% .50% .07%
Allowance for loans & leases $ 3,568 $ 3,608 $ 3,631
Commercial Credit Quality – Total BAC
1 Periods presented prior to 1Q06 are on a proforma basis including commercial card impact from MBNA
($ in millions)