third quarter 2016 earnings release
TRANSCRIPT

Third Quarter 2016 Earnings Release
Cheil Worldwide
October 24th, 2016
The financial information in this document is consolidated earning results based on K-IFRS. This document is provided for investors’ information before FY 2016 3Q reviewed financial statements are released. The review outcomes may cause some parts of this document to be revised. This document contains “forward-looking statements” - that is, statements related to future, not past events. In this context, forward-looking statements often address our expected future business and financial performance, and often contain words such as “expects”, “anticipates”, “intends”, “plans”, “believes”, “seeks”, or “will”. Forward-looking statements by their nature address matters that are, to different degrees, uncertain. For us, particular uncertainties which could adversely or positively affect our future results include: the behavior of financial markets, including fluctuations in exchange rates, interest rates and commodity prices; strategic actions including dispositions and acquisitions. These uncertainties may cause our actual results to be materially different from those expressed in this document.
3
Financial Summary (K-IFRS consolidated) Consolidated Revenue Consolidated Operating Income 2016.3Q Business Performance 2016 Annual Outlook

2016.3Q YTD
2015.3Q YTD
Growth 2016.3Q 2015.3Q Growth
Revenue (Gross Profit)
718.5 683.7 5% 236.3 236.5 △0.1%
Operating Expense
623.5 590.3 6% 207.5 209.4 △1%
Operating Income
95.0 93.4 2% 28.8 27.1 6%
Non-operating Expenses and Income
2.2 10.3 △79% △1.1 1.6 -
Income Before Income Taxes
97.2 103.7 △6% 27.7 28.7 △4%
Net Income 68.6 69.5 △1% 25.5 17.8 43%
(KRW billion)
Financial Summary (K-IFRS consolidated)
* Income Before Income Taxes : Reflected sales of Samsung General Chemicals in 2015.2Q(KRW 3.6B)
5
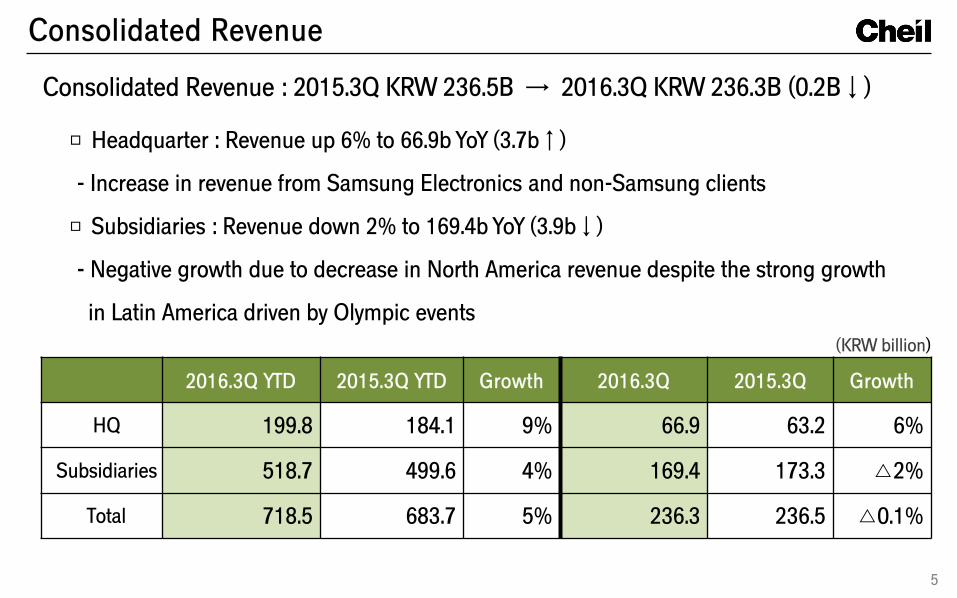
2016.3Q YTD 2015.3Q YTD Growth 2016.3Q 2015.3Q Growth
HQ 199.8 184.1 9% 66.9 63.2 6%
Subsidiaries 518.7 499.6 4% 169.4 173.3 △2%
Total 718.5 683.7 5% 236.3 236.5 △0.1%
Consolidated Revenue : 2015.3Q KRW 236.5B → 2016.3Q KRW 236.3B (0.2B↓)
Consolidated Revenue
□ Headquarter : Revenue up 6% to 66.9b YoY (3.7b↑)
- Increase in revenue from Samsung Electronics and non-Samsung clients
□ Subsidiaries : Revenue down 2% to 169.4b YoY (3.9b↓)
- Negative growth due to decrease in North America revenue despite the strong growth
in Latin America driven by Olympic events
(KRW billion)
6
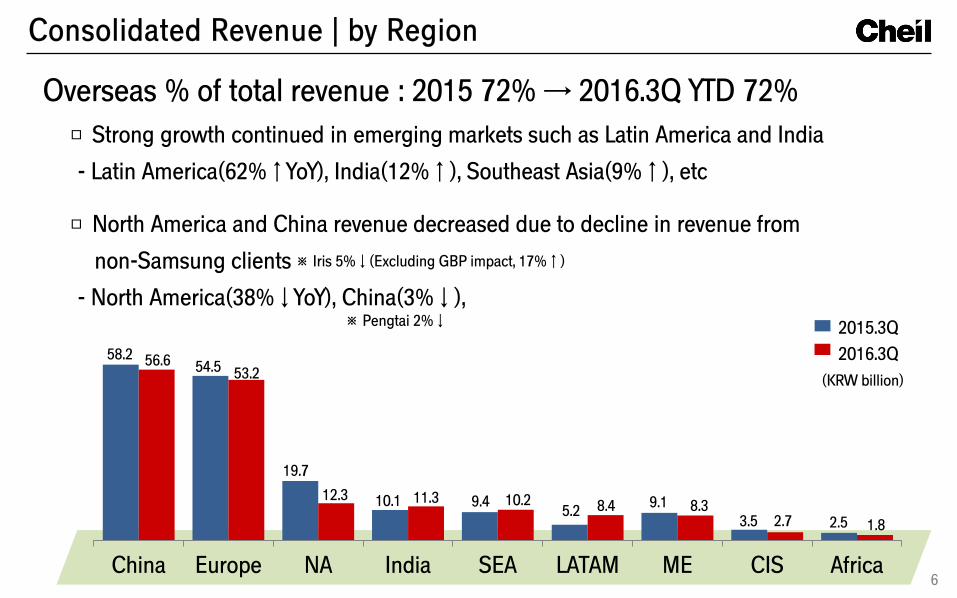
54.5 56.6 58.2 53.2
19.7
12.3 10.1 11.3 9.4 10.2 8.4 5.2 8.3 9.1 2.7 3.5 1.8 2.5
Consolidated Revenue | by Region
Overseas % of total revenue : 2015 72% → 2016.3Q YTD 72%
□ Strong growth continued in emerging markets such as Latin America and India
- Latin America(62%↑YoY), India(12%↑), Southeast Asia(9%↑), etc
□ North America and China revenue decreased due to decline in revenue from
non-Samsung clients
- North America(38%↓YoY), China(3%↓), 2015.3Q
2016.3Q
(KRW billion)
※ Pengtai 2%↓
※ Iris 5%↓(Excluding GBP impact, 17%↑)
China Europe NA India SEA LATAM ME CIS Africa
7
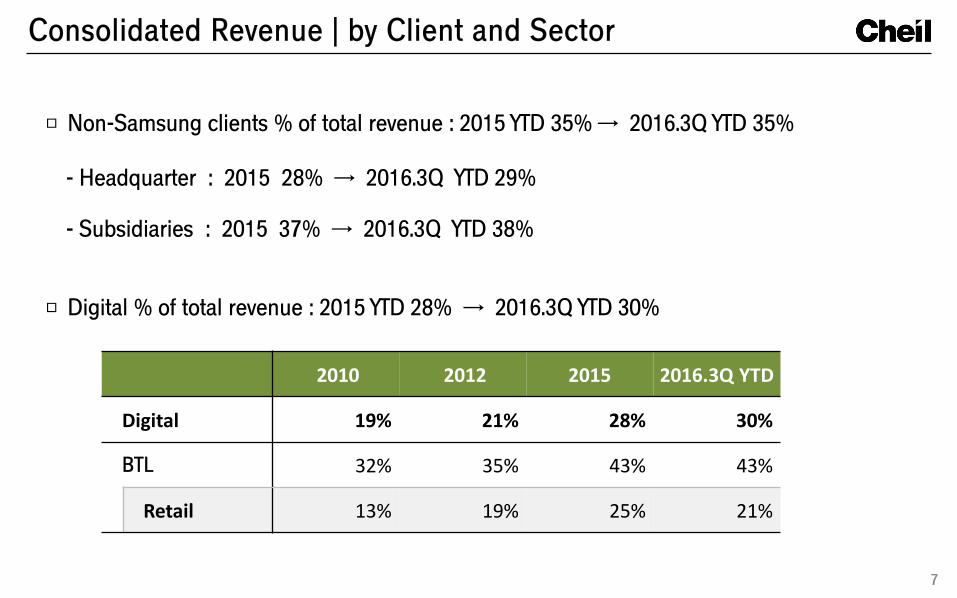
2010 2012 2015 2016.3Q YTD
Digital 19% 21% 28% 30%
BTL 32% 35% 43% 43%
Retail 13% 19% 25% 21%
□ Non-Samsung clients % of total revenue : 2015 YTD 35% → 2016.3Q YTD 35%
- Headquarter : 2015 28% → 2016.3Q YTD 29%
- Subsidiaries : 2015 37% → 2016.3Q YTD 38%
□ Digital % of total revenue : 2015 YTD 28% → 2016.3Q YTD 30%
Consolidated Revenue | by Client and Sector
8
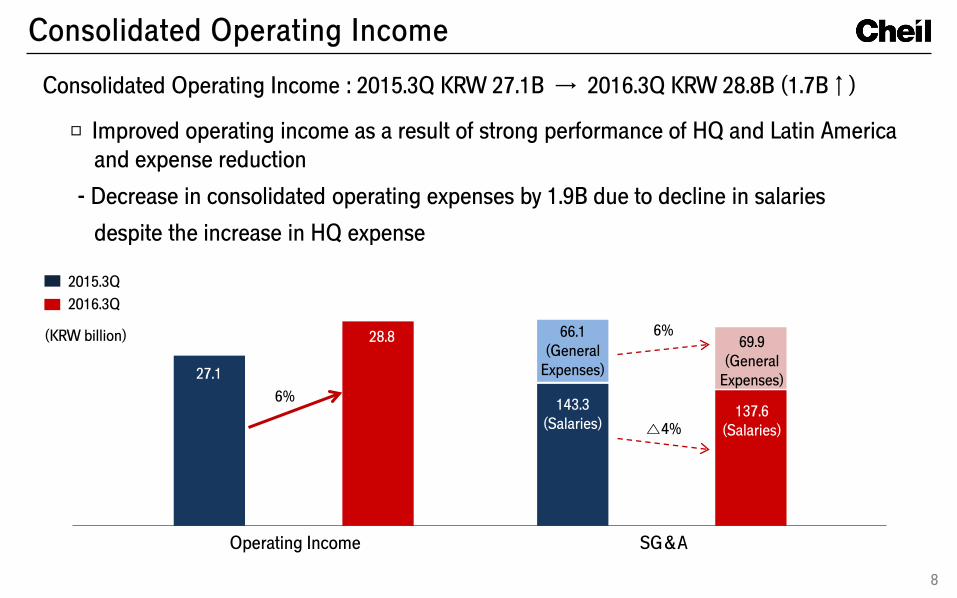
2015.3Q
2016.3Q
Operating Income SG&A
6%
28.8 66.1 (General
Expenses)
143.3 (Salaries)
137.6 (Salaries)
69.9 (General
Expenses)
△4%
27.1
6%
Consolidated Operating Income
□ Improved operating income as a result of strong performance of HQ and Latin America and expense reduction
- Decrease in consolidated operating expenses by 1.9B due to decline in salaries
despite the increase in HQ expense
Consolidated Operating Income : 2015.3Q KRW 27.1B → 2016.3Q KRW 28.8B (1.7B↑)
(KRW billion)
9
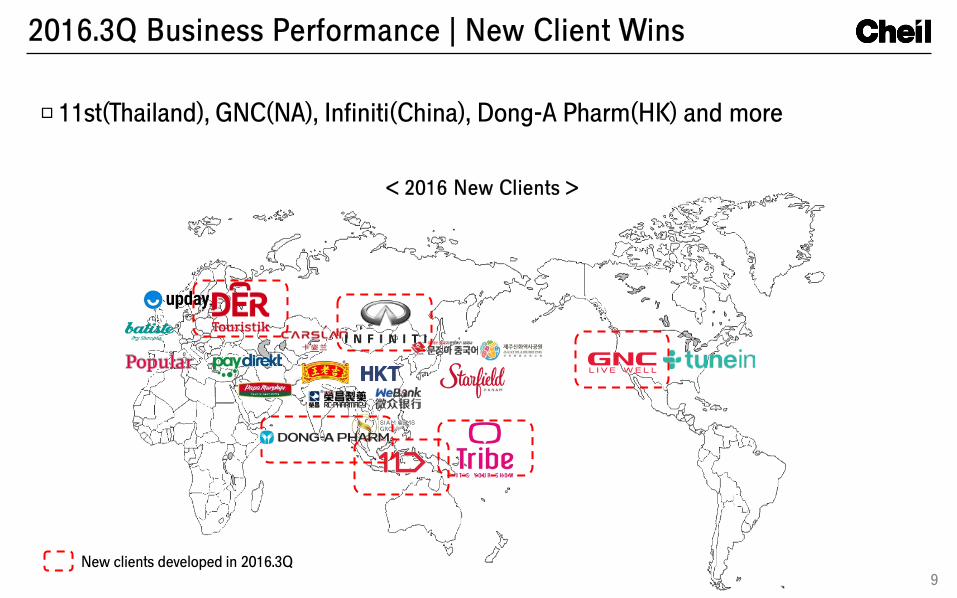
□11st(Thailand), GNC(NA), Infiniti(China), Dong-A Pharm(HK) and more
< 2016 New Clients >
New clients developed in 2016.3Q
2016.3Q Business Performance | New Client Wins
10
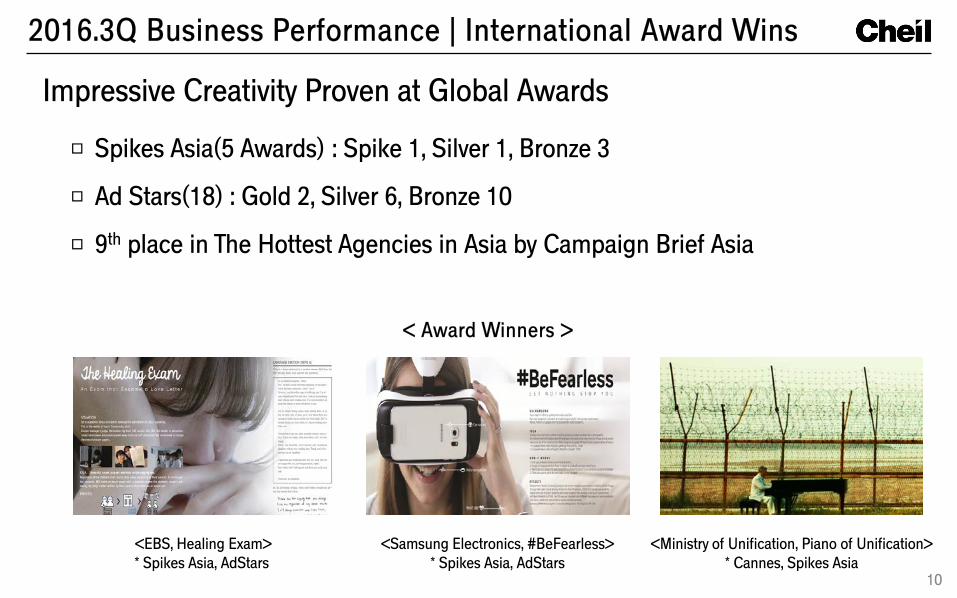
□ Spikes Asia(5 Awards) : Spike 1, Silver 1, Bronze 3
□ Ad Stars(18) : Gold 2, Silver 6, Bronze 10
□ 9th place in The Hottest Agencies in Asia by Campaign Brief Asia
<EBS, Healing Exam> * Spikes Asia, AdStars
<Samsung Electronics, #BeFearless> * Spikes Asia, AdStars
<Ministry of Unification, Piano of Unification> * Cannes, Spikes Asia
2016.3Q Business Performance | International Award Wins
Impressive Creativity Proven at Global Awards
< Award Winners >
11
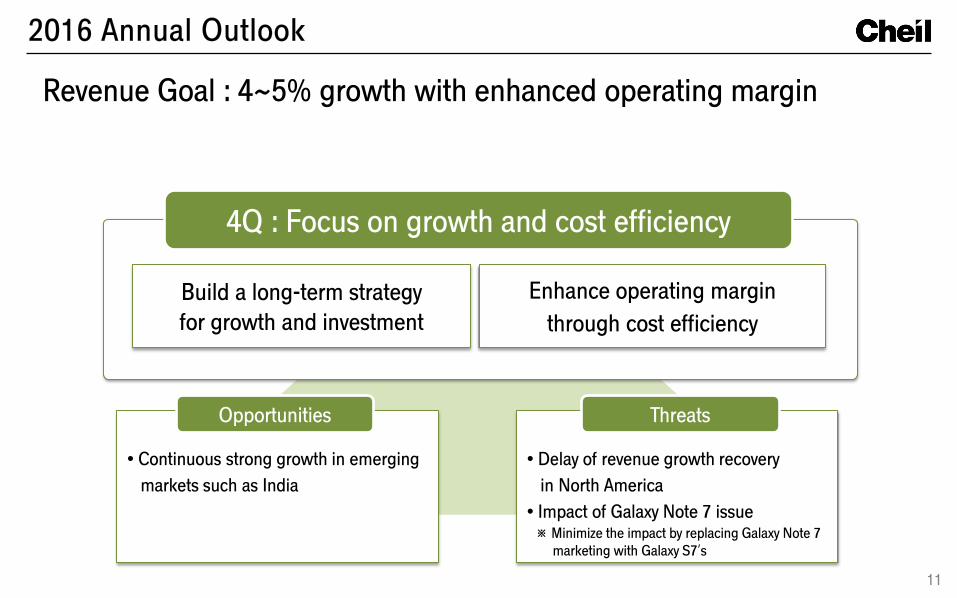
Revenue Goal : 4~5% growth with enhanced operating margin
4Q : Focus on growth and cost efficiency
Build a long-term strategy
for growth and investment
Enhance operating margin
through cost efficiency
• Continuous strong growth in emerging
markets such as India
Opportunities Threats
• Delay of revenue growth recovery
in North America
• Impact of Galaxy Note 7 issue ※ Minimize the impact by replacing Galaxy Note 7 marketing with Galaxy S7’s
2016 Annual Outlook

12
Thank you