impax third-quarter-2016-earnings-call
TRANSCRIPT

1
Third Quarter 2016 Financial Results and Business Update
November 9, 2016

2
Impax Cautionary Statement Regarding Forward Looking Statements
"Safe Harbor" statement under the Private Securities Litigation Reform Act of 1995:
To the extent any statements made in this presentation contain information that is not historical; these statements are forward-looking in natureand express the beliefs and expectations of management. Such statements are based on current expectations and involve a number of knownand unknown risks and uncertainties that could cause the Company’s future results, performance, or achievements to differ significantly fromthe results, performance, or achievements expressed or implied by such forward-looking statements. Such risks and uncertainties include, butare not limited to: fluctuations in revenues and operating income; the Company’s ability to successfully develop and commercializepharmaceutical products in a timely manner; reductions or loss of business with any significant customer; the substantial portion of theCompany’s total revenues derived from sales of a limited number of products; the impact of consolidation of the Company’s customer base; theimpact of competition; the Company’s ability to sustain profitability and positive cash flows; any delays or unanticipated expenses in connectionwith the operation of the Company’s manufacturing facilities; the effect of foreign economic, political, legal, and other risks on the Company’soperations abroad; the uncertainty of patent litigation and other legal proceedings; the increased government scrutiny on the Company’sagreements with brand pharmaceutical companies; product development risks and the difficulty of predicting FDA filings and approvals;consumer acceptance and demand for new pharmaceutical products; the impact of market perceptions of the Company and the safety andquality of the Company’s products; the Company’s determinations to discontinue the manufacture and distribution of certain products; theCompany’s ability to achieve returns on its investments in research and development activities; changes to FDA approval requirements ; theCompany’s ability to successfully conduct clinical trials; the Company’s reliance on third parties to conduct clinical trials and testing; theCompany’s lack of a license partner for commercialization of NUMIENT™ (IPX066) outside of the United States; impact of illegal distributionand sale by third parties of counterfeits or stolen products; the availability of raw materials and impact of interruptions in the Company’s supplychain; the Company’s policies regarding returns, allowances and chargebacks; the use of controlled substances in the Company’s products; theeffect of current economic conditions on the Company’s industry, business, results of operations and financial condition; disruptions or failuresin the Company’s information technology systems and network infrastructure caused by third party breaches or other events; the Company’sreliance on alliance and collaboration agreements; the Company’s reliance on licenses to proprietary technologies; the Company’s dependenceon certain employees; the Company’s ability to comply with legal and regulatory requirements governing the healthcare industry; the regulatoryenvironment; the effect of certain provisions in the Company’s government contracts; the Company’s ability to protect its intellectual property;exposure to product liability claims; risks relating to goodwill and intangibles; changes in tax regulations; the Company’s ability to managegrowth, including through potential acquisitions and investments; risks related to the Company’s acquisitions of or investments in technologies,products or businesses; the restrictions imposed by the Company’s credit facility and indenture; the Company’s level of indebtedness andliabilities and the potential impact on cash flow available for operations; uncertainties involved in the preparation of the Company’s financialstatements; the Company’s ability to maintain an effective system of internal control over financial reporting; the effect of terrorist attacks on theCompany’s business; the location of the Company’s manufacturing and research and development facilities near earthquake fault lines;expansion of social media platforms and other risks described in the Company’s periodic reports filed with the Securities and ExchangeCommission. Forward-looking statements speak only as to the date on which they are made, and the Company undertakes no obligation toupdate publicly or revise any forward-looking statement, regardless of whether new information becomes available, future developments occuror otherwise.
Trademarks referenced herein are the property of their respective owners.©2016 Impax Laboratories, Inc. All Rights Reserved.

3
Agenda
• 3Q16 Financial Results
• Business Update
Fred Wilkinson
President & CEO
• 3Q16 Financial Review
• 2016 Financial Guidance Update
Bryan Reasons
SVP & CFO
• Q&AExecutive Team

44
3Q16 Results and Business UpdateFred Wilkinson
President & Chief Executive Officer

5
• Quarter results essentially in line with our expectations
› Marketing and operational strategies drove revenue growth of 112% in
Epinephrine Auto-Injector and oxymorphone compared to 3Q15
› Recapturing generic Adderall XR® share but at significantly lower price
› Launched 3 generic products
• Short-term Albenza® supply interruption impacted Specialty Division results
• Increased intensity of generic pricing impacting a number of products
• Post Teva Transaction close:
› Higher price concessions to retain key customers
› Reduced price due to competition
› Lower expected cash flows triggered a non-cash impairment charge
3Q16 and Recent Market Events

6
Impax Year Over Year Change in Generic Volume and Price
Total Generics excluding Teva Transaction
3Q15 4Q15 1Q16 2Q16 3Q16
Volume 27% 106% 53% (11%) 5%
Price (3%) (13%) (21%) (19%) (15%)
gSolaraze® (Diclofenac sodium gel 3%); gSkelaxin® (Metaxalone)
Excluding generic Solaraze® , generic Skelaxin® and Teva Transaction
3Q15 4Q15 1Q16 2Q16 3Q16
Volume (4%) 12% 4% (11%) 18%
Price (4%) (3%) (6%) (4%) (4%)
Teva Transaction
Experienced aggressive competition/repricing resulting in 35% price decline after deal close compared to plan
Defending share but pricing unfavorable

7
Segment Revenue Results
$175 $181
$53 $40
3Q16 3Q15
Third Quarter $ millions
Generic
• 112% increase in sales of epinephrine auto injector (authorized generic to Adrenaclick®) and oxymorphone
• 62% decline in sales of generics Solaraze®, Skelaxin® and Adderall XR® due to significant decline in price and volume
• Approximately 7 weeks of sales from products acquired from Teva/Allergan and 3 new product launches
Brand
• 52% increase in Rytary®
• 68% increase in Zomig® nasal spray
• Albenza® supply disruption from third-party manufacturer resolved in September
Generic
• 113% increase in sales of epinephrine auto injector (authorized generic to Adrenaclick®) and oxymorphone
• 49% decline in sales of generics Skelaxin® and Adderall XR® due to significant decline in price and volume
• Approximately 7 weeks of sales from products acquired from Teva/Allergan and 6 new product launches
Brand
• 96% increase in Rytary®
• 20% increase in Zomig® nasal spray
• 59% increase in Albenza®
• Launched Emverm®
Nine Months Ended $ millions
Revenue Commentary
Revenue Commentary
$228 $221
$467 $484
$159 $94
Sep-16 Sep-15
$626$578
Specialty
up 30.1%
Generic
down 3.0%
Specialty
up 68.5%
Generic
down 3.5%
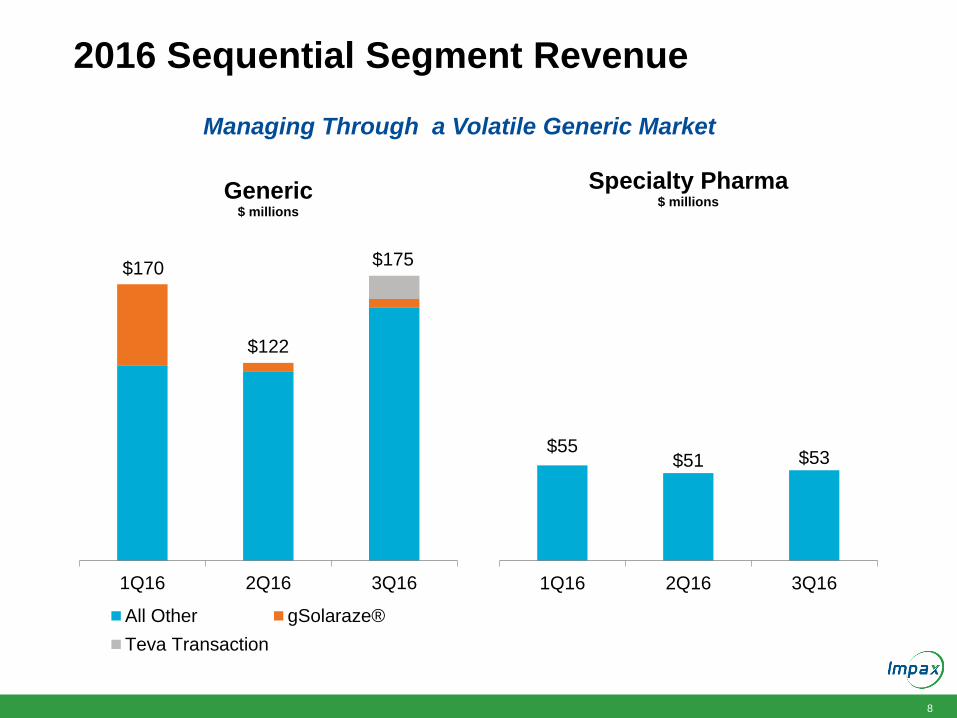
8
2016 Sequential Segment Revenue
1Q16 2Q16 3Q16
Generic$ millions
All Other gSolaraze®
Teva Transaction
$55$51 $53
1Q16 2Q16 3Q16
Specialty Pharma$ millions
$170
$122
$175
Managing Through a Volatile Generic Market

9
Growing Epinephrine Auto-Injector
0%
1%
2%
3%
4%
5%
6%
7%
8%
9%
10%
Share Growth in 2016
4%
9%
• Continuing to expand production/supply
• Strong performance during peak seasonal demand
• Exceeding 2016 goal of 1% share growth per quarter
• Awareness campaign “The GO-TO-CHOICE”
› Media, website, physicians, pharmacies
• Exhibiting at physician conferences, for example
› American College Asthma, Allergy & Immunology Conference, November 10-14
IMS NPA Weekly Oct 21, 2016

10
Growing Oxymorphone / Recaptured Generic Adderall XR® - Share Growth in 2016
0%
10%
20%
30%
40%
50%
60%
20
16/0
1/0
1
20
16/0
1/1
5
20
16/0
1/2
9
20
16/0
2/1
2
20
16/0
2/2
6
20
16/0
3/1
1
20
16/0
3/2
5
20
16/0
4/0
8
20
16/0
4/2
2
20
16/0
5/0
6
20
16/0
5/2
0
20
16/0
6/0
3
20
16/0
6/1
7
20
16/0
7/0
1
20
16/0
7/1
5
20
16/0
7/2
9
20
16/0
8/1
2
20
16/0
8/2
6
20
16/0
9/0
9
20
16/0
9/2
3
20
16/1
0/0
7
20
16/1
0/2
1
Oxymorphone ER
5, 10, 20, 30, 40 mg 7.5 & 15 mg
0%
2%
4%
6%
8%
10%
12%
20
16/0
1/0
1
20
16/0
1/1
5
20
16/0
1/2
9
20
16/0
2/1
2
20
16/0
2/2
6
20
16/0
3/1
1
20
16/0
3/2
5
20
16/0
4/0
8
20
16/0
4/2
2
20
16/0
5/0
6
20
16/0
5/2
0
20
16/0
6/0
3
20
16/0
6/1
7
20
16/0
7/0
1
20
16/0
7/1
5
20
16/0
7/2
9
20
16/0
8/1
2
20
16/0
8/2
6
20
16/0
9/0
9
20
16/0
9/2
3
20
16/1
0/0
7
20
16/1
0/2
1
Generic Adderall XR®
IMS NPA Weekly Oct 21, 2016
34%
45%
47%
56%
10%
7%

11
Status of Generic Product Launches in 2016
Source of sales data: IMS NPS Sep 2016;
Launch/Approval data as of Nov 4, 2016;
TA = Tentative Approval
U.S. Brand/Generic market sales of $5.3B
Progress of Targeted Launches Products Launched through October
Products Approved Launched
Oxycodone TR ER tablet (OxyContin®)Authorized
GenericMarch
Amphetamine Salts ER capsule (Adderall
XR®) – Impax ANDAFebruary 2016 April
Glyburide IR tablet (Diabeta®) September 2015 June
Methyltestosterone IR tablets(Android®) October 1974 August
Phenytoin chewable tablet (Dilantin®) November 2014 September
Methylphenidate ER capsules
(Metadate CD®)July 2016 September
Additional FDA Approvals in 2016
Ezetimibe and simvastatin tablet (Vytorin®) TA – January April 2017 (1)
Amphetamine Salts ER capsule (Adderall
XR®) – CorePharma ANDATA – April NA (2)
Morphine Sulfate ER capsule (Kadian®) April TBD
Morphine Sulfate ER tablet
(MS-Contin®)July TBD
Fenofibric Acid DR capsule (Trilipix®) September TBD (3)
Aspirin and dipyridamole ER capsule
(Aggrenox®)TA –September
January
2017
Desipramine Hydrochloride Tablets
(Norpramin®)October TBD
2 21
1 1
1
2
1H16A 3Q16A 4Q16E
Pending FDA Approval
2016 Approval
Pre 2016 Approval Not Yet Launched or Re-introduction
3 products
launched
3 products
launched
Targeting
up to 4
product
launches
(1) Assuming receipt of final FDA approval launch following patent expiration in April 2017
(2) Launched Hayward ANDA
(3) Launched AG
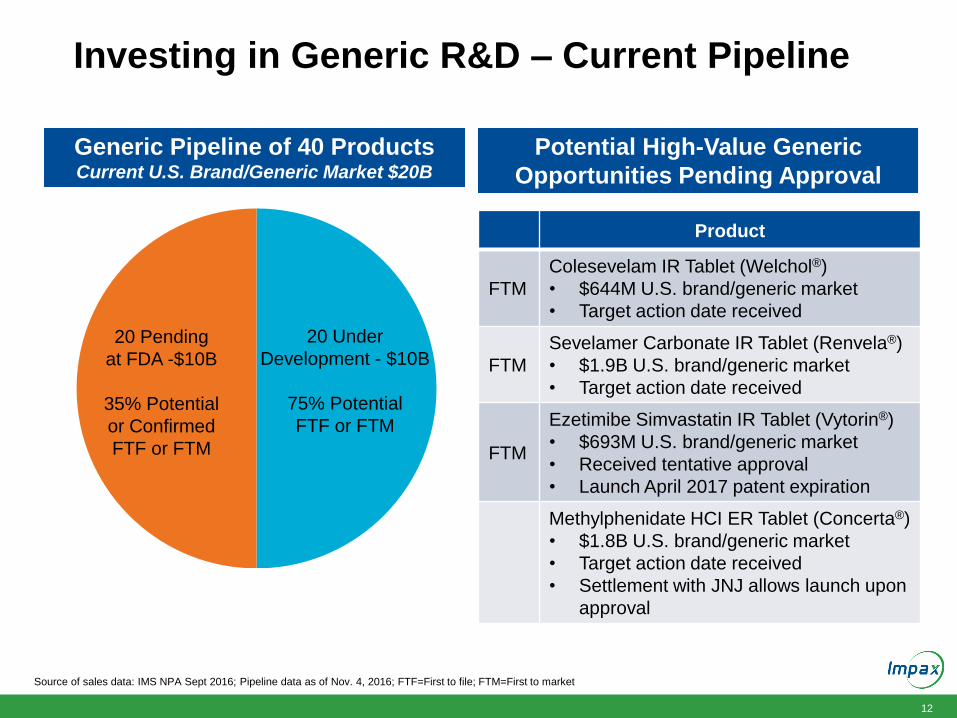
12
Investing in Generic R&D – Current Pipeline
Source of sales data: IMS NPA Sept 2016; Pipeline data as of Nov. 4, 2016; FTF=First to file; FTM=First to market
Generic Pipeline of 40 Products Current U.S. Brand/Generic Market $20B
20 Pending
at FDA -$10B
35% Potential
or Confirmed
FTF or FTM
20 Under
Development - $10B
75% Potential
FTF or FTM
Potential High-Value Generic
Opportunities Pending Approval
Product
FTM
Colesevelam IR Tablet (Welchol®)
• $644M U.S. brand/generic market
• Target action date received
FTM
Sevelamer Carbonate IR Tablet (Renvela®)
• $1.9B U.S. brand/generic market
• Target action date received
FTM
Ezetimibe Simvastatin IR Tablet (Vytorin®)
• $693M U.S. brand/generic market
• Received tentative approval
• Launch April 2017 patent expiration
Methylphenidate HCI ER Tablet (Concerta®)
• $1.8B U.S. brand/generic market
• Target action date received
• Settlement with JNJ allows launch upon
approval

13
Focused on Growing CNS Franchise
0.0%
1.0%
2.0%
3.0%
0
2,000
4,000
6,000
8,000
10,000
12,000
14,000
CD
LD
Sh
are
TR
x
Monthly TRx and Share of National CD-LD TRx Since Launch
Rytary TRx CD-LD Share
• Completed sales force expansion and remapped territories in June
• Redefined clinical and dosage messaging
• Launched myRytary Patient Support Program www.myrytary.com
• 3Q16 TRx’s up 65% compared to 3Q15
• 88% of commercial Rx and Medicare Part D Rx being approved
Source: IMS NPA Monthly Sept 2016

14
Rytary® Patient Support Program

15
Focused on Growing CNS Franchise
0%
25%
50%
2,000
4,000
6,000
8,000
10,000
12,000
14,000
Nov-15 Dec-15 Jan-16 Feb-16 Mar-16 Apr-16 May-16 Jun-16 Jul-16 Aug-16 Sep-16 Oct-16
Nasal
Tri
pta
nS
hare
TR
x
Monthly TRx and Share of Nasal Triptan TRx
TRx Nasal Triptan Share
• Consistent performance as second position detail
• Solid growth from general neurologists, headache specialists
and pediatricians
• 16% year over year growth in share of Nasal Triptan segment
• Share in the high 30% range
Source: IMS NPA Monthly Sept 2016
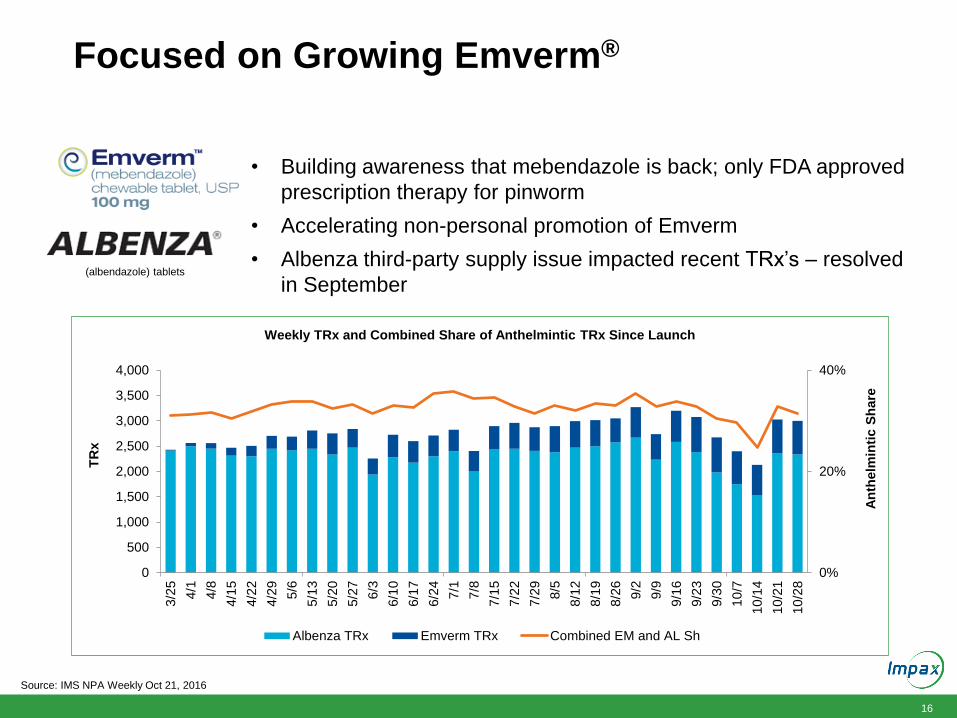
16
Focused on Growing Emverm®
0%
20%
40%
0
500
1,000
1,500
2,000
2,500
3,000
3,500
4,000
3/2
5
4/1
4/8
4/1
5
4/2
2
4/2
9
5/6
5/1
3
5/2
0
5/2
7
6/3
6/1
0
6/1
7
6/2
4
7/1
7/8
7/1
5
7/2
2
7/2
9
8/5
8/1
2
8/1
9
8/2
6
9/2
9/9
9/1
6
9/2
3
9/3
0
10
/7
10
/14
10
/21
10
/28
An
thelm
inti
c S
hare
TR
x
Weekly TRx and Combined Share of Anthelmintic TRx Since Launch
Albenza TRx Emverm TRx Combined EM and AL Sh
(albendazole) tablets
• Building awareness that mebendazole is back; only FDA approved
prescription therapy for pinworm
• Accelerating non-personal promotion of Emverm
• Albenza third-party supply issue impacted recent TRx’s – resolved
in September
Source: IMS NPA Weekly Oct 21, 2016

17
IPX203: Product Development Update
Investigator Assessment of Motor State
Off Time (h) On Time (h)
Immediate-release CD-LD 7.3 2.7
Rytary 5.5* 4.4*
IPX203 4.6 * + 5.4 * +
*p ≤ 0.0002 compared to IR CD-LD
+p < 0.05 compared with Rytary
Improvement from Baseline in
MDS-UPDRS Part III
• First patient enrolled in Phase 2b multiple dose study in patients with advanced Parkinson’s disease
• Phase 2b interim results by end of first half 2017
• FDA meeting in Feb. 2017 to discuss Phase 3 development plan
Positive Phase2a Study

1818
Financial Review and 2016 Financial GuidanceBryan Reasons
Senior Vice President & Chief Financial Officer

19
Non-Cash Intangible Impairment Charges
3Q16 Impairment Charges Amount $ millions
Teva Transaction
• Partial impairment of currently marketed portfolio
• Higher value products (for example, budesonide
inhalation suspension and propranolol HCl tablets)
primarily drove impairment value
• In-process R&D
$248.0
$3.0
In-process R&D
• 2 product rights acquired in Tower Holdings, Inc.
acquisition
$25.7
Certain products manufactured at Middlesex, NJ facility which
is in the process of being closed$8.5
Total non-cash impairment $285.2

20
3Q16 Generic Division Results
$ millionsGAAP
3Q16Adjustments
Adjusted
3Q16
GAAP
3Q15Adjustments
Adjusted
3Q15
Adjusted
Change
Revenues $175.3 --- $175.3 $180.7 --- $180.7 (3.0%)
Gross (Loss) Profit ($196.2) $273.1 $76.9 $68.0 $9.3 $77.3 (0.5%)
Gross Margin (111.9%) --- 43.8% 37.6% --- 42.8% 1.0ppts
SG&A Expense $6.1 ($0.1) $6.0 $5.1 ($0.1) $5.0 20.0%
R&D Expense $15.4 ($0.6) $14.8 $14.3 ($0.8) $13.5 9.6%
In-process R&D
Impairment Charges$15.5 ($15.5) $0.0 $0.0 --- $0.0 0.0%
Patent Litigation $0.1 --- $0.1 $0.4 --- $0.4 (75.0%)
Operating (Loss) Income ($233.3) $289.3 $56.0 $48.1 $10.2 58.3 (3.9%)
Operating Margin (133.1%) --- 31.9% 26.6% --- 32.3% (0.4)pts
Note: The sum of the GAAP and Adjustments may not equal the Adjusted amount due to rounding
Refer to the GAAP to non-GAAP reconciliation tables in the appendix for a reconciliation of non-GAAP results
SG&A = Selling, general and administrative
R&D = Research & development

21
3Q16 Specialty Pharma Division Results
$ millionsGAAP
3Q16Adjustments
Adjusted
3Q16
GAAP
3Q15Adjustments
Adjusted
3Q15
Adjusted
Change
Revenues $52.6 --- $52.6 $40.4 --- $40.4 30.1%
Gross Profit $30.7 $7.5 $38.2 $25.6 $8.2 $33.8 13.0%
Gross Margin 58.4% --- 72.5% 63.3% --- 83.7% (11.2)ppts
SG&A Expense $16.4 --- $16.4 $11.4 --- $11.4 43.9%
R&D Expense $4.7 --- $4.7 $4.3 --- $4.3 9.3%
In-process R&D
Impairment Charges$13.2 ($13.2) $0.0 $0.0 --- $0.0 $0.0
Patent Litigation $3.1 --- $3.1 $0.7 --- $0.7 342.9%
Operating (Loss) Income ($6.7) $20.6 $13.9 $9.2 $8.2 $17.5 (20.6%)
Operating Margin (12.7%) --- 26.4% 22.8% --- 43.3% (16.9)ppts
Note: The sum of the GAAP and Adjustments may not equal the Adjusted amount due to rounding
Refer to the GAAP to non-GAAP reconciliation tables in the appendix for a reconciliation of non-GAAP results
SG&A = Selling, general and administrative
R&D = Research & development

22
3Q16 Consolidated Results
$ millionsGAAP
3Q16Adjustments
Adjusted
3Q16
GAAP
3Q15Adjustments
Adjusted
3Q15
Adjusted
Change
Revenues $227.9 --- $227.9 $221.1 --- $221.1 3.1%
Gross (Loss) Profit ($165.4) $283.4 $115.0 $93.5 $17.6 $111.1 3.5%
Gross Margin (72.6%) --- 50.5% 42.3% --- 50.3% 0.2ppts
Operating (Loss) Income ($272.6) $317.5 $44.9 $27.6 $22.1 $49.7 (9.7%)
Operating Margin (119.6%) --- 19.7% 12.5% --- 22.5% (2.8)ppts
EPS Diluted ($2.51) $2.88 $0.37 $0.49 ($0.09) $0.40 (7.5%)
Note: The sum of the GAAP and Adjustments may not equal the Adjusted amount due to rounding
Refer to the GAAP to non-GAAP reconciliation tables in the appendix for a reconciliation of non-GAAP results
SG&A = Selling, general and administrative
R&D = Research & development
EPS = Earnings per share

23
2016 Updated Guidance
ItemAs of
August 9
Updated
November 9
Revenue $900M to $940M $840M to $855M
Adjusted Gross Margin Low 50% range 48% to 50%
Adjusted R&D Expense $100M to $105M $90M to $95M
Adjusted SG&A Expense $190M to $200M $185M to $190M
Tax Rate 34% to 36% 34% to 35%
Adjusted Interest Expense $18M No Change
Adjusted EPS $1.57 to $1.70 $1.10 to $ 1.20
SG&A = Selling, general and administrative
R&D = Research & development
EPS = Earnings per share
The Company does not provide forward-looking diluted earnings per share and related guidance metrics as outlined above on
a GAAP basis as certain financial information, such as the amortization of recently acquired intangible assets, restructuring
and impairment charges and other items used to determine such measures are not available and cannot be reasonably
estimated. The Company’s full year updated 2016 estimates are based on management’s current expectations, including with
respect to prescription trends, pricing levels, inventory levels, and the anticipated timing of future product launches and
events. The statements listed above are forward looking and actual results could differ materially depending on market
conditions and the factors set forth under our “Safe Harbor” statement.

24
Fourth Quarter Priorities
Focus on quality and operations
Aggressively pursue share growth within generic portfolio
Effectively execute on Rytary® and Emverm® growth initiatives
Maximize new generic product launches
Continue to pursue organic growth opportunities through R&D
Explore additional expense savings and efficiency opportunities

25
Q&A

2626
Appendix

27
20 Pending ANDAs at FDA
Source of sales data: IMS NPS September 2016; Pipeline data as of November 4, 2016; TA = tentative approval1 Launched authorized generic in April 20162 Assuming final FDA approval, earliest potential launch date/timing based on settlement or patent expiration date
First-to-market opportunity
Disclosed ANDAs
Greneric Product Name Strengths Brand IMS Sales Potential Launch Timing*
Oxycodone ER tablet (new formulation) 1 10, 15, 20, 30, 40, 60, 80 mg OxyContin® $2.4B Settled, not disclosed
Sevelamer Carbonate IR tablet 800 mg Renvela® $1.9B Approval
Methylphenidate HCI ER tablet 18, 27, 36, 54 mg Concerta® $1.8B Approval
Ezetimibe Simvastatin IR tablet – TA 210 mg/10 mg, 10 mg/20 mg,
10 mg/40 mg, 10 mg/80 mgVytorin® $693M April 2017
Colesevelam IR tablet 625 mg Welchol® $644M Approval
Oxymorphone ER tablet (new formulation) 5, 7.5, 10, 15, 20, 30, 40 mg Opana ER® $315M Pending litigation
Aspirin Dipyridamole ER capsule - TA 25/200mg Aggrenox® $255M January 2017
Fentanyl Buccal IR tablet 100, 200, 400, 600, 800 mcg Fentora® $153M Settled, not disclosed
Dutasteride/Tamsulosin IR capsule 0.5 mg/0.4 mg Jalyn® $59M Approval
Risedronate Sodium DR tablet 35 mg Atelvia® $38M Approval

28
GAAP to Adjusted Net Income ReconciliationThe following table reconciles reported net loss to adjusted net income.
(Unaudited, amounts in thousands, except per share and per share data)
Three months ended
September 30,
2016 2015
Net (loss) income $ (179,337) $ 35,755
Adjusted to add (deduct):
Amortization 18,367 10,307
Business development expenses 2,072 3,682
Hayward facility remediation costs - 3,546
Tower acquisition severance - -
Philadelphia packaging and distribution restructuring 84 2,767
Middlesex manufacturing restructuring 5,516 -
Payments for licensing agreements 622 750
Fair value of inventory step-up - 1,104
Ticking Fees - -
Non-cash interest expense 5,890 5,097
Reserve for Turing receivable - -
Intangible asset impairment charge 285,232 -
Loss on debt extinguishment - -
Gain on sale of asset - (45,574)
Net change in fair value of derivatives - 4,000
Deferred financing costs - -
Turing legal expenses 5,443 -
Lease termination for office consolidation 144 -
Income tax effect (117,884) 7,772
Adjusted net income $ 26,149 $ 29,206
Adjusted net income per diluted share $ 0.37 $ 0.40
Net (loss) income per diluted share $ (2.51) $ 0.49
Diluted weighted-average common shares outstanding 71,542 72,778
Refer to the Third Quarter 2016 Earnings Release for an explanation of adjusted items.

29
GAAP to Adjusted Results ReconciliationThe following table reconciles total Company reported cost of revenues to adjusted cost of revenues.
(Unaudited, amounts in thousands)
Refer to the Third Quarter 2016 Earnings Release for an explanation of adjusted items. (a) Adjusted gross profit is calculated as total revenues less adjusted cost of revenues. Adjusted gross margin is calculated as adjusted
gross profit divided by total revenues.
Three months ended
September 30,
2016 2015
Cost of revenues $ 136,873 $ 127,550
Adjusted to deduct:
Amortization 18,367 10,307
Hayward facility remediation costs - 3,546
Philadelphia packaging and distribution restructuring 53 2,608
Middlesex manufacturing restructuring 5,516 -
Lease termination for office consolidation 53 -
Fair value of inventory step-up - 1,104
Adjusted cost of revenues $ 112,884 $ 109,985
Adjusted gross profit (a) $ 115,025 $ 111,114
Adjusted gross margin (a) 50.5% 50.3%
Research and development expenses $ 20,115 $ 18,631
Adjusted to deduct:
Payments for licensing agreements 622 750
Adjusted research and development expenses $ 19,493 $ 17,881
Selling, general and administrative expenses $ 55,038 $ 46,307
Adjusted to deduct:
Business development expenses 2,072 3,682
Tower acquisition severance - -
Philadelphia packaging and distribution restructuring 31 159
Turing legal expenses 5,443 -
Lease termination for office consolidation 91 -
Adjusted selling, general and administrative expenses $ 47,401 $ 42,466

30
Generic Division GAAP to Adjusted Results ReconciliationThe following tables reconcile the Impax Generics Division reported cost of revenues to adjusted cost of revenues, adjusted gross
profit, adjusted gross margin and adjusted operating income.
(Unaudited, amounts in thousands)
Refer to the Third Quarter 2016 Earnings Release for an explanation of adjusted items. (a) Adjusted gross profit is calculated as total revenues less adjusted cost of revenues. Adjusted gross margin is calculated as adjusted
gross profit divided by total revenues.
Three Months Ended
September 30,
2016 2015
GAAP Income from operations $ (233,330) $ 48,104
Adjusted to add (deduct):
Amortization 10,951 3,083
Hayward facility remediation costs - 3,546
Tower acquisition severance - -
Hayward technical operations and R&D restructuring - -
Philadelphia packaging and distribution restructuring 53 2,767
Middlesex manufacturing restructuring 5,516 -
Intangible asset impairment charge 272,005 -
Lease termination for office consolidation 144 -
Fair value of inventory step-up - 92
Payments for licensing agreements 622 750
Adjusted Income from operations $ 55,961 $ 58,342
Three months ended
September 30,
2016 2015
Cost of revenues $ 115,020 $ 112,716
Adjusted to deduct:
Amortization 10,951 3,083
Hayward facility remediation costs - 3,546
Philadelphia packaging and distribution restructuring 53 2,608
Middlesex manufacturing restructuring 5,516 -
Lease termination for office consolidation 53 -
Fair value of inventory step-up - 92
Adjusted cost of revenues $ 98,447 $ 103,387
Adjusted gross profit (a) $ 76,873 $ 77,279
Adjusted gross margin (a) 43.8% 42.8%

31
Specialty Pharma Division GAAP to Adjusted Results ReconciliationThe following tables reconcile the Impax Specialty Pharma Divisions reported cost of revenues to adjusted cost of revenues,
adjusted gross profit, adjusted gross margin and adjusted operating income.
(Unaudited, amounts in thousands)
Refer to the Third Quarter 2016 Earnings Release for an explanation of adjusted items. (a) Adjusted gross profit is calculated as total revenues less adjusted cost of revenues. Adjusted gross margin is calculated as adjusted
gross profit divided by total revenues.
Three months ended
September 30,
2016 2015
Cost of revenues $ 21,853 $ 14,834
Adjusted to deduct:
Amortization 7,416 7,224
Fair value of inventory step-up - 1,012
Adjusted cost of revenues $ 14,437 $ 6,598
Adjusted gross profit (a) $ 38,152 $ 33,835
Adjusted gross margin (a) 72.5% 83.7%
Three Months Ended
September 30,
2016 2015
GAAP Income (loss) from operations $ (6,721) $ 9,241
Adjusted to add:
Amortization 7,416 7,224
Fair value of inventory step-up - 1,012
Tower acquisition severance - -
Intangible asset impairment charge 13,227 -
Adjusted Income from operations $ 13,922 $ 17,477