third quarter 2021 earnings presentation
TRANSCRIPT

Third Quarter 2021Earnings Presentation
October 27, 2021
2023 CADILLAC LYRIQ
2
This presentation contains several “forward-looking statements.” Forward-looking statements are those that use words such as “believe,” “expect,” “intend,” “plan,” “may,” “likely,” “should,” “estimate,” “continue,” “future” or “anticipate” and other comparable expressions. These words indicate future events and trends. Forward-looking statements are our current views with respect to future events and financial performance. These forward-looking statements are subject to many assumptions, risks and uncertainties that could cause actual results to differ significantly from historical results or from those anticipated by us.
The most significant risks are detailed from time to time in our filings and reports with the Securities and Exchange Commission, including our annual report on Form 10-K for the year ended December 31, 2020 and our subsequent quarterly reports on Form 10-Q. Such risks include - but are not limited to - the length and severity of the COVID-19 pandemic; GM's ability to sell new vehicles that we finance in the markets we serve; dealers' effectiveness in marketing our financial products to consumers; the viability of GM-franchised dealers that are commercial loan customers; the sufficiency, availability and cost of sources of financing, including credit facilities, securitization programs and secured and unsecured debt issuances; the adequacy of our underwriting criteria for loans and leases and the level of net charge-offs, delinquencies and prepayments on the loans and leases we purchase or originate; our ability to effectively manage capital or liquidity consistent with evolving business or operational needs, risk management standards and regulatory or supervisory requirements; the adequacy of our allowance for loan losses on our finance receivables; our ability to maintain and expand our market share due to competition in the automotive finance industry from a large number of banks, credit unions, independent finance companies and other captive automotive finance subsidiaries; changes in the automotive industry that result in a change in demand for vehicles and related vehicle financing; the effect, interpretation or application of new or existing laws, regulations, court decisions and accounting pronouncements; adverse determinations with respect to the application of existing laws, or the results of any audits from tax authorities, as well as changes in tax laws and regulations, supervision, enforcement and licensing across various jurisdictions; the prices at which used vehicles are sold in the wholesale auction markets; vehicle return rates, our ability to estimate residual value at lease inception and the residual value performance on vehicles we lease; interest rate fluctuations and certain related derivatives exposure; our joint ventures in China, which we cannot operate solely for our benefit and over which we have limited control; changes in the determination of LIBOR and other benchmark rates; our ability to secure private customer and employee data or our proprietary information, manage risks related to security breaches and other disruptions to our networks and systems and comply with enterprise data regulations in all key market regions; foreign currency exchange rate fluctuations and other risks applicable to our operations outside of the U.S.; and changes in local, regional, national or international economic, social or political conditions. If one or more of these risks or uncertainties materialize, or if underlying assumptions prove incorrect, our actual results may vary materially from those expected, estimated or projected. It is advisable not to place undue reliance on any forward-looking statements. We undertake no obligation to, and do not, publicly update or revise any forward-looking statements, except as required by law, whether as a result of new information, future events or otherwise.
The IHS Markit reports, data and information ("IHS Markit Materials") referenced herein are copyrighted property of the IHS Markit Ltd and its subsidiaries ("IHS Markit") and represent data, research, opinions or viewpoints published by IHS Markit, and are not representations of fact. The IHS Markit Materials speak as of the data of the original publication date thereof and not as of the date of this document. The information and opinions expressed in the IHS Markit Materials are subject to change without notice and IHS Markit has no duty or responsibility to update the IHS Markit Materials. Moreover, while the IHS Markit Materials reproduced herein are from sources considered reliable, the accuracy and completeness thereof are not warranted, nor are the opinions and analyses which are based upon it. IHS Markit and R.L. Polk & Co. are trademarks of IHS Markit.
Safe Harbor Statement
3
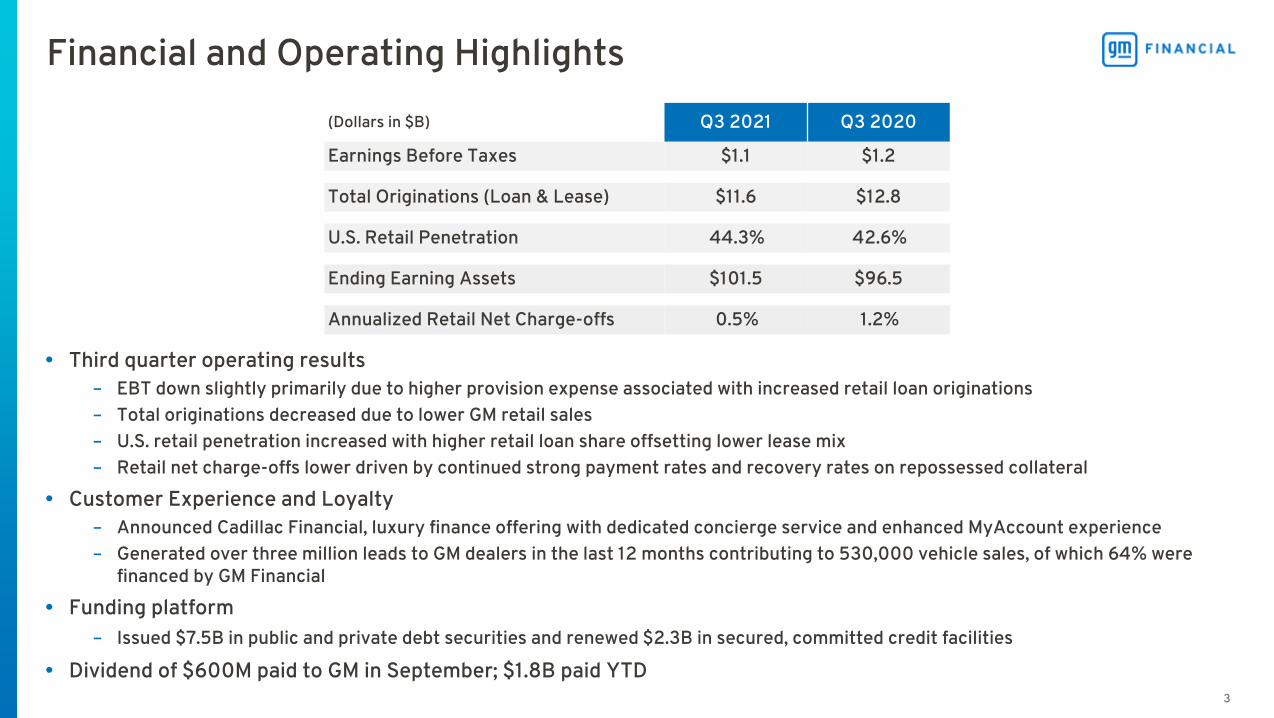
(Dollars in $B) Q3 2021 Q3 2020
Earnings Before Taxes $1.1 $1.2
Total Originations (Loan & Lease) $11.6 $12.8
U.S. Retail Penetration 44.3% 42.6%
Ending Earning Assets $101.5 $96.5
Annualized Retail Net Charge-offs 0.5% 1.2%
• Third quarter operating results– EBT down slightly primarily due to higher provision expense associated with increased retail loan originations – Total originations decreased due to lower GM retail sales– U.S. retail penetration increased with higher retail loan share offsetting lower lease mix– Retail net charge-offs lower driven by continued strong payment rates and recovery rates on repossessed collateral
• Customer Experience and Loyalty– Announced Cadillac Financial, luxury finance offering with dedicated concierge service and enhanced MyAccount experience– Generated over three million leads to GM dealers in the last 12 months contributing to 530,000 vehicle sales, of which 64% were
financed by GM Financial
• Funding platform– Issued $7.5B in public and private debt securities and renewed $2.3B in secured, committed credit facilities
• Dividend of $600M paid to GM in September; $1.8B paid YTD
Financial and Operating Highlights
4
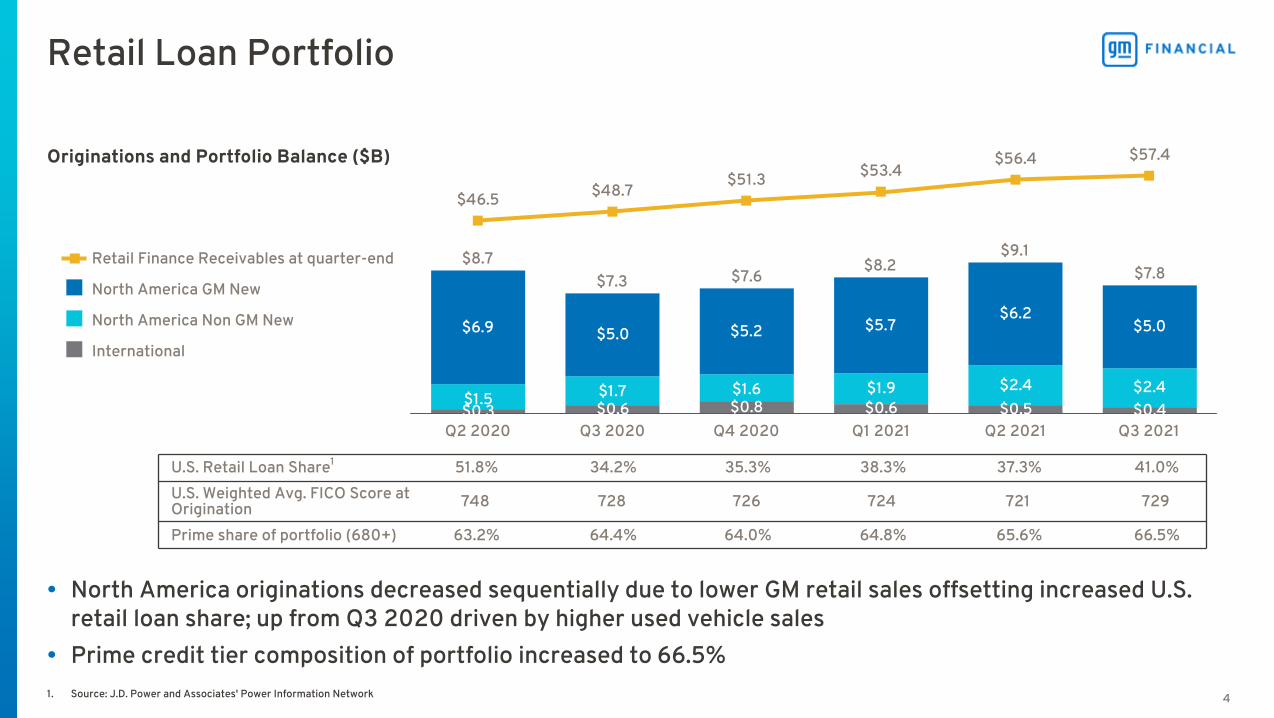
• North America originations decreased sequentially due to lower GM retail sales offsetting increased U.S. retail loan share; up from Q3 2020 driven by higher used vehicle sales
• Prime credit tier composition of portfolio increased to 66.5%
Retail Loan Portfolio
1. Source: J.D. Power and Associates' Power Information Network
$8.7$7.3 $7.6
$8.2$9.1
$7.8
$0.3 $0.6 $0.8 $0.6 $0.5 $0.4$1.5 $1.7 $1.6 $1.9 $2.4 $2.4
$6.9 $5.0 $5.2 $5.7$6.2
$5.0
$46.5 $48.7$51.3 $53.4
$56.4 $57.4
Retail Finance Receivables at quarter-end
North America GM New
North America Non GM New
International
Q2 2020 Q3 2020 Q4 2020 Q1 2021 Q2 2021 Q3 2021
Originations and Portfolio Balance ($B)
U.S. Retail Loan Share1 51.8% 34.2% 35.3% 38.3% 37.3% 41.0%
U.S. Weighted Avg. FICO Score at Origination 748 728 726 724 721 729
Prime share of portfolio (680+) 63.2% 64.4% 64.0% 64.8% 65.6% 66.5%
5
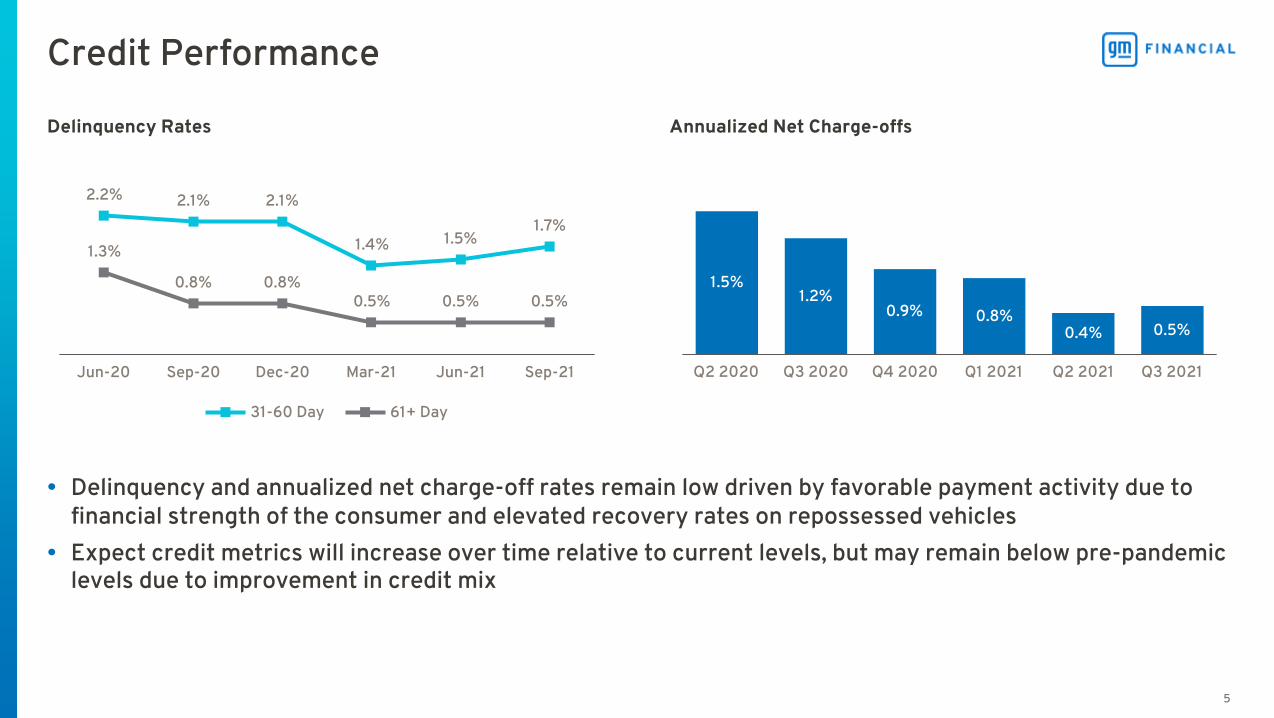
• Delinquency and annualized net charge-off rates remain low driven by favorable payment activity due to financial strength of the consumer and elevated recovery rates on repossessed vehicles
• Expect credit metrics will increase over time relative to current levels, but may remain below pre-pandemic levels due to improvement in credit mix
1.5%1.2%
0.9% 0.8%0.4% 0.5%
Q2 2020 Q3 2020 Q4 2020 Q1 2021 Q2 2021 Q3 2021
Delinquency Rates Annualized Net Charge-offs
Credit Performance
2.2% 2.1% 2.1%
1.4% 1.5%1.7%
1.3%
0.8% 0.8%0.5% 0.5% 0.5%
31-60 Day 61+ Day
Jun-20 Sep-20 Dec-20 Mar-21 Jun-21 Sep-21
6
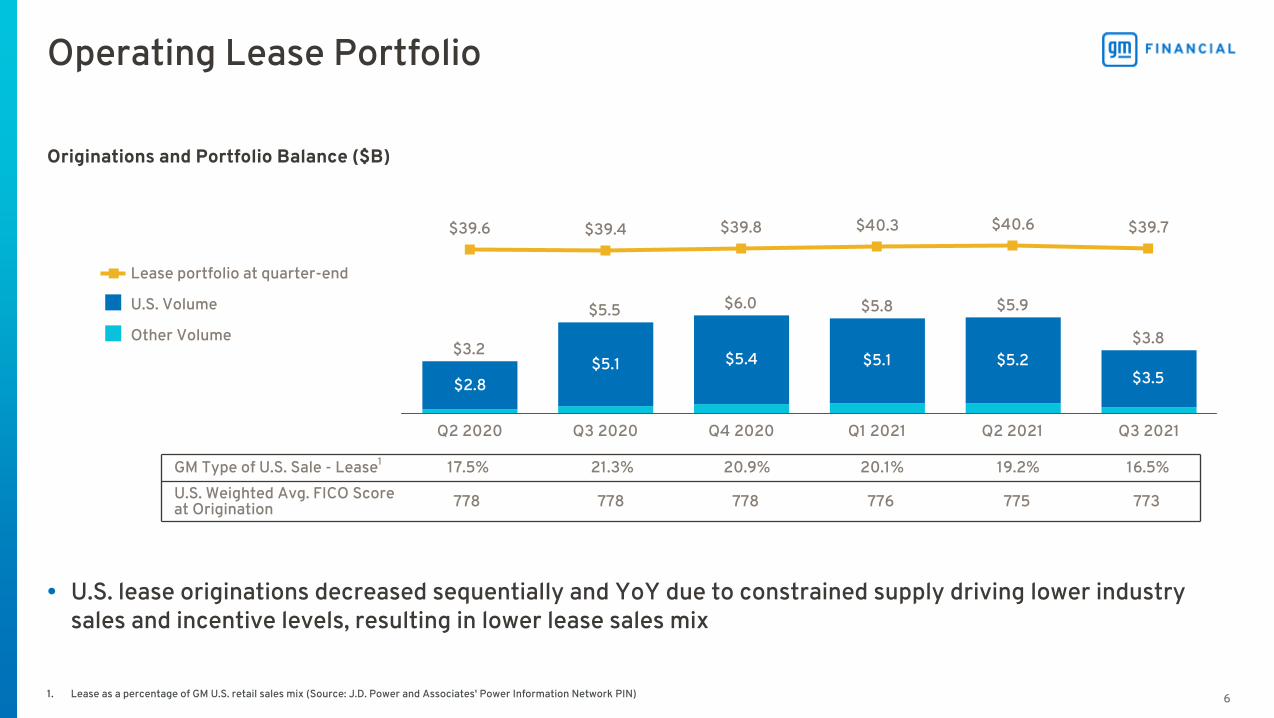
$3.2
$5.5 $6.0 $5.8 $5.9
$3.8
$2.8$5.1 $5.4 $5.1 $5.2
$3.5
$39.6 $39.4 $39.8 $40.3 $40.6 $39.7
Lease portfolio at quarter-end
U.S. Volume
Other Volume
Q2 2020 Q3 2020 Q4 2020 Q1 2021 Q2 2021 Q3 2021
1. Lease as a percentage of GM U.S. retail sales mix (Source: J.D. Power and Associates' Power Information Network PIN)
Operating Lease Portfolio
• U.S. lease originations decreased sequentially and YoY due to constrained supply driving lower industry sales and incentive levels, resulting in lower lease sales mix
Originations and Portfolio Balance ($B)
GM Type of U.S. Sale - Lease1 17.5% 21.3% 20.9% 20.1% 19.2% 16.5%
U.S. Weighted Avg. FICO Score at Origination 778 778 778 776 775 773
7
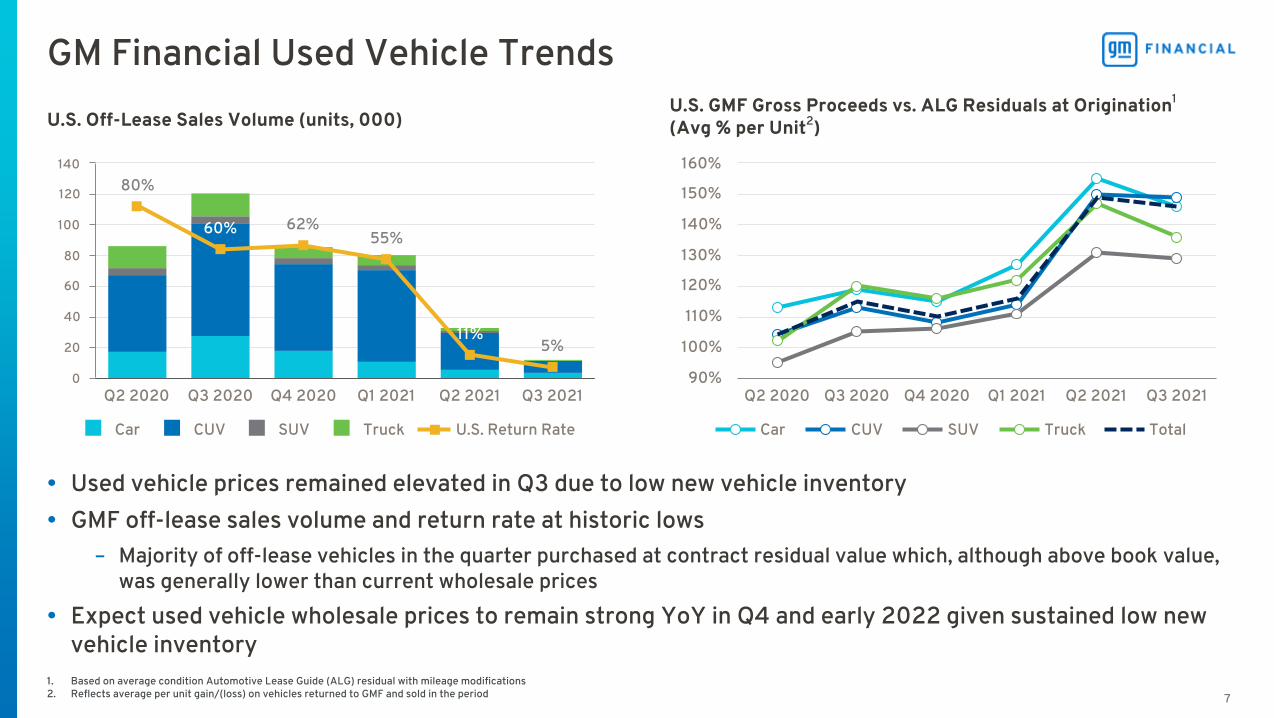
80%
60% 62%55%
11%5%
Car CUV SUV Truck U.S. Return Rate
Q2 2020 Q3 2020 Q4 2020 Q1 2021 Q2 2021 Q3 20210
20
40
60
80
100
120
140
GM Financial Used Vehicle Trends
Car CUV SUV Truck Total
Q2 2020 Q3 2020 Q4 2020 Q1 2021 Q2 2021 Q3 202190%
100%
110%
120%
130%
140%
150%
160%
1. Based on average condition Automotive Lease Guide (ALG) residual with mileage modifications2. Reflects average per unit gain/(loss) on vehicles returned to GMF and sold in the period
U.S. Off-Lease Sales Volume (units, 000)U.S. GMF Gross Proceeds vs. ALG Residuals at Origination1
(Avg % per Unit2)
• Used vehicle prices remained elevated in Q3 due to low new vehicle inventory• GMF off-lease sales volume and return rate at historic lows
– Majority of off-lease vehicles in the quarter purchased at contract residual value which, although above book value, was generally lower than current wholesale prices
• Expect used vehicle wholesale prices to remain strong YoY in Q4 and early 2022 given sustained low new vehicle inventory
8
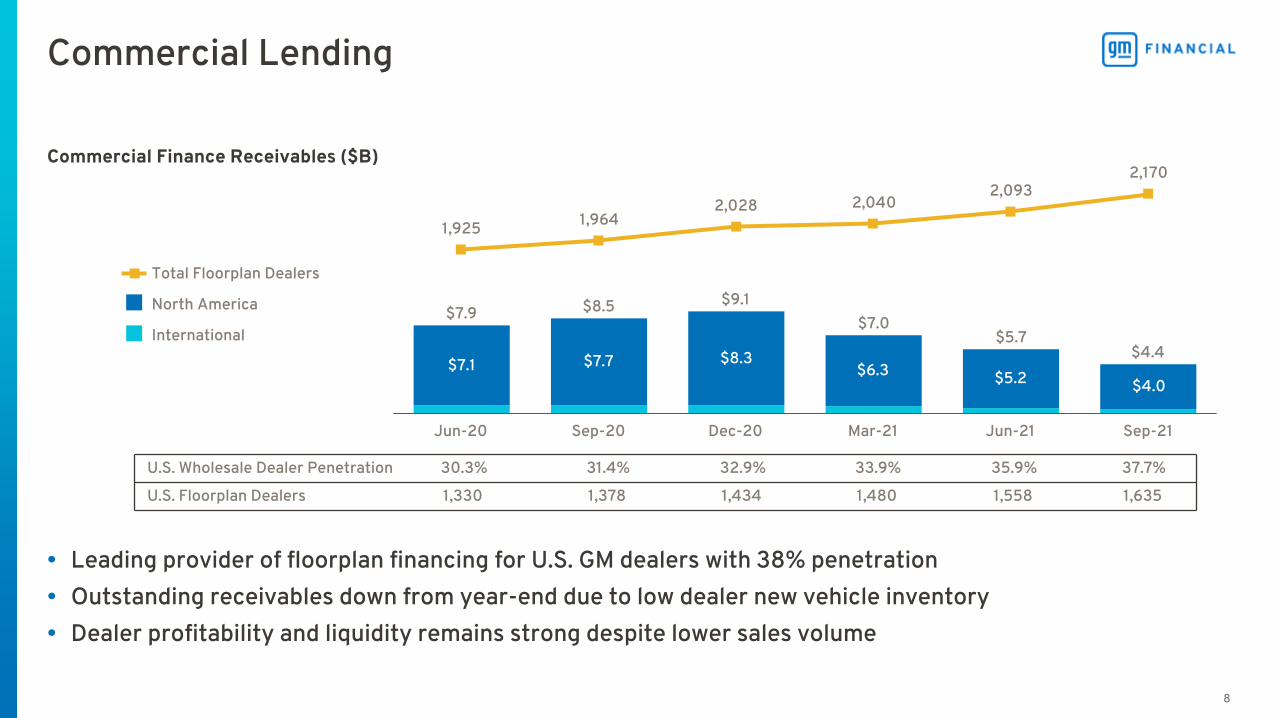
• Leading provider of floorplan financing for U.S. GM dealers with 38% penetration • Outstanding receivables down from year-end due to low dealer new vehicle inventory• Dealer profitability and liquidity remains strong despite lower sales volume
Commercial Lending
$7.9 $8.5 $9.1$7.0
$5.7$4.4
$7.1 $7.7 $8.3$6.3 $5.2 $4.0
1,925 1,9642,028 2,040
2,0932,170
Total Floorplan Dealers
North America
International
Jun-20 Sep-20 Dec-20 Mar-21 Jun-21 Sep-21
Commercial Finance Receivables ($B)
U.S. Wholesale Dealer Penetration 30.3% 31.4% 32.9% 33.9% 35.9% 37.7%
U.S. Floorplan Dealers 1,330 1,378 1,434 1,480 1,558 1,635

9
$2.8 $3.4 $4.4 $3.5 $3.2 $3.3
44.6% 44.0% 47.6% 46.7%39.2%
48.5%
28.7% 29.1% 29.4% 28.5% 26.5% 28.2%
SGM % of Retail Sales SGMW % of Retail Sales
Q2 2020 Q3 2020 Q4 2020 Q1 2021 Q2 2021 Q3 2021
$18.4$20.3
$23.0 $22.8 $21.9 $21.8
$14.4 $15.7 $17.8 $18.2 $18.6 $18.7
$4.0 $4.6$5.2 $4.6 $3.3 $3.1
Retail Commercial
Jun-20 Sep-20 Dec-20 Mar-21 Jun-21 Sep-21
$42$47
$41
$54 $50 $53
Q2 2020 Q3 2020 Q4 2020 Q1 2021 Q2 2021 Q3 2021
0.5%
0.3% 0.3% 0.3% 0.3% 0.3%
Q2 2020 Q3 2020 Q4 2020 Q1 2021 Q2 2021 Q3 2021
• Semiconductor supply shortage impacted wholesale deliveries and retail originations while retail penetration rebounded due to SAIC-GMAC incentive programs
• Equity income benefited from continued stable credit performance
China Joint VenturesOriginations ($B) Ending Earning Assets ($B)
Equity Income ($M) Annualized Retail Net Charge-offs
10
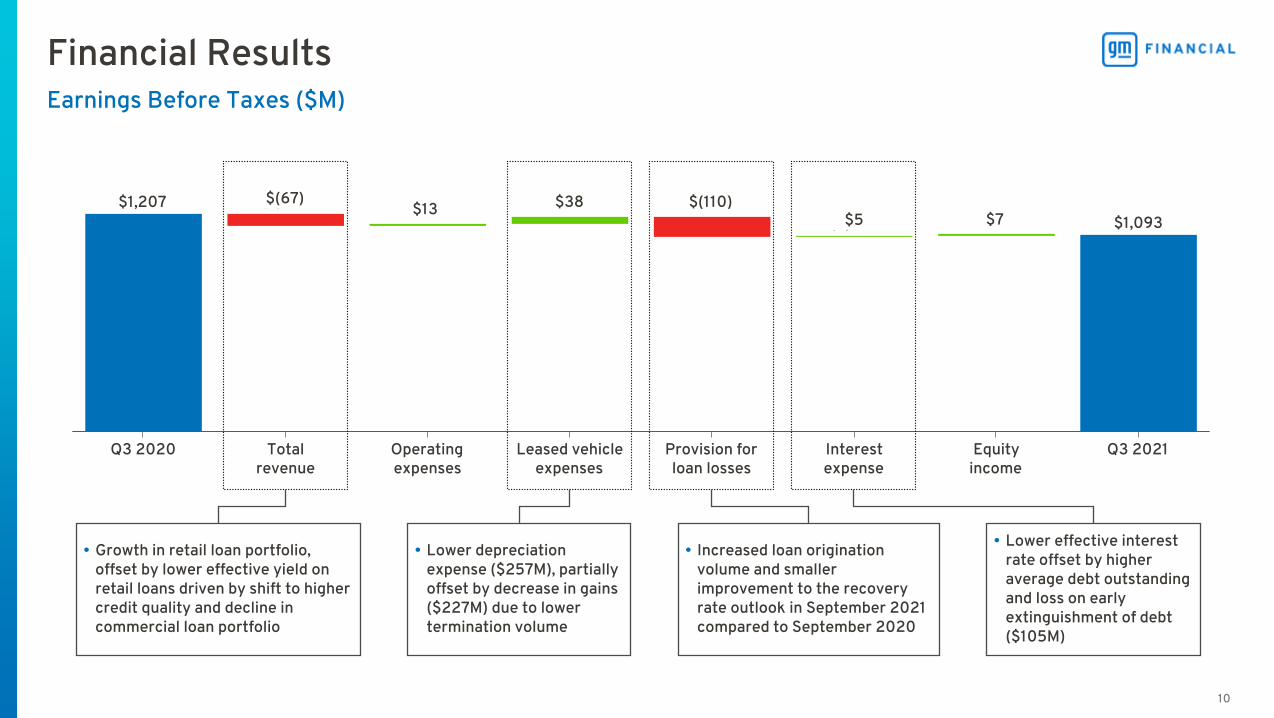
$1,207 $1,207$1,153 $1,191 $1,191
$1,088 1,096 $1,093
Q3 2020 Totalrevenue
Operatingexpenses
Leased vehicleexpenses
Provision forloan losses
Interestexpense
Equityincome
Q3 2021
$(67)$13 $38 $(110)
$5
Earnings Before Taxes ($M)
Financial Results
• Growth in retail loan portfolio, offset by lower effective yield on retail loans driven by shift to higher credit quality and decline in commercial loan portfolio
• Lower depreciation expense ($257M), partially offset by decrease in gains ($227M) due to lower termination volume
• Increased loan origination volume and smaller improvement to the recovery rate outlook in September 2021 compared to September 2020
• Lower effective interest rate offset by higher average debt outstanding and loss on early extinguishment of debt ($105M)
$7
11
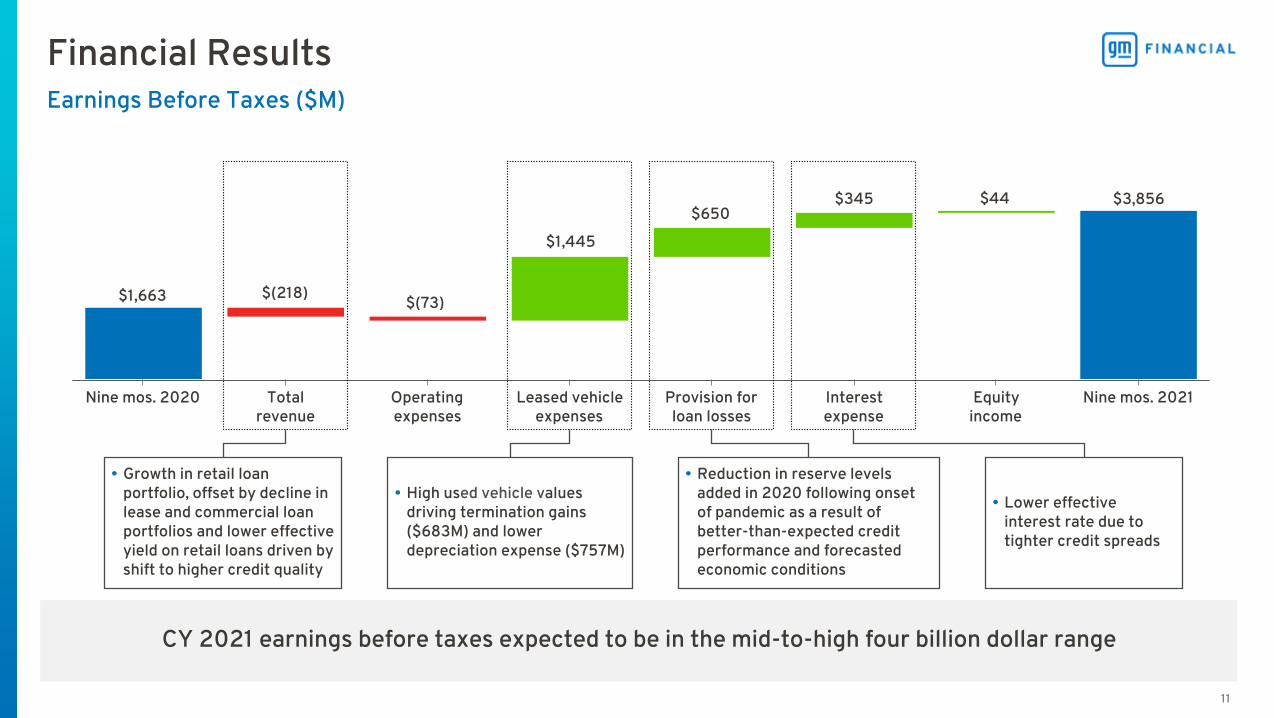
$1,663 $1,663 $1,445
$2,817
$3,467$3,812 3,856 $3,856
Nine mos. 2020 Totalrevenue
Operatingexpenses
Leased vehicleexpenses
Provision forloan losses
Interestexpense
Equityincome
Nine mos. 2021
$(218)$(73)
$1,445
$650$345
Earnings Before Taxes ($M)
Financial Results
• Growth in retail loan portfolio, offset by decline in lease and commercial loan portfolios and lower effective yield on retail loans driven by shift to higher credit quality
• High used vehicle values driving termination gains ($683M) and lower depreciation expense ($757M)
• Reduction in reserve levels added in 2020 following onset of pandemic as a result of better-than-expected credit performance and forecasted economic conditions
• Lower effective interest rate due to tighter credit spreads
$44
CY 2021 earnings before taxes expected to be in the mid-to-high four billion dollar range
12
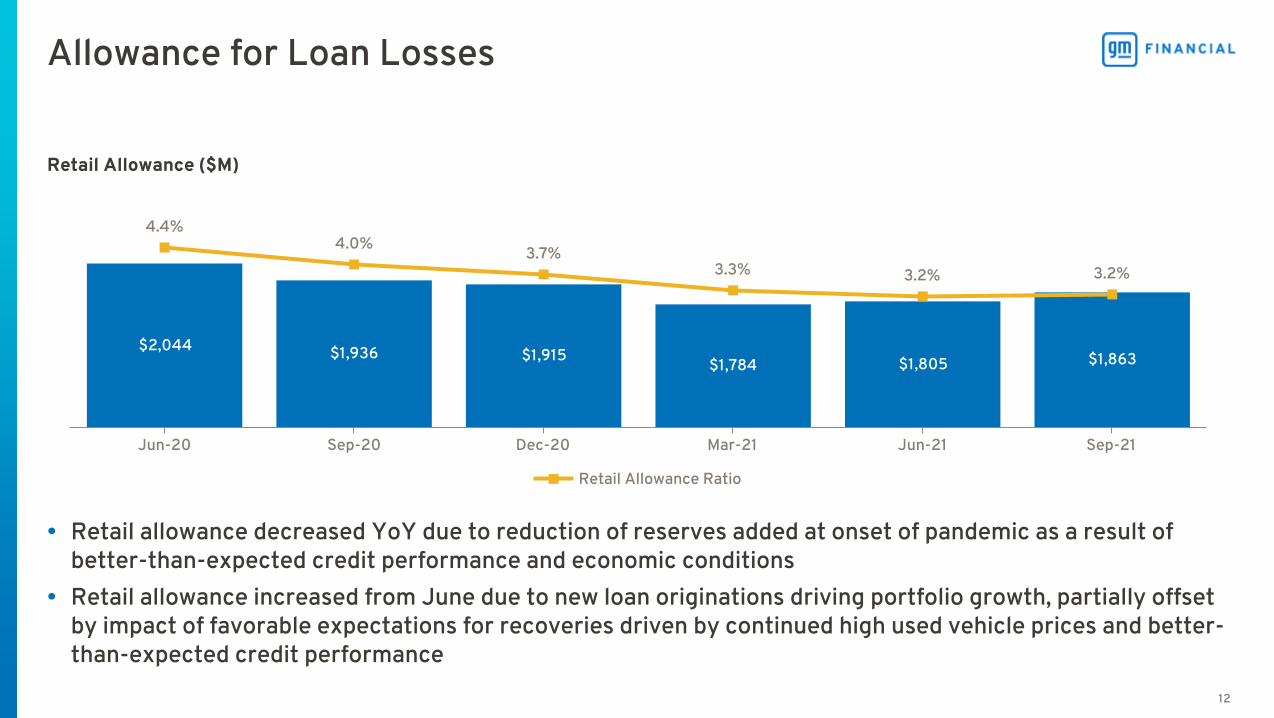
$2,044 $1,936 $1,915$1,784 $1,805 $1,863
4.4%4.0%
3.7%3.3% 3.2% 3.2%
Retail Allowance Ratio
Jun-20 Sep-20 Dec-20 Mar-21 Jun-21 Sep-21
• Retail allowance decreased YoY due to reduction of reserves added at onset of pandemic as a result of better-than-expected credit performance and economic conditions
• Retail allowance increased from June due to new loan originations driving portfolio growth, partially offset by impact of favorable expectations for recoveries driven by continued high used vehicle prices and better-than-expected credit performance
Retail Allowance ($M)
Allowance for Loan Losses
13
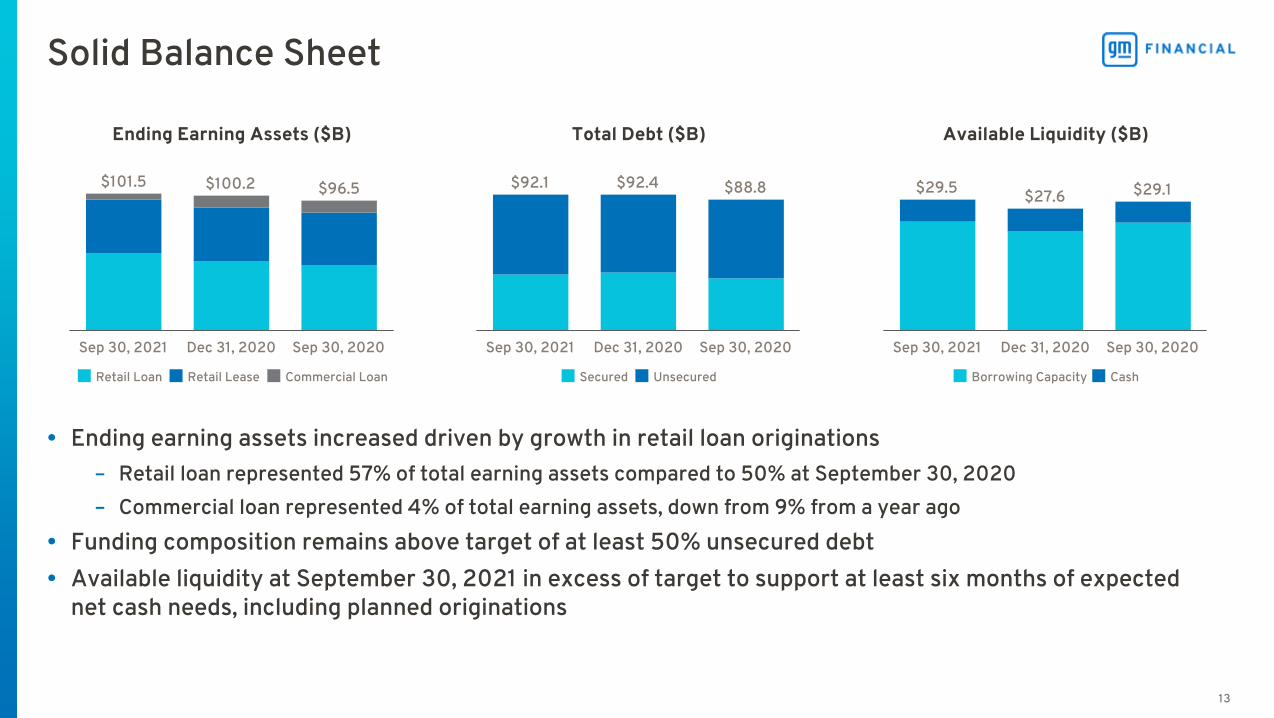
• Ending earning assets increased driven by growth in retail loan originations– Retail loan represented 57% of total earning assets compared to 50% at September 30, 2020
– Commercial loan represented 4% of total earning assets, down from 9% from a year ago
• Funding composition remains above target of at least 50% unsecured debt• Available liquidity at September 30, 2021 in excess of target to support at least six months of expected
net cash needs, including planned originations
$101.5 $100.2 $96.5
Retail Loan Retail Lease Commercial Loan
Sep 30, 2021 Dec 31, 2020 Sep 30, 2020
$92.1 $92.4 $88.8
Secured Unsecured
Sep 30, 2021 Dec 31, 2020 Sep 30, 2020
$29.5 $27.6 $29.1
Borrowing Capacity Cash
Sep 30, 2021 Dec 31, 2020 Sep 30, 2020
Solid Balance Sheet
Ending Earning Assets ($B) Total Debt ($B) Available Liquidity ($B)
14
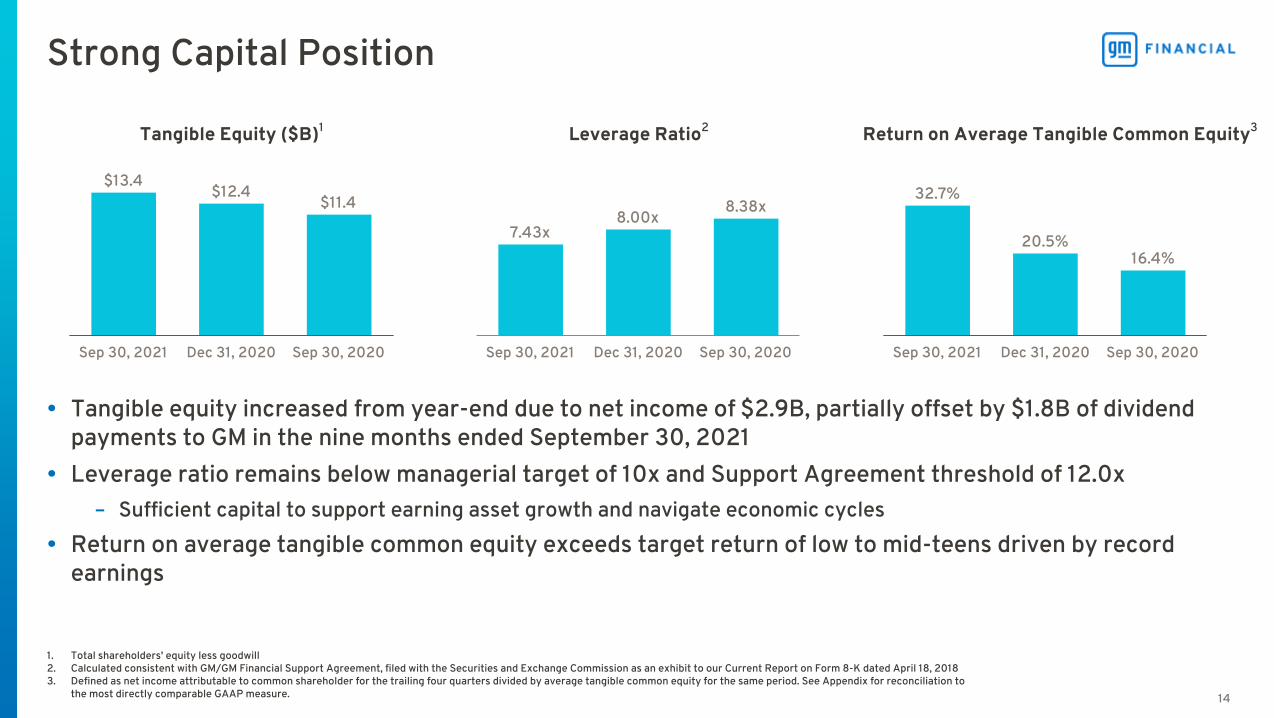
$13.4$12.4
$11.4
Sep 30, 2021 Dec 31, 2020 Sep 30, 2020
7.43x8.00x
8.38x
Sep 30, 2021 Dec 31, 2020 Sep 30, 2020
• Tangible equity increased from year-end due to net income of $2.9B, partially offset by $1.8B of dividend payments to GM in the nine months ended September 30, 2021
• Leverage ratio remains below managerial target of 10x and Support Agreement threshold of 12.0x– Sufficient capital to support earning asset growth and navigate economic cycles
• Return on average tangible common equity exceeds target return of low to mid-teens driven by record earnings
32.7%
20.5%16.4%
Sep 30, 2021 Dec 31, 2020 Sep 30, 2020
Strong Capital Position
1. Total shareholders' equity less goodwill2. Calculated consistent with GM/GM Financial Support Agreement, filed with the Securities and Exchange Commission as an exhibit to our Current Report on Form 8-K dated April 18, 20183. Defined as net income attributable to common shareholder for the trailing four quarters divided by average tangible common equity for the same period. See Appendix for reconciliation to
the most directly comparable GAAP measure.
Tangible Equity ($B)1 Leverage Ratio2 Return on Average Tangible Common Equity3
15
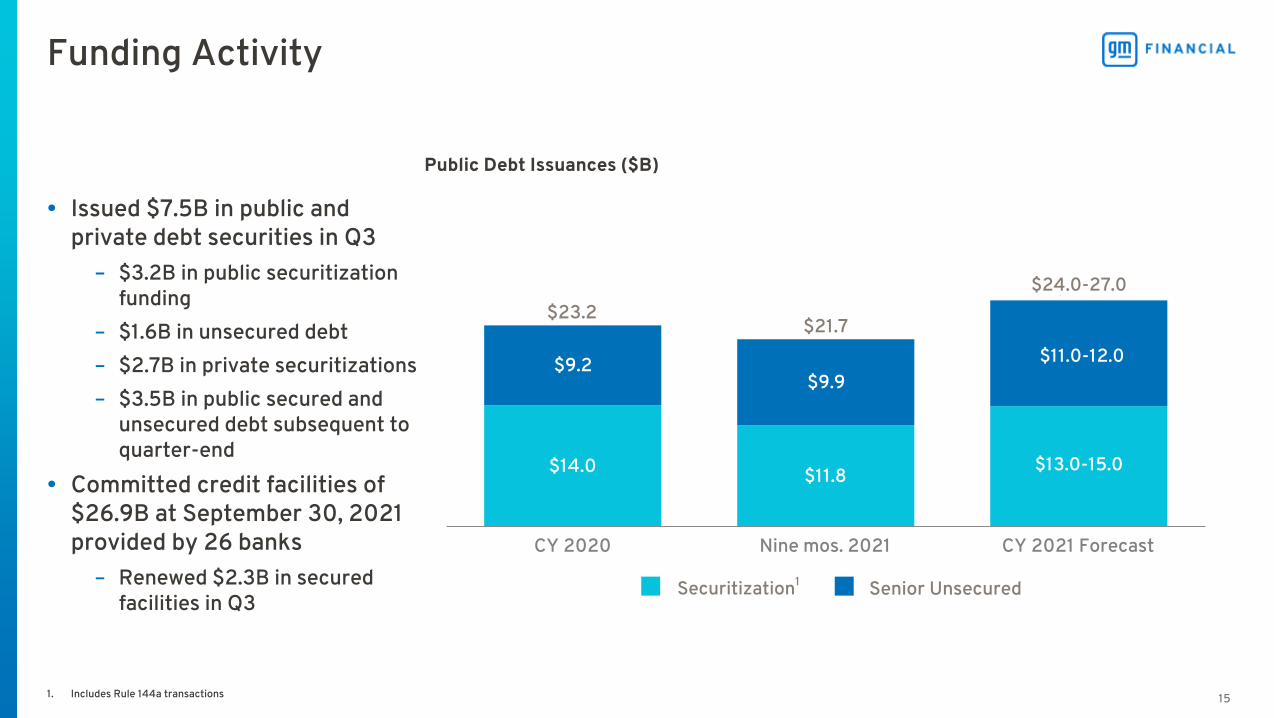
$23.2$21.7
$26.1
$14.0 $11.8
$9.2$9.9
Securitization1 Senior Unsecured
CY 2020 Nine mos. 2021 CY 2021 Forecast
• Issued $7.5B in public and private debt securities in Q3
– $3.2B in public securitization funding
– $1.6B in unsecured debt
– $2.7B in private securitizations
– $3.5B in public secured and unsecured debt subsequent to quarter-end
• Committed credit facilities of $26.9B at September 30, 2021 provided by 26 banks
– Renewed $2.3B in secured facilities in Q3
Funding Activity
1. Includes Rule 144a transactions
Securitization1
Public Debt Issuances ($B)
$11.0-12.0
$13.0-15.0
$24.0-27.0
16
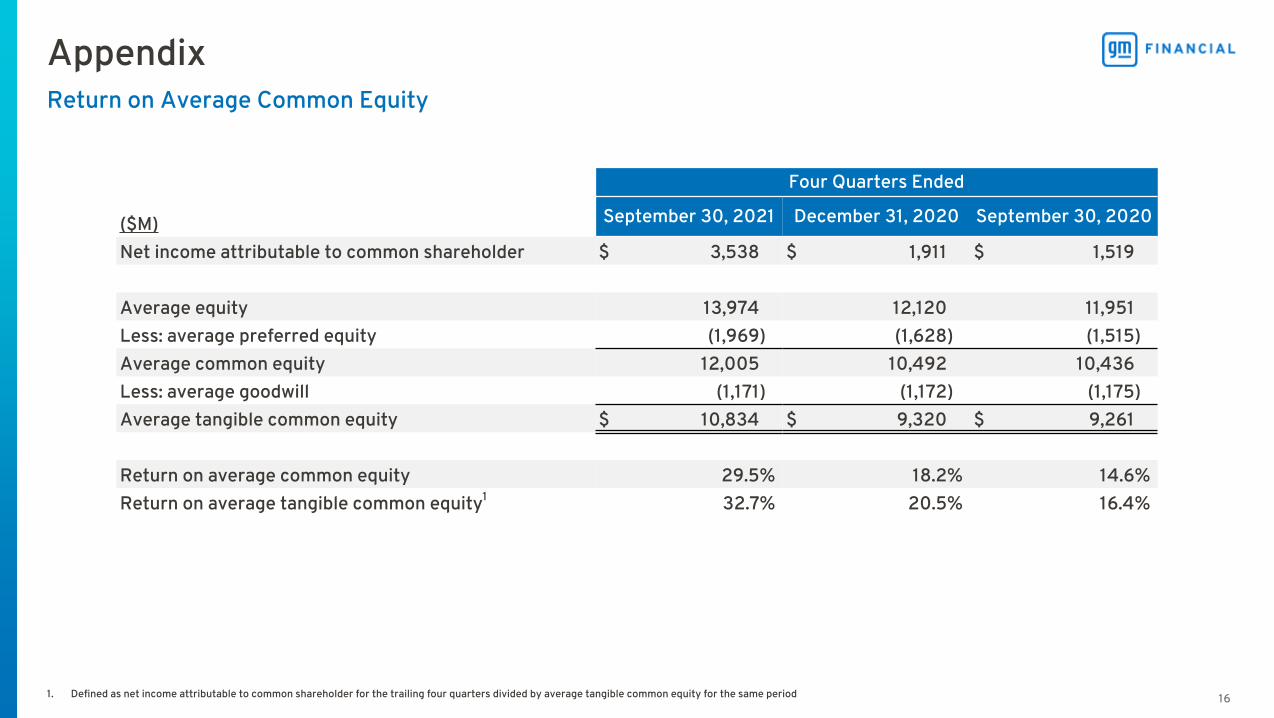
Four Quarters Ended
($M) September 30, 2021 December 31, 2020 September 30, 2020
Net income attributable to common shareholder $ 3,538 $ 1,911 $ 1,519
Average equity 13,974 12,120 11,951 Less: average preferred equity (1,969) (1,628) (1,515) Average common equity 12,005 10,492 10,436 Less: average goodwill (1,171) (1,172) (1,175) Average tangible common equity $ 10,834 $ 9,320 $ 9,261
Return on average common equity 29.5% 18.2% 14.6% Return on average tangible common equity1 32.7% 20.5% 16.4%
Return on Average Common Equity
Appendix
1. Defined as net income attributable to common shareholder for the trailing four quarters divided by average tangible common equity for the same period

17
Stephen JonesVice President, Investor Relations
(817) [email protected]
For more information, visit gmfinancial.com
2022 CHEVROLET EQUINOX RS