second quarter morguard north american residential … north american re… · exchange (“tsx”)...
TRANSCRIPT

SECOND QUARTER MORGUARD NORTH AMERICANRESIDENTIAL REIT20
20
EXPANSION FROM DECISIVE ACTION
MANAGEMENT’S DISCUSSION AND ANALYSIS AND CONDENSED CONSOLIDATED FINANCIAL STATEMENTS
MANAGEMENT’S DISCUSSION AND ANALYSIS OFRESULTS OF OPERATIONS AND FINANCIAL CONDITION
TABLE OF CONTENTS
Part I Part VIForward-Looking Statements Disclaimer 3 Related Party Transactions 35
Non-IFRS Financial Measures 3Part VII
Part II Summary of Significant Accounting Policies
Business Overview and Strategy 6 and Estimates 37
Significant Event 6 Financial Instruments 37
Financial and Operational Highlights 8 Risks and Uncertainties 38
Real Estate Properties 9 Controls and Procedures Concerning
Average Monthly Rent and Occupancy by Region 10 Financial Information 39
Part III Part VIIIReview of Operational Results 12 Summary of Quarterly Information 40
Funds From Operations 22
Distributions 23 Part IXReconciliation of Non-IFRS Measures 42
Part IVBalance Sheet Analysis 25
Part VLiquidity and Capital Resources 29
Capital Structure and Debt Profile 30
Unitholders’ Equity, Special Voting Units andClass B LP Units 33
MORGUARD NORTH AMERICAN RESIDENTIAL REAL ESTATE INVESTMENT TRUSTMANAGEMENT'S DISCUSSION AND ANALYSIS | JUNE 30, 2020
MORGUARD.COM 2
PART I
Morguard North American Residential Real Estate Investment Trust (“Morguard Residential REIT” or the “REIT”) is pleased to provide this review of operations and update on our financial performance for the three and six months ended June 30, 2020. Unless otherwise noted, dollar amounts are stated in thousands of Canadian dollars, except per suite and REIT trust unit (“Unit”) amounts.
The following Management’s Discussion and Analysis (“MD&A”) sets out the REIT’s strategies and provides an analysis of the financial performance for the three and six months ended June 30, 2020, and significant risks facing the business. Historical results, including trends that might appear, should not be taken as indicative of future operations or results.
This MD&A should be read in conjunction with the REIT’s unaudited condensed consolidated financial statements and accompanying notes for the three and six months ended June 30, 2020 and 2019. This MD&A is based on financial information prepared in accordance with International Financial Reporting Standards (“IFRS”) IAS 34, Interim Financial Reporting, as issued by the International Accounting Standards Board (“IASB”) and is dated July 28, 2020. Disclosure contained in this document is current to that date unless otherwise noted.
Additional information relating to Morguard Residential REIT, including the REIT’s Annual Information Form, can be found at www.sedar.com and www.morguard.com.
FORWARD-LOOKING STATEMENTS DISCLAIMERStatements contained herein that are not based on historical or current fact, including without limitation, statements containing the words “anticipates”, “believes”, “may”, “continue”, “estimate”, “expects” and “will” and words of similar expression, constitute “forward-looking statements”. Such forward-looking statements involve known and unknown risks, uncertainties and other factors that may cause the actual results, events or developments to be materially different from any future results, events or developments expressed or implied by such forward-looking statements. Such factors include, among others, the following: general economic and business conditions, both nationally and in the regions in which the REIT operates; changes in business strategy or development/acquisition plans; environmental exposures; financing risk; existing governmental regulations and changes in, or the failure to comply with, governmental regulations; liability and other claims asserted against the REIT; risk and uncertainties relating to the outbreak of the novel strain of the coronavirus identified as COVID-19 and other factors referred to in the REIT’s filings with Canadian securities regulators. Given these uncertainties, readers are cautioned not to place undue reliance on such forward-looking statements. Morguard Residential REIT does not assume the obligation to update or revise any forward-looking statements.
Given the impact of the changing circumstances surrounding the COVID-19 pandemic and the related response from the REIT, governments (federal, state, provincial and municipal), regulatory authorities, businesses and customers, there is inherently more uncertainty associated with the REIT’s assumptions as compared to prior periods. These assumptions and related risks, include but are not limited to management expectations with respect to the factors above as well as general economic conditions, such as the impact on the economy and financial markets of the COVID-19 pandemic and other health risks.
NON-IFRS FINANCIAL MEASURESMorguard Residential REIT reports its financial results in accordance with IFRS. However, this MD&A also uses certain financial measures that are not defined by IFRS. These measures do not have any standardized meaning prescribed by IFRS and are not necessarily comparable to similar measures presented by other reporting issuers in similar or different industries. These measures should be considered as supplemental in nature and not as substitutes for related financial information prepared in accordance with IFRS. The REIT’s management uses these measures to aid in assessing the REIT’s underlying core performance and provides these additional measures so that investors may do the same. Management believes that the non-IFRS measures described below, which supplement the IFRS measures, provide readers with a more comprehensive understanding of management’s perspective on the REIT’s operating results and performance.
MORGUARD NORTH AMERICAN RESIDENTIAL REAL ESTATE INVESTMENT TRUSTMANAGEMENT'S DISCUSSION AND ANALYSIS | JUNE 30, 2020
MORGUARD.COM 3

The following discussion describes the non-IFRS measures the REIT uses in evaluating its operating results:
NET OPERATING INCOME (“NOI”) AND PROPORTIONATE SHARE NOI (“PROPORTIONATE NOI”)NOI is defined by the REIT as revenue from real estate properties less property operating costs, realty taxes and utilities as presented in the consolidated statements of income. NOI margin is calculated as NOI divided by revenue and is also calculated on a Proportionate NOI basis. NOI is an important measure in evaluating the operating performance of the REIT’s real estate properties and is a key input in determining the fair value of the REIT’s properties.
Proportionate NOI represents NOI adjusted for the following: i) to exclude the impact of realty taxes accounted for under IFRIC 21 as noted below. Proportionate NOI records realty taxes for all properties on a pro rata basis over the entire fiscal year; ii) to exclude the non-controlling interest share of NOI for those properties that are consolidated under IFRS; and iii) to include equity-accounted investments NOI at the REIT’s ownership interest.
NOI includes the impact of realty taxes accounted for under the International Financial Reporting Interpretations Committee (“IFRIC”) Interpretation 21, Levies (“IFRIC 21”). IFRIC 21 states that an entity recognizes a levy liability in accordance with the relevant legislation. The obligating event for realty taxes for the U.S. municipalities in which the REIT operates is ownership of the property on January 1 of each year for which the tax is imposed and, as a result, the REIT records the entire annual realty tax expense for its U.S. properties on January 1, except for U.S. properties acquired during the year in which the realty taxes are not recorded in the year of acquisition.
NOI includes three Canadian properties and two U.S. properties whereby the REIT controls but does not own 100% interest in the subsidiary and, as a result, the REIT fully consolidates the results of operations within its condensed consolidated financial statements. The REIT’s non-controlling interest in subsidiaries is adjusted from NOI in calculating Proportionate NOI.
NOI does not include interest in joint arrangements that are accounted for using the equity method of accounting. The REIT’s interest in the operating performance of two U.S. properties, which are presented as equity income (loss) from investments in the consolidated statements of income, are adjusted to include its share of NOI in calculating Proportionate NOI.
A reconciliation of NOI and Proportionate NOI from the IFRS financial statement presentation of revenue from real estate properties, property operating costs, realty taxes and utilities are presented under the section Part IX, “Reconciliation of Non-IFRS Measures”.
SAME PROPERTY NOI / PROPORTIONATE NOISame Property NOI and Same Property Proportionate NOI are presented in this MD&A because management considers these non-IFRS measures to be important measures of the REIT’s operating performance for properties owned by the REIT continuously for the current and comparable reporting period and does not take into account the impact of the operating performance of property acquisitions and dispositions as well as development properties until reaching stabilized occupancy.
A reconciliation of Same Property NOI and Same Property Proportionate NOI from the IFRS financial statement presentation of revenue from real estate properties, property operating costs, realty taxes and utilities are presented under the section Part IX, “Reconciliation of Non-IFRS Measures”.
INDEBTEDNESSIndebtedness (as defined in the Declaration of Trust) is a measure of the amount of debt financing utilized by the REIT. Indebtedness is presented in this MD&A because management considers this non-IFRS measure to be an important measure of the REIT’s financial position.
A reconciliation of Indebtedness from the IFRS financial statement presentation is presented under the section Part IX, “Reconciliation of Non-IFRS Measures”.
GROSS BOOK VALUEGross book value (as defined in the Declaration of Trust) is a measure of the value of the REIT’s assets. Gross book value is presented in this MD&A because management considers this non-IFRS measure to be an important measure of the REIT’s asset base and financial position.
A reconciliation of the gross book value from the IFRS financial statement presentation is presented under the section Part IX, “Reconciliation of Non-IFRS Measures”.
MORGUARD NORTH AMERICAN RESIDENTIAL REAL ESTATE INVESTMENT TRUSTMANAGEMENT'S DISCUSSION AND ANALYSIS | JUNE 30, 2020
MORGUARD.COM 4

INDEBTEDNESS TO GROSS BOOK VALUE RATIOIndebtedness to gross book value ratio is a compliance measure in the Declaration of Trust (defined below) and establishes the limit for financial leverage of the REIT. Indebtedness to gross book value ratio is presented in this MD&A because management considers this non-IFRS measure to be an important measure of the REIT’s financial position.
INTEREST COVERAGE RATIOInterest coverage ratio measures the amount of cash flow available to meet annual interest payments on the REIT’s indebtedness. Generally, the higher the interest coverage ratio, the lower the credit risk. Interest coverage ratio is presented in this MD&A because management considers this non-IFRS measure to be an important measure of the REIT’s operating performance and financial position.
INDEBTEDNESS COVERAGE RATIOIndebtedness coverage ratio measures the amount of cash flow available to meet annual principal and interest payments on the REIT’s indebtedness. Generally, the higher the indebtedness coverage ratio, the higher the capacity for additional debt. Indebtedness coverage ratio is presented in this MD&A because management considers this non-IFRS measure to be an important measure of the REIT’s operating performance and financial position.
FUNDS FROM OPERATIONS (“FFO”)FFO is a non-IFRS measure widely used as a real estate industry standard that supplements net income and evaluates operating performance but is not indicative of funds available to meet the REIT’s cash requirements. FFO can assist with comparisons of the operating performance of the REIT’s real estate between periods and relative to other real estate entities. FFO is computed by the REIT in accordance with the current definition of the Real Property Association of Canada (“REALpac”) and is defined as net income attributable to Unitholders adjusted for fair value adjustments, distributions on the Class B LP Units, realty taxes accounted for under IFRIC 21, deferred income taxes (on the REIT’s U.S. properties), gains/losses on the sale of real estate properties (including income taxes on the sale of real estate properties) and other non-cash items. FFO payout ratio compares distributions declared to FFO. Distributions declared is calculated based on the monthly distribution per Unit multiplied by the weighted average number of Units outstanding (including Class B LP Units) during the period. The REIT considers FFO to be a useful measure for reviewing its comparative operating and financial performance.
A reconciliation of net income attributable to Unitholders (an IFRS measure) to FFO is presented under the section Part III, “Funds From Operations”.
PROPORTIONATE SHARE BASISThe REIT’s balance sheet and statements of income prepared in accordance with IFRS have been adjusted (as described below) to derive the REIT’s proportionately owned financial results (“Proportionate Basis”). In addition, the REIT’s statements of income have been adjusted to exclude the impact of realty taxes accounted for under IFRIC 21 and to record realty taxes for all properties on a pro rata basis over the entire fiscal year. Management believes that the Proportionate Basis non-IFRS measures described below, which supplement the IFRS measures, provide readers with a more comprehensive understanding of management’s perspective on the REIT’s operating results and performance.
Non-Controlling Interest Share (“NCI Share”)NCI Share adjusts for three Canadian properties and two U.S. properties whereby the REIT controls but does not own a 100% interest in the subsidiary and, as a result, the REIT fully consolidates their financial results within its consolidated financial statements. The adjustment removes the non-controlling interest portion that is consolidated under IFRS. The presentation of pro rata assets, liabilities, revenue, and expenses represents a non-IFRS measure and may not accurately depict the legal and economic implications of the REIT’s interest in the joint ventures.
Equity-accounted Investments (“Equity Interest”)Equity Interest adjusts interests in joint arrangements that are accounted for using the equity method of accounting. The financial results of two U.S. properties under IFRS are presented on a single line within the consolidated balance sheet and statements of income and have been adjusted on a proportionately owned basis to each respective financial statement line presented within the balance sheet and statements of income. The presentation of pro rata assets, liabilities, revenue, and expenses represents a non-IFRS measure and may not accurately depict the legal and economic implications of the REIT’s interest in the joint venture.
MORGUARD NORTH AMERICAN RESIDENTIAL REAL ESTATE INVESTMENT TRUSTMANAGEMENT'S DISCUSSION AND ANALYSIS | JUNE 30, 2020
MORGUARD.COM 5

PART II
BUSINESS OVERVIEW AND STRATEGYThe REIT is an unincorporated open-ended real estate investment trust established pursuant to a declaration of trust dated March 1, 2012, and as amended and restated on April 18, 2012 (the “Declaration of Trust”), under and governed by the laws of the Province of Ontario. The Units of the REIT trade on the Toronto Stock Exchange (“TSX”) under the symbol “MRG.UN.”
The REIT has been formed to own multi-suite residential rental properties across Canada and the United States. The objectives of the REIT are to: i) generate stable and growing cash distributions on a tax-efficient basis; ii) enhance the value of the REIT’s assets and maximize the long-term value of the Units through active asset and property management; and iii) expand the asset base of the REIT primarily through acquisitions and improvement of its properties through targeted and strategically deployed capital expenditures.
The REIT’s internal growth strategy will focus on maximizing cash flow from its portfolio. The REIT intends to increase cash flows by maximizing occupancy and average monthly rent (“AMR”), taking into account local conditions in each of its regional markets, managing its operating expenses as a percentage of revenues and strengthening its asset base through its building infrastructure improvement and capital expenditure programs.
The REIT’s external growth strategy is focused on opportunities to acquire additional multi-suite residential properties located in urban centres and major suburban regions in Canada and the United States that satisfy the REIT’s investment criteria, as well as generating greater cash flow from acquired properties. The REIT will seek to leverage its relationship with Morguard Corporation (“Morguard”) to access acquisition opportunities that satisfy the REIT’s investment criteria. Additionally, subject to limited exceptions, the REIT has the right of first opportunity to acquire the existing interests in Morguard’s multi-suite residential properties prior to any disposition by Morguard to a third party.
SIGNIFICANT EVENTOPERATING UPDATE - COVID-19 PANDEMICDuring March 2020, the outbreak of the novel strain of coronavirus (“COVID-19”) has resulted in governments enacting emergency measures to combat the spread of the virus. These measures, which include the implementation of travel bans, self-imposed quarantine periods and social distancing, have caused an economic slowdown and material disruption to business. Government has reacted with interventions intended to stabilize economic conditions. The duration and impact of the COVID-19 outbreak is unknown at this time. It is not possible to reliably estimate the length and severity of these developments and the impact on the financial performance and financial position of the REIT in future periods. The REIT recognizes the impact COVID-19 has on many of its tenants in North America and its stakeholders, and is committed in taking measures to protect the health of its employees, tenants and communities. In March, Morguard initiated its crisis management plan with a team mandated to maintain a safe environment for our residents, employees and stakeholders, coordinating efforts across our portfolio, standardizingcommunications and responding as circumstances demand. These are unprecedented times. Everyone has been impacted by the global efforts to reduce the spread of COVID-19. With the guidance of public health authorities, and at the direction of various levels of government, Morguard has implemented measures to help reduce the spread of COVID-19 including:
• eliminating amenities deemed to be risky and ensuring the continuation of critical services. Most amenities have re-opened, however they are restricted to maximum occupancies;
• intensified cleaning, focusing staff efforts on cleaning high-touch point areas at all our properties using approved cleaning products;
• management offices are staffed and in Canada doors remain locked;• maintenance orders for non-emergency repairs have recommenced after being deferred for most of the
second quarter;• added additional hand sanitizers to help tenants and residents maintain recommended practices for
hand washing; and• posted health and safety best practice reminders to increase awareness of the most current guidelines.
MORGUARD NORTH AMERICAN RESIDENTIAL REAL ESTATE INVESTMENT TRUSTMANAGEMENT'S DISCUSSION AND ANALYSIS | JUNE 30, 2020
MORGUARD.COM 6
We are actively monitoring the ongoing developments with regards to COVID-19 and are committed in ensuring a healthy and safe environment, adjusting our service model as necessary. On March 19, 2020, the Ontario government announced that in accordance with a new order, no new eviction notices will be issued until “further notice” and the enforcement of scheduled evictions will be postponed during the suspension of regular court operations in Ontario. The Landlord and Tenant Board also announced the suspension of eviction orders and all hearings related to eviction applications (unless the matter relates to an urgent issue), although hearings for matters not relating to evictions will proceed by appropriate means (telephone or written hearing).
However, tenants are required to pay rent while an eviction is not being enforced, as clarified by the Ontario government. If the tenant cannot pay due to the pandemic, landlords and tenants are encouraged to work together to come up with an alternative arrangement.
Ontario represents the REIT's largest region in terms of suites and net operating income and is committed to working with residents on a case-by-case basis on rent deferral arrangements discussed in more detail below. In addition, in the U.S. regions where the REIT operates, similar measures have been taken in late March and early April to pause evictions and late fees for a period of 120 days.
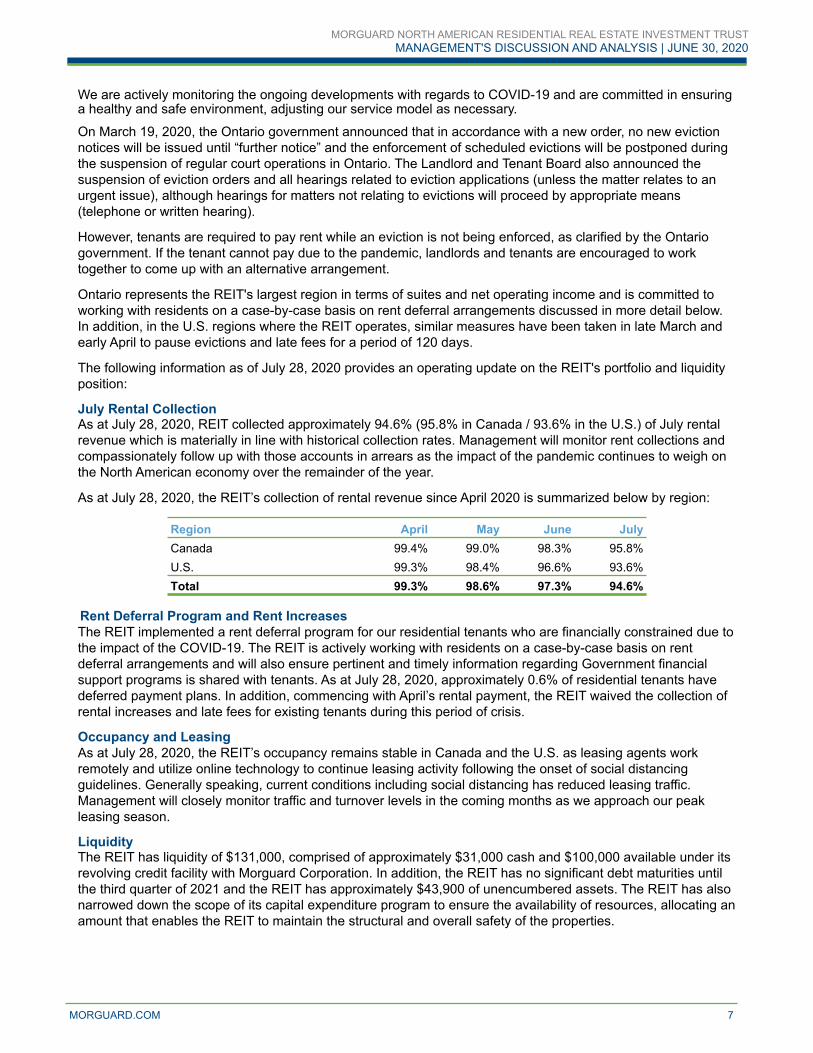
The following information as of July 28, 2020 provides an operating update on the REIT's portfolio and liquidity position: July Rental CollectionAs at July 28, 2020, REIT collected approximately 94.6% (95.8% in Canada / 93.6% in the U.S.) of July rental revenue which is materially in line with historical collection rates. Management will monitor rent collections and compassionately follow up with those accounts in arrears as the impact of the pandemic continues to weigh on the North American economy over the remainder of the year.
As at July 28, 2020, the REIT’s collection of rental revenue since April 2020 is summarized below by region:
Region April May June JulyCanada 99.4% 99.0% 98.3% 95.8%U.S. 99.3% 98.4% 96.6% 93.6%Total 99.3% 98.6% 97.3% 94.6%
Rent Deferral Program and Rent IncreasesThe REIT implemented a rent deferral program for our residential tenants who are financially constrained due to the impact of the COVID-19. The REIT is actively working with residents on a case-by-case basis on rent deferral arrangements and will also ensure pertinent and timely information regarding Government financial support programs is shared with tenants. As at July 28, 2020, approximately 0.6% of residential tenants have deferred payment plans. In addition, commencing with April’s rental payment, the REIT waived the collection of rental increases and late fees for existing tenants during this period of crisis. Occupancy and LeasingAs at July 28, 2020, the REIT’s occupancy remains stable in Canada and the U.S. as leasing agents work remotely and utilize online technology to continue leasing activity following the onset of social distancing guidelines. Generally speaking, current conditions including social distancing has reduced leasing traffic. Management will closely monitor traffic and turnover levels in the coming months as we approach our peak leasing season. LiquidityThe REIT has liquidity of $131,000, comprised of approximately $31,000 cash and $100,000 available under its revolving credit facility with Morguard Corporation. In addition, the REIT has no significant debt maturities until the third quarter of 2021 and the REIT has approximately $43,900 of unencumbered assets. The REIT has also narrowed down the scope of its capital expenditure program to ensure the availability of resources, allocating an amount that enables the REIT to maintain the structural and overall safety of the properties.
MORGUARD NORTH AMERICAN RESIDENTIAL REAL ESTATE INVESTMENT TRUSTMANAGEMENT'S DISCUSSION AND ANALYSIS | JUNE 30, 2020
MORGUARD.COM 7
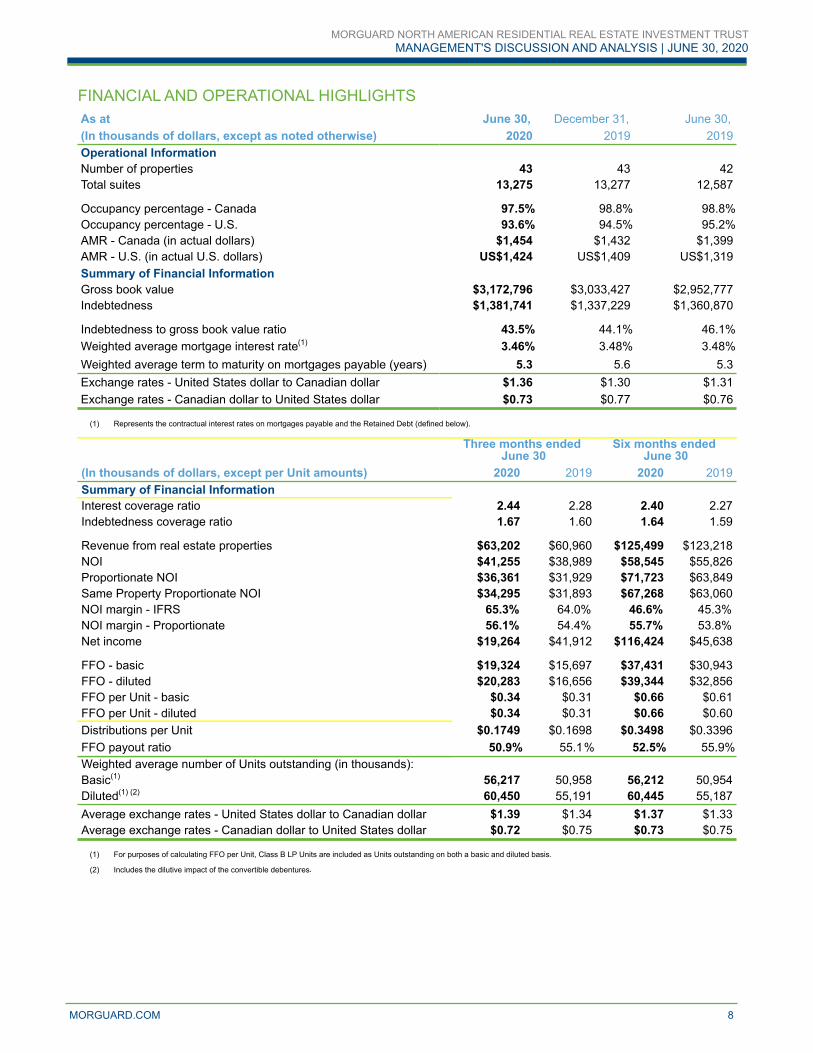
FINANCIAL AND OPERATIONAL HIGHLIGHTSAs at June 30, December 31, June 30,(In thousands of dollars, except as noted otherwise) 2020 2019 2019Operational InformationNumber of properties 43 43 42Total suites 13,275 13,277 12,587
Occupancy percentage - Canada 97.5 % 98.8 % 98.8 %Occupancy percentage - U.S. 93.6 % 94.5 % 95.2 %AMR - Canada (in actual dollars) $1,454 $1,432 $1,399AMR - U.S. (in actual U.S. dollars) US$1,424 US$1,409 US$1,319Summary of Financial InformationGross book value $3,172,796 $3,033,427 $2,952,777Indebtedness $1,381,741 $1,337,229 $1,360,870
Indebtedness to gross book value ratio 43.5% 44.1% 46.1%Weighted average mortgage interest rate(1) 3.46% 3.48% 3.48%Weighted average term to maturity on mortgages payable (years) 5.3 5.6 5.3Exchange rates - United States dollar to Canadian dollar $1.36 $1.30 $1.31Exchange rates - Canadian dollar to United States dollar $0.73 $0.77 $0.76
(1) Represents the contractual interest rates on mortgages payable and the Retained Debt (defined below).
Three months ended June 30
Six months ended June 30
(In thousands of dollars, except per Unit amounts) 2020 2019 2020 2019Summary of Financial InformationInterest coverage ratio 2.44 2.28 2.40 2.27Indebtedness coverage ratio 1.67 1.60 1.64 1.59
Revenue from real estate properties $63,202 $60,960 $125,499 $123,218NOI $41,255 $38,989 $58,545 $55,826Proportionate NOI $36,361 $31,929 $71,723 $63,849Same Property Proportionate NOI $34,295 $31,893 $67,268 $63,060NOI margin - IFRS 65.3% 64.0% 46.6% 45.3% NOI margin - Proportionate 56.1% 54.4% 55.7% 53.8% Net income $19,264 $41,912 $116,424 $45,638
FFO - basic $19,324 $15,697 $37,431 $30,943FFO - diluted $20,283 $16,656 $39,344 $32,856FFO per Unit - basic $0.34 $0.31 $0.66 $0.61FFO per Unit - diluted $0.34 $0.31 $0.66 $0.60Distributions per Unit $0.1749 $0.1698 $0.3498 $0.3396FFO payout ratio 50.9 % 55.1 % 52.5% 55.9%Weighted average number of Units outstanding (in thousands):Basic(1) 56,217 50,958 56,212 50,954Diluted(1) (2) 60,450 55,191 60,445 55,187Average exchange rates - United States dollar to Canadian dollar $1.39 $1.34 $1.37 $1.33Average exchange rates - Canadian dollar to United States dollar $0.72 $0.75 $0.73 $0.75
(1) For purposes of calculating FFO per Unit, Class B LP Units are included as Units outstanding on both a basic and diluted basis.
(2) Includes the dilutive impact of the convertible debentures.
MORGUARD NORTH AMERICAN RESIDENTIAL REAL ESTATE INVESTMENT TRUSTMANAGEMENT'S DISCUSSION AND ANALYSIS | JUNE 30, 2020
MORGUARD.COM 8

REAL ESTATE PROPERTIESAs at June 30, 2020, the REIT’s multi-suite residential property portfolio consists of 16 Canadian properties and 27 U.S. properties (including one property under development), having a total of 13,275 residential suites. The properties are primarily located in urban centres and major suburban regions in Alberta, Ontario, Colorado, Texas, Louisiana, Illinois, Georgia, Florida, North Carolina, Virginia and Maryland.
The following table details the regional distribution of the REIT’s portfolio as at June 30, 2020:
Region (In thousands of dollars, except as otherwise noted)
Number of Properties
Total Suites(1)
% of the Portfolio
(based on suites)
Fair Value of Real Estate Properties(1)
Canadian PropertiesAlberta 1 277 2.1 % $59,700 Ontario
Mississauga 7 2,219 16.7 % 659,700 Toronto 6 1,997 15.0 % 381,440 Other(2) 2 842 6.4 % 200,000
16 5,335 40.2 % $1,300,840 U.S. PropertiesColorado 2 454 3.4 % $127,422 Texas 3 1,021 7.7 % 214,914 Louisiana 2 279 2.1 % 43,610 Illinois 2 1,205 9.1 % 669,952 Georgia 3 814 6.1 % 171,754 Florida 10 2,593 19.5 % 546,224 North Carolina 2 864 6.5 % 182,438 Virginia 1 104 0.8 % 65,277 Maryland 1 492 3.7 % 179,482
26 7,826 58.9 % $2,201,073 Impact of realty taxes accounted for under IFRIC 21 15,127 Total before property under development 42 13,161 99.1 % $3,517,040 Property under development(3) 1 114 0.9 % 27,186 Total 43 13,275 100.0 % $3,544,226
(1) Total suites and fair value of real estate properties include non-controlling interest; the REIT, on a proportionate basis, has ownership of 12,255 suites. Fair value of real estate
properties represents the sum of income producing properties ($2,998,056) and equity-accounted investment properties ($546,170) inclusive of non-controlling interest share.(2) Other Ontario includes one property in each of Kitchener, Ontario and Ottawa, Ontario.(3) Represents a property located in New Orleans, Louisiana, under development. The property is expected to commence initial lease-up during the second half of 2020.
Approximately 79% of suites in Canada are located in Toronto and Mississauga, which form part of the Greater Toronto Area (“GTA”). The GTA is Canada’s most significant economic cluster and contains the largest concentration of people. The regional distribution of the remaining suites serves to add stability to the REIT’s cash flows because it reduces the REIT’s vulnerability to economic fluctuations affecting any particular region.
MORGUARD NORTH AMERICAN RESIDENTIAL REAL ESTATE INVESTMENT TRUSTMANAGEMENT'S DISCUSSION AND ANALYSIS | JUNE 30, 2020
MORGUARD.COM 9

AVERAGE MONTHLY RENT AND OCCUPANCY BY REGIONThe following table details AMR (in actual dollars), stated in local currency, and occupancy of the REIT’s portfolio for the following periods and is calculated on a proportionate ownership basis:
AMR/Suite at AMR/Suite at Occupancy at Occupancy atJune 30, June 30, % June 30, June 30,
Region 2020 2019 Change 2020 2019
Canadian Properties (in Canadian dollars)Alberta $1,407 $1,395 0.9% 84.2 % 93.1 %Ontario
Mississauga 1,618 1,546 4.7% 98.0 % 99.6 %Toronto 1,299 1,259 3.2% 99.0 % 99.0 %Other(1) 1,396 1,340 4.2% 97.0 % 97.8 %Total Ontario 1,456 1,399 4.1% 98.2 % 99.1 %
Total Canada (in Canadian dollars) $1,454 $1,399 3.9% 97.5 % 98.8 %
U.S. Properties (in US dollars)Colorado $1,424 $1,375 3.6% 95.8 % 95.3 %Texas 1,320 1,282 3.0% 94.3 % 96.1 %Louisiana 1,226 1,208 1.5% 90.5 % 97.4 %Illinois 2,461 2,416 1.9% 90.7 % 96.6 %Georgia 1,284 1,236 3.9% 91.6 % 95.6 %Florida 1,289 1,246 3.5% 95.6 % 94.8 %North Carolina 1,108 1,058 4.7% 94.9 % 94.5 %Virginia 2,146 2,192 (2.1%) 95.1 % 96.1 %Maryland 1,882 1,890 (0.4%) 93.2 % 92.0 %U.S. Same Property 1,359 1,319 3.0% 94.3 % 95.2 %Acquisition(2) 2,647 — 100.0% 79.7 % — %Total U.S. (in US dollars) $1,424 $1,319 8.0% 93.6 % 95.2 %
Total (in local currencies) $1,437 $1,355 6.1% 95.3 % 96.8 %
(1) Other Ontario includes one property in each of Kitchener, Ontario and Ottawa, Ontario.(2) U.S. acquisition includes the Marquee at Block 37 acquired on December 9, 2019.
As at June 30, 2020, AMR per suite in Canada increased by 3.9% compared to June 30, 2019, mainly due to rental rate increases in line with the Ontario guideline rate in 2020 of 2.2% (2019 - 1.8%), above guideline increases at several properties upon the completion of capital projects and rental rate increases on suite turnover. During the three months ended June 30, 2020, the REIT waived the collection of rental increases for existing tenants during this period of crisis, which had a slight impact as a reduction of AMR.
Sequentially, Same Property AMR in Canada of $1,454 increased slightly (0.5%) compared to $1,447 as at March 31, 2020, reflecting lower turnover and waived rental increases.
The REIT continued to experience strong demand, particularly in Ontario, which has allowed the REIT to increase rents as suites turn over. During the six months ended June 30, 2020, the REIT’s Canadian portfolio turned over 236 suites, or 4.4% of total suites located in Canada and achieved AMR growth of 21.3% on suite turnover. Overall, Canadian turnover is lower compared to 7.4% achieved during the six months ended June 30, 2019, largely due to the impact COVID-19 had on disrupting normal traffic patterns as tenants were less willing to move.
As at June 30, 2020, occupancy in Canada is 97.5%, compared to 98.8% at June 30, 2019, reflecting strong and stable demand predominantly in Ontario. Overall, occupancy in Canada has declined slightly due to continued lower leasing traffic resulting from social distancing restrictions and current economic conditions. As the number of move-outs outpaced move-ins, the REIT has a backlog of vacant suites, and as social distancing guidelines continued to be eased, we expect leasing traffic to increase.
The decrease in occupancy at the REIT’s single property located in Edmonton, Alberta from 93.1% at June 30, 2019 to 84.2% at June 30, 2020 primarily reflects higher seasonal turnover from student tenants moving out during the spring as well as the impact of lower leasing traffic. In an effort to stabilize occupancy, the REIT utilized rental concessions.
MORGUARD NORTH AMERICAN RESIDENTIAL REAL ESTATE INVESTMENT TRUSTMANAGEMENT'S DISCUSSION AND ANALYSIS | JUNE 30, 2020
MORGUARD.COM 10

As at June 30, 2020, Same Property AMR per suite in the U.S. increased by 3.0% compared to June 30, 2019. The REIT had AMR growth in all U.S. regions, except for Virginia and Maryland, mainly attributable to improved occupancy achieved at the end of 2019, creating less availability during 2020 compared with the previous year, which enabled leasing at higher rental rates. Strong performance in North Carolina, Colorado, Georgia and Florida lead the portfolio.
As at June 30, 2020, Same Property occupancy in the U.S. was stable at 94.3% compared to 95.2% at June 30, 2019. The onset of COVID-19 and stay-at-home orders disrupted normal traffic patterns throughout the portfolio. Management quickly pivoted to virtual leasing programs to adjust to the new environment. Traffic reduced significantly during the second quarter but at the same time, lease renewals also increased for the quarter by roughly 30% when compared to the same period in 2019. The stable occupancy was mainly due to a focus on resident retention by softening renewal increases during the second quarter while working at each community to maintain high levels of communication and service. Three properties in the U.S. were directly impacted by COVID-19 tied to universities ceasing in person classes. They include: the Georgian in Louisiana, Briarhill in Georgia and the Marquee at Block 37 in Illinois. In addition, the Marquee at Block 37 was impacted by a significant number of corporate leases targeted towards Chicago’s theater district and to a several week period of no traffic resulting from protests in the immediate vicinity. Since that time, the city of Chicago has moved into Phase IV of its reopening plan and leasing velocity has increased. Management expects the property’s underperformance to be temporary as the property works through a transition period in 2020 to reduce its exposure to, and reliance, on both corporate housing and students.
The REIT continues to utilize revenue management tools aimed at balancing rent growth, traffic and renewal exposure. As at June 30, 2020 that balance has been maintained as the busy summer leasing season began. Management aims to match expiring leases with new move ins using multiple technologies, virtual leasing and contactless apartment tours. With few exceptions, the REIT has also maintained Same Property AMR growth over 2019 within each respective sub-market as it enjoyed strong occupancies. Two of the REIT’s properties in the Washington DC metro area continue to face supply challenges in addition to slowing traffic from COVID-19. This resulted in lower AMR and the need to provide rental incentives as occupancies in the immediate sub-markets remain soft.
Sequentially, Same Property occupancy in the U.S. slightly decreased to 94.3% compared to 95.8% as at March 31, 2020. In light of the COVID-19 impact, the decrease in occupancy was due to the reasons discussed above in Illinois, Louisiana, and Georgia, partly offset by higher resident retention throughout the majority of the portfolio.
For the six months ended June 30, 2020, the REIT’s rental incentives amounted to $259 (2019 - $256), mainly at properties that were impacted by new supply. During the six months ended June 30, 2020 and throughout 2019, the use of rental incentives decreased compared to 2018, to reflect the portfolio’s stable occupancy. mainly at properties that were impacted by new supply and were impacted from reduced traffic due to COVID-19 and local protesting. Market rents are constantly monitored and increased where appropriate, with the objective of maximizing revenue growth while maintaining stable occupancy.
The following table details AMR (in actual dollars), stated in local currency, and occupancy of the REIT’s Same Property portfolio at each quarter end since September 30, 2018:
MORGUARD NORTH AMERICAN RESIDENTIAL REAL ESTATE INVESTMENT TRUSTMANAGEMENT'S DISCUSSION AND ANALYSIS | JUNE 30, 2020
MORGUARD.COM 11
PART III
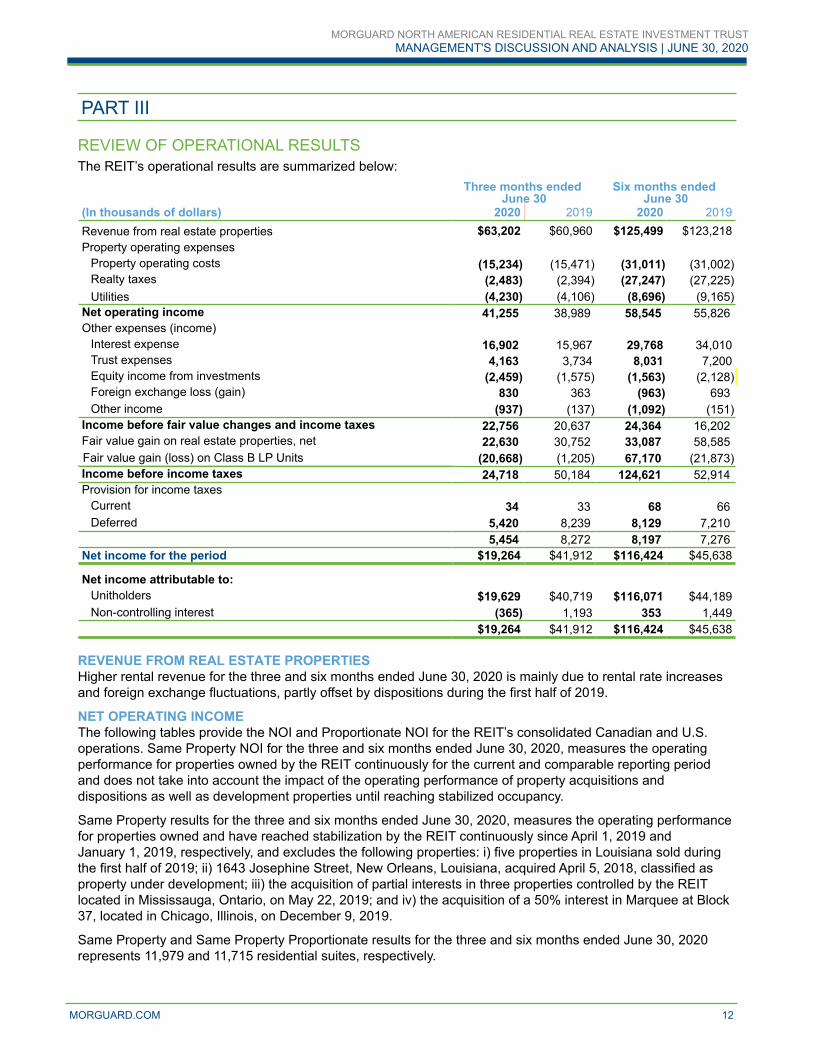
REVIEW OF OPERATIONAL RESULTSThe REIT’s operational results are summarized below:
Three months ended June 30
Six months ended June 30
(In thousands of dollars) 2020 2019 2020 2019Revenue from real estate properties $63,202 $60,960 $125,499 $123,218Property operating expenses
Property operating costs (15,234) (15,471) (31,011) (31,002) Realty taxes (2,483) (2,394) (27,247) (27,225) Utilities (4,230) (4,106) (8,696) (9,165)
Net operating income 41,255 38,989 58,545 55,826 Other expenses (income)
Interest expense 16,902 15,967 29,768 34,010Trust expenses 4,163 3,734 8,031 7,200Equity income from investments (2,459) (1,575) (1,563) (2,128) Foreign exchange loss (gain) 830 363 (963) 693 Other income (937) (137) (1,092) (151)
Income before fair value changes and income taxes 22,756 20,637 24,364 16,202 Fair value gain on real estate properties, net 22,630 30,752 33,087 58,585 Fair value gain (loss) on Class B LP Units (20,668) (1,205) 67,170 (21,873) Income before income taxes 24,718 50,184 124,621 52,914 Provision for income taxes
Current 34 33 68 66 Deferred 5,420 8,239 8,129 7,210
5,454 8,272 8,197 7,276 Net income for the period $19,264 $41,912 $116,424 $45,638
Net income attributable to:Unitholders $19,629 $40,719 $116,071 $44,189Non-controlling interest (365) 1,193 353 1,449
$19,264 $41,912 $116,424 $45,638
REVENUE FROM REAL ESTATE PROPERTIESHigher rental revenue for the three and six months ended June 30, 2020 is mainly due to rental rate increases and foreign exchange fluctuations, partly offset by dispositions during the first half of 2019.
NET OPERATING INCOMEThe following tables provide the NOI and Proportionate NOI for the REIT’s consolidated Canadian and U.S. operations. Same Property NOI for the three and six months ended June 30, 2020, measures the operating performance for properties owned by the REIT continuously for the current and comparable reporting period and does not take into account the impact of the operating performance of property acquisitions and dispositions as well as development properties until reaching stabilized occupancy.
Same Property results for the three and six months ended June 30, 2020, measures the operating performance for properties owned and have reached stabilization by the REIT continuously since April 1, 2019 and January 1, 2019, respectively, and excludes the following properties: i) five properties in Louisiana sold during the first half of 2019; ii) 1643 Josephine Street, New Orleans, Louisiana, acquired April 5, 2018, classified as property under development; iii) the acquisition of partial interests in three properties controlled by the REIT located in Mississauga, Ontario, on May 22, 2019; and iv) the acquisition of a 50% interest in Marquee at Block 37, located in Chicago, Illinois, on December 9, 2019.
Same Property and Same Property Proportionate results for the three and six months ended June 30, 2020 represents 11,979 and 11,715 residential suites, respectively.
MORGUARD NORTH AMERICAN RESIDENTIAL REAL ESTATE INVESTMENT TRUSTMANAGEMENT'S DISCUSSION AND ANALYSIS | JUNE 30, 2020
MORGUARD.COM 12
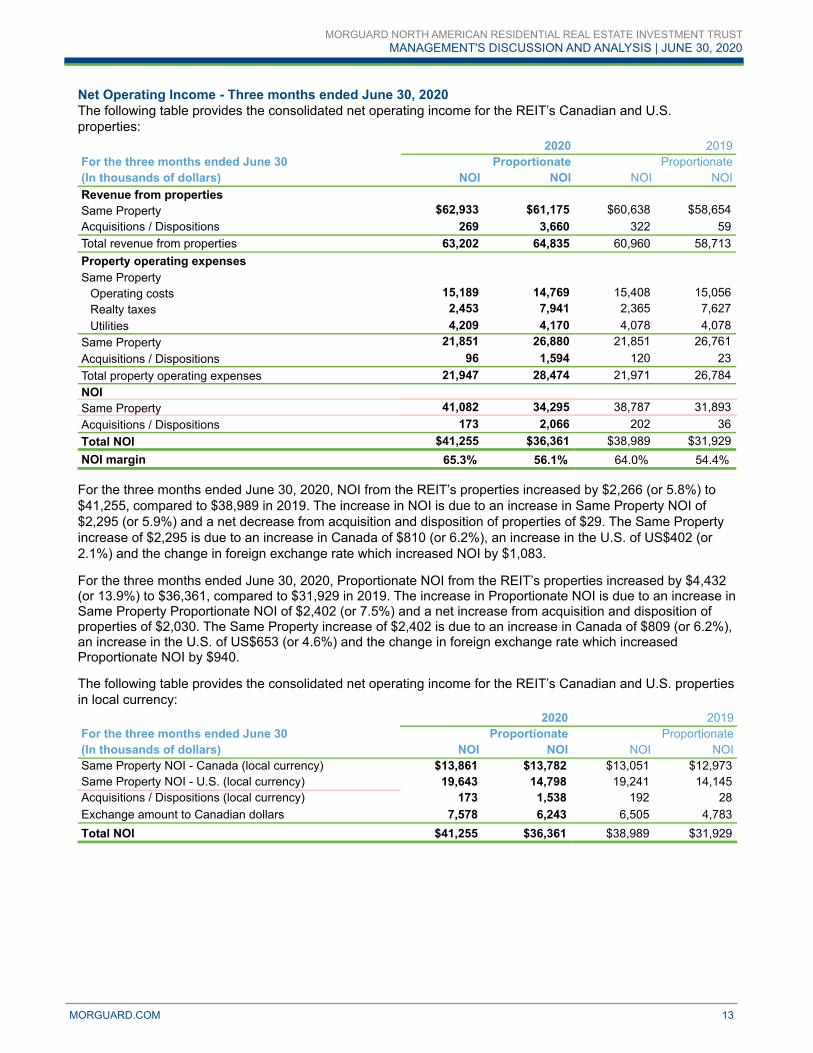
Net Operating Income - Three months ended June 30, 2020 The following table provides the consolidated net operating income for the REIT’s Canadian and U.S. properties:
2020 2019For the three months ended June 30 Proportionate Proportionate(In thousands of dollars) NOI NOI NOI NOIRevenue from propertiesSame Property $62,933 $61,175 $60,638 $58,654 Acquisitions / Dispositions 269 3,660 322 59 Total revenue from properties 63,202 64,835 60,960 58,713 Property operating expensesSame Property
Operating costs 15,189 14,769 15,408 15,056 Realty taxes 2,453 7,941 2,365 7,627 Utilities 4,209 4,170 4,078 4,078
Same Property 21,851 26,880 21,851 26,761 Acquisitions / Dispositions 96 1,594 120 23 Total property operating expenses 21,947 28,474 21,971 26,784 NOISame Property 41,082 34,295 38,787 31,893 Acquisitions / Dispositions 173 2,066 202 36 Total NOI $41,255 $36,361 $38,989 $31,929 NOI margin 65.3% 56.1% 64.0% 54.4%
For the three months ended June 30, 2020, NOI from the REIT’s properties increased by $2,266 (or 5.8%) to $41,255, compared to $38,989 in 2019. The increase in NOI is due to an increase in Same Property NOI of $2,295 (or 5.9%) and a net decrease from acquisition and disposition of properties of $29. The Same Property increase of $2,295 is due to an increase in Canada of $810 (or 6.2%), an increase in the U.S. of US$402 (or 2.1%) and the change in foreign exchange rate which increased NOI by $1,083.
For the three months ended June 30, 2020, Proportionate NOI from the REIT’s properties increased by $4,432 (or 13.9%) to $36,361, compared to $31,929 in 2019. The increase in Proportionate NOI is due to an increase in Same Property Proportionate NOI of $2,402 (or 7.5%) and a net increase from acquisition and disposition of properties of $2,030. The Same Property increase of $2,402 is due to an increase in Canada of $809 (or 6.2%), an increase in the U.S. of US$653 (or 4.6%) and the change in foreign exchange rate which increased Proportionate NOI by $940. The following table provides the consolidated net operating income for the REIT’s Canadian and U.S. properties in local currency:
2020 2019For the three months ended June 30 Proportionate Proportionate(In thousands of dollars) NOI NOI NOI NOISame Property NOI - Canada (local currency) $13,861 $13,782 $13,051 $12,973 Same Property NOI - U.S. (local currency) 19,643 14,798 19,241 14,145 Acquisitions / Dispositions (local currency) 173 1,538 192 28 Exchange amount to Canadian dollars 7,578 6,243 6,505 4,783 Total NOI $41,255 $36,361 $38,989 $31,929
MORGUARD NORTH AMERICAN RESIDENTIAL REAL ESTATE INVESTMENT TRUSTMANAGEMENT'S DISCUSSION AND ANALYSIS | JUNE 30, 2020
MORGUARD.COM 13

The following table provides the NOI and Proportionate NOI for the REIT’s Canadian properties:2020 2019
For the three months ended June 30 Proportionate Proportionate(In thousands of dollars) NOI NOI NOI NOIRevenue from propertiesSame Property $23,498 $23,372 $22,801 $22,677 Acquisitions 269 269 263 — Total revenue from properties 23,767 23,641 23,064 22,677 Property operating expensesSame Property
Operating costs 4,653 4,630 4,634 4,612 Realty taxes 2,564 2,549 2,582 2,568 Utilities 2,420 2,411 2,534 2,524
Same Property 9,637 9,590 9,750 9,704 Acquisitions 96 96 101 — Total property operating expenses 9,733 9,686 9,851 9,704 NOISame Property 13,861 13,782 13,051 12,973 Acquisitions 173 173 162 — Total NOI $14,034 $13,955 $13,213 $12,973 NOI margin 59.0% 59.0% 57.3% 57.2%
For the three months ended June 30, 2020, NOI from the Canadian properties increased by $821 (or 6.2%) to $14,034, compared to $13,213 in 2019. The increase in NOI is due to an increase in Same Property NOI of $810 (or 6.2%) and an increase of $11 from the acquisition of partial interests in three properties controlled by the REIT in May 2019. The Same Property increase was due to an increase in rental revenue of $697 (or 3.1%), from higher AMR (3.9%) and a decrease in operating expenses of $113 (or 1.2%), partially offset by increased vacancy. The decrease in operating expenses of $113 was due a decrease in utilities of $114, from lower consumption due to the positive impact of the REIT’s energy initiatives, sub-metering program and a warmer spring as compared to 2019, which was partially offset by higher water and hydro consumption related to the increased number of tenants who stayed indoors as part of social distancing guidelines during much of the second quarter. In addition, hydro rates increased as part of the province of Ontario’s new Ontario Electricity Rebate (“OER”) program on November 1, 2019, which was offset by a higher rebate under the program. Operating costs increased slightly due to an increase in insurance expense from higher premiums, higher bad debt expense and higher cleaning costs which was offset by an overall decrease in repairs and maintenance expenditures resulting from reduced leasing traffic and economic activity.
For the three months ended June 30, 2020, Proportionate NOI from the Canadian properties increased by $982 (or 7.6%) to $13,955, compared to $12,973 in 2019. The increase in Proportionate NOI is due to an increase in Same Property Proportionate NOI of $809 (or 6.2%) and an increase of $173 from the acquisition of partial interests in three properties controlled by the REIT in May 2019. The Same Property increase was due to an increase in rental revenue of $695 (or 3.1%), from higher AMR (3.9%) and a decrease in operating expenses of $114 (or 1.2%), partially offset by increased vacancy. The decrease in operating expenses of $114 was due to a decrease in utilities of $113 from lower consumption due to the positive impact of the REIT’s energy initiatives, sub-metering program and a warmer spring as compared to 2019, which was partially offset by higher water and hydro consumption related to the increased number of tenants who stayed indoors as part of social distancing guidelines during much of the second quarter. In addition, hydro rates increased as described above under the OER program which was offset by a higher rebate under the program. Operating costs increased slightly due to an increase in insurance expense from higher premiums, higher bad debt expense and higher cleaning costs which was offset by an overall decrease in repairs and maintenance expenditures resulting from reduced leasing traffic and economic activity.
The REIT’s Canadian NOI margin and Proportionate NOI margin were 59.0% and 59.0%, respectively, for the three months ended June 30, 2020, compared to 57.3% and 57.2%, respectively, for the three months ended June 30, 2019. Overall, as noted above, the 3.1% increase in revenue is due to higher AMR as well as a 1.2% decrease in operating expenses contributed to the increase in NOI margin.
MORGUARD NORTH AMERICAN RESIDENTIAL REAL ESTATE INVESTMENT TRUSTMANAGEMENT'S DISCUSSION AND ANALYSIS | JUNE 30, 2020
MORGUARD.COM 14

The following table provides the NOI and Proportionate NOI for the U.S. properties:
For the three months ended June 30 2020 2019(In thousands of U.S. dollars, Proportionate Proportionateunless otherwise stated) NOI NOI NOI NOIRevenue from propertiesSame Property $28,451 $27,270 $28,289 $26,900 Acquisitions / Dispositions — 2,445 44 44 Total revenue from properties 28,451 29,715 28,333 26,944 Property operating expensesSame Property
Operating costs 7,604 7,316 8,055 7,809 Realty taxes (86) 3,888 (162) 3,784 Utilities 1,290 1,268 1,155 1,162
Same Property 8,808 12,472 9,048 12,755 Acquisitions / Dispositions — 1,080 14 16 Total property operating expenses 8,808 13,552 9,062 12,771 NOI in US dollarsSame Property 19,643 14,798 19,241 14,145 Acquisitions / Dispositions — 1,365 30 28 Total NOI (in US dollars) 19,643 16,163 19,271 14,173 Exchange amount to Canadian dollars 7,578 6,243 6,505 4,783 NOI (in Canadian dollars) $27,221 $22,406 $25,776 $18,956 NOI margin (in US dollars) 69.0% 54.4% 68.0% 52.6%
For the three months ended June 30, 2020, NOI from the U.S. properties increased by $1,445 (or 5.6%) to $27,221, compared to $25,776 in 2019. The increase in NOI is due to an increase in Same Property NOI of US$402 (or 2.1%) and the change in foreign exchange rate which increased NOI by $1,073, partially offset by a decrease from the disposition of a property in Louisiana of $30. The Same Property increase was due to an increase in rental revenue of US$162 (or 0.6%), from higher AMR (3.0%) and a decrease in operating expenses of US$240 or (2.7%) mainly from a decrease in operating costs, partially offset by increased vacancy, concessions given on late fees and lower parking income. The decrease in operating costs of US$451 is mainly due to lower payroll from the timing of vacant positions being filled and lower repairs and maintenance due to a reduction in landscaping services and an overall decrease in expenditures resulting from reduced leasing traffic and economic activity, partially offset by an increase in insurance expense from higher premiums. The increase in realty taxes is impacted by the IFRIC 21 adjustment, as well as an increase in the assessed market value at certain properties.
For the three months ended June 30, 2020, Proportionate NOI from the U.S. properties increased by $3,450 (or 18.2%) to $22,406, compared to $18,956 in 2019. The increase in Proportionate NOI is due to an increase in Same Property Proportionate NOI of US$653 (or 4.6%), an increase in NOI of US$1,337 from the acquisition of Marquee at Block 37 in December 2019, net of a decrease from the disposition of a property in Louisiana of $28, and the change in foreign exchange rate which increased NOI by $1,460. The Same Property increase was mainly due to an increase in rental revenue of US$370 (or 1.4%), from higher AMR (3.0%) and a decrease in operating expenses of US$283 (or 2.2%), mainly from a decrease in operating costs, partially offset by increased vacancy, concessions given on late fees and lower parking income. The decrease in operating costs of US$493 is mainly due to lower payroll from the timing of vacant positions being filled and lower repairs and maintenance due to a reduction in landscaping services and an overall decrease in expenditures resulting from reduced leasing traffic and economic activity, partially offset by an increase in insurance expense from higher premiums. The increase in realty taxes of US$104 is due to an increase in the assessed market value at certain properties.
The REIT’s U.S. NOI margin and Proportionate NOI margin were 69.0% and 54.4%, respectively, for the three months ended June 30, 2020, compared to 68.0% and 52.6%, respectively, for the three months ended June 30, 2019. The NOI margin and Proportionate NOI margin were both impacted by an increase in revenue and a decrease in operating expenses, as well the acquisition of Marquee at Block 37 had a positive impact. In addition, the NOI margin was impacted by accounting for realty taxes under IFRIC 21.
MORGUARD NORTH AMERICAN RESIDENTIAL REAL ESTATE INVESTMENT TRUSTMANAGEMENT'S DISCUSSION AND ANALYSIS | JUNE 30, 2020
MORGUARD.COM 15

Net Operating Income - Six months ended June 30, 2020 The following table provides the consolidated net operating income for the REIT’s Canadian and U.S. properties:
2020 2019For the six months ended June 30 Proportionate Proportionate(In thousands of dollars) NOI NOI NOI NOIRevenue from propertiesSame Property $124,824 $121,240 $120,451 $116,620 Acquisitions / Dispositions 675 7,577 2,767 2,116 Total revenue from properties 125,499 128,817 123,218 118,736 Property operating expensesSame Property
Operating costs 30,893 30,129 29,845 29,233 Realty taxes 27,169 15,279 26,639 15,364 Utilities 8,642 8,564 8,925 8,963
Same Property 66,704 53,972 65,409 53,560 Acquisitions / Dispositions 250 3,122 1,983 1,327 Total property operating expenses 66,954 57,094 67,392 54,887 NOITotal Same Property 58,120 67,268 55,042 63,060 Acquisitions / Dispositions 425 4,455 784 789 Total NOI $58,545 $71,723 $55,826 $63,849 NOI margin 46.6% 55.7% 45.3% 53.8%
For the six months ended June 30, 2020, NOI from the REIT’s properties increased by $2,719 (or 4.9%) to $58,545, compared to $55,826 in 2019. The increase in NOI is due to an increase in Same Property NOI of $3,078 (or 5.6%) and a net decrease from acquisition and disposition of properties of $359. The Same Property increase of $3,078 is due to an increase in Canada of $1,902 (or 7.4%), an increase in the U.S. of US$140 (or 0.6%) and the change in foreign exchange rate which increased NOI by $1,036. For the six months ended June 30, 2020, Proportionate NOI from the REIT’s properties increased by $7,874 (or 12.3%) to $71,723, compared to $63,849 in 2019. The increase in Proportionate NOI is due to an increase in Same Property Proportionate NOI of $4,208 (or 6.7%) and a net increase from acquisition and disposition of properties of $3,666. The Same Property increase of $4,208 is due to an increase in Canada of $1,897 (or 7.5%), an increase in the U.S. of US$1,027 (or 3.6%) and the change in foreign exchange rate which increased Proportionate NOI by $1,284.
The following table provides the consolidated net operating income for the REIT’s Canadian and U.S. properties in local currency:
2020 2019For the six months ended June 30 Proportionate Proportionate(In thousands of dollars) NOI NOI NOI NOISame Property NOI - Canada (local currency) $27,470 $27,311 $25,568 $25,414 Same Property NOI - U.S. (local currency) 22,198 29,261 22,058 28,234 Acquisitions / Dispositions (local currency) 425 3,383 688 592 Exchange amount to Canadian dollars 8,452 11,768 7,512 9,609 Total NOI $58,545 $71,723 $55,826 $63,849
MORGUARD NORTH AMERICAN RESIDENTIAL REAL ESTATE INVESTMENT TRUSTMANAGEMENT'S DISCUSSION AND ANALYSIS | JUNE 30, 2020
MORGUARD.COM 16

The following table provides the NOI and Proportionate NOI for the REIT’s Canadian properties:2020 2019
For the six months ended June 30 Proportionate Proportionate(In thousands of dollars) NOI NOI NOI NOIRevenue from propertiesSame Property $46,802 $46,548 $45,446 $45,200 Acquisitions 675 675 651 — Total revenue from properties 47,477 47,223 46,097 45,200 Property operating expensesSame Property
Operating costs 9,645 9,599 9,082 9,041 Realty taxes 4,497 4,467 5,141 5,113 Utilities 5,190 5,171 5,655 5,632
Same Property 19,332 19,237 19,878 19,786 Acquisitions 250 250 248 — Total property operating expenses 19,582 19,487 20,126 19,786 NOISame Property 27,470 27,311 25,568 25,414 Acquisitions 425 425 403 — Total NOI $27,895 $27,736 $25,971 $25,414 NOI margin 58.8% 58.7% 56.3% 56.2%
For the six months ended June 30, 2020, NOI from the Canadian properties increased by $1,924 (or 7.4%) to $27,895, compared to $25,971 in 2019. The increase in NOI is due to an increase in Same Property NOI of $1,902 (or 7.4%) and an increase of $22 from the acquisition of partial interests in three properties controlled by the REIT in May 2019. The Same Property increase was due to an increase in rental revenue of $1,356 (or 3.0%), from higher AMR (3.9%) and a decrease in operating expenses of $546 (or 2.7%), partly offset by increased vacancy. The decrease in operating expenses of $546 was due to lower realty taxes of $644, resulting from a successful tax appeal at one property in the amount of $633, and a decrease in utilities of $465, mainly due to lower consumption resulting from the positive impact of the REIT’s energy initiatives and sub-metering program and a warmer spring compared to 2019, which was partially offset by higher water and hydro consumption related to the increased number of tenants who stayed indoors as part of social distancing guidelines during much of the second quarter. In addition, hydro rates increased as part of the OER program, which was offset by a higher rebate under the program. Operating expenses were partially offset by an increase in operating costs of $563 mainly from an increase in insurance expense from higher premiums, consulting fees of $140 in connection with the property tax refund noted above, bad debt expense and cleaning costs, which was offset by an overall decrease in repairs and maintenance expenditures resulting from reduced leasing traffic and economic activity.
For the six months ended June 30, 2020, Proportionate NOI from the Canadian properties increased by $2,322 (or 9.1%) to $27,736, compared to $25,414 in 2019. The increase in Proportionate NOI is due to an increase in Same Property Proportionate NOI of $1,897 (or 7.5%) and an increase of $425 from the acquisition of partial interests in three properties controlled by the REIT in May 2019. The Same Property increase was due to an increase in rental revenue of $1,348 (or 3.0%), from higher AMR (3.9%) and a decrease in operating expenses of $549 (or 2.8%), partly offset by increased vacancy. The decrease in operating expenses of $549 was due to lower realty taxes of $646, resulting from a successful tax appeal at one property in the amount of $633, and a decrease in utilities of $461 mainly due to mainly due to lower consumption resulting from the positive impact of the REIT’s energy initiatives, sub-metering program and a warmer spring as compared to 2019, which was partially offset by higher water and hydro consumption related to the increased number of tenants who stayed indoors as part of social distancing guidelines during much of the second quarter. In addition, hydro rates increased as part of the OER program, which was offset by a higher rebate under the program. Operating expenses were partially offset by an increase in operating costs of $558 due to an increase in insurance expense from higher premiums, consulting fees of $140 in connection with the property tax refund noted above, bad debt expense and cleaning costs which was offset by an overall decrease in repairs and maintenance expenditures resulting from reduced leasing traffic and economic activity.
The REIT’s Canadian NOI margin and Proportionate NOI margin were 58.8% and 58.7%, respectively, for the six months ended June 30, 2020, compared to 56.3% and 56.2%, respectively, for the six months ended June 30, 2019. Overall, as noted above, the 3.0% increase in revenue due to higher AMR as well as a 2.7% decrease in operating expenses contributed to the increase in NOI margin.
MORGUARD NORTH AMERICAN RESIDENTIAL REAL ESTATE INVESTMENT TRUSTMANAGEMENT'S DISCUSSION AND ANALYSIS | JUNE 30, 2020
MORGUARD.COM 17
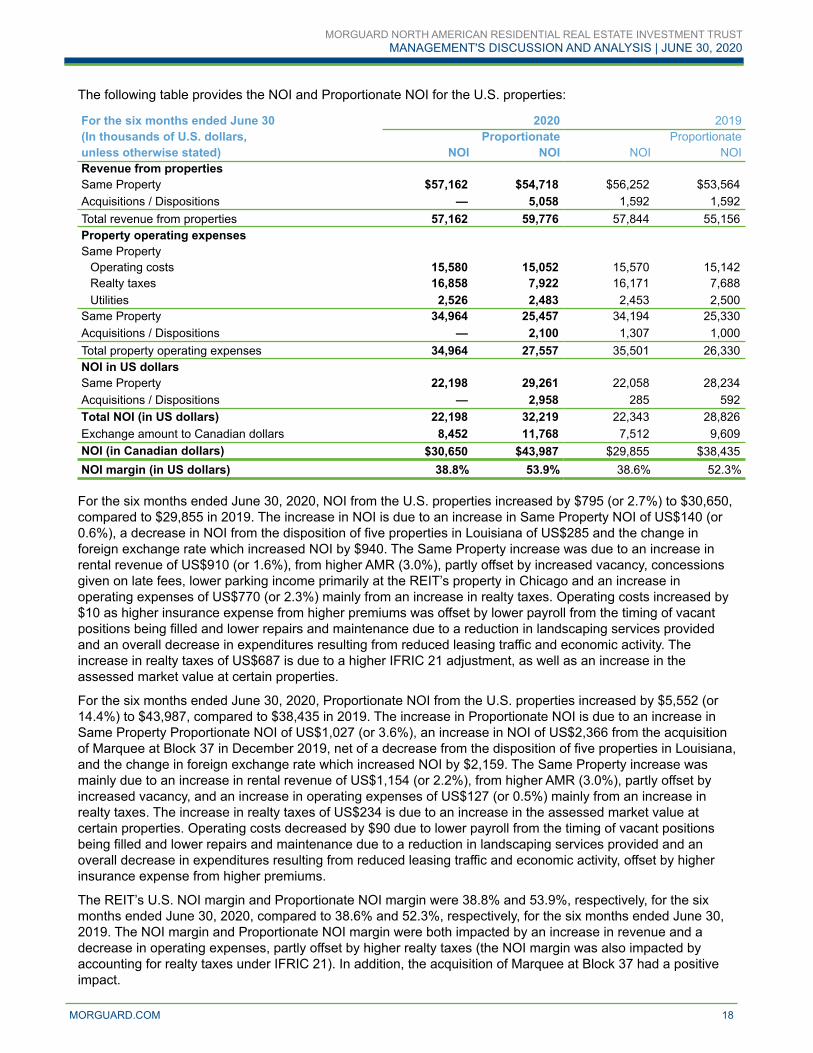
The following table provides the NOI and Proportionate NOI for the U.S. properties:
For the six months ended June 30 2020 2019(In thousands of U.S. dollars, Proportionate Proportionateunless otherwise stated) NOI NOI NOI NOIRevenue from propertiesSame Property $57,162 $54,718 $56,252 $53,564 Acquisitions / Dispositions — 5,058 1,592 1,592 Total revenue from properties 57,162 59,776 57,844 55,156 Property operating expensesSame Property
Operating costs 15,580 15,052 15,570 15,142 Realty taxes 16,858 7,922 16,171 7,688 Utilities 2,526 2,483 2,453 2,500
Same Property 34,964 25,457 34,194 25,330 Acquisitions / Dispositions — 2,100 1,307 1,000 Total property operating expenses 34,964 27,557 35,501 26,330 NOI in US dollarsSame Property 22,198 29,261 22,058 28,234 Acquisitions / Dispositions — 2,958 285 592 Total NOI (in US dollars) 22,198 32,219 22,343 28,826 Exchange amount to Canadian dollars 8,452 11,768 7,512 9,609 NOI (in Canadian dollars) $30,650 $43,987 $29,855 $38,435 NOI margin (in US dollars) 38.8% 53.9% 38.6% 52.3%
For the six months ended June 30, 2020, NOI from the U.S. properties increased by $795 (or 2.7%) to $30,650, compared to $29,855 in 2019. The increase in NOI is due to an increase in Same Property NOI of US$140 (or 0.6%), a decrease in NOI from the disposition of five properties in Louisiana of US$285 and the change in foreign exchange rate which increased NOI by $940. The Same Property increase was due to an increase in rental revenue of US$910 (or 1.6%), from higher AMR (3.0%), partly offset by increased vacancy, concessions given on late fees, lower parking income primarily at the REIT’s property in Chicago and an increase in operating expenses of US$770 (or 2.3%) mainly from an increase in realty taxes. Operating costs increased by $10 as higher insurance expense from higher premiums was offset by lower payroll from the timing of vacant positions being filled and lower repairs and maintenance due to a reduction in landscaping services provided and an overall decrease in expenditures resulting from reduced leasing traffic and economic activity. The increase in realty taxes of US$687 is due to a higher IFRIC 21 adjustment, as well as an increase in the assessed market value at certain properties.
For the six months ended June 30, 2020, Proportionate NOI from the U.S. properties increased by $5,552 (or 14.4%) to $43,987, compared to $38,435 in 2019. The increase in Proportionate NOI is due to an increase in Same Property Proportionate NOI of US$1,027 (or 3.6%), an increase in NOI of US$2,366 from the acquisition of Marquee at Block 37 in December 2019, net of a decrease from the disposition of five properties in Louisiana, and the change in foreign exchange rate which increased NOI by $2,159. The Same Property increase was mainly due to an increase in rental revenue of US$1,154 (or 2.2%), from higher AMR (3.0%), partly offset by increased vacancy, and an increase in operating expenses of US$127 (or 0.5%) mainly from an increase in realty taxes. The increase in realty taxes of US$234 is due to an increase in the assessed market value at certain properties. Operating costs decreased by $90 due to lower payroll from the timing of vacant positions being filled and lower repairs and maintenance due to a reduction in landscaping services provided and an overall decrease in expenditures resulting from reduced leasing traffic and economic activity, offset by higher insurance expense from higher premiums.
The REIT’s U.S. NOI margin and Proportionate NOI margin were 38.8% and 53.9%, respectively, for the six months ended June 30, 2020, compared to 38.6% and 52.3%, respectively, for the six months ended June 30, 2019. The NOI margin and Proportionate NOI margin were both impacted by an increase in revenue and a decrease in operating expenses, partly offset by higher realty taxes (the NOI margin was also impacted by accounting for realty taxes under IFRIC 21). In addition, the acquisition of Marquee at Block 37 had a positive impact.
MORGUARD NORTH AMERICAN RESIDENTIAL REAL ESTATE INVESTMENT TRUSTMANAGEMENT'S DISCUSSION AND ANALYSIS | JUNE 30, 2020
MORGUARD.COM 18

INTEREST EXPENSEInterest expense consists of the following:
Three months ended June 30
Six months ended June 30
(In thousands of dollars) 2020 2019 2020 2019Interest on mortgages $10,409 $10,243 $20,584 $20,644 Distributions on Class C LP Units - interest 788 809 1,567 1,602 Interest on mortgages and Retained Debt 11,197 11,052 22,151 22,246 Distributions on Class C LP Units - tax payment 143 141 286 281 Interest on convertible debentures 959 959 1,913 1,913 Interest on lease liability 117 100 233 200 Amortization of deferred financing costs 649 691 1,312 1,424 Amortization of deferred financing costs on convertible debentures 165 155 316 310 Fair value loss (gain) on conversion option on the convertible debentures 659 (126) (2,468) 1,226 Loss on extinguishment of mortgages payable — 70 — 561 Interest expense before distributions on Class B LP Units 13,889 13,042 23,743 28,161 Distributions on Class B LP Units 3,013 2,925 6,025 5,849
$16,902 $15,967 $29,768 $34,010
Total interest expense increased by $935 during the three months ended June 30, 2020, to $16,902, compared to $15,967 in 2019. The increase is predominantly due to a non-cash increase in fair value change on the convertible debentures’ conversion option of $785, an increase in interest on mortgages of $166 and an increase of $88 in distributions on Class B LP Units resulting from an increase to monthly distributions during the fourth quarter of 2019, partially offset by a decrease of $70 from a loss on extinguishment of mortgages payable associated with the disposals during 2019. The weakening of the Canadian dollar increased interest expense on U.S. mortgages by $272 excluding the impact of dispositions.
Total interest expense decreased by $4,242 during the six months ended June 30, 2020, to $29,768, compared to $34,010 in 2019. The decrease is predominantly due to a non-cash decrease in fair value on the convertible debentures’ conversion option of $3,694, a decrease in interest on mortgages of $60 and a decrease of $561 from a loss on extinguishment of mortgages payable associated with the disposals during 2019, partially offset by an increase of $176 in distribution of Class B LP Units resulting from an increase to monthly distributions during the fourth quarter of 2019. The weakening of the Canadian dollar increased interest expense on U.S. mortgages by $372 excluding the impact of dispositions.
Morguard retained the mortgages and deferred financing costs (the “Retained Debt”) on four Canadian properties, that were sold to the REIT. Morguard remains responsible for the interest and principal payments on the Retained Debt, and the Retained Debt is secured by charges on the four properties. In consideration of the Retained Debt, Morguard received Class C LP Units on which distribution payments are made in an amount sufficient to permit Morguard to satisfy amounts payable with respect to principal and interest of the Retained Debt and the tax payment that is attributable to any distributions on the Class C LP Units. The portion of the distributions that represent the interest and tax components associated with the Retained Debt that had been classified as interest expense for the three and six months ended June 30, 2020, amounted to $931 (2019 - $950) and $1,853 (2019 - $1,883), respectively.
Under IFRS, the Class B LP Units are classified as financial liabilities, and the corresponding distributions paid to the Unitholders are classified as interest expense. The REIT believes these distribution payments do not represent financing charges because these amounts are payable only if the REIT declares distributions and only for the amount of any distributions declared, both of which are at the discretion of the Board of Trustees as outlined in the Declaration of Trust. The total distributions paid and accrued to Class B LP Unitholders for the three and six months ended June 30, 2020 amounted to $3,013 (2019 - $2,925) and $6,025 (2019 - $5,849), respectively.
MORGUARD NORTH AMERICAN RESIDENTIAL REAL ESTATE INVESTMENT TRUSTMANAGEMENT'S DISCUSSION AND ANALYSIS | JUNE 30, 2020
MORGUARD.COM 19

TRUST EXPENSESTrust expenses consist of the following:
Three months ended June 30
Six months ended June 30
(In thousands of dollars) 2020 2019 2020 2019Asset management fees and distributions $3,523 $2,961 $6,790 $5,834Professional fees 311 352 583 632Public company expenses 174 185 359 365Other 155 236 299 369
$4,163 $3,734 $8,031 $7,200
Trust expenses increased by $429 during the three months ended June 30, 2020, to $4,163, compared to $3,734 in 2019, and increased by $831 during the six months ended June 30, 2020, to $8,031, compared to $7,200 in 2019. The increase during the three and six months ended June 30, 2020 is predominantly due to higher asset management fees and distributions, resulting from an increase in gross book value and growth in FFO (see Part VI, “Related Party Transactions”).
EQUITY INCOME FROM INVESTMENTSThe REIT has a 50% interest in two properties comprising 1,182 suites located in Rockville, Maryland, and in Chicago, Illinois, in which the REIT has joint control of the investments.
Equity income from investment for the three months ended June 30, 2020, was $2,459 and included a non-cash fair value gain of $281 and an IFRIC 21 adjustment of $888. For the three months ended June 30, 2019, equity income from investment was $1,575 and included a non-cash fair value gain of $1,033 and an IFRIC 21 adjustment of $274.
Equity income from investment for the six months ended June 30, 2020, was $1,563 and included a non-cash fair value gain of $449 and an IFRIC 21 expense adjustment of $1,703. For the six months ended June 30, 2019, equity income from investment was $2,128 and included a non-cash fair value gain of $2,255 and an IFRIC 21 expense adjustment of $545.
FOREIGN EXCHANGE LOSS (GAIN)IFRS requires monetary assets and liabilities denominated in foreign currencies to be translated into Canadian dollars at the exchange rate in effect at the reporting date, and any gain or loss is recognized in the consolidated statements of income. For the three and six months ended June 30, 2020, the REIT’s foreign exchange loss amounted to $830 (2019 - $363) and foreign exchange gain amounted to $963 (2019 - loss of $693), respectively, which is mainly the result of the fluctuation of the Canadian dollar against the United States dollar as at June 30, 2020, when compared to December 31, 2019.
OTHER INCOMEOther income mainly represents interest income earned from the Morguard Facility on advances made to Morguard and other expenses. Other income during the three months ended June 30, 2020, amounted to $937 (2019 - $137) and for the six months ended June 30, 2020, amounted to $1,092 (2019 - $151). The increase in other income was predominantly due to the Canada Emergency Wage Subsidy (“CEWS”) amounting to $925 from an allocation provided by Morguard affiliates of on-site payroll services relating to the REIT’s Canadian properties (see Part VI, “Related Party Transactions”).
FAIR VALUE GAIN ON REAL ESTATE PROPERTIES, NETThe REIT elected to adopt the fair value model to account for its real estate properties, and changes in fair value each period have been recognized as fair value gain or loss in the consolidated statements of income. Fair value adjustments are determined based on the movement of various valuation parameters on a quarterly basis, including stabilized NOI and capitalization rates.
For the three months ended June 30, 2020, the REIT recognized a net fair value gain of $22,630 (2019 - $30,752). The fair value gain comprises $21,464 at the REIT’s Canadian properties as a result of an increase in stabilized NOI and $1,166 at the U.S. properties, which was predominantly due to an increase in stabilized NOI, net of a $5,719 adjustment on realty taxes accounted for under IFRIC 21.
MORGUARD NORTH AMERICAN RESIDENTIAL REAL ESTATE INVESTMENT TRUSTMANAGEMENT'S DISCUSSION AND ANALYSIS | JUNE 30, 2020
MORGUARD.COM 20
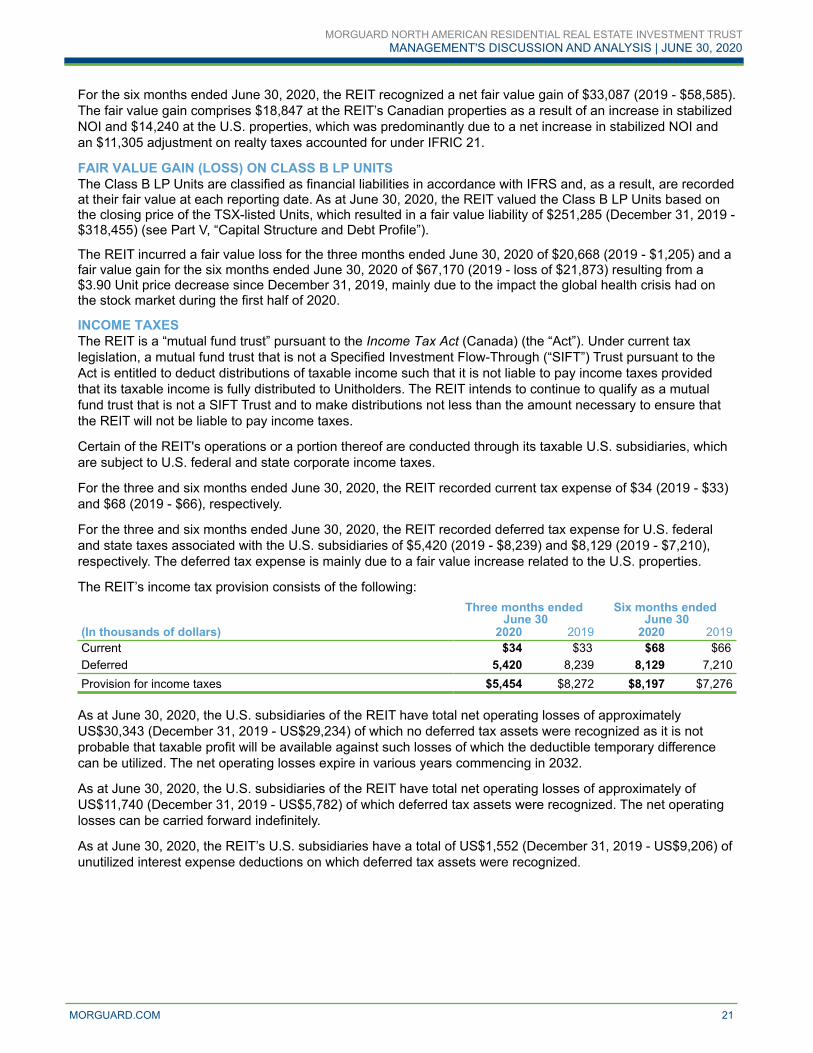
For the six months ended June 30, 2020, the REIT recognized a net fair value gain of $33,087 (2019 - $58,585). The fair value gain comprises $18,847 at the REIT’s Canadian properties as a result of an increase in stabilized NOI and $14,240 at the U.S. properties, which was predominantly due to a net increase in stabilized NOI and an $11,305 adjustment on realty taxes accounted for under IFRIC 21.
FAIR VALUE GAIN (LOSS) ON CLASS B LP UNITSThe Class B LP Units are classified as financial liabilities in accordance with IFRS and, as a result, are recorded at their fair value at each reporting date. As at June 30, 2020, the REIT valued the Class B LP Units based on the closing price of the TSX-listed Units, which resulted in a fair value liability of $251,285 (December 31, 2019 - $318,455) (see Part V, “Capital Structure and Debt Profile”). The REIT incurred a fair value loss for the three months ended June 30, 2020 of $20,668 (2019 - $1,205) and a fair value gain for the six months ended June 30, 2020 of $67,170 (2019 - loss of $21,873) resulting from a $3.90 Unit price decrease since December 31, 2019, mainly due to the impact the global health crisis had on the stock market during the first half of 2020.
INCOME TAXESThe REIT is a “mutual fund trust” pursuant to the Income Tax Act (Canada) (the “Act”). Under current tax legislation, a mutual fund trust that is not a Specified Investment Flow-Through (“SIFT”) Trust pursuant to the Act is entitled to deduct distributions of taxable income such that it is not liable to pay income taxes provided that its taxable income is fully distributed to Unitholders. The REIT intends to continue to qualify as a mutual fund trust that is not a SIFT Trust and to make distributions not less than the amount necessary to ensure that the REIT will not be liable to pay income taxes.
Certain of the REIT's operations or a portion thereof are conducted through its taxable U.S. subsidiaries, which are subject to U.S. federal and state corporate income taxes.
For the three and six months ended June 30, 2020, the REIT recorded current tax expense of $34 (2019 - $33) and $68 (2019 - $66), respectively.
For the three and six months ended June 30, 2020, the REIT recorded deferred tax expense for U.S. federal and state taxes associated with the U.S. subsidiaries of $5,420 (2019 - $8,239) and $8,129 (2019 - $7,210), respectively. The deferred tax expense is mainly due to a fair value increase related to the U.S. properties.
The REIT’s income tax provision consists of the following:Three months ended
June 30Six months ended
June 30(In thousands of dollars) 2020 2019 2020 2019Current $34 $33 $68 $66 Deferred 5,420 8,239 8,129 7,210Provision for income taxes $5,454 $8,272 $8,197 $7,276
As at June 30, 2020, the U.S. subsidiaries of the REIT have total net operating losses of approximately US$30,343 (December 31, 2019 - US$29,234) of which no deferred tax assets were recognized as it is not probable that taxable profit will be available against such losses of which the deductible temporary difference can be utilized. The net operating losses expire in various years commencing in 2032.
As at June 30, 2020, the U.S. subsidiaries of the REIT have total net operating losses of approximately of US$11,740 (December 31, 2019 - US$5,782) of which deferred tax assets were recognized. The net operating losses can be carried forward indefinitely.
As at June 30, 2020, the REIT’s U.S. subsidiaries have a total of US$1,552 (December 31, 2019 - US$9,206) of unutilized interest expense deductions on which deferred tax assets were recognized.
MORGUARD NORTH AMERICAN RESIDENTIAL REAL ESTATE INVESTMENT TRUSTMANAGEMENT'S DISCUSSION AND ANALYSIS | JUNE 30, 2020
MORGUARD.COM 21

FUNDS FROM OPERATIONSThe following table provides a reconciliation of FFO to its closely related financial statement measurement for the following periods:
Three months ended June 30
Six months ended June 30
(In thousands of dollars, except per Unit amounts) 2020 2019 2020 2019 Net income for the period attributable to Unitholders $19,629 $40,719 $116,071 $44,189 Add/(deduct):Realty taxes accounted for under IFRIC 21(1) (5,968) (5,233) 11,803 10,513 Fair value loss (gain) on conversion option on the convertible debentures 659 (126) (2,468) 1,226 Distributions on Class B LP Units recorded as interest expense(2) 3,013 2,925 6,025 5,849 Foreign exchange loss (gain) 830 363 (963) 693 Fair value gain on real estate properties, net(3) (22,911) (31,785) (33,536) (60,840) Non-controlling interests’ share of fair value gain (loss) on real estate properties (2,016) (610) (460) 230 Fair value loss (gain) on Class B LP Units 20,668 1,205 (67,170) 21,873 Deferred income tax provision 5,420 8,239 8,129 7,210 FFO - basic $19,324 $15,697 $37,431 $30,943 Interest expense on the convertible debentures 959 959 1,913 1,913 FFO - diluted $20,283 $16,656 $39,344 $32,856 FFO per Unit - basic $0.34 $0.31 $0.66 $0.61 FFO per Unit - diluted $0.34 $0.31 $0.66 $0.60
Weighted average number of Units outstanding (in thousands):Basic(4) 56,217 50,958 56,212 50,954Diluted(4) (5) 60,450 55,191 60,445 55,187
(1) Realty taxes accounted for under IFRIC 21 (including equity-accounted investments) and excludes non-controlling interests’ share.
(2) Under IFRS, the Class B LP Units are considered financial liabilities and, as a result of this classification, their corresponding distribution amounts are considered
interest expense. The REIT believes these distribution payments do not truly represent financing charges because these amounts are payable only if the REIT
declares distributions and only for the amount of any distributions declared, both of which are at the discretion of the Board of Trustees as outlined in the Declaration
of Trust. Therefore, these distributions are excluded from the calculation of FFO.
(3) Includes fair value adjustment on real estate properties for equity-accounted investments.
(4) For purposes of calculating FFO per Unit, Class B LP Units are included as Units outstanding on both a basic and diluted basis.
(5) Includes the dilutive impact of the convertible debentures.
Basic FFO for the three months ended June 30, 2020, increased by $3,627, or 23.1%, to $19,324 ($0.34 per Unit), compared to $15,697 ($0.31 per Unit) in 2019. The increase is mainly due to higher Proportionate NOI of $4,432 and an increase in other income of $800, partially offset by an increase in interest expense of $1,053 (calculated on a Proportionate Basis and excludes distributions on Class B LP Units and fair value adjustments on the conversion option on the convertible debentures) and an increase in trust expenses of $551 (calculated on a Proportionate Basis).
Basic FFO per Unit for the three months ended June 30, 2020, increased by $0.03 to $0.34 per Unit, compared to $0.31 per Unit in 2019 due to the following factors:
i) an increase on a Same Property Proportionate Basis predominantly due to an increase in NOI, partially offset by higher trust expenses had a $0.02 per Unit positive impact;
ii) an increase in other income relating to CEWS had a $0.015 per Unit positive impact;iii) the dilutive impact from the issuance of Units on August 28, 2019, offset by interest income earned on
proceeds advanced on the Morguard Facility, net of the partial use of proceeds on December 9, 2019, to acquire Marquee at Block 37, had a $0.015 per Unit negative impact;
iv) the change in the foreign exchange rate had a $0.01 per Unit positive impact.
Basic FFO for the six months ended June 30, 2020, increased by $6,488, or 21.0%, to $37,431 ($0.66 per Unit), compared to $30,943 ($0.61 per Unit) in 2019. The increase is mainly due to higher Proportionate NOI of $7,874 and an increase in other income of $941, partially offset by an increase in interest expense of $1,257 (calculated on a Proportionate Basis and excludes distributions on Class B LP Units and fair value adjustments on the conversion option on the convertible debentures) and an increase in trust expenses of $1,068 (calculated on a Proportionate Basis).
MORGUARD NORTH AMERICAN RESIDENTIAL REAL ESTATE INVESTMENT TRUSTMANAGEMENT'S DISCUSSION AND ANALYSIS | JUNE 30, 2020
MORGUARD.COM 22

Basic FFO per Unit for the six months ended June 30, 2020, increased by $0.05 to $0.66 per Unit, compared to $0.61 per Unit in 2019 due to the following factors:
i) an increase on a Same Property Proportionate Basis predominantly due to an increase in NOI, partially offset by higher trust expenses had a $0.04 per Unit positive impact;
ii) an increase in other income relating to CEWS had a $0.015 per Unit positive impact; iii) a successful property tax appeal, net of consulting fees had a $0.01 per Unit positive impact;iv) the dilutive impact from the issuance of Units on August 28, 2019, offset by interest income earned on
proceeds advanced on the Morguard Facility, net of the partial use of proceeds on December 9, 2019, to acquire Marquee at Block 37, had a $0.025 per Unit negative impact;
v) the change in the foreign exchange rate had a $0.01 per Unit positive impact.
The disposal of five Louisiana properties for the three and six months ended June 30, 2020 had a $nil per Unit impact as the decrease in FFO generated from the properties disposed of during 2019 was offset by the extinguishment of mortgages payable.
DISTRIBUTIONSThe Trustees have discretion with respect to the timing and amounts of distributions. For the three and six months ended June 30, 2020, total distributions amounted to $9,833 (2019 - $8,653) and $19,664 (2019 - $17,304), respectively.
On October 29, 2019, the REIT announced that its Board of Trustees has approved an increase to its annual cash distributions by $0.02 per Unit (2.94%) to $0.70 per Unit on an annualized basis from $0.68 per Unit. The increase was effective for the November 2019 distribution, paid on December 16, 2019.
2020 2019Three months ended June 30 Class B LP Class B LP(In thousands of dollars) Units Units Total Units Units TotalDistributions paid and declared $6,678 $3,013 $9,691 $5,581 $2,925 $8,506 Distributions – DRIP 142 — 142 147 — 147 Total $6,820 $3,013 $9,833 $5,728 $2,925 $8,653
2020 2019Six months ended June 30 Class B LP Class B LP(In thousands of dollars) Units Units Total Units Units TotalDistributions paid and declared $13,335 $6,025 $19,360 $11,180 $5,849 $17,029 Distributions – DRIP 304 — 304 275 — 275 Total $13,639 $6,025 $19,664 $11,455 $5,849 $17,304
The following table summarizes distributions paid to holders of Units in relation to net income and cash provided by operating activities:
Three monthsended
Six monthsended
Year ended
Year ended
June 30, June 30, December 31, December 31,(In thousands of dollars) 2020 2020 2019 2018Net income $19,264 $116,424 $80,128 $174,710Cash provided by operating activities 24,269 29,271 62,483 59,947Distributions - Units(1) $6,820 $13,639 $24,527 $22,355Excess of net income over distributions $12,444 $102,785 $55,601 $152,355Excess of cash provided by operating activities over distributions $17,449 $15,632 $37,956 $37,592
(1) Excludes distributions on Class B LP Units since these were recorded as interest expense and, therefore, were deducted in calculating net income and cash provided by operating activities.
Net income for the three and six months ended June 30, 2020, includes net income of $4,720 and $82,386, respectively, of non-cash components relating to a fair value gain on real estate properties, fair value gain (loss) on Class B LP Units, an IFRIC 21 adjustment to realty taxes, equity income from investments and deferred taxes. Net income exceeded distributions when removing the impact of these non-cash items.
MORGUARD NORTH AMERICAN RESIDENTIAL REAL ESTATE INVESTMENT TRUSTMANAGEMENT'S DISCUSSION AND ANALYSIS | JUNE 30, 2020
MORGUARD.COM 23

In determining the annual level of distributions to Unitholders, the REIT looks at forward-looking cash flow information, including forecasts and budgets, and the future prospects of the REIT. Furthermore, the REIT does not consider periodic cash flow fluctuations resulting from items such as the timing of property operating costs, property tax instalments or semi-annual debenture interest payments in determining the level of distributions to Unitholders in any particular quarter. Additionally, in establishing the level of distributions to the Unitholders, the REIT considers the impact of, among other items, the future growth in the income producing properties, the impact of future acquisitions and capital expenditures related to the income producing properties.
MORGUARD NORTH AMERICAN RESIDENTIAL REAL ESTATE INVESTMENT TRUSTMANAGEMENT'S DISCUSSION AND ANALYSIS | JUNE 30, 2020
MORGUARD.COM 24
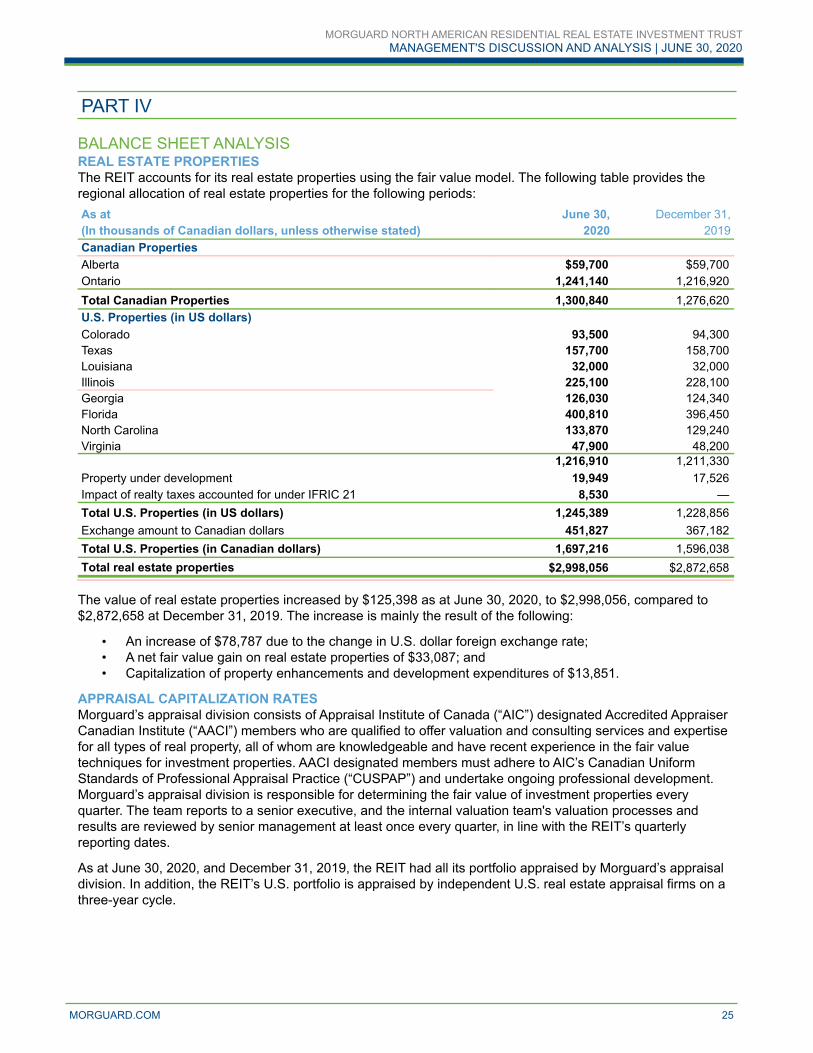
PART IV
BALANCE SHEET ANALYSISREAL ESTATE PROPERTIESThe REIT accounts for its real estate properties using the fair value model. The following table provides the regional allocation of real estate properties for the following periods:As at June 30, December 31,(In thousands of Canadian dollars, unless otherwise stated) 2020 2019Canadian PropertiesAlberta $59,700 $59,700 Ontario 1,241,140 1,216,920 Total Canadian Properties 1,300,840 1,276,620 U.S. Properties (in US dollars)Colorado 93,500 94,300 Texas 157,700 158,700 Louisiana 32,000 32,000 Illinois 225,100 228,100 Georgia 126,030 124,340 Florida 400,810 396,450 North Carolina 133,870 129,240 Virginia 47,900 48,200
1,216,910 1,211,330 Property under development 19,949 17,526 Impact of realty taxes accounted for under IFRIC 21 8,530 — Total U.S. Properties (in US dollars) 1,245,389 1,228,856 Exchange amount to Canadian dollars 451,827 367,182 Total U.S. Properties (in Canadian dollars) 1,697,216 1,596,038 Total real estate properties $2,998,056 $2,872,658
The value of real estate properties increased by $125,398 as at June 30, 2020, to $2,998,056, compared to $2,872,658 at December 31, 2019. The increase is mainly the result of the following:
• An increase of $78,787 due to the change in U.S. dollar foreign exchange rate;• A net fair value gain on real estate properties of $33,087; and• Capitalization of property enhancements and development expenditures of $13,851.
APPRAISAL CAPITALIZATION RATESMorguard’s appraisal division consists of Appraisal Institute of Canada (“AIC”) designated Accredited Appraiser Canadian Institute (“AACI”) members who are qualified to offer valuation and consulting services and expertise for all types of real property, all of whom are knowledgeable and have recent experience in the fair value techniques for investment properties. AACI designated members must adhere to AIC’s Canadian Uniform Standards of Professional Appraisal Practice (“CUSPAP”) and undertake ongoing professional development. Morguard’s appraisal division is responsible for determining the fair value of investment properties every quarter. The team reports to a senior executive, and the internal valuation team's valuation processes and results are reviewed by senior management at least once every quarter, in line with the REIT’s quarterly reporting dates.
As at June 30, 2020, and December 31, 2019, the REIT had all its portfolio appraised by Morguard’s appraisal division. In addition, the REIT’s U.S. portfolio is appraised by independent U.S. real estate appraisal firms on a three-year cycle.
MORGUARD NORTH AMERICAN RESIDENTIAL REAL ESTATE INVESTMENT TRUSTMANAGEMENT'S DISCUSSION AND ANALYSIS | JUNE 30, 2020
MORGUARD.COM 25

The REIT utilizes the direct capitalization income method to determine the fair value of its income producing properties. This method requires that rental income from current leases and key assumptions about rental income, vacancies and inflation rates, among other factors, are used to determine a one-year stabilized net operating income forecast for each individual property within the REIT’s portfolio and also considers any capital expenditures anticipated within the year. A capitalization rate was also determined for each property based on market information related to the external sale of similar properties within a similar location. These factors were used to determine the fair value of income producing properties at each reporting period.
As at June 30, 2020, using the direct capitalization income approach, the properties were valued using capitalization rates in the range of 4.0% to 6.8% (December 31, 2019 - 4.0% to 6.8%), resulting in an overall weighted average capitalization rate of 4.7% (December 31, 2019 - 4.7%).
The average capitalization rates by location are set out in the following table:
June 30, 2020 December 31, 2019Capitalization Rates Capitalization Rates
Max. Min.Weighted
Average Max. Min.Weighted
Average
CanadaAlberta 5.0 % 5.0 % 5.0 % 5.0 % 5.0 % 5.0 %Ontario 4.5 % 4.0 % 4.2 % 4.5 % 4.0 % 4.2 %
United StatesColorado 5.3 % 5.3 % 5.3 % 5.3 % 5.3 % 5.3 %Texas 5.3 % 5.0 % 5.0 % 5.3 % 5.0 % 5.0 %Louisiana 6.8 % 5.5 % 6.0 % 6.8 % 5.5 % 6.0 %Illinois(1) 4.8 % 4.5 % 4.6 % 4.8 % 4.5 % 4.6 %Georgia 5.5 % 5.0 % 5.4 % 5.5 % 5.0 % 5.4 %Florida 6.5 % 4.8 % 5.5 % 6.5 % 4.8 % 5.5 %North Carolina 5.3 % 5.0 % 5.1 % 5.3 % 5.0 % 5.1 %Virginia 4.8 % 4.8 % 4.8 % 4.8 % 4.8 % 4.8 %Maryland(1) 4.5 % 4.5 % 4.5 % 4.5 % 4.5 % 4.5 %
(1) Includes equity-accounted investments.
Fair values are most sensitive to changes in capitalization rates and stabilized net operating income. Generally, an increase in stabilized net operating income will result in an increase in the fair value of the real estate properties, and an increase in capitalization rates will result in a decrease in the fair value of the properties. The capitalization rate magnifies the effect of a change in stabilized net operating income, with a lower capitalization rate resulting in a greater impact on the fair value of the property than a higher capitalization rate. If the weighted average stabilized capitalization rate were to increase or decrease by 25 basis points (assuming no change in stabilized net operating income), the value of the income producing properties as at June 30, 2020, would decrease by $150,100 or increase by $167,247, respectively.
PROPERTY UNDER DEVELOPMENTOn April 5, 2018, the REIT acquired a property comprising 114 suites located in New Orleans, Louisiana, for a purchase price of $14,866 (US$11,636), including closing costs. As at June 30, 2020, the property is vacant and designated as a property under development. During the six months ended June 30, 2020, the REIT incurred $3,308 of development expenditures related to the development project.
The REIT commenced its preleasing efforts of its newly redeveloped mid-rise property, 1643 Josephine Street, New Orleans, which will further improve the overall quality of the portfolio. Due to COVID-19 social distancing requirements, a virtual pre-leasing process with plans to open the leasing centre as local requirements allow. The effects of COVID-19 did slow construction and the supply chain. Management anticipates first occupancies to occur toward the end of the third quarter. At the same time, increasing concerns over the spread of the virus in New Orleans could further slow construction progress and the initial lease-up. Though the project has been delayed, management is pleased with the final product while it continues to maintain the safety and wellbeing of the construction and management teams through the pandemic.
MORGUARD NORTH AMERICAN RESIDENTIAL REAL ESTATE INVESTMENT TRUSTMANAGEMENT'S DISCUSSION AND ANALYSIS | JUNE 30, 2020
MORGUARD.COM 26
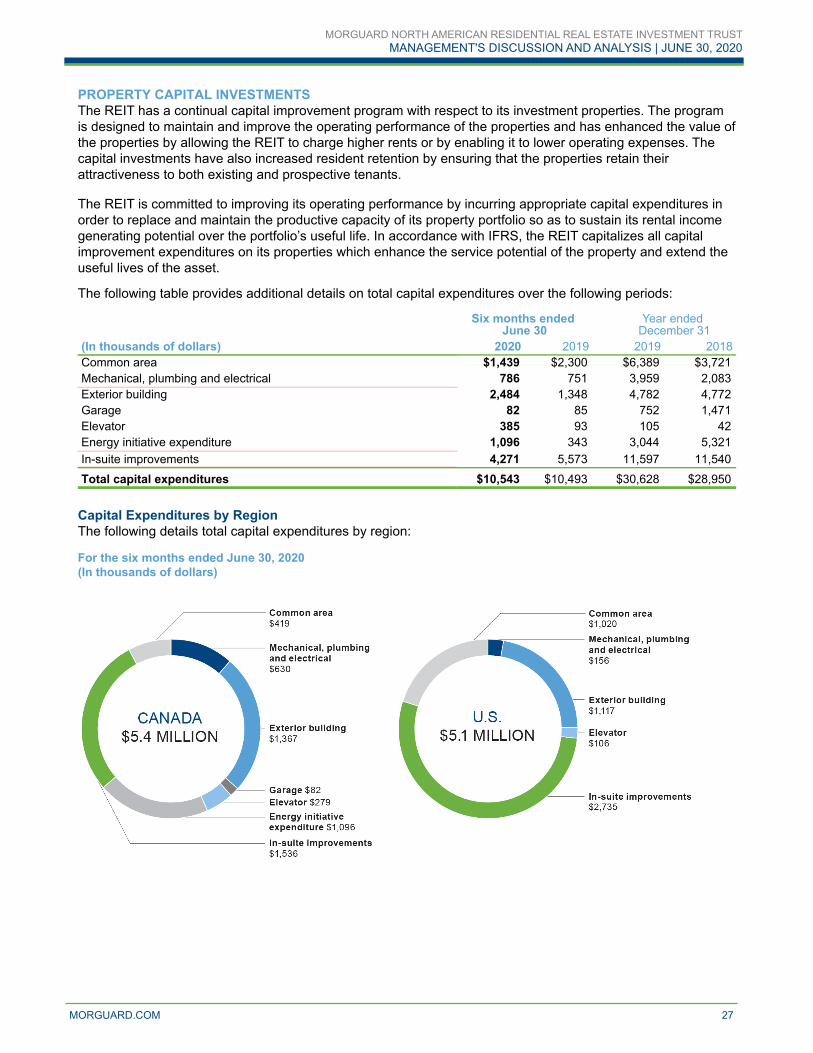
PROPERTY CAPITAL INVESTMENTSThe REIT has a continual capital improvement program with respect to its investment properties. The program is designed to maintain and improve the operating performance of the properties and has enhanced the value of the properties by allowing the REIT to charge higher rents or by enabling it to lower operating expenses. The capital investments have also increased resident retention by ensuring that the properties retain their attractiveness to both existing and prospective tenants.
The REIT is committed to improving its operating performance by incurring appropriate capital expenditures in order to replace and maintain the productive capacity of its property portfolio so as to sustain its rental income generating potential over the portfolio’s useful life. In accordance with IFRS, the REIT capitalizes all capital improvement expenditures on its properties which enhance the service potential of the property and extend the useful lives of the asset.
The following table provides additional details on total capital expenditures over the following periods:
Six months ended June 30
Year ended December 31
(In thousands of dollars) 2020 2019 2019 2018Common area $1,439 $2,300 $6,389 $3,721 Mechanical, plumbing and electrical 786 751 3,959 2,083 Exterior building 2,484 1,348 4,782 4,772 Garage 82 85 752 1,471 Elevator 385 93 105 42 Energy initiative expenditure 1,096 343 3,044 5,321 In-suite improvements 4,271 5,573 11,597 11,540
Total capital expenditures $10,543 $10,493 $30,628 $28,950
Capital Expenditures by RegionThe following details total capital expenditures by region: For the six months ended June 30, 2020(In thousands of dollars)
MORGUARD NORTH AMERICAN RESIDENTIAL REAL ESTATE INVESTMENT TRUSTMANAGEMENT'S DISCUSSION AND ANALYSIS | JUNE 30, 2020
MORGUARD.COM 27
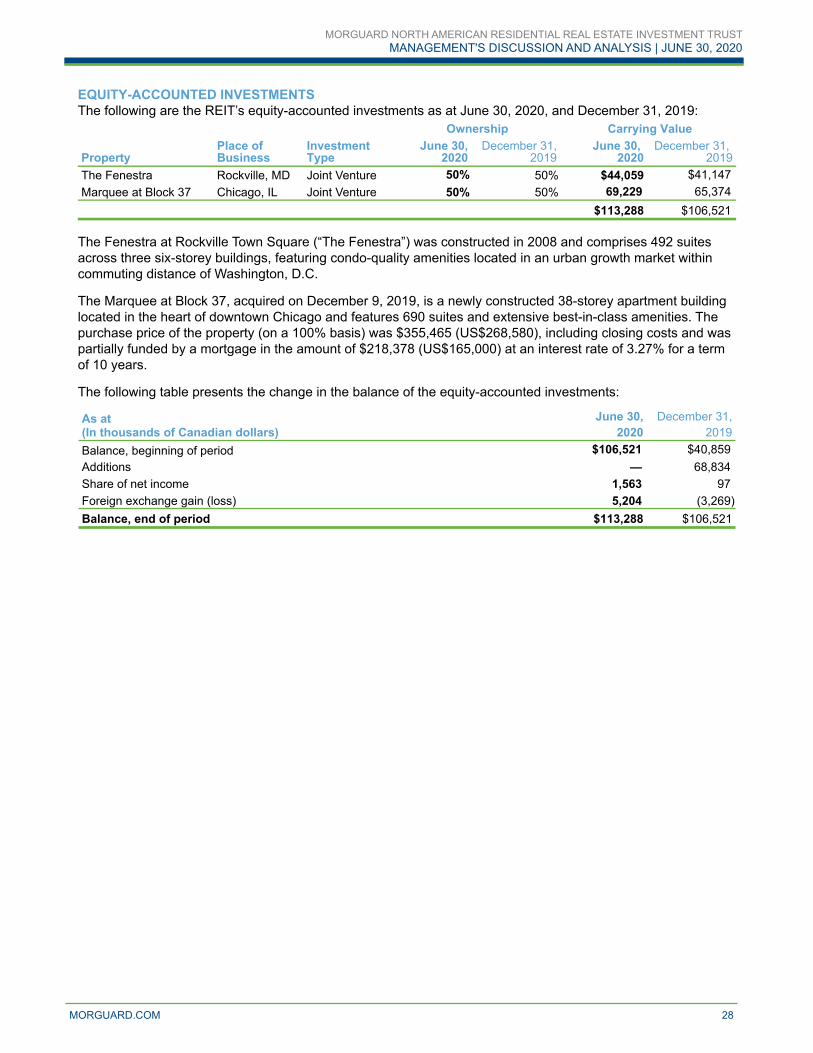
EQUITY-ACCOUNTED INVESTMENTSThe following are the REIT’s equity-accounted investments as at June 30, 2020, and December 31, 2019:
Ownership Carrying Value
PropertyPlace of Business
Investment Type
June 30, 2020
December 31, 2019
June 30, 2020
December 31, 2019
The Fenestra Rockville, MD Joint Venture 50% 50% $44,059 $41,147 Marquee at Block 37 Chicago, IL Joint Venture 50% 50% 69,229 65,374
$113,288 $106,521
The Fenestra at Rockville Town Square (“The Fenestra”) was constructed in 2008 and comprises 492 suites across three six-storey buildings, featuring condo-quality amenities located in an urban growth market within commuting distance of Washington, D.C. The Marquee at Block 37, acquired on December 9, 2019, is a newly constructed 38-storey apartment building located in the heart of downtown Chicago and features 690 suites and extensive best-in-class amenities. The purchase price of the property (on a 100% basis) was $355,465 (US$268,580), including closing costs and was partially funded by a mortgage in the amount of $218,378 (US$165,000) at an interest rate of 3.27% for a term of 10 years. The following table presents the change in the balance of the equity-accounted investments:
As at June 30, December 31,(In thousands of Canadian dollars) 2020 2019Balance, beginning of period $106,521 $40,859 Additions — 68,834 Share of net income 1,563 97 Foreign exchange gain (loss) 5,204 (3,269) Balance, end of period $113,288 $106,521
MORGUARD NORTH AMERICAN RESIDENTIAL REAL ESTATE INVESTMENT TRUSTMANAGEMENT'S DISCUSSION AND ANALYSIS | JUNE 30, 2020
MORGUARD.COM 28

PART V
LIQUIDITY AND CAPITAL RESOURCESLIQUIDITYNet cash flows from operating activities represent the primary source of liquidity to fund distributions and maintenance capital expenditures. The REIT’s net cash flows from operating activities depend on the occupancy level of its rental properties, rental rates on its leases, collectibility of rent from its tenants, level of operating expenses and other factors. Material changes in these factors may adversely affect the REIT’s cash flows from operating activities and liquidity (see Part VII, “Risks and Uncertainties”). The REIT expects to be able to meet all of its obligations, including distributions to Unitholders, maintenance and property capital expenditure commitments as they become due, and to provide for the future growth of the business. The REIT expects to have sufficient liquidity as a result of cash flows from operating activities and financing available through the Morguard Facility. Accordingly, the REIT does not intend to repay maturing debt from cash flow but rather with proceeds from refinancing such debt, subject to certain conditions (see Part V, “Capital Structure and Debt Profile”). CASH FLOWSThe following table details the changes in cash for the following periods:
Three months ended June 30
Six months ended June 30
(In thousands of dollars) 2020 2019 2020 2019Cash provided by operating activities $24,269 $17,840 $29,271 $26,244 Cash provided by (used in) investing activities (6,059) (6,268) (13,851) 25,496 Cash used in financing activities (7,564) (9,718) (1,643) (44,079) Net increase in cash during the period 10,646 1,854 13,777 7,661 Net effect of foreign currency translation on cash balance (55) (87) (181) 12 Cash, beginning of the period 20,753 22,692 17,748 16,786 Cash, end of period $31,344 $24,459 $31,344 $24,459
Three months ended June 30, 2020 and 2019 Cash Provided by Operating Activities Cash provided by operating activities during the three months ended June 30, 2020, was $24,269, compared to $17,840 in 2019. The change during the period mainly relates to an increase in non-cash operating assets and liabilities of $4,551, an increase in NOI (excluding IFRIC 21 adjustment) of $2,110 and an increase in other income of $800, partially offset by an increase in foreign exchange loss of $467 and an increase in trust expenses of $429.
Cash Used in Investing Activities Cash used in investing activities during the three months ended June 30, 2020, totalled $6,059, compared to $6,268 during the same period in 2019. Cash used in investing activities during the period consists of the capitalization of property enhancements and development expenditures.
Cash Used in Financing Activities Cash used in financing activities during the three months ended June 30, 2020, was $7,564, compared to $9,718 during the same period in 2019. The cash used in financing activities during the period was largely due to net repayments of the Morguard Facility of $9,500, repayment of a mortgage on maturity of $8,757, distributions paid to Unitholders of $6,678, mortgage principal instalment repayments of $6,081, distributions to non-controlling interest of $580, and an increase in restricted cash of $514, partially offset by the net proceeds from new mortgages of $24,546.
MORGUARD NORTH AMERICAN RESIDENTIAL REAL ESTATE INVESTMENT TRUSTMANAGEMENT'S DISCUSSION AND ANALYSIS | JUNE 30, 2020
MORGUARD.COM 29

Six months ended June 30, 2020 and 2019Cash Provided by Operating Activities Cash provided by operating activities during the six months ended June 30, 2020, was $29,271, compared to $26,244 in 2019. The change during the period mainly relates to a an increase in NOI (excluding IFRIC 21 adjustment) of $2,943, an increase in foreign exchange gain of $1,656 and an increase in other income of $941, partially offset by a decrease in non-cash operating assets and liabilities of $1,627 and an increase in trust expenses of $831.
Cash Provided by (Used in) Investing Activities Cash used in investing activities during the six months ended June 30, 2020, totalled $13,851, compared to cash provided by investing activities of $25,496 during the same period in 2019. The cash used in investing activities during the period consists of the capitalization of property enhancements and development expenditures.
Cash Used in Financing Activities Cash used in financing activities during the six months ended June 30, 2020, totalled $1,643, compared to $44,079 during the same period in 2019. The cash used in financing activities during the period was largely due to distributions paid to Unitholders of $13,335, mortgage principal instalment repayments of $12,163, repayment of a mortgage on maturity of $8,757, distributions to non-controlling interest of $1,386 and an increase in restricted cash of $748, partially offset by the net proceeds from new mortgages of $24,546 and net proceeds from the Morguard Facility of $10,200.
CAPITAL STRUCTURE AND DEBT PROFILEThe REIT’s capital management is designed to maintain a level of capital that allows it to implement its business strategy while complying with investment and debt restrictions pursuant to the Declaration of Trust, as well as existing debt covenants, while continuing to build long-term Unitholder value and maintaining sufficient capital contingencies.
The total managed capital of the REIT is summarized below:
As at June 30, December 31,(In thousands of dollars) 2020 2019Mortgages payable, principal balance $1,200,678 $1,154,960 Class C LP Units and present value of tax payment, principal balance 85,819 87,483 Convertible debentures, face value 85,500 85,500 Lease liability 9,744 9,286 Class B LP Units 251,285 318,455 Unitholders’ equity 1,273,381 1,136,363 Total capitalization $2,906,407 $2,792,047
DEBT PROFILEAs at June 30, 2020, the overall leverage, as represented by the ratio of total indebtedness to gross book value was 43.5%. The maximum allowable ratio under the Declaration of Trust is 70%.
The interest coverage ratio and the indebtedness coverage ratio are calculated based on obligations associated with mortgages payable and Class C LP Units, lease liability, the convertible debentures and the Morguard Facility.
The following table summarizes the key liquidity metrics:June 30, December 31,
As at 2020 2019Total indebtedness to gross book value 43.5 % 44.1 %Weighted average mortgage interest rate(1) 3.46 % 3.48 %Weighted average term to maturity on mortgages payable (years) 5.3 5.6
(1) Represents the contractual interest rates on mortgages payable and Class C LP Units.
MORGUARD NORTH AMERICAN RESIDENTIAL REAL ESTATE INVESTMENT TRUSTMANAGEMENT'S DISCUSSION AND ANALYSIS | JUNE 30, 2020
MORGUARD.COM 30
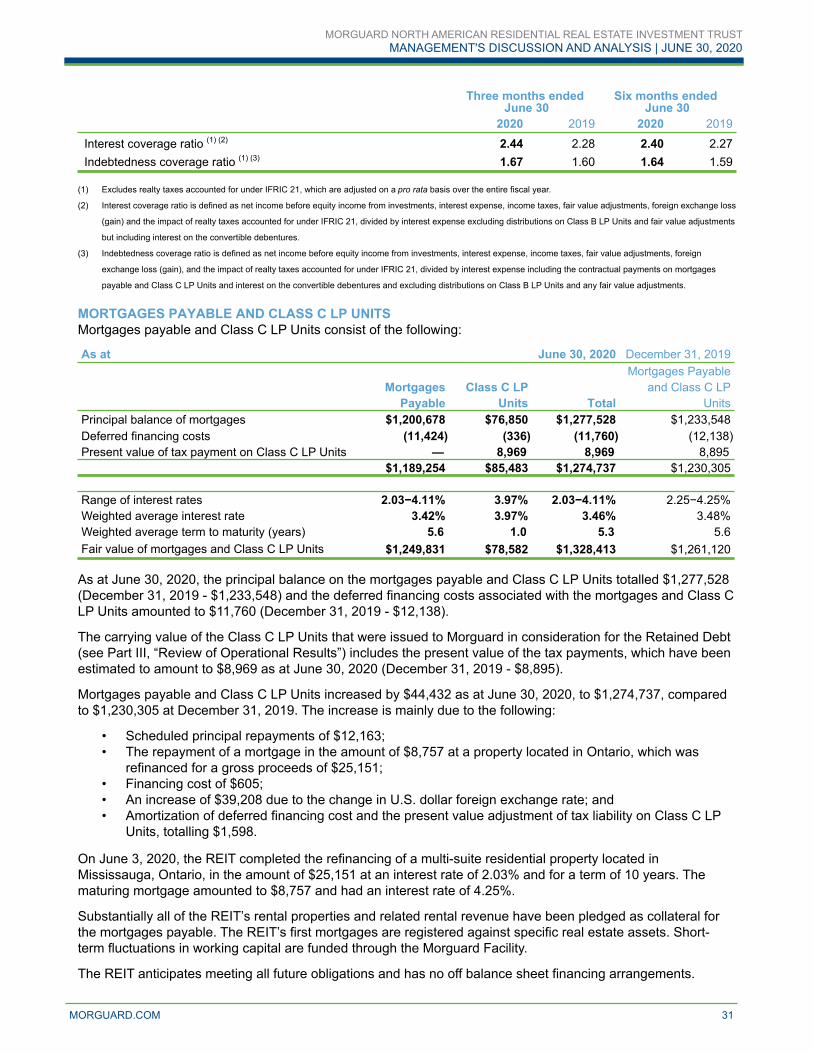
Three months ended June 30
Six months ended June 30
2020 2019 2020 2019
Interest coverage ratio (1) (2) 2.44 2.28 2.40 2.27Indebtedness coverage ratio (1) (3) 1.67 1.60 1.64 1.59
(1) Excludes realty taxes accounted for under IFRIC 21, which are adjusted on a pro rata basis over the entire fiscal year.
(2) Interest coverage ratio is defined as net income before equity income from investments, interest expense, income taxes, fair value adjustments, foreign exchange loss
(gain) and the impact of realty taxes accounted for under IFRIC 21, divided by interest expense excluding distributions on Class B LP Units and fair value adjustments
but including interest on the convertible debentures.
(3) Indebtedness coverage ratio is defined as net income before equity income from investments, interest expense, income taxes, fair value adjustments, foreign
exchange loss (gain), and the impact of realty taxes accounted for under IFRIC 21, divided by interest expense including the contractual payments on mortgages
payable and Class C LP Units and interest on the convertible debentures and excluding distributions on Class B LP Units and any fair value adjustments.
MORTGAGES PAYABLE AND CLASS C LP UNITS Mortgages payable and Class C LP Units consist of the following:
As at June 30, 2020 December 31, 2019Mortgages Payable
Mortgages Class C LP and Class C LPPayable Units Total Units
Principal balance of mortgages $1,200,678 $76,850 $1,277,528 $1,233,548Deferred financing costs (11,424) (336) (11,760) (12,138) Present value of tax payment on Class C LP Units — 8,969 8,969 8,895
$1,189,254 $85,483 $1,274,737 $1,230,305
Range of interest rates 2.03−4.11% 3.97% 2.03−4.11% 2.25−4.25%Weighted average interest rate 3.42% 3.97% 3.46% 3.48%Weighted average term to maturity (years) 5.6 1.0 5.3 5.6Fair value of mortgages and Class C LP Units $1,249,831 $78,582 $1,328,413 $1,261,120
As at June 30, 2020, the principal balance on the mortgages payable and Class C LP Units totalled $1,277,528 (December 31, 2019 - $1,233,548) and the deferred financing costs associated with the mortgages and Class C LP Units amounted to $11,760 (December 31, 2019 - $12,138).
The carrying value of the Class C LP Units that were issued to Morguard in consideration for the Retained Debt (see Part III, “Review of Operational Results”) includes the present value of the tax payments, which have been estimated to amount to $8,969 as at June 30, 2020 (December 31, 2019 - $8,895).
Mortgages payable and Class C LP Units increased by $44,432 as at June 30, 2020, to $1,274,737, compared to $1,230,305 at December 31, 2019. The increase is mainly due to the following:
• Scheduled principal repayments of $12,163;• The repayment of a mortgage in the amount of $8,757 at a property located in Ontario, which was
refinanced for a gross proceeds of $25,151;• Financing cost of $605;• An increase of $39,208 due to the change in U.S. dollar foreign exchange rate; and• Amortization of deferred financing cost and the present value adjustment of tax liability on Class C LP
Units, totalling $1,598.
On June 3, 2020, the REIT completed the refinancing of a multi-suite residential property located in Mississauga, Ontario, in the amount of $25,151 at an interest rate of 2.03% and for a term of 10 years. The maturing mortgage amounted to $8,757 and had an interest rate of 4.25%.
Substantially all of the REIT’s rental properties and related rental revenue have been pledged as collateral for the mortgages payable. The REIT’s first mortgages are registered against specific real estate assets. Short-term fluctuations in working capital are funded through the Morguard Facility.
The REIT anticipates meeting all future obligations and has no off balance sheet financing arrangements.
MORGUARD NORTH AMERICAN RESIDENTIAL REAL ESTATE INVESTMENT TRUSTMANAGEMENT'S DISCUSSION AND ANALYSIS | JUNE 30, 2020
MORGUARD.COM 31
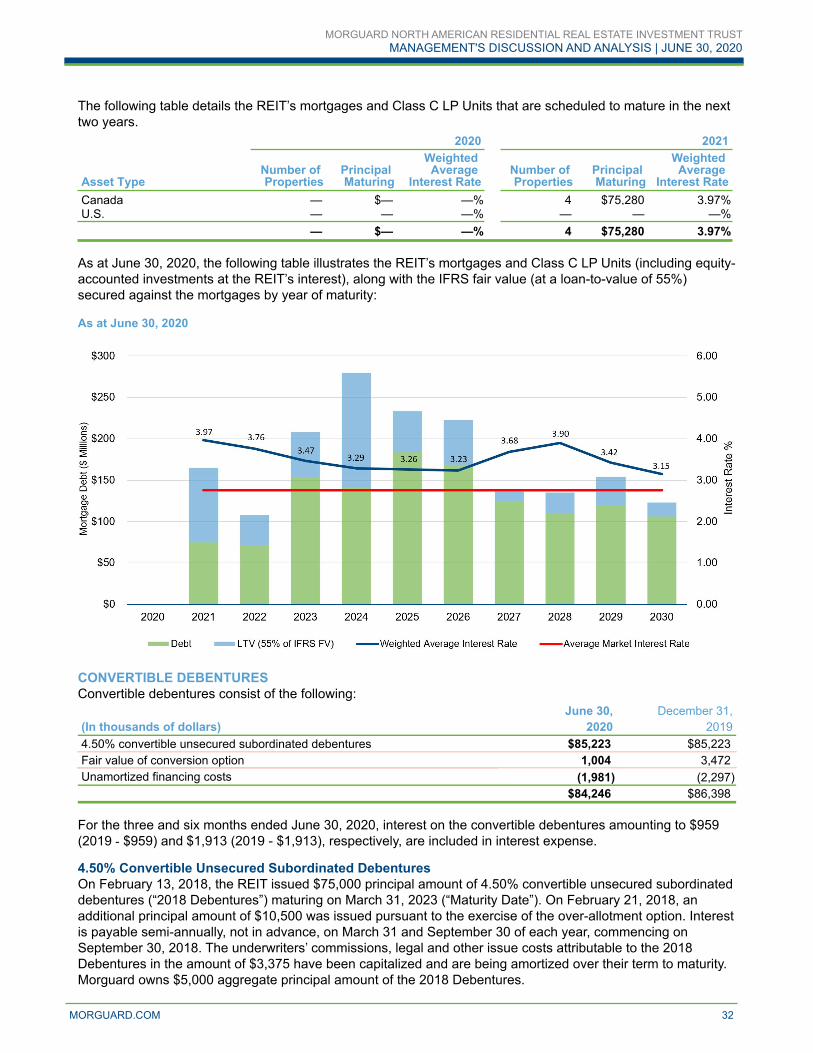
The following table details the REIT’s mortgages and Class C LP Units that are scheduled to mature in the next two years.
2020 2021
Asset TypeNumber of Properties
Principal Maturing
Weighted Average
Interest RateNumber of Properties
Principal Maturing
Weighted Average
Interest RateCanada — $— — % 4 $75,280 3.97 %U.S. — — — % — — — %
— $— — % 4 $75,280 3.97 % As at June 30, 2020, the following table illustrates the REIT’s mortgages and Class C LP Units (including equity-accounted investments at the REIT’s interest), along with the IFRS fair value (at a loan-to-value of 55%) secured against the mortgages by year of maturity: As at June 30, 2020
CONVERTIBLE DEBENTURESConvertible debentures consist of the following:As at
June 30, December 31,(In thousands of dollars) 2020 20194.50% convertible unsecured subordinated debentures $85,223 $85,223 Fair value of conversion option 1,004 3,472 Unamortized financing costs (1,981) (2,297)
$84,246 $86,398
For the three and six months ended June 30, 2020, interest on the convertible debentures amounting to $959 (2019 - $959) and $1,913 (2019 - $1,913), respectively, are included in interest expense. 4.50% Convertible Unsecured Subordinated DebenturesOn February 13, 2018, the REIT issued $75,000 principal amount of 4.50% convertible unsecured subordinated debentures (“2018 Debentures”) maturing on March 31, 2023 (“Maturity Date”). On February 21, 2018, an additional principal amount of $10,500 was issued pursuant to the exercise of the over-allotment option. Interest is payable semi-annually, not in advance, on March 31 and September 30 of each year, commencing on September 30, 2018. The underwriters’ commissions, legal and other issue costs attributable to the 2018 Debentures in the amount of $3,375 have been capitalized and are being amortized over their term to maturity. Morguard owns $5,000 aggregate principal amount of the 2018 Debentures.
MORGUARD NORTH AMERICAN RESIDENTIAL REAL ESTATE INVESTMENT TRUSTMANAGEMENT'S DISCUSSION AND ANALYSIS | JUNE 30, 2020
MORGUARD.COM 32

As at June 30, 2020, and December 31, 2019, $85,500 of the face value of the 2018 Debentures were outstanding.
Each of the 2018 Debentures can be converted into fully paid, non-assessable and freely tradable Units at the option of the holder at any time prior to the close of business on the earlier of the Maturity Date and the business day immediately preceding the date specified by the REIT for redemption of the 2018 Debentures, at a conversion price of $20.20 per Unit being a ratio of approximately 49.5050 Units per $1,000 principal amount of 2018 Debentures.
From April 1, 2021 to March 31, 2022, the 2018 Debentures will be redeemable, in whole at any time or in part from time to time, at the option of the REIT on not more than 60 days’ and not less than 30 days’ prior written notice at a redemption price equal to the principal amount thereof plus accrued and unpaid interest up to the date fixed for redemption provided that the volume-weighted average trading price of the Units on the TSX (if the Units are then listed on the TSX) for the 20 consecutive trading days ending on the fifth trading day preceding the date on which notice of redemption is given (the “Current Market Price”) is not less than 125% of the conversion price. From April 1, 2022, and prior to the Maturity Date, the 2018 Debentures shall be redeemable, in whole at any time or in part from time to time, at the option of the REIT on not more than 60 days’ and not less than 30 days’ prior written notice at a redemption price equal to the principal amount thereof plus accrued and unpaid interest up to the date fixed for redemption. Subject to regulatory approval and other conditions, the REIT may, at its option, elect to satisfy its obligation to pay, in whole or in part, the principal amount of the 2018 Debentures that are to be redeemed or that have matured by issuing and delivering that number of freely tradable Units to the debentureholders obtained by dividing the principal amount of the 2018 Debentures being repaid by 95% of the Current Market Price on the date of redemption or maturity, as applicable. MORGUARD FACILITYThe REIT has an unsecured revolving credit facility with Morguard (the “Morguard Facility”) that provides for borrowings or advances that can be drawn or advanced either in Canadian dollars or an equivalent amount in United States dollars subject to the availability of sufficient funds. If in Canadian dollars, interest will be calculated either at the Canadian prime lending rate or at the bankers’ acceptance rate plus 1.8%. If the borrowing or advance is in United States dollars, interest will be calculated either at the United States prime lending rate or at the United States dollar London Interbank Offered Rate (LIBOR) plus 1.7%. The maximum allowable to be borrowed or advanced under the Morguard Facility is $100,000.
As at June 30, 2020, the net amount receivable under the Morguard Facility was $10,456 comprising an amount receivable of US$10,681 and a payable of $4,100. As at December 31, 2019, the amount receivable under the Morguard Facility was $19,972, comprising an amount receivable of US$10,681 and a receivable of $6,100.
During the three and six months ended June 30, 2020, the REIT earned net interest income of $50 (2019 - $194) and $181 (2019 - $192), respectively, on the Morguard Facility.
UNITHOLDERS’ EQUITY, SPECIAL VOTING UNITS AND CLASS B LP UNITSUNITSThe REIT is authorized to issue an unlimited number of Units. Each Unit confers the right to one vote at any meeting of Unitholders and to participate pro rata in the distributions by the REIT and, in the event of termination or winding-up of the REIT, in the net assets of the REIT. The Unitholders have the right to require the REIT to redeem their Units on demand subject to certain conditions. The Units have no par value. Upon receipt of the redemption notice by the REIT, all rights to and under the Units tendered for redemption will cease and the holder thereof will be entitled to receive a price per Unit (“Redemption Price”) as determined by a formula outlined in the Declaration of Trust. The Redemption Price will be paid in accordance with the conditions provided for in the Declaration of Trust.
The Trustees have discretion with respect to the timing and amounts of distributions.
MORGUARD NORTH AMERICAN RESIDENTIAL REAL ESTATE INVESTMENT TRUSTMANAGEMENT'S DISCUSSION AND ANALYSIS | JUNE 30, 2020
MORGUARD.COM 33
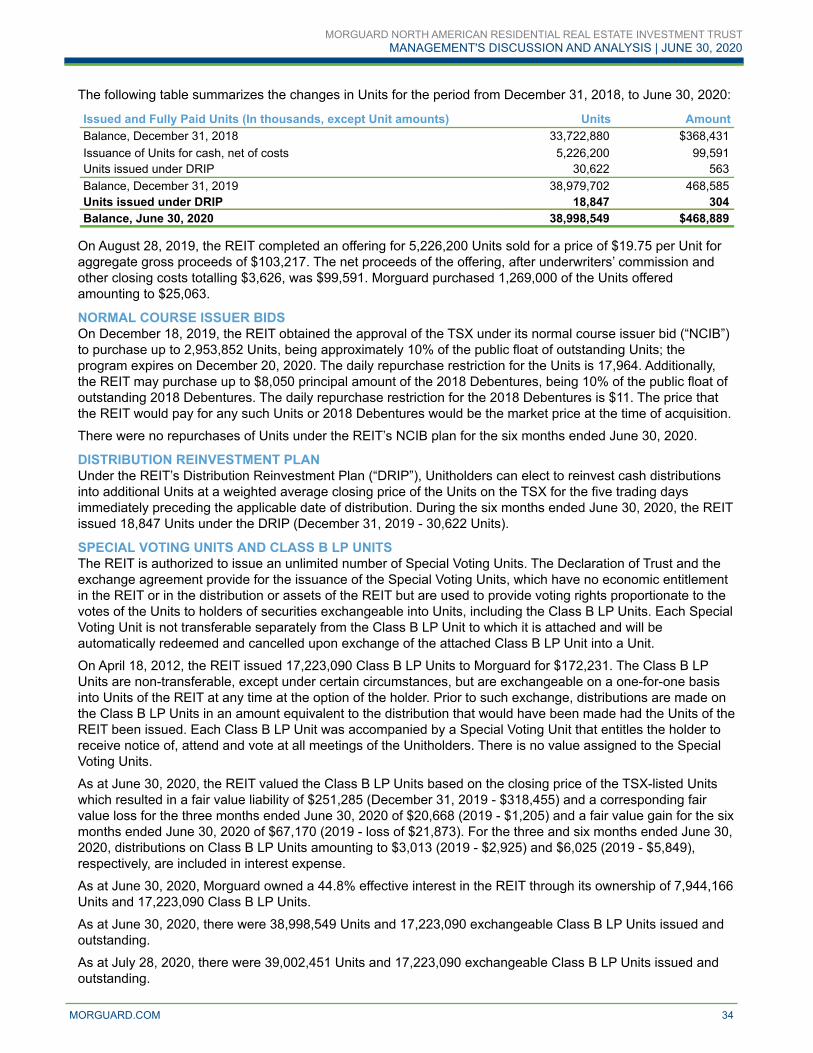
The following table summarizes the changes in Units for the period from December 31, 2018, to June 30, 2020:
Issued and Fully Paid Units (In thousands, except Unit amounts) Units AmountBalance, December 31, 2018 33,722,880 $368,431 Issuance of Units for cash, net of costs 5,226,200 99,591 Units issued under DRIP 30,622 563 Balance, December 31, 2019 38,979,702 468,585 Units issued under DRIP 18,847 304 Balance, June 30, 2020 38,998,549 $468,889
On August 28, 2019, the REIT completed an offering for 5,226,200 Units sold for a price of $19.75 per Unit for aggregate gross proceeds of $103,217. The net proceeds of the offering, after underwriters’ commission and other closing costs totalling $3,626, was $99,591. Morguard purchased 1,269,000 of the Units offered amounting to $25,063.
NORMAL COURSE ISSUER BIDSOn December 18, 2019, the REIT obtained the approval of the TSX under its normal course issuer bid (“NCIB”) to purchase up to 2,953,852 Units, being approximately 10% of the public float of outstanding Units; the program expires on December 20, 2020. The daily repurchase restriction for the Units is 17,964. Additionally, the REIT may purchase up to $8,050 principal amount of the 2018 Debentures, being 10% of the public float of outstanding 2018 Debentures. The daily repurchase restriction for the 2018 Debentures is $11. The price that the REIT would pay for any such Units or 2018 Debentures would be the market price at the time of acquisition.
There were no repurchases of Units under the REIT’s NCIB plan for the six months ended June 30, 2020.
DISTRIBUTION REINVESTMENT PLANUnder the REIT’s Distribution Reinvestment Plan (“DRIP”), Unitholders can elect to reinvest cash distributions into additional Units at a weighted average closing price of the Units on the TSX for the five trading days immediately preceding the applicable date of distribution. During the six months ended June 30, 2020, the REIT issued 18,847 Units under the DRIP (December 31, 2019 - 30,622 Units).
SPECIAL VOTING UNITS AND CLASS B LP UNITSThe REIT is authorized to issue an unlimited number of Special Voting Units. The Declaration of Trust and the exchange agreement provide for the issuance of the Special Voting Units, which have no economic entitlement in the REIT or in the distribution or assets of the REIT but are used to provide voting rights proportionate to the votes of the Units to holders of securities exchangeable into Units, including the Class B LP Units. Each Special Voting Unit is not transferable separately from the Class B LP Unit to which it is attached and will be automatically redeemed and cancelled upon exchange of the attached Class B LP Unit into a Unit.
On April 18, 2012, the REIT issued 17,223,090 Class B LP Units to Morguard for $172,231. The Class B LP Units are non-transferable, except under certain circumstances, but are exchangeable on a one-for-one basis into Units of the REIT at any time at the option of the holder. Prior to such exchange, distributions are made on the Class B LP Units in an amount equivalent to the distribution that would have been made had the Units of the REIT been issued. Each Class B LP Unit was accompanied by a Special Voting Unit that entitles the holder to receive notice of, attend and vote at all meetings of the Unitholders. There is no value assigned to the Special Voting Units.
As at June 30, 2020, the REIT valued the Class B LP Units based on the closing price of the TSX-listed Units which resulted in a fair value liability of $251,285 (December 31, 2019 - $318,455) and a corresponding fair value loss for the three months ended June 30, 2020 of $20,668 (2019 - $1,205) and a fair value gain for the six months ended June 30, 2020 of $67,170 (2019 - loss of $21,873). For the three and six months ended June 30, 2020, distributions on Class B LP Units amounting to $3,013 (2019 - $2,925) and $6,025 (2019 - $5,849), respectively, are included in interest expense.
As at June 30, 2020, Morguard owned a 44.8% effective interest in the REIT through its ownership of 7,944,166 Units and 17,223,090 Class B LP Units.
As at June 30, 2020, there were 38,998,549 Units and 17,223,090 exchangeable Class B LP Units issued and outstanding.
As at July 28, 2020, there were 39,002,451 Units and 17,223,090 exchangeable Class B LP Units issued and outstanding.
MORGUARD NORTH AMERICAN RESIDENTIAL REAL ESTATE INVESTMENT TRUSTMANAGEMENT'S DISCUSSION AND ANALYSIS | JUNE 30, 2020
MORGUARD.COM 34
PART VI
RELATED PARTY TRANSACTIONSRelated party transactions that are in the normal course of operations are subject to the same processes and controls as other transactions; that is, they are subject to standard approval procedures and management oversight but are also considered by management for reasonability against fair value. Related party transactions that are found to be material are subject to review and approval by the REIT’s Audit Committee, which consists of independent directors. AGREEMENTS WITH MORGUARD AFFILIATESThe REIT, Morguard NAR Canada Limited Partnership (the “Partnership”) and its subsidiaries entered into a series of agreements (“Agreements”) with certain Morguard affiliates whereby the following services are provided by Morguard’s affiliates under the direction of the REIT:
Property ManagementPursuant to the Agreements, Morguard’s affiliates administer the day-to-day operations of the Canadian and U.S. income producing properties, for which Morguard’s affiliates receive partnership fees and distributions equal to 3.5% of gross property revenue of the income producing properties, payable monthly. Fees and distributions for the three and six months ended June 30, 2020 amounted to $2,333 (2019 - $2,128) and $4,631 (2019 - $4,314), respectively, and are included in property operating costs and equity income from investments.
Asset ManagementPursuant to the Agreements, Morguard’s affiliates have certain duties and responsibilities for the strategic management and administration of the Partnership and its subsidiaries, for which they receive partnership fees and distributions equal to 0.25% of the Partnership’s gross book value defined as acquisition cost of the REIT’s assets plus: (i) fair value adjustments; and (ii) accumulated amortization on property, plant and equipment. In addition, an annual fee and distribution is calculated in arrears, determined by multiplying 15% of the Partnership’s funds from operations in excess of $0.66 per Unit. Fees and distributions for the three and six months ended June 30, 2020 amounted to $3,697 (2019 - $3,016) and $7,130 (2019 - $5,943), respectively, and are included in trust expenses and equity income from investments.
AcquisitionPursuant to the Agreements, Morguard’s affiliates are entitled to receive partnership fees with respect to properties acquired, directly or indirectly, by the REIT from third parties, and the fees are to be paid upon the closing of the purchase of each such property. The fees range from 0% of the purchase price paid for properties acquired directly or indirectly from Morguard, including entities controlled by Morguard, up to 0.75% of the purchase price paid for properties acquired from third parties. There were no fees relating to acquisition services for the three and six months ended June 30, 2020 and 2019. FinancingPursuant to the Agreements, with respect to arranging for financing services, Morguard’s affiliates are entitled to receive partnership fees equal to 0.15% of the principal amount and associated costs (excluding mortgage premiums) of any debt financing or refinancing. Fees relating to financing services for the three and six months ended June 30, 2020 amounting to $37 (2019 - $nil) and $37 (2019 - $nil), respectively, have been capitalized to deferred financing costs.
DevelopmentPursuant to the Agreements, Morguard’s affiliates are entitled to receive partnership fees equal to 1.00% of development costs where such costs exceed $1,000 and are incurred in connection with: (i) the construction, enlargement or reconstruction of any building, erection, plant, equipment or improvement on a property; or (ii) any refurbishing, additions, upgrading or restoration of or renovations to existing buildings, erections, plant, equipment or improvements, including redevelopments, other than repair and maintenance in the ordinary course of business. Fees relating to development services for the three and six months ended June 30, 2020, amounted to $14 (2019 - $20) and $29 (2019 - $32), respectively, and are included in property under development.
MORGUARD NORTH AMERICAN RESIDENTIAL REAL ESTATE INVESTMENT TRUSTMANAGEMENT'S DISCUSSION AND ANALYSIS | JUNE 30, 2020
MORGUARD.COM 35

Other ServicesAs at June 30, 2020, the REIT had its portfolio appraised by Morguard’s appraisal division. Fees relating to appraisal services for the three and six months ended June 30, 2020, amounting to $47 (2019 - $52) and $100 (2019 - $110), respectively, are included in trust expenses. On April 11, 2020, CEWS was enacted. CEWS generally provides an amount to employers equal to 75% of employees’ remuneration paid, up to a maximum of $847 (in actual dollars) per week per employee, from March 15 to June 6, 2020, the first three periods. Subsequently, CEWS was extended to December 19, 2020. Eligibility applies to the associated related party group under common control. When the affiliated group has experienced a significant decline in revenues as compared to the same period in the previous year (among other criteria), the entity will be eligible for CEWS. Included in other income for the three and six months ended June 30, 2020, is an allocation of on-site payroll services relating to the REIT’s Canadian properties provided by Morguard affiliates amounting to $925. All the Agreements have an initial term of 10 years and are renewable for further terms of five years each, subject to certain notice provisions or upon the occurrence of an event of default as stipulated in the provisions of the Agreements.
MORGUARD NORTH AMERICAN RESIDENTIAL REAL ESTATE INVESTMENT TRUSTMANAGEMENT'S DISCUSSION AND ANALYSIS | JUNE 30, 2020
MORGUARD.COM 36
PART VII
SUMMARY OF SIGNIFICANT ACCOUNTING POLICIES AND ESTIMATESThe REIT's condensed consolidated financial statements for the three and six months ended June 30, 2020 and 2019, have been prepared in accordance with IAS 34, Interim Financial Reporting, as issued by the IASB. The condensed consolidated financial statements use the same accounting policies and methods of their application as the most recent annual audited consolidated financial statements and accompanying notes for the three and six months ended June 30, 2020, and should be read in conjunction with the most recent annual audited consolidated financial statements.
At this time, the duration and long-term impact of the COVID-19 pandemic is unknown, as is the effectiveness of the government and central bank interventions. Any estimate of the length and severity of these measures are therefore subject to significant uncertainty, and accordingly estimates of the extent to which the COVID-19 pandemic may, directly or indirectly, materially and adversely affect the REIT’s operations, financial results and condition in future periods are also subject to significant uncertainty.
The REIT’s condensed consolidated financial statements for the three and six months ended June 30, 2020 and 2019, use the same accounting policies and methods of their application as the most recent annual audited consolidated financial statements which include the significant accounting policies most affected by estimates and judgments. Management believes it is currently not possible to estimate the long-term impacts COVID-19 will have in determining estimates of fair market value for the REIT’s income producing properties and the valuation of financial instruments.
The MD&A for the year ended December 31, 2019, contains a discussion of the significant accounting policies most affected by estimates and judgments used in the preparation of the consolidated financial statements, being the accounting estimates of fair values of income producing properties and valuation of financial instruments. Management determined that as at June 30, 2020, there is no change to the assessment of the significant accounting policies most affected by estimates and judgments as detailed in the MD&A for the year ended December 31, 2019.
FINANCIAL INSTRUMENTSThe following describes the REIT’s recognized and unrecognized financial instruments.
The REIT’s financial assets and liabilities comprise cash, restricted cash, amounts receivable, the Morguard Facility, accounts payable and accrued liabilities, mortgages payable and Class C LP Units, Class B LP Units, lease liability and the convertible debentures.
Financial assets must be classified and measured on the basis of both the business model in which the assets are managed and the contractual cash flow characteristics of the asset. Financial assets subsequent to initial recognition are classified and measured based on three categories: amortized cost, fair value through other comprehensive income (“FVTOCI”) and fair value through profit or loss (“FVTPL”). Financial liabilities are classified and measured based on two categories: amortized cost and FVTPL. Fair values of financial assets and liabilities are presented as follows:
FAIR VALUE OF FINANCIAL ASSETS AND LIABILITIESThe fair values of cash, restricted cash, amounts receivable, the Morguard Facility and accounts payable and accrued liabilities approximate their carrying values due to the short-term maturity of those instruments.
Mortgages payable and Class C LP Units, lease liability and the convertible debentures are carried at amortized cost using the effective interest method of amortization. The estimated fair values of long-term borrowings have been determined based on market information, where available, or by discounting future payments of interest and principal at estimated interest rates expected to be available to the REIT.
The fair values of the mortgages payable and Class C LP Units have been determined by discounting the cash flows of these financial obligations using June 30, 2020, market rates for debts of similar terms. Based on these assumptions, as at June 30, 2020, the fair values of the mortgages payable and Class C LP Units before deferred financing costs and present value of tax payment are estimated at $1,249,831 and $78,582 (December 31, 2019 - $1,181,206 and $79,914), respectively. The fair values of the mortgages payable and Class C LP Units vary from their carrying values due to fluctuations in market interest rates since their issue.
MORGUARD NORTH AMERICAN RESIDENTIAL REAL ESTATE INVESTMENT TRUSTMANAGEMENT'S DISCUSSION AND ANALYSIS | JUNE 30, 2020
MORGUARD.COM 37

The fair values of the convertible debentures are based on their market trading price. As at June 30, 2020, the fair value of the convertible debentures before deferred financing costs has been estimated at $87,638 (December 31, 2019 - $91,400), compared with the carrying value of $85,223 (December 31, 2019 - $85,223).
The fair value of the Class B LP Units is equal to the market trading price of the Units.
RISKS AND UNCERTAINTIESThere are certain risks inherent in an investment in the Units and activities of the REIT that investors should carefully consider before investing in securities of the REIT. Risks and uncertainties are disclosed in the REIT’s MD&A for the year ended December 31, 2019 and in the Risks and Uncertainties section of the latest Annual Information Form dated, February 11, 2020.
COVID-19 AND OTHER PANDEMIC OR EPIDEMIC The outbreak of the novel strain of coronavirus, specifically identified as “COVID-19”, has resulted in governments worldwide enacting emergency measures to contain the spread of the virus. Outbreaks, or the threat of outbreaks of viruses or other contagions or epidemic or pandemic diseases, including the recent COVID-19 pandemic, may lead to prolonged voluntary or mandatory building closures, business closures, government restrictions on travel and gatherings, quarantines, self-isolation and physical distancing. The impact of these measures may lead to a general shutdown of economic activity and disrupt workforce and business operations both in North America and other parts of the World. Such occurrences, including the outbreak of COVID-19 pandemic, could have a material adverse effect on debt and capital markets, the demand for real estate and the ability of tenants to pay rent. The duration and impact of the COVID-19 pandemic is unknown at this time, as is the efficacy of the government and central bank interventions. The pace of recovery following such occurrences cannot be accurately predicted, nor can the impact on the REIT's real estate valuations, equity markets, cash flows, results of operations and the REIT's ability to obtain additional financing or re-financing and ability to make distributions to Unitholders.
Specifically, such enhanced risks associated with COVID-19 may include, but are not limited to:
(a) the negative impact on Canadian and global debt and equity capital markets, impacting both pricing and availability;
(b) ability to access capital markets at a reasonable cost;
(c) the trading price of the REIT’s securities;
(d) a material reduction in rental revenue and related collections due to associated financial hardship and non-essential business orders governing the closure of certain businesses;
(e) a material increase in vacancy potentially caused by both the resulting economic crisis and the inability of businesses to operate;
(f) uncertainty of real estate valuations resulting from the impact of a potential decline in revenue and/or lack of market activity and demand for real estate;
(g) uncertainty delivering services due to illness, REIT or government imposed isolation programs, restrictions on the movement of personnel, closures and supply chain disruptions;
(h) uncertainty associated with costs, delays and availability of resources required to complete major maintenance and expansion projects on time and budget;
(i) the impact of additional legislation, regulation, fiscal and monetary policy responses and other government interventions;
The foregoing is not an exhaustive list of all risk factors.
Developments since March 2020 regarding the COVID-19 pandemic have resulted in a substantive shift in management’s focus towards ensuring the continued health and safety of our employees and service partners, compliance with guidelines and requirements issued by various health authorities and government organizations, and continuity of other critical business operations. We remain focused on delivering our key business operations.
MORGUARD NORTH AMERICAN RESIDENTIAL REAL ESTATE INVESTMENT TRUSTMANAGEMENT'S DISCUSSION AND ANALYSIS | JUNE 30, 2020
MORGUARD.COM 38
CONTROLS AND PROCEDURES CONCERNING FINANCIAL INFORMATION The financial certification process project team has documented and assessed the design of the internal controls in order to provide reasonable assurance regarding the reliability of financial reporting and the preparation of financial statements for external purposes in accordance with IFRS. This undertaking has enabled the Chief Executive Officer and Chief Financial Officer to attest that the design of the internal controls with regard to financial information are effective using the Committee of Sponsoring Organizations of the Treadway Commission (COSO) Internal Control - Integrated Framework (2013). In order to ensure that the consolidated financial statements and MD&A present fairly, in all material respects, the financial position of the REIT and the results of its operations, management is responsible for establishing and maintaining disclosure controls and procedures, as well as internal control over financial reporting.
The REIT’s management has evaluated the effectiveness of the REIT’s disclosure controls and procedures and, based on such evaluation, has concluded that their design is adequate and effective as of and for the six months ended June 30, 2020. The REIT’s management has also evaluated the effectiveness of the internal controls over financial reporting and has concluded that their design is effective as of and for the six months ended June 30, 2020.
An information disclosure policy constitutes the framework for the information disclosure process with regard to the annual and interim filings, as well as to other reports filed or submitted under securities legislation. This policy aims in particular at identifying material information and validating the related reporting. Morguard’s Disclosure Committee, established in 2005, is responsible for ensuring compliance with this policy for both Morguard and the REIT. Morguard’s senior management acts as the Disclosure Committee, ensuring compliance with this policy and reviewing main documents to be filed with regulatory authorities to ensure that all significant information regarding operations is communicated in a timely manner.
MORGUARD NORTH AMERICAN RESIDENTIAL REAL ESTATE INVESTMENT TRUSTMANAGEMENT'S DISCUSSION AND ANALYSIS | JUNE 30, 2020
MORGUARD.COM 39

PART VIII
SUMMARY OF QUARTERLY INFORMATIONThe following table provides a summary of operating results for the last eight quarters.
(In thousands of dollars, except per Unit amounts) Revenue NOI FFO
Net Income (Loss)
Attributable to Unitholders
Net Income (Loss) Attributable to Unitholders per Unit
Basic Diluted(1)
June 30, 2020 $63,202 $41,255 $19,324 $19,629 $0.35 $0.34 March 31, 2020 62,297 17,290 18,107 96,442 1.72 1.61 December 31, 2019 61,243 38,998 17,127 34,576 0.64 0.54 September 30, 2019 61,135 38,038 16,148 (1,950) (0.05) (0.03) June 30, 2019 60,960 38,989 15,697 40,719 0.80 0.77 March 31, 2019 62,258 16,837 15,246 3,470 0.07 0.07 December 31, 2018 62,129 38,077 15,215 54,380 1.07 0.94 September 30, 2018 61,172 38,183 15,510 21,550 0.41 0.41
(1) Includes the dilutive impact of the convertible debentures.
SUMMARY OF QUARTERLY RESULTSA significant portion of the REIT’s real estate properties are located in the United States. As a result, the REIT is exposed to foreign currency exchange rate fluctuations with respect to its quarterly results derived from its properties located in the U.S. Quarterly results fluctuate due to acquisitions and dispositions, the impact of foreign exchange rate fluctuations and mortgage refinancing. In addition, net income (loss) includes a number of non-cash components, such as, fair value gain (loss) on Class B LP Units, fair value gain (loss) on real estate properties, an IFRIC 21 adjustment to realty taxes, equity income (loss) from investment and deferred taxes. During the fourth quarter of 2019, the REIT acquired a 50% interest in a property comprising 690 suites accounted for as an equity investment. The operating results are recognized within equity income (loss) from investments. During the second quarter of 2019, the REIT disposed a property comprising 48 suites and acquired partial interests in three properties controlled by the REIT.
During the first quarter of 2019, the REIT disposed for four properties comprising 795 suites. Revenue and Net Operating IncomeThe regional distribution of the REIT’s suites serves to add stability to the REIT’s cash flows because it reduces the REIT’s vulnerability to economic fluctuations affecting any particular region. However, tenant retention and leasing vacant suites are critical to maintaining occupancy levels. In Canada, certain provinces and territories have enacted residential tenancy legislation that, among other things, imposes rent control guidelines that limit the REIT’s ability to raise rental rates at its properties. For the calendar year 2020, the Ontario guideline increase amount was established at 2.2% (1.8% for 2019 and 1.8% for 2018). In addition, overbuilding in the multi-suite residential sector, particularly in the United States, may increase the supply of multi-suite residential properties, further increasing the level of competition in certain markets. Such competition may reduce occupancy rates and rental revenues of the REIT and, consequently, revenue and operating results. The REIT has seen steady revenue growth during the last eight quarters resulting from an increase in Same Property revenue. The decline in revenue from the quarter ended June 30, 2019 is a result of the impact of the disposal of five properties during the first half of 2019, which was partially offset by an increase in Same Property revenue.
MORGUARD NORTH AMERICAN RESIDENTIAL REAL ESTATE INVESTMENT TRUSTMANAGEMENT'S DISCUSSION AND ANALYSIS | JUNE 30, 2020
MORGUARD.COM 40
As at June 30, 2020, Same Property occupancy in Canada was 97.5%, reflecting stable demand predominantly in Ontario. Approximately 79% of the suites in Canada are located in the GTA. The GTA is Canada’s most significant economic cluster and contains the largest concentration of people. As at June 30, 2020, Same Property occupancy in the U.S. was stable at 94.3% as the REIT’s overall U.S. occupancy reached near optimum levels throughout 2019. During 2020, the onset of COVID-19 and stay at home orders disrupted normal traffic patterns throughout the U.S. portfolio. Similar to revenue, NOI has profiled steady growth over the last eight quarters resulting from an increase in revenue and the REIT’s ability to control expenses as a percentage of revenue. The impact of foreign exchange rates and of acquisitions and dispositions also factor into the variance from quarter to quarter. Furthermore, the first quarter results (three months ended March 31) are impacted by IFRIC 21, whereby the REIT records the entire annual realty tax expense for its U.S. properties on January 1, except for U.S. properties acquired during the year in which the realty taxes are not recorded in the year of acquisition. As a result, the second, third and fourth quarters typically have no realty tax expense which results in higher NOI and NOI margins. Net Income Attributable to UnitholdersTaking into account the above factors for revenue and NOI variations, the change in net income is predominantly due to a change in non-cash components described below:
• The REIT valued the Class B LP Units based on the closing price of the TSX-listed Units. During the six months ended June 30, 2020, the volatility of the stock market from the impact of the global health crisis resulted in a significant decline in the REIT’s Unit price and a fair value gain on the Class B LP Units. Prior and subsequent to the quarter ended March 31, 2020, there has generally been an upward trend in the trading price of the REIT’s Units resulting in a fair value loss on Class B LP Units;
• The REIT has recorded a fair value gain on real estate properties for the six months ended June 30, 2020 and for the years ended December 31, 2019 and 2018, due to an increase in stabilized NOI;
• The REIT has recorded deferred tax expense coinciding with the fair value gains of the REIT’s U.S. real estate properties.
MORGUARD NORTH AMERICAN RESIDENTIAL REAL ESTATE INVESTMENT TRUSTMANAGEMENT'S DISCUSSION AND ANALYSIS | JUNE 30, 2020
MORGUARD.COM 41
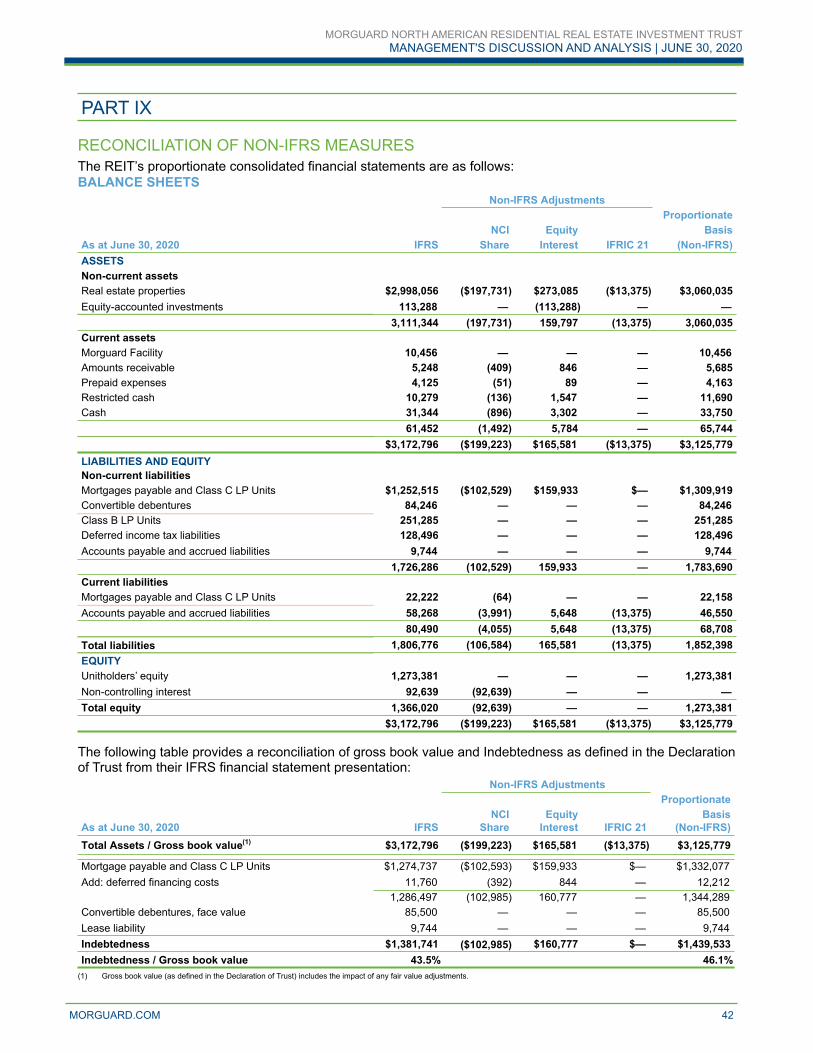
PART IX
RECONCILIATION OF NON-IFRS MEASURESThe REIT’s proportionate consolidated financial statements are as follows:BALANCE SHEETS
Non-IFRS AdjustmentsProportionate
NCI Equity BasisAs at June 30, 2020 IFRS Share Interest IFRIC 21 (Non-IFRS)ASSETSNon-current assetsReal estate properties $2,998,056 ($197,731) $273,085 ($13,375) $3,060,035Equity-accounted investments 113,288 — (113,288) — —
3,111,344 (197,731) 159,797 (13,375) 3,060,035Current assetsMorguard Facility 10,456 — — — 10,456 Amounts receivable 5,248 (409) 846 — 5,685Prepaid expenses 4,125 (51) 89 — 4,163Restricted cash 10,279 (136) 1,547 — 11,690Cash 31,344 (896) 3,302 — 33,750
61,452 (1,492) 5,784 — 65,744$3,172,796 ($199,223) $165,581 ($13,375) $3,125,779
LIABILITIES AND EQUITYNon-current liabilitiesMortgages payable and Class C LP Units $1,252,515 ($102,529) $159,933 $— $1,309,919Convertible debentures 84,246 — — — 84,246 Class B LP Units 251,285 — — — 251,285Deferred income tax liabilities 128,496 — — — 128,496Accounts payable and accrued liabilities 9,744 — — — 9,744
1,726,286 (102,529) 159,933 — 1,783,690Current liabilitiesMortgages payable and Class C LP Units 22,222 (64) — — 22,158Accounts payable and accrued liabilities 58,268 (3,991) 5,648 (13,375) 46,550
80,490 (4,055) 5,648 (13,375) 68,708Total liabilities 1,806,776 (106,584) 165,581 (13,375) 1,852,398EQUITYUnitholders’ equity 1,273,381 — — — 1,273,381Non-controlling interest 92,639 (92,639) — — — Total equity 1,366,020 (92,639) — — 1,273,381
$3,172,796 ($199,223) $165,581 ($13,375) $3,125,779
The following table provides a reconciliation of gross book value and Indebtedness as defined in the Declaration of Trust from their IFRS financial statement presentation:
Non-IFRS AdjustmentsProportionate
NCI Equity BasisAs at June 30, 2020 IFRS Share Interest IFRIC 21 (Non-IFRS)Total Assets / Gross book value(1) $3,172,796 ($199,223) $165,581 ($13,375) $3,125,779
Mortgage payable and Class C LP Units $1,274,737 ($102,593) $159,933 $— $1,332,077 Add: deferred financing costs 11,760 (392) 844 — 12,212
1,286,497 (102,985) 160,777 — 1,344,289 Convertible debentures, face value 85,500 — — — 85,500 Lease liability 9,744 — — — 9,744 Indebtedness $1,381,741 ($102,985) $160,777 $— $1,439,533Indebtedness / Gross book value 43.5% 46.1%
(1) Gross book value (as defined in the Declaration of Trust) includes the impact of any fair value adjustments.
MORGUARD NORTH AMERICAN RESIDENTIAL REAL ESTATE INVESTMENT TRUSTMANAGEMENT'S DISCUSSION AND ANALYSIS | JUNE 30, 2020
MORGUARD.COM 42

STATEMENTS OF INCOME
2020 2019Non-IFRS Adjustments Non-IFRS Adjustments
For the three months Proportionate Proportionate ended June 30 NCI Equity Basis NCI Equity Basis(In thousands of dollars) IFRS Share Interest IFRIC 21 (Non-IFRS) IFRS Share Interest IFRIC 21 (Non-IFRS)Revenue from propertiesSame Property $62,933 ($3,607) $1,849 $— $61,175 $60,638 ($3,688) $1,704 $— $58,654 Acquisitions / Dispositions 269 — 3,391 — 3,660 322 (263) — — 59 Total revenue from properties 63,202 (3,607) 5,240 — 64,835 60,960 (3,951) 1,704 — 58,713 Property operating expensesSame Property
Operating costs 15,189 (904) 484 — 14,769 15,408 (902) 550 — 15,056 Realty taxes 2,453 124 — 5,364 7,941 2,365 33 — 5,229 7,627 Utilities 4,209 (138) 99 — 4,170 4,078 (117) 117 — 4,078
Same Property 21,851 (918) 583 5,364 26,880 21,851 (986) 667 5,229 26,761 Acquisitions / Dispositions 96 — 894 604 1,594 120 (101) — 4 23 Total property operating expenses 21,947 (918) 1,477 5,968 28,474 21,971 (1,087) 667 5,233 26,784 NOISame Property 41,082 (2,689) 1,266 (5,364) 34,295 38,787 (2,702) 1,037 (5,229) 31,893 Acquisitions / Dispositions 173 — 2,497 (604) 2,066 202 (162) — (4) 36 Total NOI(1) 41,255 (2,689) 3,763 (5,968) 36,361 38,989 (2,864) 1,037 (5,233) 31,929Other expenses (income)
Interest expense 16,902 (960) 1,408 — 17,350 15,967 (983) 440 — 15,424 Trust expenses 4,163 (78) 177 — 4,262 3,734 (78) 55 — 3,711 Equity income from investments (2,459) — 2,459 — — (1,575) — 1,575 — — Foreign exchange loss (gain) 830 — — — 830 363 — — — 363 Other income (937) — — — (937) (137) — — — (137)
Income before fair value changes and income taxes 22,756 (1,651) (281) (5,968) 14,856 20,637 (1,803) (1,033) (5,233) 12,568Fair value gain on real estate properties, net 22,630 2,016 281 5,968 30,895 30,752 610 1,033 5,233 37,628 Fair value gain (loss) on Class B LP Units (20,668) — — — (20,668) (1,205) — — — (1,205) Income before income taxes 24,718 365 — — 25,083 50,184 (1,193) — — 48,991Provision for income taxes
Current 34 — — — 34 33 — — — 33 Deferred 5,420 — — — 5,420 8,239 — — — 8,239
5,454 — — — 5,454 8,272 — — — 8,272 Net income for the period $19,264 $365 $— $— $19,629 $41,912 ($1,193) $— $— $40,719
(1) NOI included the following:IFRIC 21 ($5,719) $639 ($888) $5,968 $— ($5,563) $604 ($274) $5,233 $—
.The following table provides a reconciliation of interest and indebtedness coverage ratios from their IFRS financial statement presentation:
2020 2019Non-IFRS Adjustments Non-IFRS Adjustments
For the three months Proportionate Proportionate ended June 30 NCI Equity Basis NCI Equity Basis(In thousands of dollars) IFRS Share Interest IFRIC 21 (Non-IFRS) IFRS Share Interest IFRIC 21 (Non-IFRS)NOI $41,255 ($2,689) $3,763 ($5,968) $36,361 $38,989 ($2,864) $1,037 ($5,233) $31,929 IFRIC 21 adjustment (5,719) 639 (888) 5,968 — (5,563) 604 (274) 5,233 — Trust expenses (4,163) 78 (177) — (4,262) (3,734) 78 (55) — (3,711) Other income 937 — — — 937 137 — — — 137
$32,310 ($1,972) $2,698 $— $33,036 $29,829 ($2,182) $708 $— $28,355
Interest expense $16,902 ($960) $1,408 $— $17,350 $15,967 ($983) $440 $— $15,424 Loss on extinguishment of mortgages — — — — — (70) — — — (70) Fair value (loss) gain on conversion option on the convertible debentures (659) — — — (659) 126 — — — 126 Distributions on Class B LP Units (3,013) — — — (3,013) (2,925) — — — (2,925)
$13,230 ($960) $1,408 $— $13,678 $13,098 ($983) $440 $— $12,555
Interest coverage ratio 2.44 2.42 2.28 2.26
Indebtedness coverage ratio 1.67 1.68 1.60 1.58
MORGUARD NORTH AMERICAN RESIDENTIAL REAL ESTATE INVESTMENT TRUSTMANAGEMENT'S DISCUSSION AND ANALYSIS | JUNE 30, 2020
MORGUARD.COM 43

STATEMENTS OF INCOME (CONTINUED)2020 2019
Non-IFRS Adjustments Non-IFRS AdjustmentsFor the six months Proportionate Proportionate ended June 30 NCI Equity Basis NCI Equity Basis
(In thousands of dollars) IFRS Share Interest IFRIC 21 (Non-IFRS) IFRS Share Interest IFRIC 21 (Non-IFRS)Revenue from propertiesSame Property $124,824 ($7,219) $3,635 $— $121,240 $120,451 ($7,242) $3,411 $— $116,620 Acquisitions / Dispositions 675 — 6,902 — 7,577 2,767 (651) — — 2,116 Total revenue from properties 125,499 (7,219) 10,537 — 128,817 123,218 (7,893) 3,411 — 118,736 Property operating expensesSame Property
Operating costs 30,893 (1,716) 952 — 30,129 29,845 (1,739) 1,127 — 29,233 Realty taxes 27,169 (2,350) 1,105 (10,645) 15,279 26,639 (2,262) 1,092 (10,105) 15,364 Utilities 8,642 (294) 216 — 8,564 8,925 (300) 338 — 8,963
Same Property 66,704 (4,360) 2,273 (10,645) 53,972 65,409 (4,301) 2,557 (10,105) 53,560 Acquisitions / Dispositions 250 — 4,030 (1,158) 3,122 1,983 (248) — (408) 1,327 Total property operating expenses 66,954 (4,360) 6,303 (11,803) 57,094 67,392 (4,549) 2,557 (10,513) 54,887 NOISame Property 58,120 (2,859) 1,362 10,645 67,268 55,042 (2,941) 854 10,105 63,060 Acquisitions / Dispositions 425 — 2,872 1,158 4,455 784 (403) — 408 789
Total NOI(1) 58,545 (2,859) 4,234 11,803 71,723 55,826 (3,344) 854 10,513 63,849Other expenses (income)
Interest expense 29,768 (1,898) 2,772 — 30,642 34,010 (1,978) 871 — 32,903 Trust expenses 8,031 (148) 348 — 8,231 7,200 (147) 110 — 7,163 Equity income from investments (1,563) — 1,563 — — (2,128) — 2,128 — — Foreign exchange loss (gain) (963) — — — (963) 693 — — — 693 Other income (1,092) — — — (1,092) (151) — — — (151)
Income before fair value changes and income taxes 24,364 (813) (449) 11,803 34,905 16,202 (1,219) (2,255) 10,513 23,241Fair value gain on real estate properties, net 33,087 460 449 (11,803) 22,193 58,585 (230) 2,255 (10,513) 50,097 Fair value gain (loss) on Class B LP Units 67,170 — — — 67,170 (21,873) — — — (21,873) Income before income taxes 124,621 (353) — — 124,268 52,914 (1,449) — — 51,465Provision for income taxes
Current 68 — — — 68 66 — — — 66 Deferred 8,129 — — — 8,129 7,210 — — — 7,210
8,197 — — — 8,197 7,276 — — — 7,276 Net income for the period $116,424 ($353) $— $— $116,071 $45,638 ($1,449) $— $— $44,189
(1) NOI included the following:IFRIC 21 $11,305 ($1,205) $1,703 ($11,803) $— $11,081 ($1,113) $545 ($10,513) $—
The following table provides a reconciliation of interest and indebtedness coverage ratios from their IFRS financial statement presentation:
2020 2019Non-IFRS Adjustments Non-IFRS Adjustments
For the six months Proportionate Proportionate ended June 30 NCI Equity Basis NCI Equity Basis(In thousands of dollars) IFRS Share Interest IFRIC 21 (Non-IFRS) IFRS Share Interest IFRIC 21 (Non-IFRS)NOI $58,545 ($2,859) $4,234 $11,803 $71,723 $55,826 ($3,344) $854 $10,513 $63,849 IFRIC 21 adjustment 11,305 (1,205) 1,703 (11,803) — 11,081 (1,113) 545 (10,513) — Trust expenses (8,031) 148 (348) — (8,231) (7,200) 147 (110) — (7,163) Other income 1,092 — — — 1,092 151 — — — 151
$62,911 ($3,916) $5,589 $— $64,584 $59,858 ($4,310) $1,289 $— $56,837
Interest expense $29,768 ($1,898) $2,772 $— $30,642 $34,010 ($1,978) $871 $— $32,903 Loss on extinguishment of mortgages — — — — — (561) — — — (561) Fair value gain (loss) on conversion option on the convertible debentures 2,468 — — — 2,468 (1,226) — — — (1,226) Distributions on Class B LP Units (6,025) — — — (6,025) (5,849) — — — (5,849)
$26,211 ($1,898) $2,772 $— $27,085 $26,374 ($1,978) $871 $— $25,267
Interest coverage ratio 2.40 2.38 2.27 2.25
Indebtedness coverage ratio 1.64 1.65 1.59 1.57
MORGUARD NORTH AMERICAN RESIDENTIAL REAL ESTATE INVESTMENT TRUSTMANAGEMENT'S DISCUSSION AND ANALYSIS | JUNE 30, 2020
MORGUARD.COM 44

CONDENSED CONSOLIDATED FINANCIAL STATEMENTS
TABLE OF CONTENTSConsolidated Balance Sheets 46
Consolidated Statements of Income 47
Consolidated Statements of Comprehensive Income (Loss) 48
Consolidated Statements of Changes in Unitholders’ Equity 49
Consolidated Statements of Cash Flows 50
Notes to the Consolidated Financial Statements 51
MORGUARD NORTH AMERICAN RESIDENTIAL REAL ESTATE INVESTMENT TRUSTMANAGEMENT'S DISCUSSION AND ANALYSIS | JUNE 30, 2020
MORGUARD.COM 45

BALANCE SHEETSIn thousands of Canadian dollars
As at Note June 30, 2020 December 31, 2019
ASSETSNon-current assetsReal estate properties 3 $2,998,056 $2,872,658Equity-accounted investments 4 113,288 106,521
3,111,344 2,979,179Current assetsMorguard Facility 8 10,456 19,972Amounts receivable 5,248 3,332Prepaid expenses 4,125 4,106Restricted cash 10,279 9,090Cash 31,344 17,748
61,452 54,248$3,172,796 $3,033,427
LIABILITIES AND EQUITYNon-current liabilitiesMortgages payable and Class C LP Units 5 $1,252,515 $1,200,587Convertible debentures 6 84,246 86,398Class B LP Units 7 251,285 318,455Deferred income tax liabilities 15 128,496 114,763Accounts payable and accrued liabilities 9 9,744 9,286
1,726,286 1,729,489Current liabilitiesMortgages payable and Class C LP Units 5 22,222 29,718Accounts payable and accrued liabilities 9 58,268 48,427
80,490 78,145Total liabilities 1,806,776 1,807,634
EQUITYUnitholders’ equity 1,273,381 1,136,363Non-controlling interest 92,639 89,430Total equity 1,366,020 1,225,793
$0 $3,172,796 $3,033,427
See accompanying notes to the condensed consolidated financial statements.Commitments and contingencies 21
On behalf of the Trustees:
(Signed) “K. Rai Sahi” (Signed) “Mel Leiderman”
K. Rai Sahi, Mel Leiderman,Trustee Trustee
MORGUARD NORTH AMERICAN RESIDENTIAL REAL ESTATE INVESTMENT TRUSTCONDENSED CONSOLIDATED FINANCIAL STATEMENTS (UNAUDITED) | JUNE 30, 2020
MORGUARD.COM 46

STATEMENTS OF INCOMEIn thousands of Canadian dollars
Note Three months ended Six months endedFor the three months ended June 30, June 30 June 30N/A Note 2020 2019 2020 2019
Revenue from real estate properties 11 $63,202 $60,960 $125,499 $123,218 Property operating expenses
Property operating costs (15,234) (15,471) (31,011) (31,002) Realty taxes (2,483) (2,394) (27,247) (27,225) Utilities (4,230) (4,106) (8,696) (9,165)
Net operating income 41,255 38,989 58,545 55,826 Other expenses (income)
Interest expense 12 16,902 15,967 29,768 34,010 Trust expenses 13 4,163 3,734 8,031 7,200 Equity income from investments 4 (2,459) (1,575) (1,563) (2,128) Foreign exchange loss (gain) 830 363 (963) 693 Other income 14 (937) (137) (1,092) (151)
Income before fair value changes and income taxes 22,756 20,637 24,364 16,202 Fair value gain on real estate properties, net 3 22,630 30,752 33,087 58,585 Fair value gain (loss) on Class B LP Units 7 (20,668) (1,205) 67,170 (21,873)
Income before income taxes 24,718 50,184 124,621 52,914
Provision for income taxes 15Current 34 33 68 66 Deferred 5,420 8,239 8,129 7,210
5,454 8,272 8,197 7,276 Net income for the period $19,264 $41,912 $116,424 $45,638
Net income (loss) attributable to:Unitholders $19,629 $40,719 $116,071 $44,189 Non-controlling interest (365) 1,193 353 1,449
$19,264 $41,912 $116,424 $45,638
See accompanying notes to the condensed consolidated financial statements.
MORGUARD NORTH AMERICAN RESIDENTIAL REAL ESTATE INVESTMENT TRUSTCONDENSED CONSOLIDATED FINANCIAL STATEMENTS (UNAUDITED) | JUNE 30, 2020
MORGUARD.COM 47
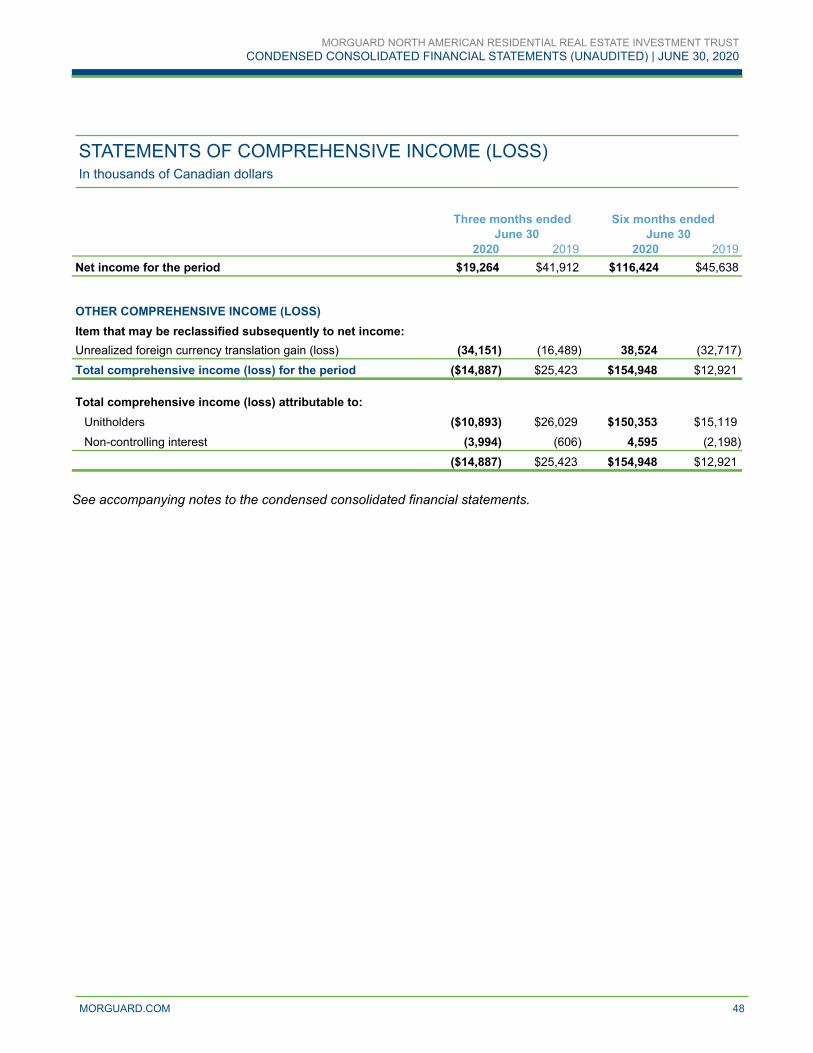
STATEMENTS OF COMPREHENSIVE INCOME (LOSS)In thousands of Canadian dollars
Three months ended Six months endedFor the three months ended June 30, June 30 June 30N/A 2020 2019 2020 2019Net income for the period $19,264 $41,912 $116,424 $45,638
OTHER COMPREHENSIVE INCOME (LOSS)Item that may be reclassified subsequently to net income:Unrealized foreign currency translation gain (loss) (34,151) (16,489) 38,524 (32,717)
Total comprehensive income (loss) for the period ($14,887) $25,423 $154,948 $12,921
Total comprehensive income (loss) attributable to:Unitholders ($10,893) $26,029 $150,353 $15,119
Non-controlling interest (3,994) (606) 4,595 (2,198)
($14,887) $25,423 $154,948 $12,921
See accompanying notes to the condensed consolidated financial statements.
MORGUARD NORTH AMERICAN RESIDENTIAL REAL ESTATE INVESTMENT TRUSTCONDENSED CONSOLIDATED FINANCIAL STATEMENTS (UNAUDITED) | JUNE 30, 2020
MORGUARD.COM 48
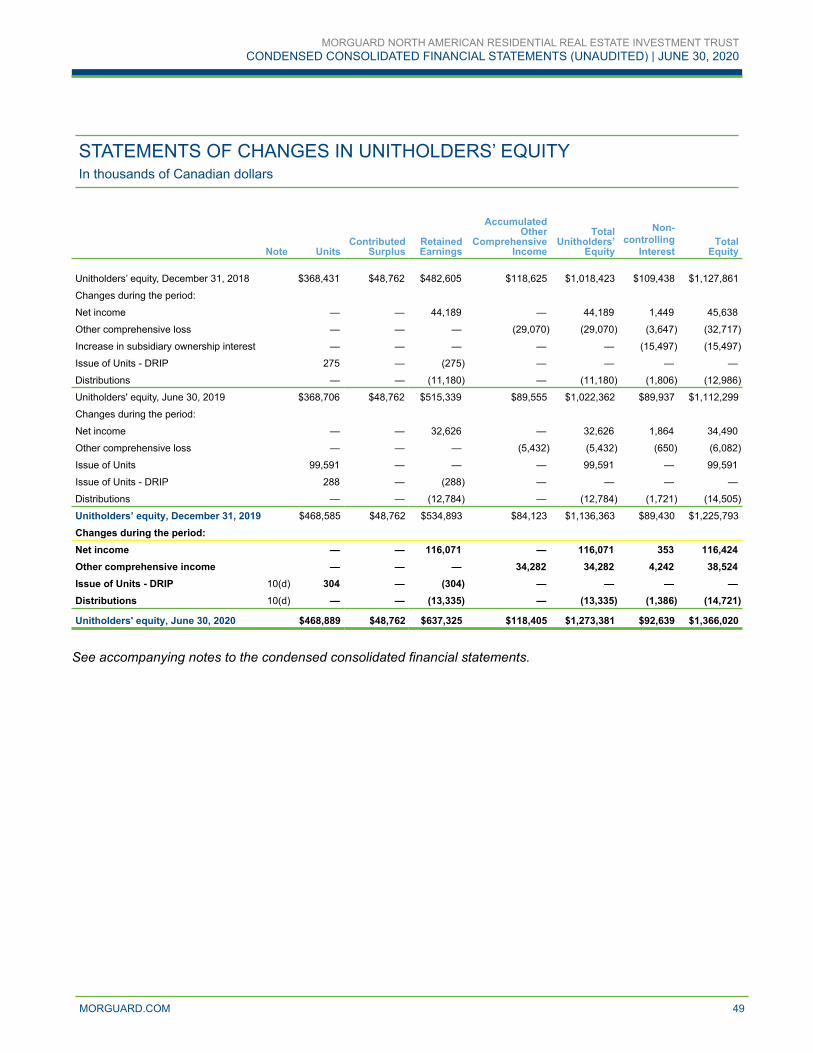
STATEMENTS OF CHANGES IN UNITHOLDERS’ EQUITYIn thousands of Canadian dollars
Note UnitsContributed
SurplusRetainedEarnings
AccumulatedOther
ComprehensiveIncome
TotalUnitholders’
Equity
Non-controlling
InterestTotal
Equity
Unitholders’ equity, December 31, 2018 $368,431 $48,762 $482,605 $118,625 $1,018,423 $109,438 $1,127,861
Changes during the period:
Net income — — 44,189 — 44,189 1,449 45,638
Other comprehensive loss — — — (29,070) (29,070) (3,647) (32,717)
Increase in subsidiary ownership interest — — — — — (15,497) (15,497)
Issue of Units - DRIP 275 — (275) — — — —
Distributions — — (11,180) — (11,180) (1,806) (12,986)
Unitholders' equity, June 30, 2019 $368,706 $48,762 $515,339 $89,555 $1,022,362 $89,937 $1,112,299
Changes during the period:
Net income — — 32,626 — 32,626 1,864 34,490
Other comprehensive loss — — — (5,432) (5,432) (650) (6,082)
Issue of Units 99,591 — — — 99,591 — 99,591
Issue of Units - DRIP 288 — (288) — — — —
Distributions — — (12,784) — (12,784) (1,721) (14,505)
Unitholders’ equity, December 31, 2019 $468,585 $48,762 $534,893 $84,123 $1,136,363 $89,430 $1,225,793
Changes during the period:Net income — — 116,071 — 116,071 353 116,424 Other comprehensive income — — — 34,282 34,282 4,242 38,524 Issue of Units - DRIP 10(d) 304 — (304) — — — — Distributions 10(d) — — (13,335) — (13,335) (1,386) (14,721)
Unitholders' equity, June 30, 2020 $468,889 $48,762 $637,325 $118,405 $1,273,381 $92,639 $1,366,020
See accompanying notes to the condensed consolidated financial statements.
MORGUARD NORTH AMERICAN RESIDENTIAL REAL ESTATE INVESTMENT TRUSTCONDENSED CONSOLIDATED FINANCIAL STATEMENTS (UNAUDITED) | JUNE 30, 2020
MORGUARD.COM 49

STATEMENTS OF CASH FLOWSIn thousands of Canadian dollars
For the three months ended June 30,
Note
Three months ended Six months endedJune 30 June 30
N/A 2020 2019 2020 2019 OPERATING ACTIVITIESNet income $19,264 $41,912 $116,424 $45,638 Add (deduct) items not affecting cash 16(a) (2,792) (27,274) (82,354) (16,225) Additions to tenant incentives (79) (123) (259) (256) Net change in non-cash operating assets and liabilities 16(b) 7,876 3,325 (4,540) (2,913) Cash provided by operating activities 24,269 17,840 29,271 26,244
INVESTING ACTIVITIESAdditions to income producing properties 3 (4,411) (5,643) (10,543) (10,493) Additions to property under development 3 (1,648) (2,201) (3,308) (2,637) Proceeds from sale of income producing properties, net 3 — 1,576 — 38,626 Cash provided by (used in) investing activities (6,059) (6,268) (13,851) 25,496
FINANCING ACTIVITIESProceeds from new mortgages 5 25,151 — 25,151 — Financing cost on new mortgages (605) — (605) — Repayment of mortgages and Class C LP Units
Repayment on maturity 5 (8,757) — (8,757) — Repayment due to mortgage extinguishment — — — (11,331) Principal instalment repayments (6,081) (5,529) (12,163) (11,225)
Increase in subsidiary ownership interest — (8,014) — (8,014) Proceeds from Morguard Facility 2,500 13,700 22,200 29,700 Repayment of Morguard Facility (12,000) (2,605) (12,000) (30,291) Distributions to Unitholders (6,678) (5,581) (13,335) (11,180) Distributions to non-controlling interest (580) (914) (1,386) (1,806) Decrease (increase) in restricted cash (514) (775) (748) 68 Cash used in financing activities (7,564) (9,718) (1,643) (44,079)
Net increase in cash during the period 10,646 1,854 13,777 7,661 Net effect of foreign currency translation on cash balance (55) (87) (181) 12 Cash, beginning of period 20,753 22,692 17,748 16,786 Cash, end of period $31,344 $24,459 $31,344 $24,459$31,344
—
See accompanying notes to the condensed consolidated financial statements.
MORGUARD NORTH AMERICAN RESIDENTIAL REAL ESTATE INVESTMENT TRUSTCONDENSED CONSOLIDATED FINANCIAL STATEMENTS (UNAUDITED) | JUNE 30, 2020
MORGUARD.COM 50
NOTES For the three and six months ended June 30, 2020 and 2019In thousands of Canadian dollars, except Unit and per Unit amounts and where otherwise noted
NOTE 1NATURE AND FORMATION OF TRUSTMorguard North American Residential Real Estate Investment Trust (the “REIT”) is an unincorporated open-ended real estate investment trust established pursuant to a Declaration of Trust dated March 1, 2012, and as amended and restated on April 18, 2012 (the “Declaration of Trust”), under and governed by the laws of the Province of Ontario. The trust units of the REIT (“Units”) trade on the Toronto Stock Exchange (“TSX”) under the symbol “MRG.UN.” The REIT invests in multi-suite residential rental properties in Canada and the United States. The REIT’s head office is located at 55 City Centre Drive, Suite 1000, Mississauga, Ontario, L5B 1M3.
The REIT holds its investments in its real estate properties through its ownership in Morguard NAR Canada Limited Partnership (the “Partnership”). As at June 30, 2020, Morguard Corporation (“Morguard”), the parent company of the REIT, holds an indirect 44.8% interest through its ownership of 7,944,166 Units and 17,223,090 Class B LP Units.
NOTE 2STATEMENT OF COMPLIANCE AND SIGNIFICANT ACCOUNTING POLICIESThese condensed consolidated financial statements have been prepared in accordance with International Financial Reporting Standards (“IFRS”) IAS 34, Interim Financial Reporting, as issued by the International Accounting Standards Board (“IASB”) and thus do not contain all the disclosures applicable to the annual audited consolidated financial statements.
The condensed consolidated financial statements were approved and authorized for issue by the Board of Trustees on July 28, 2020.
These condensed consolidated financial statements use the same accounting policies and methods of theirapplication as the most recent annual audited consolidated financial statements and should be read in conjunction with the most recent annual audited consolidated financial statements which include the significant accounting policies most affected by estimates and judgments.
At this time, the duration and impact of the outbreak of the novel strain of coronavirus, specifically identified as “COVID-19” is unknown, as is the effectiveness of the government and central bank interventions. Any estimate of the length and severity of these measures are therefore subject to significant uncertainty, and accordingly estimates of the extent to which the COVID-19 pandemic may, directly or indirectly, materially and adversely affect the REIT’s operations, financial results and condition in future periods are also subject to significant uncertainty. Management believes it is currently not possible to estimate the long term impacts the outbreak of COVID-19 will have in determining estimates of fair market value for the REIT’s income producing properties and the valuation of financial instruments.
MORGUARD NORTH AMERICAN RESIDENTIAL REAL ESTATE INVESTMENT TRUSTCONDENSED CONSOLIDATED FINANCIAL STATEMENTS (UNAUDITED) | JUNE 30, 2020
MORGUARD.COM 51
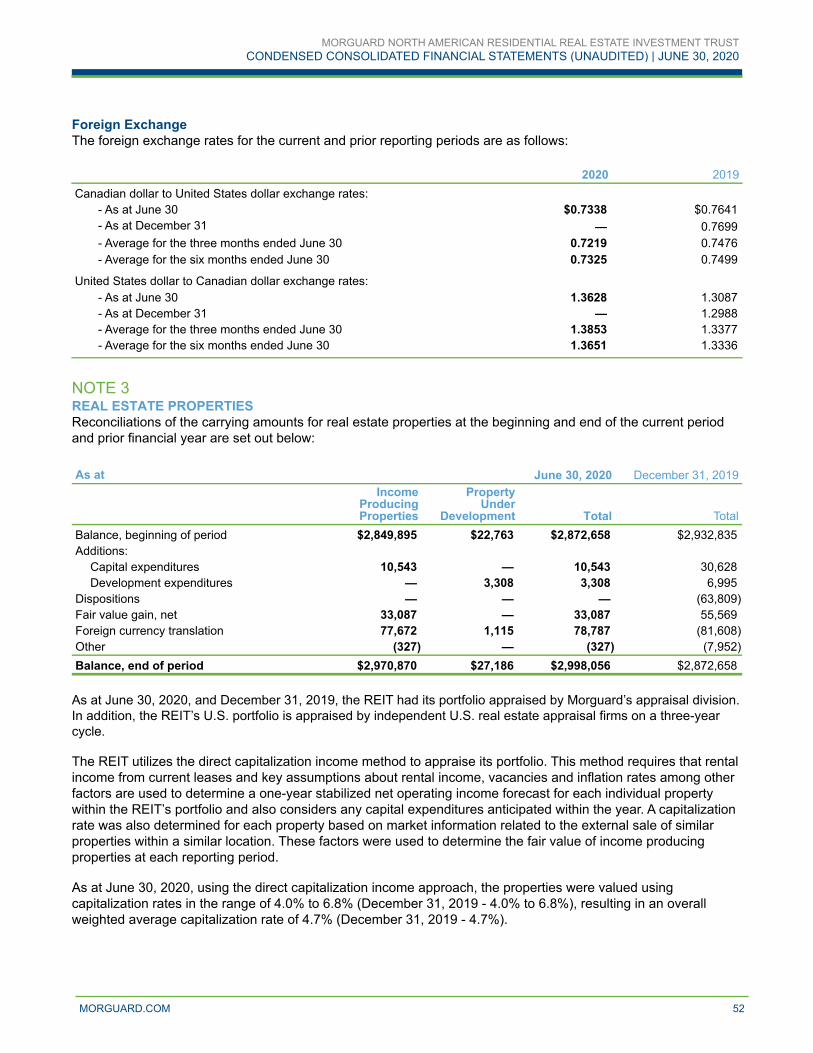
Foreign ExchangeThe foreign exchange rates for the current and prior reporting periods are as follows:
2020 2019Canadian dollar to United States dollar exchange rates:
- As at June 30 $0.7338 $0.7641 - As at December 31 — 0.7699 - Average for the three months ended June 30 0.7219 0.7476 - Average for the six months ended June 30 0.7325 0.7499
United States dollar to Canadian dollar exchange rates: - As at June 30 1.3628 1.3087 - As at December 31 — 1.2988 - Average for the three months ended June 30 1.3853 1.3377 - Average for the six months ended June 30 1.3651 1.3336
NOTE 3REAL ESTATE PROPERTIESReconciliations of the carrying amounts for real estate properties at the beginning and end of the current period and prior financial year are set out below:
As at June 30, 2020 December 31, 2019Income
ProducingProperties
PropertyUnder
Development Total TotalBalance, beginning of period $2,849,895 $22,763 $2,872,658 $2,932,835 Additions:
Capital expenditures 10,543 — 10,543 30,628 Development expenditures — 3,308 3,308 6,995
Dispositions — — — (63,809) Fair value gain, net 33,087 — 33,087 55,569 Foreign currency translation 77,672 1,115 78,787 (81,608) Other (327) — (327) (7,952) Balance, end of period $2,970,870 $27,186 $2,998,056 $2,872,658
As at June 30, 2020, and December 31, 2019, the REIT had its portfolio appraised by Morguard’s appraisal division. In addition, the REIT’s U.S. portfolio is appraised by independent U.S. real estate appraisal firms on a three-year cycle.
The REIT utilizes the direct capitalization income method to appraise its portfolio. This method requires that rental income from current leases and key assumptions about rental income, vacancies and inflation rates among other factors are used to determine a one-year stabilized net operating income forecast for each individual property within the REIT’s portfolio and also considers any capital expenditures anticipated within the year. A capitalization rate was also determined for each property based on market information related to the external sale of similar properties within a similar location. These factors were used to determine the fair value of income producing properties at each reporting period.
As at June 30, 2020, using the direct capitalization income approach, the properties were valued using capitalization rates in the range of 4.0% to 6.8% (December 31, 2019 - 4.0% to 6.8%), resulting in an overall weighted average capitalization rate of 4.7% (December 31, 2019 - 4.7%).
MORGUARD NORTH AMERICAN RESIDENTIAL REAL ESTATE INVESTMENT TRUSTCONDENSED CONSOLIDATED FINANCIAL STATEMENTS (UNAUDITED) | JUNE 30, 2020
MORGUARD.COM 52

The average capitalization rates by location are set out in the following table:
June 30, 2020 December 31, 2019Capitalization Rates Capitalization Rates
Maximum MinimumWeightedAverage Maximum Minimum
WeightedAverage
Canada 5.0 % 4.8 % 4.9 % 5.0 % 4.8 % 4.9 %Alberta 5.0 % 5.0 % 5.0 % 5.0 % 5.0 % 5.0 %Ontario 4.5 % 4.0 % 4.2 % 4.5 % 4.0 % 4.2 %
United StatesColorado 5.3 % 5.3 % 5.3 % 5.3 % 5.3 % 5.3 %Texas 5.3 % 5.0 % 5.0 % 5.3 % 5.0 % 5.0 %Louisiana 6.8 % 5.5 % 6.0 % 6.8 % 5.5 % 6.0 %Illinois 4.5 % 4.5 % 4.5 % 4.5 % 4.5 % 4.5 %Georgia 5.5 % 5.0 % 5.4 % 5.5 % 5.0 % 5.4 %Florida 6.5 % 4.8 % 5.5 % 6.5 % 4.8 % 5.5 %North Carolina 5.3 % 5.0 % 5.1 % 5.3 % 5.0 % 5.1 %Virginia 4.8 % 4.8 % 4.8 % 4.8 % 4.8 % 4.8 %
Fair values are most sensitive to changes in capitalization rates and stabilized net operating income. Generally, an increase in stabilized net operating income will result in an increase in the fair value of the real estate properties, and an increase in capitalization rates will result in a decrease in the fair value of the properties. The capitalization rate magnifies the effect of a change in stabilized net operating income, with a lower capitalization rate resulting in a greater impact on the fair value of the property than a higher capitalization rate. If the weighted average stabilized capitalization rate were to increase or decrease by 25 basis points (assuming no change to stabilized net operating income), the value of the real estate properties as at June 30, 2020 would decrease by $150,100 or increase by $167,247, respectively.
NOTE 4EQUITY-ACCOUNTED INVESTMENTSThe following is the REIT’s equity-accounted investments as at June 30, 2020, and December 31, 2019:
Principal Place Investment REIT’s Ownership Carrying Valueof Business TypeProperty June 30, 2020 December 31, 2019 June 30, 2020 December 31, 2019
The Fenestra Rockville, MD Joint Venture 50% 50% $44,059 $41,147 Marquee at Block 37 Chicago, IL Joint Venture 50% 50 % 69,229 65,374
$113,288 $106,521
The following table presents the change in the balance of the equity-accounted investments:
As at June 30, 2020 December 31, 2019Balance, beginning of period $106,521 $40,859 Additions — 68,834 Share of net income 1,563 97 Foreign exchange gain (loss) 5,204 (3,269) Balance, end of period $113,288 $106,521
On December 9, 2019, the REIT acquired a 50% interest in a property comprising 690 suites located in Chicago, Illinois, (“Marquee at Block 37”) for $68,834 (US$52,009). The REIT has joint control of the investment and accounts for its investment using the equity method. The purchase price of the property (on a 100% basis) was $355,465 (US$268,580), including closing costs and was partially funded by a mortgage in the amount of $218,378 (US$165,000) at an interest rate of 3.27% for a term of 10 years.
MORGUARD NORTH AMERICAN RESIDENTIAL REAL ESTATE INVESTMENT TRUSTCONDENSED CONSOLIDATED FINANCIAL STATEMENTS (UNAUDITED) | JUNE 30, 2020
MORGUARD.COM 53
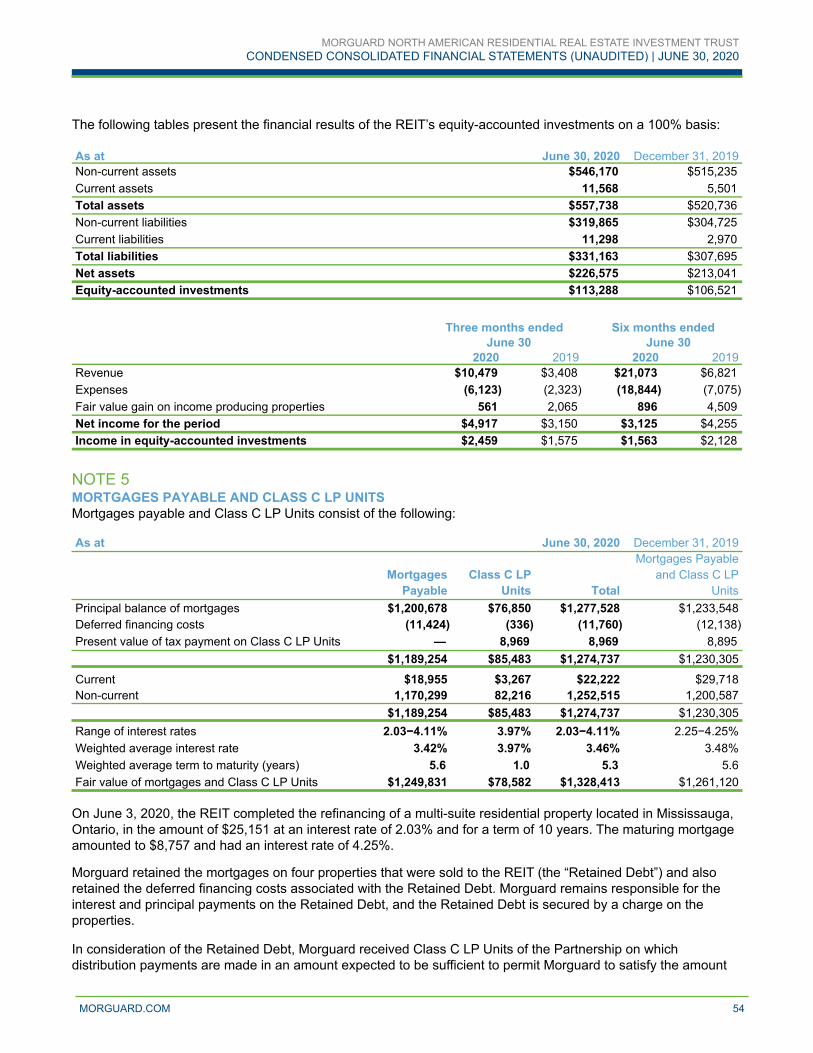
The following tables present the financial results of the REIT’s equity-accounted investments on a 100% basis:
As at June 30, 2020 December 31, 2019Non-current assets $546,170 $515,235 Current assets 11,568 5,501 Total assets $557,738 $520,736 Non-current liabilities $319,865 $304,725 Current liabilities 11,298 2,970 Total liabilities $331,163 $307,695 Net assets $226,575 $213,041 Equity-accounted investments $113,288 $106,521
Three months ended Six months endedJune 30 June 30
N/A 2020 2019 2020 2019Revenue $10,479 $3,408 $21,073 $6,821 Expenses (6,123) (2,323) (18,844) (7,075) Fair value gain on income producing properties 561 2,065 896 4,509 Net income for the period $4,917 $3,150 $3,125 $4,255 Income in equity-accounted investments $2,459 $1,575 $1,563 $2,128
NOTE 5MORTGAGES PAYABLE AND CLASS C LP UNITS Mortgages payable and Class C LP Units consist of the following:
As at June 30, 2020 December 31, 2019Mortgages Payable
Mortgages Class C LP and Class C LPPayable Units Total Units
Principal balance of mortgages $1,200,678 $76,850 $1,277,528 $1,233,548Deferred financing costs (11,424) (336) (11,760) (12,138) Present value of tax payment on Class C LP Units — 8,969 8,969 8,895
$1,189,254 $85,483 $1,274,737 $1,230,305
Current $18,955 $3,267 $22,222 $29,718Non-current 1,170,299 82,216 1,252,515 1,200,587
$1,189,254 $85,483 $1,274,737 $1,230,305Range of interest rates 2.03−4.11% 3.97% 2.03−4.11% 2.25−4.25%Weighted average interest rate 3.42% 3.97% 3.46% 3.48%Weighted average term to maturity (years) 5.6 1.0 5.3 5.6Fair value of mortgages and Class C LP Units $1,249,831 $78,582 $1,328,413 $1,261,120
On June 3, 2020, the REIT completed the refinancing of a multi-suite residential property located in Mississauga, Ontario, in the amount of $25,151 at an interest rate of 2.03% and for a term of 10 years. The maturing mortgage amounted to $8,757 and had an interest rate of 4.25%.
Morguard retained the mortgages on four properties that were sold to the REIT (the “Retained Debt”) and also retained the deferred financing costs associated with the Retained Debt. Morguard remains responsible for the interest and principal payments on the Retained Debt, and the Retained Debt is secured by a charge on the properties.
In consideration of the Retained Debt, Morguard received Class C LP Units of the Partnership on which distribution payments are made in an amount expected to be sufficient to permit Morguard to satisfy the amount
MORGUARD NORTH AMERICAN RESIDENTIAL REAL ESTATE INVESTMENT TRUSTCONDENSED CONSOLIDATED FINANCIAL STATEMENTS (UNAUDITED) | JUNE 30, 2020
MORGUARD.COM 54
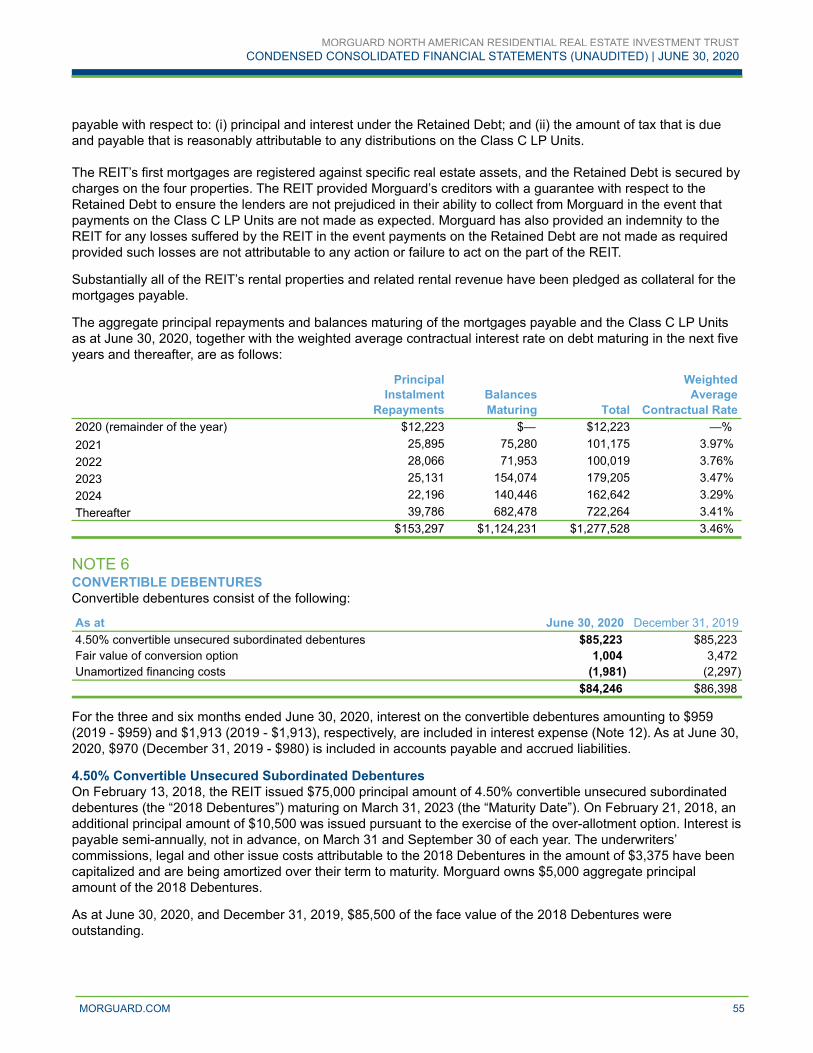
payable with respect to: (i) principal and interest under the Retained Debt; and (ii) the amount of tax that is due and payable that is reasonably attributable to any distributions on the Class C LP Units.
The REIT’s first mortgages are registered against specific real estate assets, and the Retained Debt is secured by charges on the four properties. The REIT provided Morguard’s creditors with a guarantee with respect to the Retained Debt to ensure the lenders are not prejudiced in their ability to collect from Morguard in the event that payments on the Class C LP Units are not made as expected. Morguard has also provided an indemnity to the REIT for any losses suffered by the REIT in the event payments on the Retained Debt are not made as required provided such losses are not attributable to any action or failure to act on the part of the REIT.
Substantially all of the REIT’s rental properties and related rental revenue have been pledged as collateral for the mortgages payable.
The aggregate principal repayments and balances maturing of the mortgages payable and the Class C LP Units as at June 30, 2020, together with the weighted average contractual interest rate on debt maturing in the next five years and thereafter, are as follows:
Principal WeightedInstalment Balances Average
Repayments Maturing Total Contractual Rate2020 (remainder of the year) $12,223 $— $12,223 —% 2021 25,895 75,280 101,175 3.97%2022 28,066 71,953 100,019 3.76%2023 25,131 154,074 179,205 3.47%2024 22,196 140,446 162,642 3.29%Thereafter 39,786 682,478 722,264 3.41%
$153,297 $1,124,231 $1,277,528 3.46%
NOTE 6CONVERTIBLE DEBENTURESConvertible debentures consist of the following:
As at June 30, 2020 December 31, 20194.50% convertible unsecured subordinated debentures $85,223 $85,223 Fair value of conversion option 1,004 3,472 Unamortized financing costs (1,981) (2,297)
$84,246 $86,398
For the three and six months ended June 30, 2020, interest on the convertible debentures amounting to $959 (2019 - $959) and $1,913 (2019 - $1,913), respectively, are included in interest expense (Note 12). As at June 30, 2020, $970 (December 31, 2019 - $980) is included in accounts payable and accrued liabilities.
4.50% Convertible Unsecured Subordinated DebenturesOn February 13, 2018, the REIT issued $75,000 principal amount of 4.50% convertible unsecured subordinated debentures (the “2018 Debentures”) maturing on March 31, 2023 (the “Maturity Date”). On February 21, 2018, an additional principal amount of $10,500 was issued pursuant to the exercise of the over-allotment option. Interest is payable semi-annually, not in advance, on March 31 and September 30 of each year. The underwriters’ commissions, legal and other issue costs attributable to the 2018 Debentures in the amount of $3,375 have been capitalized and are being amortized over their term to maturity. Morguard owns $5,000 aggregate principal amount of the 2018 Debentures.
As at June 30, 2020, and December 31, 2019, $85,500 of the face value of the 2018 Debentures were outstanding.
MORGUARD NORTH AMERICAN RESIDENTIAL REAL ESTATE INVESTMENT TRUSTCONDENSED CONSOLIDATED FINANCIAL STATEMENTS (UNAUDITED) | JUNE 30, 2020
MORGUARD.COM 55
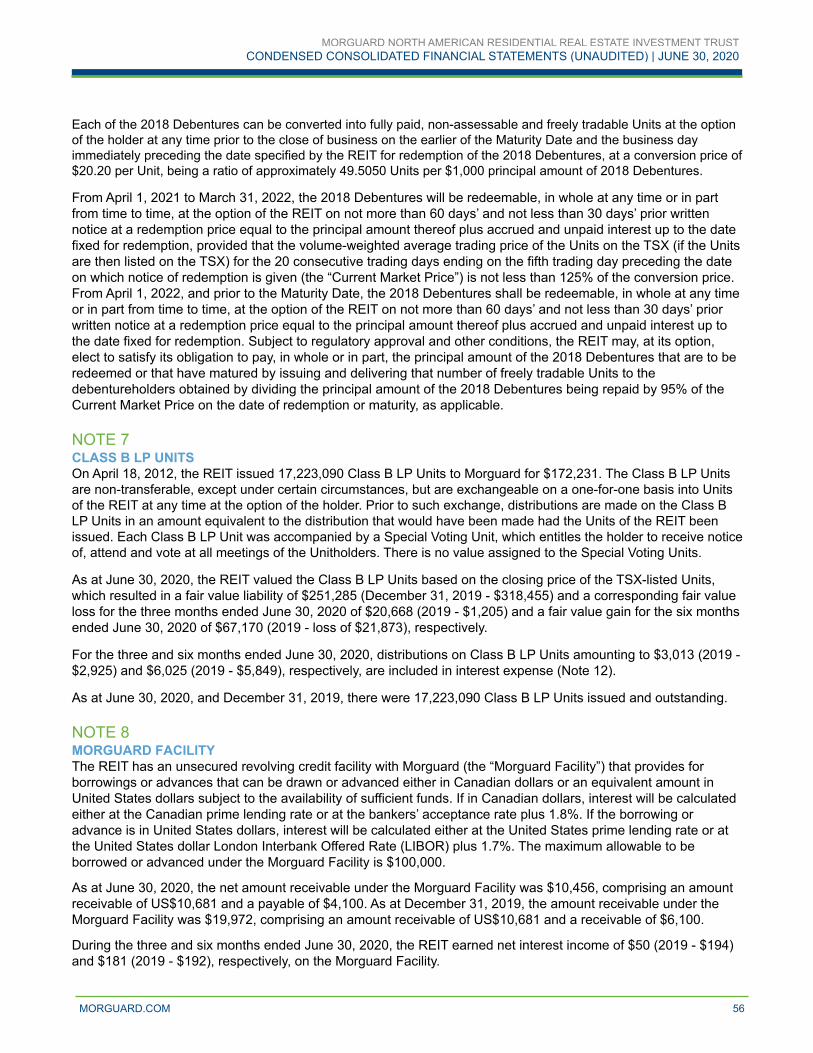
Each of the 2018 Debentures can be converted into fully paid, non-assessable and freely tradable Units at the option of the holder at any time prior to the close of business on the earlier of the Maturity Date and the business day immediately preceding the date specified by the REIT for redemption of the 2018 Debentures, at a conversion price of $20.20 per Unit, being a ratio of approximately 49.5050 Units per $1,000 principal amount of 2018 Debentures.
From April 1, 2021 to March 31, 2022, the 2018 Debentures will be redeemable, in whole at any time or in part from time to time, at the option of the REIT on not more than 60 days’ and not less than 30 days’ prior written notice at a redemption price equal to the principal amount thereof plus accrued and unpaid interest up to the date fixed for redemption, provided that the volume-weighted average trading price of the Units on the TSX (if the Units are then listed on the TSX) for the 20 consecutive trading days ending on the fifth trading day preceding the date on which notice of redemption is given (the “Current Market Price”) is not less than 125% of the conversion price. From April 1, 2022, and prior to the Maturity Date, the 2018 Debentures shall be redeemable, in whole at any time or in part from time to time, at the option of the REIT on not more than 60 days’ and not less than 30 days’ prior written notice at a redemption price equal to the principal amount thereof plus accrued and unpaid interest up to the date fixed for redemption. Subject to regulatory approval and other conditions, the REIT may, at its option, elect to satisfy its obligation to pay, in whole or in part, the principal amount of the 2018 Debentures that are to be redeemed or that have matured by issuing and delivering that number of freely tradable Units to the debentureholders obtained by dividing the principal amount of the 2018 Debentures being repaid by 95% of the Current Market Price on the date of redemption or maturity, as applicable.
NOTE 7CLASS B LP UNITSOn April 18, 2012, the REIT issued 17,223,090 Class B LP Units to Morguard for $172,231. The Class B LP Units are non-transferable, except under certain circumstances, but are exchangeable on a one-for-one basis into Units of the REIT at any time at the option of the holder. Prior to such exchange, distributions are made on the Class B LP Units in an amount equivalent to the distribution that would have been made had the Units of the REIT been issued. Each Class B LP Unit was accompanied by a Special Voting Unit, which entitles the holder to receive notice of, attend and vote at all meetings of the Unitholders. There is no value assigned to the Special Voting Units.
As at June 30, 2020, the REIT valued the Class B LP Units based on the closing price of the TSX-listed Units, which resulted in a fair value liability of $251,285 (December 31, 2019 - $318,455) and a corresponding fair value loss for the three months ended June 30, 2020 of $20,668 (2019 - $1,205) and a fair value gain for the six months ended June 30, 2020 of $67,170 (2019 - loss of $21,873), respectively.
For the three and six months ended June 30, 2020, distributions on Class B LP Units amounting to $3,013 (2019 - $2,925) and $6,025 (2019 - $5,849), respectively, are included in interest expense (Note 12).
As at June 30, 2020, and December 31, 2019, there were 17,223,090 Class B LP Units issued and outstanding.
NOTE 8MORGUARD FACILITYThe REIT has an unsecured revolving credit facility with Morguard (the “Morguard Facility”) that provides for borrowings or advances that can be drawn or advanced either in Canadian dollars or an equivalent amount in United States dollars subject to the availability of sufficient funds. If in Canadian dollars, interest will be calculated either at the Canadian prime lending rate or at the bankers’ acceptance rate plus 1.8%. If the borrowing or advance is in United States dollars, interest will be calculated either at the United States prime lending rate or at the United States dollar London Interbank Offered Rate (LIBOR) plus 1.7%. The maximum allowable to be borrowed or advanced under the Morguard Facility is $100,000.
As at June 30, 2020, the net amount receivable under the Morguard Facility was $10,456, comprising an amount receivable of US$10,681 and a payable of $4,100. As at December 31, 2019, the amount receivable under the Morguard Facility was $19,972, comprising an amount receivable of US$10,681 and a receivable of $6,100.
During the three and six months ended June 30, 2020, the REIT earned net interest income of $50 (2019 - $194) and $181 (2019 - $192), respectively, on the Morguard Facility.
MORGUARD NORTH AMERICAN RESIDENTIAL REAL ESTATE INVESTMENT TRUSTCONDENSED CONSOLIDATED FINANCIAL STATEMENTS (UNAUDITED) | JUNE 30, 2020
MORGUARD.COM 56
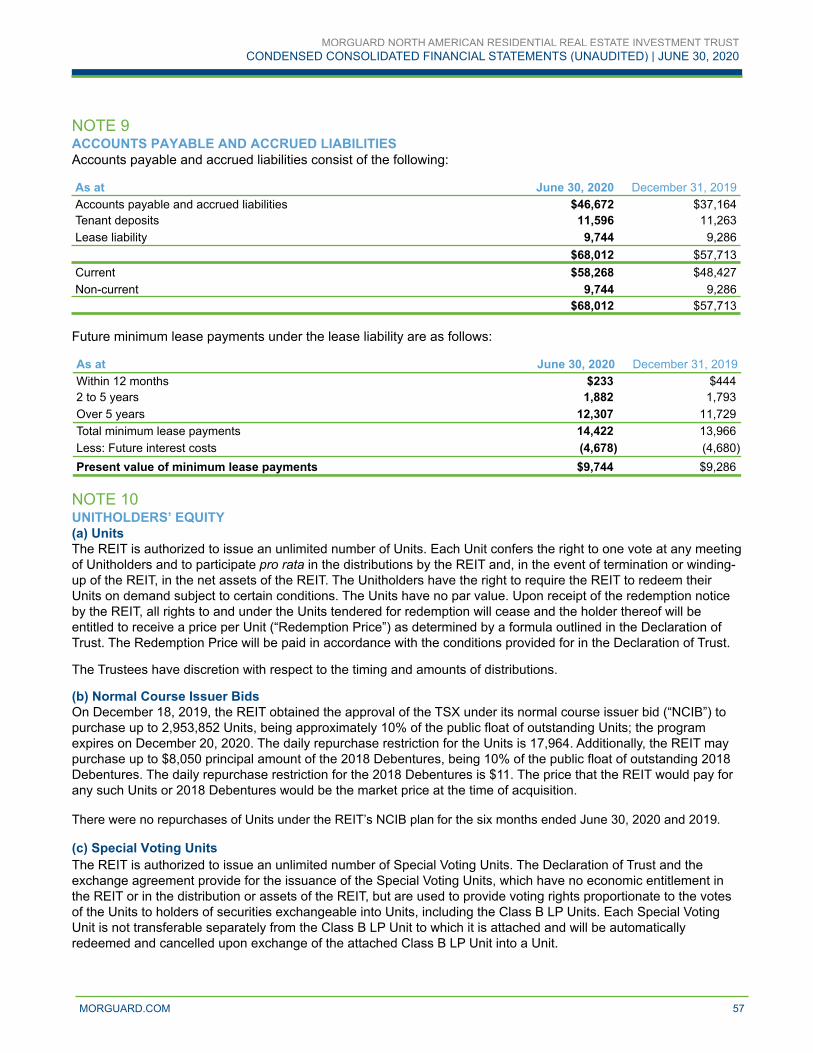
NOTE 9ACCOUNTS PAYABLE AND ACCRUED LIABILITIESAccounts payable and accrued liabilities consist of the following:
As at June 30, 2020 December 31, 2019Accounts payable and accrued liabilities $46,672 $37,164Tenant deposits 11,596 11,263Lease liability 9,744 9,286
$68,012 $57,713Current $58,268 $48,427Non-current 9,744 9,286
$68,012 $57,713
Future minimum lease payments under the lease liability are as follows:
As at June 30, 2020 December 31, 2019Within 12 months $233 $444 2 to 5 years 1,882 1,793 Over 5 years 12,307 11,729 Total minimum lease payments 14,422 13,966 Less: Future interest costs (4,678) (4,680) Present value of minimum lease payments $9,744 $9,286
NOTE 10UNITHOLDERS’ EQUITY(a) UnitsThe REIT is authorized to issue an unlimited number of Units. Each Unit confers the right to one vote at any meeting of Unitholders and to participate pro rata in the distributions by the REIT and, in the event of termination or winding-up of the REIT, in the net assets of the REIT. The Unitholders have the right to require the REIT to redeem their Units on demand subject to certain conditions. The Units have no par value. Upon receipt of the redemption notice by the REIT, all rights to and under the Units tendered for redemption will cease and the holder thereof will be entitled to receive a price per Unit (“Redemption Price”) as determined by a formula outlined in the Declaration of Trust. The Redemption Price will be paid in accordance with the conditions provided for in the Declaration of Trust.
The Trustees have discretion with respect to the timing and amounts of distributions.
(b) Normal Course Issuer BidsOn December 18, 2019, the REIT obtained the approval of the TSX under its normal course issuer bid (“NCIB”) to purchase up to 2,953,852 Units, being approximately 10% of the public float of outstanding Units; the program expires on December 20, 2020. The daily repurchase restriction for the Units is 17,964. Additionally, the REIT may purchase up to $8,050 principal amount of the 2018 Debentures, being 10% of the public float of outstanding 2018 Debentures. The daily repurchase restriction for the 2018 Debentures is $11. The price that the REIT would pay for any such Units or 2018 Debentures would be the market price at the time of acquisition.
There were no repurchases of Units under the REIT’s NCIB plan for the six months ended June 30, 2020 and 2019.
(c) Special Voting UnitsThe REIT is authorized to issue an unlimited number of Special Voting Units. The Declaration of Trust and the exchange agreement provide for the issuance of the Special Voting Units, which have no economic entitlement in the REIT or in the distribution or assets of the REIT, but are used to provide voting rights proportionate to the votes of the Units to holders of securities exchangeable into Units, including the Class B LP Units. Each Special Voting Unit is not transferable separately from the Class B LP Unit to which it is attached and will be automatically redeemed and cancelled upon exchange of the attached Class B LP Unit into a Unit.
MORGUARD NORTH AMERICAN RESIDENTIAL REAL ESTATE INVESTMENT TRUSTCONDENSED CONSOLIDATED FINANCIAL STATEMENTS (UNAUDITED) | JUNE 30, 2020
MORGUARD.COM 57

(d) Units OutstandingThe following table summarizes the changes in Units for the period from December 31, 2018, to June 30, 2020:
Issued and Fully Paid Units Units AmountBalance, December 31, 2018 33,722,880 $368,431Issuance of Units for cash, net of costs 5,226,200 99,591Units issued under the DRIP 30,622 563Balance, December 31, 2019 38,979,702 468,585Units issued under the DRIP 18,847 304Balance, June 30, 2020 38,998,549 $468,889
On August 28, 2019, the REIT completed an offering for 5,226,200 Units sold for a price of $19.75 per Unit for aggregate gross proceeds of $103,217 (the “Offering”). The net proceeds of the Offering, after underwriters’ commission and other closing costs totalling $3,626, was $99,591. Morguard purchased 1,269,000 of the Units offered amounting to $25,063.
Total distributions declared during the six months ended June 30, 2020, amounted to $13,639, or $0.3498 per Unit (2019 - $11,455, or $0.3396 per Unit), including distributions payable of $2,274 that were declared on June 15, 2020, and paid on July 15, 2020. On July 15, 2020, the REIT declared a distribution of $0.0583 per Unit payable on August 14, 2020.
(e) Distribution Reinvestment PlanUnder the REIT’s Distribution Reinvestment Plan (“DRIP”), Unitholders can elect to reinvest cash distributions into additional Units at a weighted average closing price of the Units on the TSX for the five trading days immediately preceding the applicable date of distribution. During the six months ended June 30, 2020, the REIT issued 18,847 Units under the DRIP (December 31, 2019 - 30,622 Units).
(f) Accumulated Other Comprehensive IncomeThe accumulated other comprehensive income consists of the following amounts:
As at June 30, 2020 December 31, 2019Unrealized foreign currency translation gain $118,405 $84,123Balance, end of period $118,405 $84,123
NOTE 11RENTAL INCOMEThe components of revenue from real estate properties are as follows:
N/A Three months ended Six months endedJune 30 June 30
N/A 2020 2019 2020 2019Rental income $31,504 $29,301 $61,608 $58,927Property management and ancillary income 21,994 22,524 45,056 45,941Property tax and insurance 9,704 9,135 18,835 18,350
$63,202 $60,960 $125,499 $123,218
MORGUARD NORTH AMERICAN RESIDENTIAL REAL ESTATE INVESTMENT TRUSTCONDENSED CONSOLIDATED FINANCIAL STATEMENTS (UNAUDITED) | JUNE 30, 2020
MORGUARD.COM 58

NOTE 12INTEREST EXPENSEThe components of interest expense are as follows:
N/AThree months ended Six months ended
June 30 June 302020 2019 2020 2019
Interest on mortgages $10,409 $10,243 $20,584 $20,644 Interest and tax payment on Class C LP Units 931 950 1,853 1,883 Interest on the convertible debentures (Note 6) 959 959 1,913 1,913 Interest on lease liability 117 100 233 200 Amortization of deferred financing costs 649 691 1,312 1,424 Amortization of deferred financing costs on the convertible debentures 165 155 316 310 Fair value loss (gain) on conversion option on the convertible debentures 659 (126) (2,468) 1,226 Loss on extinguishment of mortgages payable — 70 — 561
13,889 13,042 23,743 28,161 Distributions on Class B LP Units (Note 7) 3,013 2,925 6,025 5,849
$16,902 $15,967 $29,768 $34,010
NOTE 13TRUST EXPENSESThe components of trust expenses are as follows:
N/AThree months ended Six months ended
June 30 June 302020 2019 2020 2019
Asset management fees and distributions $3,523 $2,961 $6,790 $5,834Professional fees 311 352 583 632Public company expenses 174 185 359 365Other 155 236 299 369
$4,163 $3,734 $8,031 $7,200
NOTE 14RELATED PARTY TRANSACTIONSIn addition to the related party transactions disclosed in Notes 5, 6, 7, 8 and 10(d), related party transactions also include the following:
Agreements with Morguard AffiliatesThe REIT, the Partnership and its subsidiaries entered into a series of agreements (the “Agreements”) with certain Morguard affiliates whereby the following services are provided by Morguard’s affiliates under the direction of the REIT:
Property ManagementPursuant to the Agreements, Morguard’s affiliates administer the day-to-day operations of the Canadian and U.S. income producing properties, for which Morguard’s affiliates receive partnership fees and distributions equal to 3.5% of gross property revenue of the income producing properties, payable monthly. Fees and distributions for the three and six months ended June 30, 2020 amounted to $2,333 (2019 - $2,128) and $4,631 (2019 - $4,314), respectively, and are included in property operating costs and equity income from investments. As at June 30, 2020, $648 (December 31, 2019 - $595) is included in accounts payable and accrued liabilities.
Asset ManagementPursuant to the Agreements, Morguard’s affiliates have certain duties and responsibilities for the strategic management and administration of the Partnership and its subsidiaries, for which they receive partnership fees and distributions equal to 0.25% of the Partnership’s gross book value defined as acquisition cost of the REIT’s assets plus: (i) fair value adjustments; and (ii) accumulated amortization on property, plant and equipment. In addition, an annual fee and distribution is calculated in arrears, determined by multiplying 15% of the Partnership’s funds from operations in excess of $0.66 per Unit. Fees and distributions for the three and six months ended June 30, 2020 amounted to $3,697 (2019 - $3,016) and $7,130 (2019 - $5,943), respectively, are included in trust expenses and
MORGUARD NORTH AMERICAN RESIDENTIAL REAL ESTATE INVESTMENT TRUSTCONDENSED CONSOLIDATED FINANCIAL STATEMENTS (UNAUDITED) | JUNE 30, 2020
MORGUARD.COM 59

equity income from investments. As at June 30, 2020, $2,313 (December 31, 2019 - $5,711) is included in accounts payable and accrued liabilities.
AcquisitionPursuant to the Agreements, Morguard’s affiliates are entitled to receive partnership fees with respect to properties acquired, directly or indirectly, by the REIT from third parties, and the fees are to be paid upon the closing of the purchase of each such property. The fees range from 0% of the purchase price paid for properties acquired directly or indirectly from Morguard, including entities controlled by Morguard, up to 0.75% of the purchase price paid for properties acquired from third parties. There were no fees relating to acquisition services for the three and six months ended June 30, 2020 and 2019.
FinancingPursuant to the Agreements, with respect to arranging for financing services, Morguard’s affiliates are entitled to receive partnership fees equal to 0.15% of the principal amount and associated costs (excluding mortgage premiums) of any debt financing or refinancing. Fees relating to financing services for the three and six months ended June 30, 2020 amounted to $37 (2019 - $nil) and $37 (2019 - $nil), respectively, and have been capitalized to deferred financing costs.
DevelopmentPursuant to the Agreements, Morguard’s affiliates are entitled to receive partnership fees equal to 1.00% of development costs, where such costs exceed $1,000 and are incurred in connection with: (i) the construction, enlargement or reconstruction of any building, erection, plant, equipment or improvement on a property; or (ii) any refurbishing, additions, upgrading or restoration of or renovations to existing buildings, erections, plant, equipment or improvements, including redevelopments, other than repair and maintenance in the ordinary course of business. Fees relating to development services for the three and six months ended June 30, 2020, amounted to $14 (2019 - $20) and $29 (2019 - $32), respectively, and are included in property under development. As at June 30, 2020, $8 (December 31, 2019 - $22) is included in accounts payable and accrued liabilities.
Other ServicesAs at June 30, 2020, the REIT had its portfolio appraised by Morguard’s appraisal division. Fees relating to appraisal services for the three and six months ended June 30, 2020 amounted to $47 (2019 - $52) and $100 (2019 - $110), respectively, and are included in trust expenses.
On April 11, 2020, the Canada Emergency Wage Subsidy (“CEWS”) was enacted. CEWS generally provides an amount to employers equal to 75% of employees’ remuneration paid, up to a maximum of $847 (in actual dollars) per week per employee, from March 15 to June 6, 2020, the first three periods. Subsequently, CEWS was extended to December 19, 2020. Eligibility applies to the associated related party group under common control. When the affiliated group has experienced a significant decline in revenues as compared to the same period in the previous year (among other criteria), the entity will be eligible for CEWS. Included in other income for the three and six months ended June 30, 2020, is an allocation of on-site payroll services relating to the REIT’s Canadian properties provided by Morguard affiliates amounting to $925.
NOTE 15INCOME TAXES(a) Canadian StatusThe REIT is a “mutual fund trust” pursuant to the Act. Under current tax legislation, a mutual fund trust that is not a Specified Investment Flow-Through (“SIFT”) Trust pursuant to the Act is entitled to deduct distributions of taxable income such that it is not liable to pay income taxes provided that its taxable income is fully distributed to Unitholders. The REIT intends to continue to qualify as a mutual fund trust that is not a SIFT Trust and to make distributions not less than the amount necessary to ensure that the REIT will not be liable to pay income taxes.
(b) U.S. StatusCertain of the REIT’s operations or a portion thereof are conducted through its taxable U.S. subsidiaries, which are subject to U.S. federal and state corporate income taxes.
MORGUARD NORTH AMERICAN RESIDENTIAL REAL ESTATE INVESTMENT TRUSTCONDENSED CONSOLIDATED FINANCIAL STATEMENTS (UNAUDITED) | JUNE 30, 2020
MORGUARD.COM 60

As at June 30, 2020, the U.S. subsidiaries of the REIT have total net operating losses of approximately US$30,343 (December 31, 2019 - US$29,234) of which no deferred tax assets were recognized as it is not probable that taxable profit will be available against such losses of which the deductible temporary difference can be utilized. The net operating losses expire in various years commencing in 2032.
As at June 30, 2020, the U.S. subsidiaries of the REIT have total net operating losses of approximately of US$11,740 (December 31, 2019 - US$5,782) of which deferred tax assets were recognized. The net operating losses can be carried forward indefinitely.
As at June 30, 2020, the REIT’s U.S. subsidiaries have a total of US$1,552 (December 31, 2019 - US$9,206) of unutilized interest expense deductions on which deferred tax assets were recognized.
NOTE 16CONSOLIDATED STATEMENTS OF CASH FLOWS(a) Items Not Affecting Cash
Three months ended Six months endedJune 30 June 30
N/A 2020 2019 2020 2019Fair value gain on real estate properties, net ($28,349) ($36,315) ($21,782) ($47,504) Fair value loss (gain) on Class B LP Units 20,668 1,205 (67,170) 21,873 Fair value loss (gain) on conversion option on the convertible debentures 659 (126) (2,468) 1,226 Equity income from investments (2,459) (1,575) (1,563) (2,128) Amortization of deferred financing - mortgages 575 615 1,163 1,273 Amortization of deferred financing - Class C LP Units 74 76 149 151 Amortization of deferred financing - convertible debentures 165 155 316 310 Present value adjustment of tax liability on Class C LP Units 143 141 286 281 Loss on extinguishment of mortgages payable — 70 — 561 Amortization of tenant incentives 312 241 586 522 Deferred income taxes 5,420 8,239 8,129 7,210
($2,792) ($27,274) ($82,354) ($16,225)
(b) Net Change in Non-cash Operating Assets and Liabilities Three months ended Six months ended
June 30 June 30N/A 2020 2019 2020 2019Amounts receivable ($969) ($163) ($1,794) $158 Prepaid expenses 1,922 (274) 166 (4,005) Accounts payable and accrued liabilities 6,923 3,762 (2,912) 934
$7,876 $3,325 ($4,540) ($2,913)
(c) Supplemental Cash Flow Information Three months ended Six months ended
June 30 June 30N/A 2020 2019 2020 2019Interest paid $11,386 $11,213 $24,053 $24,502
MORGUARD NORTH AMERICAN RESIDENTIAL REAL ESTATE INVESTMENT TRUSTCONDENSED CONSOLIDATED FINANCIAL STATEMENTS (UNAUDITED) | JUNE 30, 2020
MORGUARD.COM 61

(d) Reconciliation of Liabilities Arising from Financing ActivitiesThe following provides a reconciliation of liabilities arising from financing activities:
As at June 30, 2020
MortgagesPayable and
Class C LP UnitsConvertibleDebentures
LeaseLiability Total
Balance, beginning of period $1,230,305 $86,398 $9,286 $1,325,989 Repayments (12,163) — — (12,163) New financing, net 24,546 — — 24,546 Lump-sum repayments (8,757) — — (8,757) Non-cash changes 1,598 (2,152) — (554) Foreign exchange 39,208 — 458 39,666 Balance, end of period $1,274,737 $84,246 $9,744 $1,368,727
NOTE 17MANAGEMENT OF CAPITALRefer to the REIT’s audited consolidated financial statements as at and for the year ended December 31, 2019 for an explanation of the REIT’s capital management policy.
The total managed capital for the REIT as at June 30, 2020, and December 31, 2019, is summarized below:
As at June 30, 2020 December 31, 2019Mortgages payable, principal balance $1,200,678 $1,154,960Class C LP Units and present value of tax payment, principal balance 85,819 87,483Convertible debentures, face value 85,500 85,500Lease liability 9,744 9,286Class B LP Units 251,285 318,455Unitholders’ equity 1,273,381 1,136,363
$2,906,407 $2,792,047
The REIT’s debt ratios compared to its borrowing limits established in the Declaration of Trust are outlined in the table below:
As at Borrowing Limits June 30, 2020 December 31, 2019Total debt to gross book value 70 % 43.5 % 44.1 %Floating-rate debt to gross book value 20 % — % — %
NOTE 18FINANCIAL INSTRUMENTS AND RISK MANAGEMENTRefer to the REIT’s audited consolidated financial statements as at and for the year ended December 31, 2019 foran explanation of the REIT’s risk management policy as it relates to financial instruments.
Fair Value of Financial Assets and LiabilitiesThe fair values of cash, restricted cash, amounts receivable, the Morguard Facility and accounts payable and accrued liabilities approximate their carrying values due to the short-term maturity of these instruments.
Mortgages payable and Class C LP Units, lease liability and the convertible debentures are carried at amortized cost using the effective interest method of amortization. The estimated fair values of long-term borrowings have been determined based on market information, where available, or by discounting future payments of interest and principal at estimated interest rates expected to be available to the REIT.
The fair values of the mortgages payable and Class C LP Units have been determined by discounting the cash flows of these financial obligations using June 30, 2020, market rates for debts of similar terms (Level 2). Based on these assumptions, as at June 30, 2020, the fair values of the mortgages payable and Class C LP Units before deferred financing costs and present value of tax payment are estimated at $1,249,831 and $78,582, (December 31, 2019 -
MORGUARD NORTH AMERICAN RESIDENTIAL REAL ESTATE INVESTMENT TRUSTCONDENSED CONSOLIDATED FINANCIAL STATEMENTS (UNAUDITED) | JUNE 30, 2020
MORGUARD.COM 62
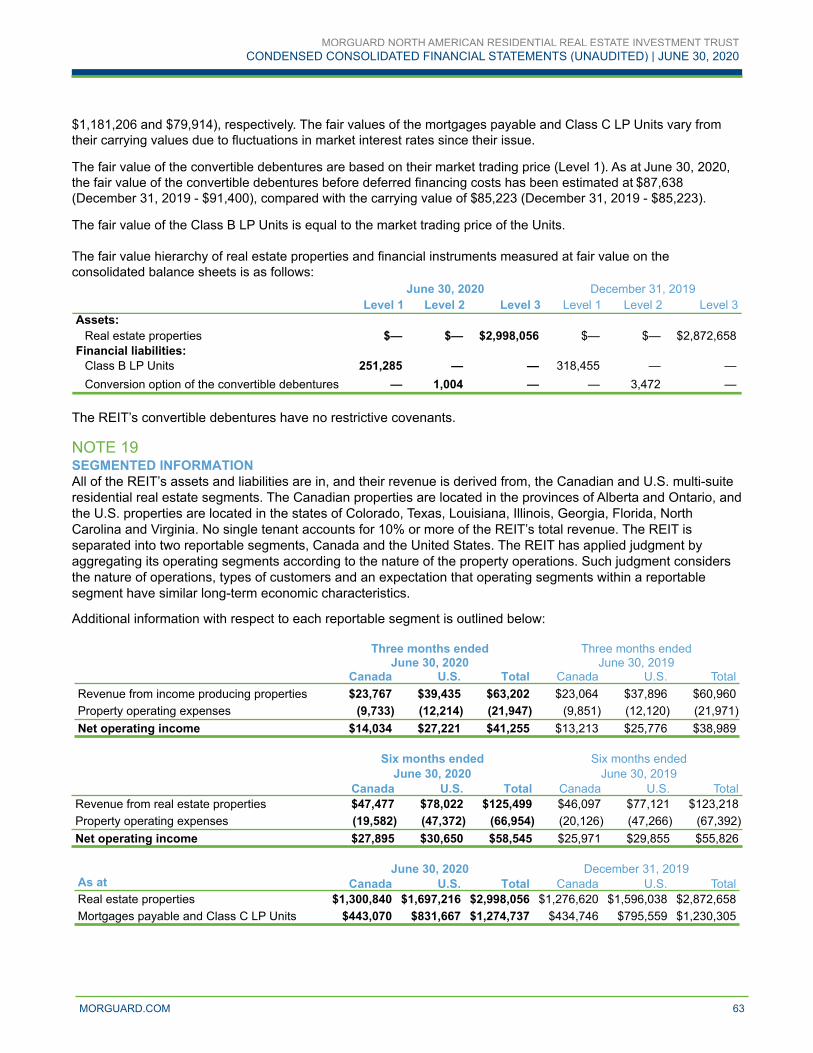
$1,181,206 and $79,914), respectively. The fair values of the mortgages payable and Class C LP Units vary from their carrying values due to fluctuations in market interest rates since their issue.
The fair value of the convertible debentures are based on their market trading price (Level 1). As at June 30, 2020, the fair value of the convertible debentures before deferred financing costs has been estimated at $87,638 (December 31, 2019 - $91,400), compared with the carrying value of $85,223 (December 31, 2019 - $85,223).
The fair value of the Class B LP Units is equal to the market trading price of the Units.
The fair value hierarchy of real estate properties and financial instruments measured at fair value on the consolidated balance sheets is as follows:
June 30, 2020 December 31, 2019Level 1 Level 2 Level 3 Level 1 Level 2 Level 3
Assets:Real estate properties $— $— $2,998,056 $— $— $2,872,658
Financial liabilities:Class B LP Units 251,285 — — 318,455 — — Conversion option of the convertible debentures — 1,004 — — 3,472 —
The REIT’s convertible debentures have no restrictive covenants.
NOTE 19SEGMENTED INFORMATIONAll of the REIT’s assets and liabilities are in, and their revenue is derived from, the Canadian and U.S. multi-suite residential real estate segments. The Canadian properties are located in the provinces of Alberta and Ontario, and the U.S. properties are located in the states of Colorado, Texas, Louisiana, Illinois, Georgia, Florida, North Carolina and Virginia. No single tenant accounts for 10% or more of the REIT’s total revenue. The REIT is separated into two reportable segments, Canada and the United States. The REIT has applied judgment by aggregating its operating segments according to the nature of the property operations. Such judgment considers the nature of operations, types of customers and an expectation that operating segments within a reportable segment have similar long-term economic characteristics.
Additional information with respect to each reportable segment is outlined below:
Three months ended Three months endedJune 30, 2020 June 30, 2019
Canada U.S. Total Canada U.S. TotalRevenue from income producing properties $23,767 $39,435 $63,202 $23,064 $37,896 $60,960Property operating expenses (9,733) (12,214) (21,947) (9,851) (12,120) (21,971) Net operating income $14,034 $27,221 $41,255 $13,213 $25,776 $38,989
Six months ended Six months endedFor the three months ended December 31, June 30, 2020 June 30, 2019For the years ended Canada U.S. Total Canada U.S. TotalRevenue from real estate properties $47,477 $78,022 $125,499 $46,097 $77,121 $123,218Property operating expenses (19,582) (47,372) (66,954) (20,126) (47,266) (67,392) Net operating income $27,895 $30,650 $58,545 $25,971 $29,855 $55,826
June 30, 2020 December 31, 2019As at Canada U.S. Total Canada U.S. TotalReal estate properties $1,300,840 $1,697,216 $2,998,056 $1,276,620 $1,596,038 $2,872,658Mortgages payable and Class C LP Units $443,070 $831,667 $1,274,737 $434,746 $795,559 $1,230,305
MORGUARD NORTH AMERICAN RESIDENTIAL REAL ESTATE INVESTMENT TRUSTCONDENSED CONSOLIDATED FINANCIAL STATEMENTS (UNAUDITED) | JUNE 30, 2020
MORGUARD.COM 63
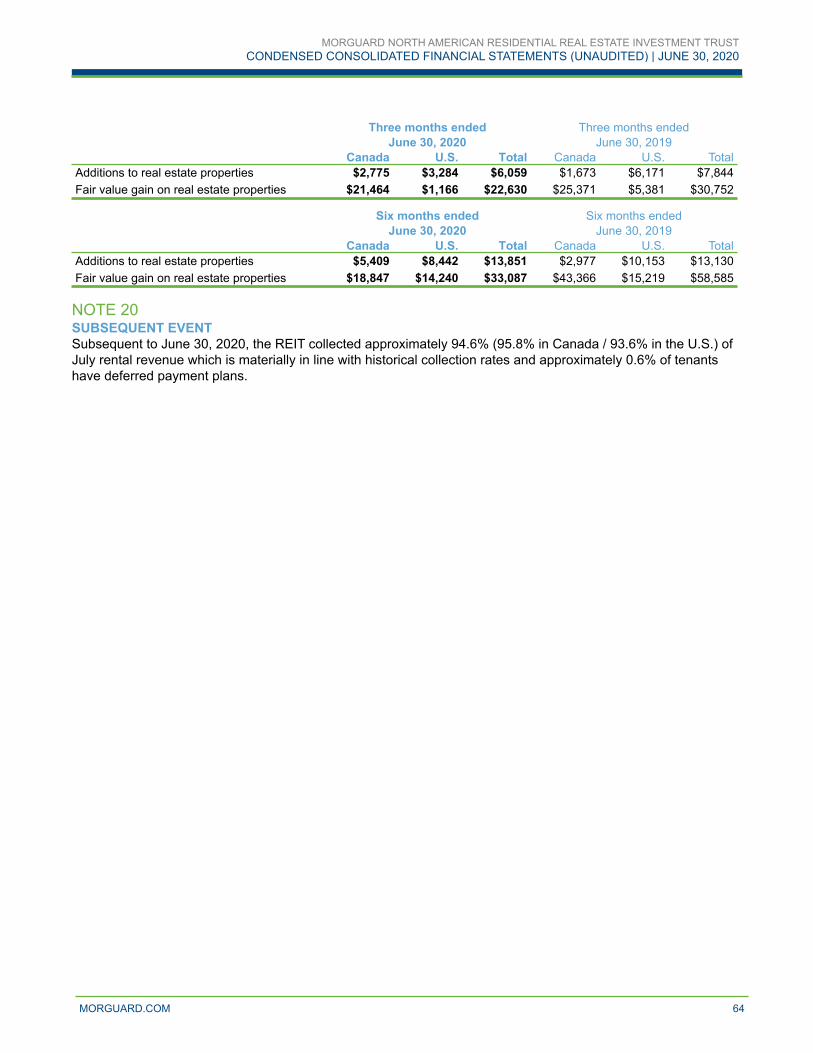
Three months ended Three months endedFor the three months ended June 30, June 30, 2020 June 30, 2019
Canada U.S. Total Canada U.S. TotalAdditions to real estate properties $2,775 $3,284 $6,059 $1,673 $6,171 $7,844Fair value gain on real estate properties $21,464 $1,166 $22,630 $25,371 $5,381 $30,752
Six months ended Six months endedFor the six months ended June 30, June 30, 2020 June 30, 2019For the years ended Canada U.S. Total Canada U.S. TotalAdditions to real estate properties $5,409 $8,442 $13,851 $2,977 $10,153 $13,130Fair value gain on real estate properties $18,847 $14,240 $33,087 $43,366 $15,219 $58,585
NOTE 20SUBSEQUENT EVENTSubsequent to June 30, 2020, the REIT collected approximately 94.6% (95.8% in Canada / 93.6% in the U.S.) of July rental revenue which is materially in line with historical collection rates and approximately 0.6% of tenants have deferred payment plans.
MORGUARD NORTH AMERICAN RESIDENTIAL REAL ESTATE INVESTMENT TRUSTCONDENSED CONSOLIDATED FINANCIAL STATEMENTS (UNAUDITED) | JUNE 30, 2020
MORGUARD.COM 64