section 16 banking, finance, and insurance - · pdf filesection 16 banking, finance, and...
TRANSCRIPT

Section 16
Banking, Finance, and InsuranceThis section presents data on the Nation’sfinances, various types of financial institu-tions, money and credit, securities, andinsurance. The primary sources of thesedata are publications of several depart-ments of the Federal Government, espe-cially the Treasury Department, and inde-pendent agencies such as the FederalDeposit Insurance Corporation, the Feder-al Reserve System, and the Securities andExchange Commission. National data oninsurance are available primarily from pri-vate organizations, such as the AmericanCouncil of Life Insurance.
Flow of funds— The flow of funds ac-counts of the Federal Reserve System(see tables 768 to 771) bring togetherstatistics on all of the major forms of fi-nancial transactions and financial claimsto present an economy-wide view of asset and liability relationships. In flowform, the accounts relate borrowing andlending to one another and to the nonfi-nancial activities that generate incomeand production. Each claim outstandingis included simultaneously as an asset ofthe lender and as a liability of the debtor.The accounts also indicate the balancebetween asset totals and liability totalsover the economy as a whole. Severalpublications of the Board of Governors of the Federal Reserve System containinformation on the flow of funds ac-counts: Summary data on flows and outstandings, in the Federal ReserveBulletin, Flow of Funds Accounts (quar-terly), and Annual Statistical Digest; and concepts and organization of the accounts, in Guide to the Flow of FundsAccounts (1993).
Banking system— Banks in this countryare organized under the laws of both theStates and the Federal Government andare regulated by several bank superviso-ry agencies. National banks are super-vised by the Comptroller of the Currency.Reports of Condition have been col-lected from national banks since 1863.Summaries of these reports are pub-lished in the Comptroller’s Annual Re-port, which also presents data on thestructure of the national banking system.
In BriefConventional new-homemortgage rates:
1980 13.95%1990 10.08%1995 8.05%
Dow-Jones industrial average:1980 964.01990 2,633.71995 5,117.1
The Federal Reserve System was estab-lished in 1913 to exercise central bank-ing functions, some of which are sharedwith the U.S. Treasury. It includes nation-al banks and such State banks that vol-untarily join the System. Statements ofState bank members are consolidated bythe Board of Governors of the FederalReserve System with data for nationalbanks collected by the Comptroller of theCurrency into totals for all member banksof the System. Balance sheet data formember banks and other commercialbanks are published quarterly in the Federal Reserve Bulletin. The FederalDeposit Insurance Corporation (FDIC),established in 1933, insures each depos-itor up to $100,000. Major item balancesheet and income data for all commercialbanks are published in the FDIC Quarter-ly Banking Profile.
The FDIC is the primary federal regulatorof State-chartered banks that are notmembers of the Federal Reserve Systemand of most savings banks insured by theBank Insurance Fund (BIF). The agencyalso has certain back–up supervisory au-thority, for safety and soundness purposes,over State-chartered banks that are mem-bers of the Federal Reserve System, na-tional banks, and savings associations.
Saving s institutions— Savings institutionsare primarily involved in credit extension inthe form of mortgage loans. Statistics onsavings institutions are collected by theU.S. Office of Thrift Supervision and theFDIC. The Financial Institutions Reform,Recovery, and Enforcement Act of 1989(FIRREA) authorized the establishment ofthe Resolution Trust Corporation (RTC)which was responsible for the disposal of

Banking, Finance, and Insurance504
assets from failed savings institutions. FIR-REA gave the FDIC the job of managingthe federal deposit insurance fund for sav-ings institutions (SAIF=Savings AssociationInsurance Fund). Major balance sheetand income data for all insured savingsinstitutions are published in the FDICQuarterly Banking Profile.
Credit Unions— Federally charteredcredit unions are under the supervisionof the National Credit Union Administra-tion, established in 1970. State-charteredcredit unions are supervised by the re-spective State supervisory authorities.The Administration publishes compre-hensive program and statistical informa-tion on all Federal and federally insuredState credit unions in the Annual Reportof the National Credit Union Administra-tion. Deposit insurance (up to $100,000per account) is provided to members ofall Federal and those State credit unionsthat are federally-insured by the NationalCredit Union Share Insurance Fundwhich was established in 1970. Depositinsurance for State chartered creditunions is also available in some Statesunder private or State-administered in-surance programs.
Other credit agencies— Insurance com-panies, finance companies dealing pri-marily in installment sales financing, andpersonal loan companies represent im-portant sources of funds for the creditmarket. Statistics on loans, investments,cash, etc., of life insurance companiesare published principally by the AmericanCouncil of Life Insurance in its Life Insur-ance Fact Book and in the Federal Re-serve Bulletin. Consumer credit data are published currently in the FederalReserve Bulletin.
Government corporations and creditagencies make available credit of speci-fied types or to specified groups of pri-vate borrowers, either by lending directlyor by insuring or guaranteeing loansmade by private lending institutions. Dataon operations of Government creditagencies, along with other Governmentcorporations, are available in reports ofindividual agencies; data on their debtoutstanding are published in the FederalReserve Bulletin.
Currency— Currency, including coin and paper money, represents about 31
percent of all media of exchange in theUnited States, with most payments madeby check. All currency is now issued bythe Federal Reserve Banks.
Securities— The Securities and ExchangeCommission (SEC) was established in1934 to protect the interests of the publicand investors against malpractices in thesecurities and financial markets and to pro-vide the fullest possible disclosure of in-formation regarding securities to the invest-ing public. Statistical data are published inthe SEC Annual Report.
Insurance— Insuring companies, whichare regulated by the various States orthe District of Columbia, are classified aseither life or property. Companies thatunderwrite accident and health insuranceonly and those that underwrite accidentand health insurance in addition to oneor more property lines are included withproperty insurance. Insuring companies,other than those classified as life, arepermitted to underwrite one or moreproperty lines provided they are so licensed and have the necessary capitalor surplus.
There are a number of publishedsources for statistics on the variousclasses of insurance—life, health, fire,marine, and casualty. Individual Statescollect data on all insurers operatingwithin their respective jurisdictions, andmany of the States publish an annual in-surance report giving individual companydata and aggregates of certain items forthe companies operating within theState. Organizations representing certainclasses of insurers publish reports forthese classes. Among them are theannual commercial publishers, such asThe National Underwriter Companywhose Argus Health Chart (annual) con-tains financial and operating data for indi-vidual health and accident insurancecompanies, including Blue Cross andBlue Shield Plans. The American Councilof Life Insurance publishes statistics onlife insurance purchases, ownership,benefit payments, and assets in its bien-nial Life Insurance Fact Book.
Historical statistics— Tabular head-notes provide cross-references, whereapplicable, to Historical Statistics of theUnited States, Colonial Times to 1970.See Appendix IV.

No. 766. Gross Domestic Product in Finance, Insurance, and Real Estate,in Current and Constant (1987) Dollars: 1990 to 1993
[In billions of dollars, except percent . For definition of gross domestic product, see text, section 14.Based on 1987 Standard Industrial Classification]
INDUSTRYCURRENT DOLLARS CONSTANT (1987) DOLLARS
1990 1991 1992 1993 1990 1991 1992 1993
Finance, insurance, real estate, total . . . . . 982.4 1,041.1 1,106.1 1,180.6 868.3 868.8 893.4 915.0Percent of gross domestic product . . . . . . 17.7 18.2 18.4 18.6 17.7 17.8 17.9 17.8
Depository institutions . . . . . . . . . . . . . . . . . . 158.7 181.3 193.9 198.5 135.1 129.4 125.3 123.3Nondepository institutions . . . . . . . . . . . . . . . 20.7 23.0 25.9 32.0 17.9 18.2 19.5 22.2Security and commodity brokers . . . . . . . . . . . 37.9 37.1 49.6 60.7 38.4 38.9 51.0 67.1Insurance carriers. . . . . . . . . . . . . . . . . . . . . 69.9 84.7 84.8 104.1 60.1 67.5 73.0 67.7Insurance agents, brokers, and services. . . . . . 37.7 38.5 40.4 42.3 32.1 31.2 31.3 31.1Real estate . . . . . . . . . . . . . . . . . . . . . . . . . 641.7 664.2 698.7 718.5 566.7 565.2 575.0 583.9Nonfarm housing services . . . . . . . . . . . . . 458.7 483.6 512.0 533.4 398.3 403.9 409.4 419.5Other real estate. . . . . . . . . . . . . . . . . . . . 183.0 180.6 186.7 185.1 168.5 161.3 165.7 164.4
Holding and other investment offices . . . . . . . . 15.8 12.1 12.8 24.4 18.1 18.5 18.3 19.7
Source: U.S. Bureau of Economic Analysis, Survey of Current Business, April 1995 and previous issues.
No. 767. Finance, Insurance, and Real Estate—Establishments, Employees,and Payroll: 1990 and 1993
[Covers establishments with payroll. Employees are for the week including March 12. Most government employees areexcluded. For statement on methodology, see Appendix III]
KIND OF BUSINESS1987SIC
code 1
ESTABLISHMENTS(1,000)
EMPLOYEES(1,000)
PAYROLL(bil. dol.)
1990 1993 1990 1993 1990 1993
Finance, insurance, real estate . . (H) 544.7 608.6 6,957 6,905 197.4 232.3
Depository institutions 2 3. . . . . . . . . . . . . 60 81.2 102.6 2,033 2,095 48.4 57.7Central reserve depositories . . . . . . . . . 601 0.1 0.1 31 26 0.9 1.0Commercial banks . . . . . . . . . . . . . . . 602 52.3 62.6 1,472 1,528 35.6 42.1Savings institutions . . . . . . . . . . . . . . . 603 21.7 19.3 417 319 8.8 8.3Credit unions . . . . . . . . . . . . . . . . . . . 606 3.6 15.3 51 147 1.0 3.0Functions closely related to banking . . . . 609 2.8 4.7 44 46 1.4 1.6
Nondepository institutions 2 3 . . . . . . . . . . 61 42.0 41.9 506 483 14.0 17.7Federal and fed.-sponsored credit . . . . . 611 0.6 1.4 14 22 0.4 1.0Personal credit institutions . . . . . . . . . . 614 25.0 17.0 236 152 5.5 3.8Business credit institutions . . . . . . . . . . 615 3.7 4.8 88 100 3.1 4.1Mortgage bankers and brokers . . . . . . . 616 10.9 18.5 153 208 4.6 8.8
Security and commodity brokers 2 . . . . . . . 62 25.2 34.3 411 450 26.6 39.5Security brokers and dealers. . . . . . . . . 621 15.9 19.6 308 310 20.8 28.9Commodity contracts brokers, dealers . . 622 1.2 1.5 15 13 0.7 0.7Security and commodity exchanges . . . . 623 0.2 0.1 9 7 0.5 0.4Security and commodity services . . . . . . 628 7.1 13.1 76 120 4.5 9.5
Insurance carriers 2 . . . . . . . . . . . . . . . . 63 43.3 43.8 1,407 1,570 41.5 52.7Life insurance . . . . . . . . . . . . . . . . . . 631 14.1 12.7 572 618 16.3 19.7Medical service and health insurance 2 . . 632 2.1 2.9 188 256 5.1 8.1Accident and health insurance . . . . . . 6321 1.1 1.1 48 54 1.3 1.5Hospital and medical service plans . . . 6324 1.0 1.8 139 202 3.8 6.6
Fire, marine, and casualty insurance . . . 633 18.3 19.1 533 585 17.0 21.6Surety insurance. . . . . . . . . . . . . . . . . 635 0.6 0.6 15 12 0.5 0.5Title insurance . . . . . . . . . . . . . . . . . . 636 3.2 2.3 57 40 1.6 1.4Pension, health and welfare funds . . . . . 637 3.8 6.0 25 54 0.6 1.2
Insurance agents, brokers, and service . . . 64 110.8 122.3 712 656 20.3 20.3
Real estate 2 . . . . . . . . . . . . . . . . . . . . . 65 217.0 235.0 1,374 1,335 28.5 29.7Real estate operators and lessors . . . . . 651 95.7 101.8 509 491 8.7 8.9Real estate agents and managers . . . . . 653 72.2 110.4 585 707 13.3 17.0Title abstract offices. . . . . . . . . . . . . . . 654 3.1 4.8 24 38 0.5 1.0Subdividers and developers 2 . . . . . . . . 655 19.6 16.6 140 98 3.4 2.6Subdividers and developers, n.e.c. 4 . . 6552 10.8 9.4 88 57 2.3 1.7Cemetery subdividers and developers . 6553 4.4 6.3 35 40 0.6 0.8
Holding and other investment offices 2 . . . . 67 22.6 27.4 263 254 10.0 11.8Holding offices . . . . . . . . . . . . . . . . . . 671 6.2 7.9 124 128 5.4 7.0Investment offices . . . . . . . . . . . . . . . . 672 1.0 0.8 16 12 1.0 0.7Trusts . . . . . . . . . . . . . . . . . . . . . . . . 673 7.8 10.4 65 65 1.4 1.7Educational, religious, etc. trusts . . . . 6732 3.6 4.7 42 37 0.9 1.0
Miscellaneous investing . . . . . . . . . . . . 679 5.0 8.1 44 49 1.5 2.4Patent owners and lessors . . . . . . . . 6794 0.9 1.6 15 18 0.4 0.8
Administrative and auxiliary . . . . . . . . . . . (X) 2.6 1.3 251 62 8.2 2.9
X Not applicable. 1 Standard Industrial Classification; see text, section 13. 2 Includes industries not shown separately.3 Includes government employees. 4 N.e.c.=Not elsewhere classified.
Source: U.S. Bureau of the Census, County Business Patterns, annual.
Gross Domestic Product, by Industry—Establishments 505

No. 768. Flow of Funds Accounts—Financial Assets of Financial and NonfinancialInstitutions, by Holder Sector: 1980 to 1994
[In billions of dollars . As of Dec. 31. See also Historical Statistics, Colonial Times to 1970, series X 192,X 229, X 821, and X 835]
SECTOR 1980 1985 1987 1988 1989 1990 1991 1992 1993 1994
All sectors . . . . . . . . . . . . . . . 13,527 22,319 27,282 29,724 33,098 34,188 37,338 39,679 42,776 44,435Households 1. . . . . . . . . . . . . . . . . . 6,406 9,668 11,380 12,346 13,802 14,023 15,534 16,465 17,538 17,997Nonfinancial business . . . . . . . . . . . . 1,340 2,067 2,473 2,704 2,849 2,981 3,032 3,161 3,233 3,376Farm . . . . . . . . . . . . . . . . . . . . . 24 33 39 43 45 47 50 53 57 60Nonfarm noncorporate . . . . . . . . . . 140 310 364 404 432 445 440 454 460 474Nonfinancial corporations . . . . . . . . 1,176 1,723 2,070 2,257 2,373 2,489 2,542 2,654 2,716 2,842
State and local government . . . . . . . . 249 521 637 680 712 723 732 716 720 629U.S. Government . . . . . . . . . . . . . . . 229 372 371 361 369 441 499 474 474 432U.S. Government-sponsored creditenterprises and mortgage pools . . . . 307 692 1,043 1,165 1,321 1,494 1,650 1,821 1,980 2,225Monetary authorities . . . . . . . . . . . . . 174 243 286 304 315 344 366 382 424 452Commercial banking 2 . . . . . . . . . . . . 1,482 2,376 2,774 2,952 3,232 3,339 3,443 3,657 3,896 4,162Domestic commercial banks . . . . . . 1,266 1,990 2,257 2,385 2,545 2,644 2,677 2,775 2,932 3,123Foreign banking offices in U.S. . . . . 98 144 236 266 360 368 439 511 546 596
Nonbank finance . . . . . . . . . . . . . . . 2,881 5,486 7,055 7,734 8,727 8,966 10,071 10,843 12,043 12,393Funding corporations . . . . . . . . . . . 14 46 71 99 117 153 178 235 291 345Savings institutions . . . . . . . . . . . . 792 1,275 1,505 1,640 1,513 1,358 1,172 1,079 1,029 1,013Credit unions . . . . . . . . . . . . . . . . 68 134 178 192 202 217 240 264 281 295Life insurance . . . . . . . . . . . . . . . 464 796 1,005 1,133 1,260 1,367 1,505 1,614 1,785 1,888Other insurance . . . . . . . . . . . . . . 182 299 405 454 503 533 576 597 641 670Private pension funds . . . . . . . . . . 504 1,093 1,367 1,422 1,706 1,629 2,056 2,214 2,450 2,356State and local govt. retirement funds 197 399 524 609 767 820 941 1,059 1,151 1,223Finance companies . . . . . . . . . . . . 205 365 484 535 571 611 634 637 654 742Mortgage companies . . . . . . . . . . . 16 25 24 29 49 49 60 60 60 34Real estate investment trusts . . . . . 3 8 10 14 15 13 14 14 17 18Mutual funds . . . . . . . . . . . . . . . . 62 240 460 478 566 602 814 1,042 1,429 1,463Closed-end funds . . . . . . . . . . . . . 8 8 21 43 52 52 72 91 107 114Money market funds . . . . . . . . . . . 76 244 316 338 428 498 540 544 559 605Security brokers, dealers . . . . . . . . 45 156 138 136 237 262 333 372 454 443Asset-backed securities issuers . . . . - 39 131 169 226 278 329 392 473 528Bank personal trusts . . . . . . . . . . . 245 358 414 444 515 522 608 630 661 656
Rest of the world . . . . . . . . . . . . . . . 459 894 1,264 1,478 1,770 1,879 2,011 2,160 2,468 2,770
- Represents zero. 1 Includes nonprofit organizations. 2 Includes other sectors not shown separately.
No. 769. Flow of Funds Accounts—Credit Market Debt Outstanding: 1980 to 1994[In billions of dollars. As of Dec. 31. N.e.c.=Not elsewhere classified]
ITEM 1980 1985 1987 1988 1989 1990 1991 1992 1993 1994
Credit market debt . . . . . . . . . . 4,700 8,462 10,697 11,704 12,725 13,597 14,232 15,036 16,018 17,051U.S. government . . . . . . . . . . . . . . . 735 1,590 1,950 2,105 2,251 2,498 2,776 3,080 3,336 3,492Private domestic nonfinancial . . . . . . . 3,189 5,382 6,612 7,208 7,819 8,215 8,405 8,640 9,027 9,490Households 1 . . . . . . . . . . . . . . . . 1,391 2,243 2,771 3,074 3,380 3,614 3,785 4,002 4,292 4,641Farm . . . . . . . . . . . . . . . . . . . . . 161 173 144 134 134 135 135 136 138 141Nonfarm noncorporate business . . . 440 860 1,034 1,097 1,137 1,147 1,116 1,074 1,049 1,069Corporations . . . . . . . . . . . . . . . . 886 1,543 1,970 2,169 2,366 2,469 2,458 2,500 2,554 2,676State and local government . . . . . . 310 563 693 735 803 849 911 928 993 964
Rest of the world . . . . . . . . . . . . . . . 197 237 245 251 261 285 299 311 358 346Financial sectors . . . . . . . . . . . . . . . 579 1,254 1,890 2,140 2,393 2,599 2,752 3,005 3,297 3,722Government-sponsored enterprises 2 163 264 308 353 378 399 408 448 528 701Federally-related mortgage pools . . . 114 369 670 745 870 1,020 1,156 1,272 1,353 1,448Commercial banks . . . . . . . . . . . . 49 79 82 79 77 77 65 74 79 89Bank holding companies . . . . . . . . 43 106 131 136 142 115 112 115 123 132Funding corporations . . . . . . . . . . . 13 39 80 118 130 146 139 162 170 201Thrift institutions 3 . . . . . . . . . . . . . 55 110 163 184 169 139 95 88 99 112Life insurance companies . . . . . . . . - - - - - - - - - 1Finance companies . . . . . . . . . . . . 127 224 299 323 350 374 393 389 391 441Mortgage companies . . . . . . . . . . . 12 17 14 15 25 25 22 30 29 16Real estate investment trusts . . . . . 5 5 8 10 12 12 14 14 17 19Security brokers, dealers . . . . . . . . - 1 3 8 14 15 19 22 34 34Asset-backed securities issuers . . . . - 39 131 169 226 278 329 392 473 528
CORPORATE CREDIT MARKET DEBTOUTSTANDING, BY TYPE
OF INSTRUMENTTotal . . . . . . . . . . . . . . . . . . . . . . 886 1,543 1,970 2,169 2,366 2,469 2,458 2,500 2,554 2,676
Municipal debt 4 . . . . . . . . . . . . . . . . 46 127 116 116 115 115 114 114 114 112Corporate bonds . . . . . . . . . . . . . . . 366 578 784 887 961 1,008 1,087 1,154 1,230 1,252Mortgages . . . . . . . . . . . . . . . . . . . 114 96 191 186 204 192 193 166 153 152Bank loans, n.e.c. . . . . . . . . . . . . . . 230 424 482 519 554 555 530 518 515 564Commercial paper . . . . . . . . . . . . . . 28 72 74 86 107 117 98 107 118 139Other loans . . . . . . . . . . . . . . . . . . . 102 245 322 375 425 481 435 441 424 456Savings institutions . . . . . . . . . . . . 1 15 20 25 24 17 10 6 5 5Finance companies . . . . . . . . . . . . 71 127 171 196 216 235 234 237 236 269U.S. government. . . . . . . . . . . . . . 8 14 11 10 10 9 8 8 8 9Acceptance liabilities to banks. . . . . 17 28 33 33 36 29 23 20 17 15Rest of the world . . . . . . . . . . . . . 5 60 86 111 138 187 153 160 141 140Asset-backed securities issuers . . . . - - - - 2 5 7 9 17 19
- Represents zero. 1 Includes nonprofit organizations. 2 U.S. Government. 3 Covers savings institutions and creditunions. 4 Industrial revenue bonds. Issued by State and local governments to finance private investment and secured in interestand principal by the industrial user of the funds.
Source of tables 768 and 769: Board of Governors of the Federal Reserve System, Flow of Funds Accounts, March 1995quarterly diskettes. Data are also published in the quarterly Z.1 release.
Banking, Finance, and Insurance506
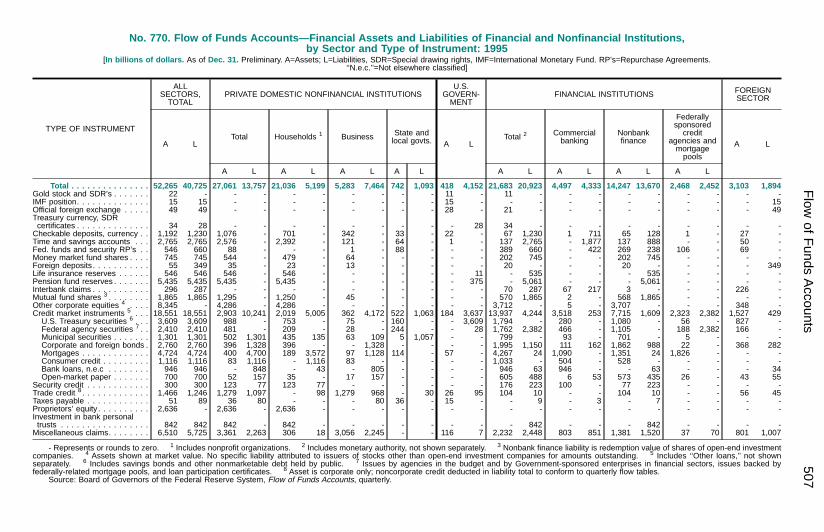
No. 770. Flow of Funds Accounts—Financial Assets and Liabilities of Financial and Nonfinancial Institutions,by Sector and Type of Instrument: 1995
[In billions of dollars. As of Dec. 31. Preliminary. A=Assets; L=Liabilities, SDR=Special drawing rights, IMF=International Monetary Fund. RP’s=Repurchase Agreements.‘‘N.e.c.’’=Not elsewhere classified]
TYPE OF INSTRUMENT
ALLSECTORS,TOTAL
PRIVATE DOMESTIC NONFINANCIAL INSTITUTIONSU.S.
GOVERN-MENT
FINANCIAL INSTITUTIONS FOREIGNSECTOR
A LTotal Households 1 Business State and
local govts. A LTotal 2 Commercial
bankingNonbankfinance
Federallysponsoredcredit
agencies andmortgagepools
A L
A L A L A L A L A L A L A L A L
Total . . . . . . . . . . . . . . . 52,265 40,725 27,061 13,757 21,036 5,199 5,283 7,464 742 1,093 418 4,152 21,683 20,923 4,497 4,333 14,247 13,670 2,468 2,452 3,103 1,894Gold stock and SDR’s . . . . . . . 22 - - - - - - - - - 11 - 11 - - - - - - - - -IMF position. . . . . . . . . . . . . . 15 15 - - - - - - - - 15 - - - - - - - - - - 15Official foreign exchange . . . . . 49 49 - - - - - - - - 28 - 21 - - - - - - - - 49Treasury currency, SDRcertificates . . . . . . . . . . . . . . 34 28 - - - - - - - - - 28 34 - - - - - - - - -Checkable deposits, currency . . 1,192 1,230 1,076 - 701 - 342 - 33 - 22 - 67 1,230 1 711 65 128 1 - 27 -Time and savings accounts . . . 2,765 2,765 2,576 - 2,392 - 121 - 64 - 1 - 137 2,765 - 1,877 137 888 - - 50 -Fed. funds and security RP’s . . 546 660 88 - - - 1 - 88 - - - 389 660 - 422 269 238 106 - 69 -Money market fund shares . . . . 745 745 544 - 479 - 64 - - - - - 202 745 - - 202 745 - - - -Foreign deposits . . . . . . . . . . . 55 349 35 - 23 - 13 - - - - - 20 - - - 20 - - - - 349Life insurance reserves . . . . . . 546 546 546 - 546 - - - - - - 11 - 535 - - - 535 - - - -Pension fund reserves . . . . . . . 5,435 5,435 5,435 - 5,435 - - - - - - 375 - 5,061 - - - 5,061 - - - -Interbank claims . . . . . . . . . . . 296 287 - - - - - - - - - - 70 287 67 217 3 - - - 226 -Mutual fund shares 3 . . . . . . . . 1,865 1,865 1,295 - 1,250 - 45 - - - - - 570 1,865 2 - 568 1,865 - - - -Other corporate equities 4 . . . . 8,345 - 4,286 - 4,286 - - - - - - - 3,712 - 5 - 3,707 - - - 348 -Credit market instruments 5 . . . 18,551 18,551 2,903 10,241 2,019 5,005 362 4,172 522 1,063 184 3,637 13,937 4,244 3,518 253 7,715 1,609 2,323 2,382 1,527 429U.S. Treasury securities 6 . . . 3,609 3,609 988 - 753 - 75 - 160 - - 3,609 1,794 - 280 - 1,080 - 56 - 827 -Federal agency securities 7 . . 2,410 2,410 481 - 209 - 28 - 244 - - 28 1,762 2,382 466 - 1,105 - 188 2,382 166 -Municipal securities . . . . . . . 1,301 1,301 502 1,301 435 135 63 109 5 1,057 - - 799 - 93 - 701 - 5 - - -Corporate and foreign bonds . 2,760 2,760 396 1,328 396 - - 1,328 - - - - 1,995 1,150 111 162 1,862 988 22 - 368 282Mortgages . . . . . . . . . . . . . 4,724 4,724 400 4,700 189 3,572 97 1,128 114 - 57 - 4,267 24 1,090 - 1,351 24 1,826 - - -Consumer credit . . . . . . . . . 1,116 1,116 83 1,116 - 1,116 83 - - - - - 1,033 - 504 - 528 - - - - -Bank loans, n.e.c . . . . . . . . 946 946 - 848 - 43 - 805 - - - - 946 63 946 - - 63 - - - 34Open-market paper . . . . . . . 700 700 52 157 35 - 17 157 - - - - 605 488 6 53 573 435 26 - 43 55
Security credit . . . . . . . . . . . . 300 300 123 77 123 77 - - - - - - 176 223 100 - 77 223 - - - -Trade credit 8 . . . . . . . . . . . . . 1,466 1,246 1,279 1,097 - 98 1,279 968 - 30 26 95 104 10 - - 104 10 - - 56 45Taxes payable . . . . . . . . . . . . 51 89 36 80 - - - 80 36 - 15 - - 9 - 3 - 7 - - - -Proprietors’ equity . . . . . . . . . . 2,636 - 2,636 - 2,636 - - - - - - - - - - - - - - - - -Investment in bank personaltrusts . . . . . . . . . . . . . . . . . 842 842 842 - 842 - - - - - - - - 842 - - - 842 - - - -Miscellaneous claims. . . . . . . . 6,510 5,725 3,361 2,263 306 18 3,056 2,245 - - 116 7 2,232 2,448 803 851 1,381 1,520 37 70 801 1,007
- Represents or rounds to zero. 1 Includes nonprofit organizations. 2 Includes monetary authority, not shown separately. 3 Nonbank finance liability is redemption value of shares of open-end investmentcompanies. 4 Assets shown at market value. No specific liability attributed to issuers of stocks other than open-end investment companies for amounts outstanding. 5 Includes ‘‘Other loans,’’ not shownseparately. 6 Includes savings bonds and other nonmarketable debt held by public. 7 Issues by agencies in the budget and by Government-sponsored enterprises in financial sectors, issues backed byfederally-related mortgage pools, and loan participation certificates. 8 Asset is corporate only; noncorporate credit deducted in liability total to conform to quarterly flow tables.
Source: Board of Governors of the Federal Reserve System, Flow of Funds Accounts, quarterly.
Flow
ofFunds
Accounts
507

No. 771. Flow of Funds Accounts—Assets and Liabilities of Households: 1980 to 1994[As of December 31 . Includes nonprofit organizations. See table 770 for preliminary 1995 data. See also Historical Statistics,
Colonial Times to 1970, series X 114-147]
TYPE OF INSTRUMENTTOTAL(bil. dol.)
PERCENTDISTRIBUTION
1980 1985 1990 1991 1992 1993 1994 1980 1990 1994
Total financial assets . . . . . . . . 6,406 9,668 14,023 15,534 16,465 17,538 17,997 100.0 100.0 100.0Deposits . . . . . . . . . . . . . . . . . . . . . 1,573 2,454 3,152 3,109 3,080 3,060 3,104 24.6 22.5 17.2Checkable deposits and currency . . 264 348 449 511 635 713 722 4.1 3.2 4.0Small time and savings deposits . . . 1,091 1,690 2,069 2,021 1,957 1,888 1,883 17.0 14.8 10.5Large time deposits . . . . . . . . . . . . 155 222 260 194 147 128 148 2.4 1.9 0.8Money market fund shares . . . . . . . 62 195 375 383 341 331 352 1.0 2.7 2.0
Credit market instruments . . . . . . . . . 461 862 1,499 1,447 1,523 1,526 1,932 7.2 10.7 10.7U.S. Government securities . . . . . . 212 350 648 600 699 702 1,084 3.3 4.6 6.0Treasury issues. . . . . . . . . . . . . 181 306 449 406 462 503 677 2.8 3.2 3.8Savings bonds. . . . . . . . . . . . 73 80 126 138 157 172 180 1.1 0.9 1.0Other Treasury . . . . . . . . . . . 108 226 323 268 304 331 497 1.7 2.3 2.8
Agency issues . . . . . . . . . . . . . 31 44 199 194 237 199 407 0.5 1.4 2.3Municipal securities . . . . . . . . . . . . 76 257 448 483 449 433 403 1.2 3.2 2.2Corporate and foreign bonds. . . . . . 31 31 95 105 107 142 198 0.5 0.7 1.1Mortgages . . . . . . . . . . . . . . . . . . 111 125 177 162 166 177 187 1.7 1.3 1.0Open-market paper . . . . . . . . . . . . 31 99 131 96 103 71 60 0.5 0.9 0.3
Mutual fund shares. . . . . . . . . . . . . . 46 192 452 592 734 972 969 0.7 3.2 5.4Corporate equities . . . . . . . . . . . . . . 934 1,210 1,717 2,469 2,810 3,088 2,913 14.6 12.2 16.2Life insurance reserves . . . . . . . . . . . 216 257 380 406 433 468 488 3.4 2.7 2.7Pension fund reserves 1 . . . . . . . . . . 949 2,032 3,484 4,138 4,516 4,975 5,061 14.8 24.8 28.1Investment in bank personal trusts . . . 245 358 522 608 630 661 656 3.8 3.7 3.6Equity in noncorporate business . . . . . 1,892 2,134 2,529 2,444 2,412 2,422 2,485 29.5 18.0 13.8Security credit . . . . . . . . . . . . . . . . . 16 35 62 87 76 103 108 0.3 0.4 0.6Miscellaneous assets . . . . . . . . . . . . 74 133 224 234 251 264 281 1.1 1.6 1.6
Total liabilities . . . . . . . . . . . . . 1,443 2,333 3,738 3,920 4,143 4,464 4,821 100.0 100.0 100.0Credit market instruments . . . . . . . . . 1,391 2,243 3,614 3,785 4,002 4,292 4,641 96.4 96.7 96.3Home mortgages . . . . . . . . . . . . . 905 1,379 2,455 2,614 2,788 2,970 3,156 62.7 65.7 65.5Consumer credit . . . . . . . . . . . . . . 355 602 812 797 803 867 984 24.6 21.7 20.4Municipal debt . . . . . . . . . . . . . . . 17 81 86 93 108 120 135 1.2 2.3 2.8Commercial mortgages . . . . . . . . . 31 63 139 152 164 181 190 2.2 3.7 3.9Bank loans, not elsewhereclassified . . . . . . . . . . . . . . . . . . 28 34 12 9 11 20 36 1.9 0.3 0.7Other loans . . . . . . . . . . . . . . . . . 55 84 110 120 128 134 141 3.8 2.9 2.9
Security credit . . . . . . . . . . . . . . . . . 25 51 39 55 53 76 73 1.7 1.0 1.5Trade credit. . . . . . . . . . . . . . . . . . . 14 24 69 64 72 80 89 1.0 1.8 1.8Unpaid life insurance premiums 2 . . . . 13 15 16 16 16 17 18 0.9 0.4 0.4
1 See also table 815. 2 Includes deferred premiums.
Source: Board of Governors of the Federal Reserve System, Flow of Funds Accounts, March 1995 diskettes. Data are alsopublished in the quarterly Z.1 release.
No. 772. Percent Distribution of Amount of Debt Held by Families, by Type and Purposeof Debt and Type of Lending Institution: 1989 and 1992
[Families include one-person units; for definition of family, see text, section 1. Based on Survey of Consumer Finance;see Appendix III]
TYPE OF DEBT 1989 1992 PURPOSE OFDEBT 1989 1992
TYPE OFLENDING
INSTITUTION1989 1992
Total . . . . . . . . . . . 100.0 100.0 Total . . . . . . . . . . 100.0 100.0 Total . . . . . . . . . . . . 100.0 100.0Home mortgage and Home purchase. . . . . 53.1 58.6 Commercial bank . . . . . 29.7 31.8home equity lines of Home improvement . . 2.0 1.9 Savings and loan . . . . . 23.5 18.9credit . . . . . . . . . . . 56.7 63.3 Investment, excluding Credit union . . . . . . . . . 3.2 4.0Installment loans. . . . . 13.9 9.2 real estate . . . . . . . 2.6 1.4 Finance or loan company. 9.4 12.9Credit card balances . . 2.3 2.8 Vehicles . . . . . . . . . . 8.6 5.7 Brokerage . . . . . . . . . . 3.0 3.9Other lines of credit. . . 1.0 0.8 Goods and services . . 4.8 4.9 Real estate lender . . . . . 13.2 13.4Investment real estate Investment real estate. 25.8 22.4 Individual lender . . . . . . 6.8 4.0mortgages . . . . . . . . 24.5 22.0 Education. . . . . . . . . 1.9 2.1 Other nonfinancial . . . . . 1.9 2.5Other debt . . . . . . . . . 1.7 1.9 Unclassifiable loans . . 1.2 2.9 Government . . . . . . . . . 2.1 1.2
Credit and store cards . . 2.3 2.9Unclassifiable loans . . . . 4.9 4.5
Source: Board of Governors of the Federal Reserve System, Federal Reserve Bulletin, October 1994.
Banking, Finance, and Insurance508

No. 773. Financial Assets Held by Families, by Type of Asset: 1989 and 1992[Median value in thousands of constant 1992 dollars . Constant dollar figures are based on consumer price index data publishedby U.S. Bureau of Labor Statistics. Families include one-person units; for definition of family, see text, section 1. Based onSurvey of Consumer Finance; see source. For definition of median, see Guide to Tabular Presentation]
AGE OF FAMILY HEADAND FAMILY INCOME Total 1
Transac-tion
accounts 2
Certifi-cates ofdeposit
Mutualfunds 3 Stocks 4 Bonds 4 Retirement
accounts 5Savingsbonds
Otherman-aged 6
PERCENT OF FAMILIESOWNING ASSET
1989, total . . . . . . . . . . . . . 88.4 85.1 19.4 7.1 16.2 5.3 35.4 23.8 3.51992, total . . . . . . . . . . . . . 90.7 87.5 16.6 11.2 17.8 4.7 39.3 22.7 4.3
Under 35 years old . . . . . . . . . 86.8 82.5 7.4 5.8 11.1 1.4 29.7 22.8 1.935 to 44 years old . . . . . . . . . . 90.9 86.9 9.0 10.8 20.7 3.1 47.3 29.4 3.345 to 54 years old . . . . . . . . . . 93.1 89.2 15.1 10.5 19.2 6.5 52.9 25.4 6.055 to 64 years old . . . . . . . . . . 92.9 90.7 21.2 16.6 23.0 5.0 53.4 21.4 6.065 to 74 years old . . . . . . . . . . 91.7 89.8 31.7 16.5 19.0 9.2 36.7 14.1 6.375 years old and over . . . . . . . 92.6 91.7 36.6 13.4 18.2 8.3 6.3 14.5 5.6Less than $10,000. . . . . . . . . . 70.2 63.7 11.1 3.3 4.2 1.0 7.0 6.6 0.9$10,000 to $24,999 . . . . . . . . . 88.1 83.7 15.1 5.7 8.8 1.9 21.6 13.3 2.4$25,000 to $49,999 . . . . . . . . . 98.2 95.4 17.1 11.8 18.2 3.7 45.2 27.9 4.7$50,000 to $99,999 . . . . . . . . . 99.3 98.7 22.2 18.5 31.0 6.9 70.7 39.5 6.8$100,000 and more . . . . . . . . . 98.7 98.7 19.5 29.9 48.7 22.4 78.6 32.1 11.6
PERCENT DISTRIBUTIONOF AMOUNT OF FINANCIAL
ASSETS 7
1989 . . . . . . . . . . . . . . . . . . . 100.0 19.7 10.4 5.0 14.6 11.0 18.8 1.6 6.61992 . . . . . . . . . . . . . . . . . . . 100.0 16.4 7.9 7.2 21.0 7.7 22.7 1.1 6.4
MEDIAN VALUE 8
1989, total . . . . . . . . . . . . . 12.0 2.3 12.6 11.2 7.3 27.9 11.2 0.6 22.31992, total . . . . . . . . . . . . . 13.1 2.4 13.5 18.0 10.0 25.0 15.0 0.7 25.0
Under 35 years old . . . . . . . . . 4.2 1.4 5.0 3.8 2.0 10.0 4.7 0.4 20.035 to 44 years old . . . . . . . . . . 10.8 2.2 5.0 18.0 5.0 19.3 9.8 0.6 20.045 to 54 years old . . . . . . . . . . 24.7 3.4 10.0 20.0 12.0 25.2 30.0 1.0 25.055 to 64 years old . . . . . . . . . . 40.1 4.0 20.0 20.4 20.0 40.0 35.7 1.0 30.065 to 74 years old . . . . . . . . . . 30.2 4.0 25.0 30.0 24.0 25.3 23.0 0.9 40.075 years old and over . . . . . . . 20.2 4.0 24.0 22.3 28.0 52.0 28.0 1.1 55.0Less than $10,000. . . . . . . . . . 1.5 0.7 7.0 15.0 10.0 15.7 9.0 0.5 12.0$10,000 to $24,999 . . . . . . . . . 3.9 1.1 16.0 7.0 4.0 11.0 5.1 0.5 20.0$25,000 to $49,999 . . . . . . . . . 14.1 2.3 13.0 15.0 5.0 25.0 10.0 0.5 20.0$50,000 to $99,999 . . . . . . . . . 47.0 5.6 12.0 22.0 8.0 20.0 25.0 1.0 32.0$100,000 and more . . . . . . . . . 184.0 25.5 28.0 30.0 40.0 51.0 66.0 1.2 95.0
1 Includes other types of financial assets, not shown separately. 2 Checking, savings, and money market accounts.3 Excludes money market mutual funds, individual retirement accounts (IRA’s), Keogh accounts, and any type of pension planinvested in mutual funds. 4 Covers only those stocks and bonds that are directly held by families outside mutual funds, IRA’s,Keogh or pension accounts. 5 Covers IRA’s, Keogh accounts, and employer-provided pension plans from which withdrawals canbe made, such as 401(k) plans. 6 Includes trusts, annuities, managed investment accounts, and other such assets. 7 Of allfamilies. 8 Median value of financial asset for families holding such assets.
No. 774. Financial Debt Held by Families, by Type of Debt: 1989 and 1992[See headnote, table 773]
AGE OF FAMILY HEADAND FAMILY INCOME Total
Mortgageand homeequity
Installment Creditcards
Other linesof credit
Investmentreal estate Other debt 1
PERCENT OF FAMILIESHOLDING DEBTS
1989, total . . . . . . . . . . . . . 73.0 40.0 50.1 40.4 3.2 7.3 6.71992, total . . . . . . . . . . . . . 73.3 38.7 45.8 43.4 2.5 8.3 8.7
Under 35 years old . . . . . . . . . 82.1 30.6 62.1 52.6 2.9 4.8 6.535 to 44 years old . . . . . . . . . . 86.5 55.5 58.2 50.3 3.3 9.3 12.645 to 54 years old . . . . . . . . . . 85.8 61.8 48.6 48.4 2.8 14.5 10.355 to 64 years old . . . . . . . . . . 69.2 40.0 38.0 36.7 2.3 13.8 10.865 to 74 years old . . . . . . . . . . 51.9 18.3 22.9 30.2 1.1 5.4 5.475 years old and over . . . . . . . 30.2 6.7 8.0 19.5 (B) 0.7 4.5Less than $10,000. . . . . . . . . . 47.5 9.6 29.8 23.7 (B) 0.6 5.2$10,000 to $24,999 . . . . . . . . . 69.5 21.8 46.8 43.2 1.5 3.5 6.4$25,000 to $49,999 . . . . . . . . . 82.5 47.4 54.6 54.8 2.9 7.3 10.7$50,000 to $99,999 . . . . . . . . . 84.6 66.1 50.2 49.0 4.3 13.5 10.1$100,000 and more . . . . . . . . . 85.0 67.6 35.3 32.9 4.2 34.6 14.9
MEDIAN DEBT 2
1989, total . . . . . . . . . . . . . 17.6 38.0 5.9 1.1 2.2 35.7 2.21992, total . . . . . . . . . . . . . 17.6 44.0 4.5 1.0 2.2 28.0 2.5
Under 35 years old . . . . . . . . . 10.2 52.0 4.6 0.9 1.6 18.0 1.235 to 44 years old . . . . . . . . . . 33.3 54.0 5.0 1.3 1.8 28.0 3.045 to 54 years old . . . . . . . . . . 30.9 42.0 5.0 1.7 5.0 49.5 3.055 to 64 years old . . . . . . . . . . 20.8 28.0 3.9 1.0 4.0 34.7 3.065 to 74 years old . . . . . . . . . . 5.6 17.0 4.2 0.7 4.0 17.0 2.075 years old and over . . . . . . . 2.3 15.0 3.1 0.6 (B) 104.0 1.1Less than $10,000. . . . . . . . . . 2.0 16.0 1.6 0.6 (B) 6.5 0.7$10,000 to $24,999 . . . . . . . . . 5.6 17.4 2.7 0.8 3.0 6.1 1.0$25,000 to $49,999 . . . . . . . . . 21.1 40.0 5.6 1.3 1.5 18.0 2.0$50,000 to $99,999 . . . . . . . . . 57.2 58.0 7.8 1.5 2.0 41.0 3.0$100,000 and more . . . . . . . . . 131.0 103.0 10.8 3.9 18.0 75.0 6.0
B Base figure too small. 1 Includes loans on insurance policies, loans against pension accounts, and other unclassifiedloans. 2 Median amount of financial debt for families holding such debts.
Source of tables 773 and 774: Board of Governors of the Federal Reserve System, Federal Reserve Bulletin, October 1994.
Financial Assets and Debt Held by Families 509
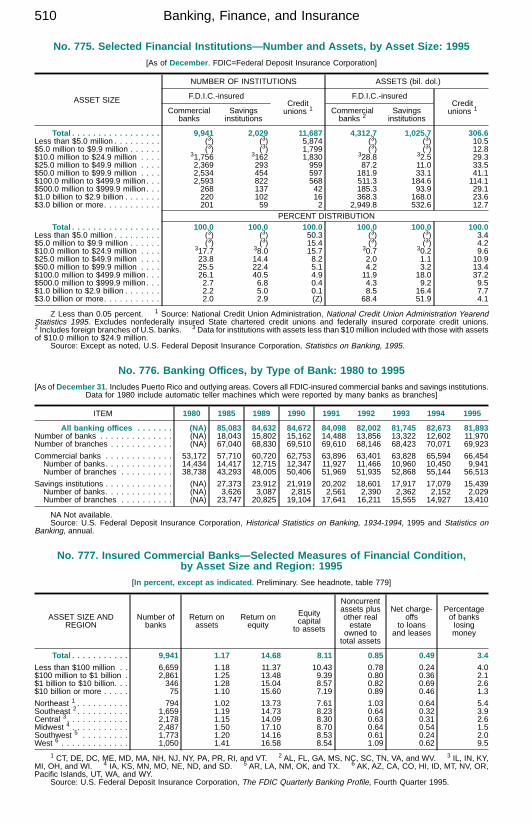
No. 775. Selected Financial Institutions—Number and Assets, by Asset Size: 1995[As of December . FDIC=Federal Deposit Insurance Corporation]
ASSET SIZE
NUMBER OF INSTITUTIONS ASSETS (bil. dol.)
F.D.I.C.-insuredCreditunions 1
F.D.I.C.-insuredCreditunions 1Commercial
banksSavingsinstitutions
Commercialbanks 2
Savingsinstitutions
Total . . . . . . . . . . . . . . . . . 9,941 2,029 11,687 4,312.7 1,025.7 306.6Less than $5.0 million . . . . . . . . . (3) (3) 5,874 (3) (3) 10.5$5.0 million to $9.9 million . . . . . . (3) (3) 1,799 (3) (3) 12.8$10.0 million to $24.9 million . . . . 31,756 3162 1,830 328.8 32.5 29.3$25.0 million to $49.9 million . . . . 2,369 293 959 87.2 11.0 33.5$50.0 million to $99.9 million . . . . 2,534 454 597 181.9 33.1 41.1$100.0 million to $499.9 million . . . 2,593 822 568 511.3 184.6 114.1$500.0 million to $999.9 million . . . 268 137 42 185.3 93.9 29.1$1.0 billion to $2.9 billion . . . . . . . 220 102 16 368.3 168.0 23.6$3.0 billion or more. . . . . . . . . . . 201 59 2 2,949.8 532.6 12.7
PERCENT DISTRIBUTIONTotal . . . . . . . . . . . . . . . . . 100.0 100.0 100.0 100.0 100.0 100.0
Less than $5.0 million . . . . . . . . . (3) (3) 50.3 (3) (3) 3.4$5.0 million to $9.9 million . . . . . . (3) (3) 15.4 (3) (3) 4.2$10.0 million to $24.9 million . . . . 317.7 38.0 15.7 30.7 30.2 9.6$25.0 million to $49.9 million . . . . 23.8 14.4 8.2 2.0 1.1 10.9$50.0 million to $99.9 million . . . . 25.5 22.4 5.1 4.2 3.2 13.4$100.0 million to $499.9 million . . . 26.1 40.5 4.9 11.9 18.0 37.2$500.0 million to $999.9 million . . . 2.7 6.8 0.4 4.3 9.2 9.5$1.0 billion to $2.9 billion . . . . . . . 2.2 5.0 0.1 8.5 16.4 7.7$3.0 billion or more. . . . . . . . . . . 2.0 2.9 (Z) 68.4 51.9 4.1
Z Less than 0.05 percent. 1 Source: National Credit Union Administration, National Credit Union Administration YearendStatistics 1995. Excludes nonfederally insured State chartered credit unions and federally insured corporate credit unions.2 Includes foreign branches of U.S. banks. 3 Data for institutions with assets less than $10 million included with those with assetsof $10.0 million to $24.9 million.
Source: Except as noted, U.S. Federal Deposit Insurance Corporation, Statistics on Banking, 1995.
No. 776. Banking Offices, by Type of Bank: 1980 to 1995[As of December 31 . Includes Puerto Rico and outlying areas. Covers all FDIC-insured commercial banks and savings institutions.
Data for 1980 include automatic teller machines which were reported by many banks as branches]
ITEM 1980 1985 1989 1990 1991 1992 1993 1994 1995
All banking offices . . . . . . . (NA) 85,083 84,632 84,672 84,098 82,002 81,745 82,673 81,893Number of banks . . . . . . . . . . . . . . (NA) 18,043 15,802 15,162 14,488 13,856 13,322 12,602 11,970Number of branches . . . . . . . . . . . . (NA) 67,040 68,830 69,510 69,610 68,146 68,423 70,071 69,923
Commercial banks . . . . . . . . . . . . . 53,172 57,710 60,720 62,753 63,896 63,401 63,828 65,594 66,454Number of banks. . . . . . . . . . . . . 14,434 14,417 12,715 12,347 11,927 11,466 10,960 10,450 9,941Number of branches . . . . . . . . . . 38,738 43,293 48,005 50,406 51,969 51,935 52,868 55,144 56,513
Savings institutions . . . . . . . . . . . . . (NA) 27,373 23,912 21,919 20,202 18,601 17,917 17,079 15,439Number of banks. . . . . . . . . . . . . (NA) 3,626 3,087 2,815 2,561 2,390 2,362 2,152 2,029Number of branches . . . . . . . . . . (NA) 23,747 20,825 19,104 17,641 16,211 15,555 14,927 13,410
NA Not available.Source: U.S. Federal Deposit Insurance Corporation, Historical Statistics on Banking, 1934-1994, 1995 and Statistics on
Banking, annual.
No. 777. Insured Commercial Banks—Selected Measures of Financial Condition,by Asset Size and Region: 1995
[In percent, except as indicated . Preliminary. See headnote, table 779]
ASSET SIZE ANDREGION
Number ofbanks
Return onassets
Return onequity
Equitycapital
to assets
Noncurrentassets plusother realestate
owned tototal assets
Net charge-offs
to loansand leases
Percentageof bankslosingmoney
Total . . . . . . . . . . . 9,941 1.17 14.68 8.11 0.85 0.49 3.4
Less than $100 million . . 6,659 1.18 11.37 10.43 0.78 0.24 4.0$100 million to $1 billion . 2,861 1.25 13.48 9.39 0.80 0.36 2.1$1 billion to $10 billion. . . 346 1.28 15.04 8.57 0.82 0.69 2.6$10 billion or more . . . . . 75 1.10 15.60 7.19 0.89 0.46 1.3
Northeast 1 . . . . . . . . . . 794 1.02 13.73 7.61 1.03 0.64 5.4Southeast 2 . . . . . . . . . . 1,659 1.19 14.73 8.23 0.64 0.32 3.9Central 3. . . . . . . . . . . . 2,178 1.15 14.09 8.30 0.63 0.31 2.6Midwest 4 . . . . . . . . . . . 2,487 1.50 17.10 8.70 0.64 0.54 1.5Southwest 5 . . . . . . . . . 1,773 1.20 14.16 8.53 0.61 0.24 2.0West 6 . . . . . . . . . . . . . 1,050 1.41 16.58 8.54 1.09 0.62 9.5
1 CT, DE, DC, ME, MD, MA, NH, NJ, NY, PA, PR, RI, and VT. 2 AL, FL, GA, MS, NC, SC, TN, VA, and WV. 3 IL, IN, KY,MI, OH, and WI. 4 IA, KS, MN, MO, NE, ND, and SD. 5 AR, LA, NM, OK, and TX. 6 AK, AZ, CA, CO, HI, ID, MT, NV, OR,Pacific Islands, UT, WA, and WY.
Source: U.S. Federal Deposit Insurance Corporation, The FDIC Quarterly Banking Profile, Fourth Quarter 1995.
Banking, Finance, and Insurance510

No. 778. Insured Commercial Banks—Assets and Liabilities: 1980 to 1995
[In billions of dollars, except as indicated . As of Dec. 31. Includes outlying areas. Except as noted, includes foreignbranches of U.S. banks. See Historical Statistics, Colonial Times to 1970, series X 588-609, for related data]
ITEM 1980 1985 1989 1990 1991 1992 1993 1994 1995 1
Number of banks reporting . . . . . . . . 14,435 14,417 12,713 12,343 11,921 11,462 10,958 10,450 9,941
Assets, total . . . . . . . . . . . . . . 1,856 2,731 3,299 3,389 3,431 3,506 3,706 4,011 4,313Net loans and leases. . . . . . . . . . . . 1,006 1,608 2,004 2,055 1,998 1,977 2,097 2,306 2,550Real estate loans . . . . . . . . . . . . 269 438 762 830 851 868 923 998 1,080Home equity lines of credit 2 . . . (NA) (NA) 51 61 70 73 73 76 79
Commercial and industrial loans. . . 391 578 618 615 559 536 539 589 662Loans to individuals . . . . . . . . . . . 187 309 401 404 392 385 419 487 535Farm loans. . . . . . . . . . . . . . . . . 32 36 31 33 35 35 37 39 40Other loans and leases. . . . . . . . . 158 288 261 242 227 216 239 251 292Less: Reserve for losses. . . . . . . . 10 23 54 56 55 54 53 52 53Less: Unearned income . . . . . . . . 21 18 15 14 11 9 7 6 6
Investment securities . . . . . . . . . . . . 325 439 559 605 691 773 837 823 811Other . . . . . . . . . . . . . . . . . . . . . . 524 684 736 730 742 755 773 882 952
Domestic office assets . . . . . . . . . . . 1,533 2,326 2,897 2,999 3,033 3,110 3,258 3,484 3,727Foreign office assets . . . . . . . . . . . . 323 406 402 390 398 396 448 527 585
Liabilities and capital, total . . . . . 1,856 2,731 3,299 3,389 3,431 3,506 3,706 4,011 4,313Noninterest-bearing deposits 3. . . . . . 432 471 483 489 480 541 572 572 612Interest-bearing deposits 4 . . . . . . . . 1,049 1,646 2,065 2,162 2,207 2,158 2,182 2,302 2,416Subordinated debt. . . . . . . . . . . . . . 7 15 19 24 25 34 37 41 44Other liabilities . . . . . . . . . . . . . . . . 260 429 526 496 486 510 618 783 892Equity capital . . . . . . . . . . . . . . . . . 108 169 205 219 232 263 297 312 350
Domestic office deposits. . . . . . . . . . 1,187 1,796 2,237 2,357 2,383 2,412 2,424 2,442 2,573Foreign office deposits . . . . . . . . . . . 294 322 312 293 305 287 330 432 454
NA Not available. 1 Preliminary. 2 For one- to four-family residential properties. 3 Prior to 1985, demand deposits.4 Prior to 1985, time and savings deposits.
Source: U.S. Federal Deposit Insurance Corporation, The FDIC Quarterly Banking Profile, Annual Report, and Statistics onBanking, annual.
No. 779. Insured Commercial Banks—Income and Selected Measures of FinancialCondition: 1980 to 1995
[In billions of dollars, except as indicated . Includes outlying areas. Includes foreign branches of U.S. banks.See Historical Statistics, Colonial Times to 1970, series X 588-609, for related data]
ITEM 1980 1985 1989 1990 1991 1992 1993 1994 1995 1
Interest income. . . . . . . . . . . . . . . . 177.4 248.2 317.3 320.4 289.2 255.2 245.1 257.8 302.7Interest expense . . . . . . . . . . . . . . . 120.1 157.3 205.1 204.9 167.3 121.8 105.7 111.3 148.4Net interest income . . . . . . . . . . . 57.3 90.9 112.2 115.5 121.9 133.4 139.3 146.6 154.2
Provisions for loan losses. . . . . . . . . 4.5 17.8 31.0 32.1 34.3 26.0 16.8 10.9 12.5Noninterest income . . . . . . . . . . . . . 13.3 31.1 50.9 54.9 59.7 65.6 75.0 76.3 82.4Noninterest expense . . . . . . . . . . . . 46.7 82.4 108.1 115.7 124.8 130.9 139.7 144.2 149.7Income taxes . . . . . . . . . . . . . . . . . 5.0 5.6 9.5 7.7 8.3 14.5 19.8 22.4 26.2Securities gain/loss, net . . . . . . . . . . -0.5 1.6 0.8 0.5 3.0 4.0 3.1 -0.6 0.5Extraordinary gains, net . . . . . . . . . . - 0.2 0.3 0.6 0.7 0.4 2.1 - -Net income. . . . . . . . . . . . . . . . . 14.0 18.0 15.6 16.0 17.9 32.0 43.1 44.6 48.8
RATIOS OF CONDITION
Return on assets 2 (percent) . . . . . . . 0.80 0.70 0.49 0.48 0.53 0.93 1.20 1.15 1.17Return on equity 3 (percent) . . . . . . . 13.66 11.31 7.71 7.45 7.94 12.98 15.34 14.61 14.68Equity capital to assets (percent) . . . . 5.80 6.20 6.21 6.45 6.75 7.51 8.00 7.78 8.11Noncurrent assets plus other realestate owned to assets 4 (percent) . . (NA) 1.87 2.30 2.94 3.02 2.54 1.61 1.01 0.85
Net charge-offs 5 . . . . . . . . . . . . . . 3.6 13.6 22.9 29.7 32.9 25.6 17.5 11.2 12.2Net charge-offs to loans and leases(percent) . . . . . . . . . . . . . . . . . . . 0.36 0.84 1.16 1.43 1.59 1.27 0.85 0.50 0.49Net interest margin 6 (percent) . . . . . 3.66 4.09 4.02 3.94 4.11 4.41 4.40 4.36 4.29
Percentage of banks losing money. . . 3.7 17.1 12.5 13.4 11.6 6.9 4.9 3.8 3.4
- Represents or rounds to zero. NA Not available. 1 Preliminary. 2 Net income (including securities transactions andnonrecurring items) as a percentage of average total assets. 3 Net income as a percentage of average total equity capital.4 The sum of loans, leases, debt securities and other assets that are 90 days or more past due, or in nonaccrual status plusforeclosed property. 5 Total loans and leases charged off (removed from balance sheet because of uncollectibility), less amountsrecovered on loans and leases previously charged off. 6 Interest income less interest expense as a percentage of averageearning assets (i.e. the profit margin a bank earns on its loans and investments).
Source: U.S. Federal Deposit Insurance Corporation, Annual Report; Statistics on Banking, annual; and FDIC QuarterlyBanking Profile.
Insured Commercial Banks 511

No. 780. Insured Commercial Banks, by State and Other Area: 1995[In billions of dollars, except number of banks . As of December 31 . Includes foreign branches of U.S. banks]
STATE Number Assets Deposits
Total . . . . . . . . . . 9,941 4,312.7 3,027.6United States . . . . . 9,920 4,282.8 3,005.9
Northeast . . . . . . . . . . . . . 633 1,409.5 907.1New England . . . . . . . . . 161 193.9 136.4Maine . . . . . . . . . . . . 20 9.0 6.7New Hampshire . . . . . . 23 10.1 7.6Vermont . . . . . . . . . . . 20 6.0 5.1Massachusetts . . . . . . 51 117.9 82.3Rhode Island. . . . . . . . 8 17.0 10.6Connecticut. . . . . . . . . 39 34.0 24.0
Middle Atlantic . . . . . . . 472 1,215.5 770.7New York . . . . . . . . . . 166 922.8 547.3New Jersey. . . . . . . . . 82 104.3 84.7Pennsylvania. . . . . . . . 224 188.4 138.7
Midwest . . . . . . . . . . . . . . 4,389 933.1 686.9East North Central . . . . . 1,902 645.6 471.8Ohio . . . . . . . . . . . . . 260 157.8 109.2Indiana. . . . . . . . . . . . 211 68.8 53.6Illinois . . . . . . . . . . . . 864 238.7 173.3Michigan . . . . . . . . . . 180 118.9 87.9Wisconsin. . . . . . . . . . 387 61.4 47.8
West North Central . . . . 2,487 287.5 215.1Minnesota. . . . . . . . . . 525 70.2 49.5Iowa . . . . . . . . . . . . . 491 42.0 33.5Missouri . . . . . . . . . . . 459 80.5 64.1North Dakota. . . . . . . . 127 8.0 6.9South Dakota . . . . . . . 116 28.6 11.9Nebraska . . . . . . . . . . 336 26.7 22.6Kansas . . . . . . . . . . . 433 31.4 26.6
South . . . . . . . . . . . . . . . . 3,784 1,286.0 922.2South Atlantic . . . . . . . . 1,267 774.7 521.1Delaware . . . . . . . . . . 40 108.4 39.6Maryland . . . . . . . . . . 91 68.9 53.8District of Columbia . . . 13 9.8 7.7Virginia. . . . . . . . . . . . 157 77.8 56.4West Virginia. . . . . . . . 118 21.3 17.1
STATE Number Assets Deposits
North Carolina . . . . . . . 61 180.5 110.8South Carolina . . . . . . 71 24.6 19.7Georgia . . . . . . . . . . . 383 132.7 90.9Florida . . . . . . . . . . . . 333 150.8 125.0
East South Central . . . . . 812 199.6 154.7Kentucky . . . . . . . . . . 276 49.6 37.9Tennessee . . . . . . . . . 240 66.6 52.4Alabama. . . . . . . . . . . 186 56.3 42.1Mississippi . . . . . . . . . 110 27.1 22.3
West South Central . . . . 1,705 311.7 246.4Arkansas . . . . . . . . . . 243 29.2 25.3Louisiana . . . . . . . . . . 185 45.2 37.1Oklahoma. . . . . . . . . . 342 34.5 28.8Texas. . . . . . . . . . . . . 935 202.7 155.3
West . . . . . . . . . . . . . . . . 1,114 654.2 489.7Mountain . . . . . . . . . . . . 578 179.2 124.0Montana. . . . . . . . . . . 104 8.2 7.0Idaho . . . . . . . . . . . . . 18 12.9 9.4Wyoming . . . . . . . . . . 53 8.3 6.3Colorado . . . . . . . . . . 231 37.4 31.2New Mexico . . . . . . . . 68 14.8 11.5Arizona . . . . . . . . . . . 34 51.4 34.1Utah . . . . . . . . . . . . . 45 19.9 13.8Nevada . . . . . . . . . . . 25 26.3 10.6
Pacific . . . . . . . . . . . . . 536 475.0 365.7Washington. . . . . . . . . 87 49.2 37.9Oregon . . . . . . . . . . . 43 30.4 22.9California . . . . . . . . . . 383 368.2 286.4Alaska . . . . . . . . . . . . 8 5.5 4.1Hawaii . . . . . . . . . . . . 15 21.7 14.4
American Samoa . . . 1 0.1 (Z)Puerto Rico . . . . . . . 15 29.0 20.8Guam . . . . . . . . . . . 2 0.7 0.7Pacific Islands . . . . . 1 0.1 (Z)Virgin Islands . . . . . . 2 0.1 0.1
Z Less than $50 million.
Source: U.S. Federal Deposit Insurance Corporation, Statistics on Banking, annual.
No. 781. U.S. Banking Offices of Foreign Banks—Summary: 1980 to 1994
[In billions of dollars, except as indicated . As of December, except as indicated. Covers agencies, branches,subsidiary commercial banks, and New York State investment companies]
YEAR Assets
LOANS
Deposits COUNTRY
NUMBER OF—
Assets
Loans,com-mercialandindus-trial
DepositsTotal Busi-
ness
BankswithU.S.offices
U.S.offices
1980 . . . . . . . . 200.6 121.4 59.6 80.4 1994 2
1985 . . . . . . . . 440.8 247.4 108.8 236.7 Japan . . . . . . . . 52 142 392.6 101.1 223.71990 . . . . . . . . 791.1 397.9 193.3 383.9 Canada. . . . . . . 6 42 61.0 17.6 32.91991 . . . . . . . . 860.7 412.3 206.4 444.5 Switzerland . . . . 6 15 44.6 14.0 19.71992 . . . . . . . . 869.0 407.5 208.7 464.3 France . . . . . . . 12 32 88.7 12.9 41.81993 . . . . . . . . 855.6 383.3 196.5 468.7 Netherlands . . . . 3 22 48.8 12.4 28.91994 . . . . . . . . 916.0 394.4 212.1 493.7 United Kingdom . 9 32 61.9 10.1 38.2
Share: 1 1980 . . 11.9 13.4 18.2 6.6 Italy . . . . . . . . . 12 24 35.6 5.1 15.31985 . . 16.1 15.4 22.5 12.1 Hong Kong . . . . 10 33 22.9 4.5 15.71990 . . 21.4 18.0 30.8 14.5 Germany. . . . . . 12 21 36.1 4.0 26.11994 . . 21.3 16.2 33.6 17.3 Korea, South . . . 8 30 12.1 3.8 2.3
1 Percent of ‘‘domestically owned’’ commercial banks plus U.S. offices of foreign banks. 2 As of June 30. Source: AmericanBanker-Bond Buyer, New York, NY, American Banker Ranking The Banks, annual (copyright).
Source: Except as noted, Board of Governors of the Federal Reserve System, unpublished data.
Banking, Finance, and Insurance512

No. 782. Foreign Lending by U.S. Banks, by Type of Borrower and Country: 1995[In millions of dollars . As of December . Covers 137 U.S. banking organizations which do nearly all of the foreign lending in thecountry. Data represent claims on foreign residents and institutions held at all domestic and foreign offices of covered banks. Datacover only cross-border and nonlocal currency lending. These result from a U.S. bank’s office in one country lending to residentsof another country or lending in a currency other than that of the borrower’s country. Excludes local currency loans and other claimsand local currency liabilities held by banks’ foreign offices on residents of the country in which the office was located (e.g. Deutschemark loans to German residents booked at the German branch of the reporting U.S. bank). Criteria for country selection is $3 billionor more]
COUNTRY Total Bank PublicPrivatenon-bank
Total 1 . . . . . . . . . 254,534 87,174 60,916 106,465Argentina . . . . . . . . . 11,311 1,506 2,770 7,035Australia. . . . . . . . . . 3,479 834 529 2,117Belgium-Luxembourg . 7,563 3,660 1,244 2,659Brazil. . . . . . . . . . . . 14,802 2,996 5,803 6,004Canada . . . . . . . . . . 7,466 1,701 1,240 4,527Cayman Islands. . . . . 10,108 7,396 121 2,591Chile . . . . . . . . . . . . 4,307 693 1,343 2,270Colombia . . . . . . . . . 3,173 683 1,207 1,283France. . . . . . . . . . . 9,765 5,712 1,886 2,167Germany . . . . . . . . . 8,060 2,477 4,261 1,323Hong Kong . . . . . . . . 7,433 2,904 60 4,469
COUNTRY Total Bank PublicPrivatenon-bank
Italy. . . . . . . . . . . . . 6,165 1,323 3,733 1,109Japan . . . . . . . . . . . 18,495 9,313 2,374 6,809Korea, South . . . . . . 8,120 4,877 218 3,025Mexico. . . . . . . . . . . 18,374 2,049 9,849 6,478Netherlands . . . . . . . 6,061 1,822 1,869 2,371Philippines . . . . . . . . 3,018 685 1,607 727Singapore . . . . . . . . 6,426 3,117 117 3,192Spain . . . . . . . . . . . 4,993 1,237 2,958 798Switzerland. . . . . . . . 4,141 1,082 153 2,905Thailand. . . . . . . . . . 4,312 1,460 52 2,801United Kingdom. . . . . 32,303 14,316 802 17,185Venezuela . . . . . . . . 3,121 59 2,007 1,056
1 Includes other countries, not shown separately.
Source: Board of Governors of the Federal Reserve System, Federal Financial Institutions Examination Council, statisticalrelease.
No. 783. Federal and State-Chartered Credit Unions—Summary: 1980 to 1995
[Except as noted, as of December 31 . Federal data include District of Columbia, Puerto Rico, Canal Zone, Guam, and VirginIslands. Excludes State-insured, privately-insured, and noninsured State-chartered credit unions and corporate central creditunions which have mainly other credit unions as members. See also Historical Statistics, Colonial Times to 1970, series X 864-878]
YEAROPERATING
CREDIT UNIONSNumberof failedinstitu-tions 1
MEMBERS(1,000)
ASSETS(mil. dol.)
LOANSOUTSTANDING
(mil. dol.)
SAVINGS(mil. dol.)
Federal State Federal State Federal State Federal State Federal State
1980 . . . 12,440 4,910 239 24,519 12,338 40,092 20,870 26,350 14,582 36,263 18,4691985 . . . 10,125 4,920 94 29,579 15,689 78,188 41,525 48,241 26,168 71,616 37,9171990 . . . 8,511 4,349 164 36,241 19,454 130,073 68,133 83,029 44,102 117,892 62,0821991 . . . 8,229 4,731 130 37,081 21,619 143,940 83,133 84,150 49,268 130,164 75,6261992 . . . 7,908 4,686 114 38,124 23,238 162,066 96,312 87,350 52,192 145,637 87,3711993 . . . 7,696 4,621 37 39,756 23,997 172,854 104,316 94,640 57,695 153,506 93,4821994 . . . 7,498 4,493 33 40,837 24,295 182,529 106,937 110,090 65,769 160,226 94,7971995 . . . 7,329 4,358 26 42,163 24,927 193,781 112,860 120,514 71,606 170,300 99,838
1 For year ending September 30, except 1995 reflects 15-month period from October 1994 through December 1995. A failedinstitution is defined as a credit union which has ceased operation because it was involuntarily liquidated or merged with assistancefrom the National Credit Union Share Insurance Fund. Assisted mergers were not identified until 1981.
Source: National Credit Union Administration, Annual Report of the National Credit Union Administration, and unpublisheddata.
No. 784. Insured Savings Institutions—Financial Summary: 1990 to 1995
[In billions of dollars, except number of institutions . As of December 31 . Includes Puerto Rico, Guam, and Virgin Islands.Covers SAIF (Savings Association Insurance Fund)- and BIF (Bank Insurance Fund)-insured savings institutions. Minus sign (-)indicates debt or loss]
ITEMINSURED SAVINGS INSTITUTIONS 1 RTC
CONSERVATORSHIPS 3
1990 1991 1992 1993 1994 1995 2 1991 1992 1993 1994
Number of institutions . . . . . . 2,816 2,561 2,390 2,262 2,152 2,029 91 81 63 2Assets, total . . . . . . . . . . . . 1,267 1,119 1,030 1,001 1,009 1,026 44 37 22 2Loans and leases, net . . . . 816 727 648 626 635 648 24 17 10 1
Liabilities, total . . . . . . . . . . . 1,200 1,051 956 923 929 940 48 42 27 2Deposits . . . . . . . . . . . . . 987 907 828 774 737 742 37 31 18 1
Equity capital. . . . . . . . . . . . 68 69 74 78 80 86 -4 -4 -5 (Z)
Interest and fee income. . . . . 117 98 78 66 63 71 3 1 1 (Z)Interest expense . . . . . . . . . 91 70 46 35 33 43 3 1 1 (Z)Net interest income. . . . . . . . 26 28 32 32 30 28 (Z) (Z) (Z) (Z)Net income . . . . . . . . . . . . . -5 1 7 7 6 8 -2 -3 -2 -2
Z Less than $500 million. 1 Excludes institutions in RTC conservatorship and, beginning 1992, excludes one self-liquidatinginstitution. 2 Preliminary. 3 RTC=Resolution Trust Corporation. These savings institutions are members of the SavingsAssociation Insurance Fund. As of December 31, 1995 there were no institutions in RTC conservatorship.
Source: U.S. Federal Deposit Insurance Corporation, Statistics on Banking, annual and FDIC Quarterly Banking Profile.
Foreign Lending—Credit Unions—Savings Institutions 513

No. 785. Volume of Long-Term Mortgage Loans Originated, by Type of Property,1980 to 1994, and by Lender, 1994
[In billions of dollars . Covers credit extended in primary mortgage markets for financing real estate acquisitions]
TYPE OF PROPERTY 1980 1985 1989 1990 1991 1992 1993
1994, BY LENDER
Total 1Com-mercialbanks
Mort-gagecom-panies
Sav-ingsandloan
Lifeinsur-ancecompa-nies
Loans, total . . . . 197.2 430.0 642.3 710.5 793.3 1,124.0 1,241.7 1,019.2 391.3 408.1 133.3 27.51-4 unit family home . . 133.8 289.8 452.9 458.4 562.1 893.7 1,019.9 768.7 200.0 408.1 123.1 0.7New units . . . . . . . 49.1 59.0 90.4 110.7 120.0 132.4 117.3 114.6 43.2 54.5 14.1 0.2Existing units . . . . . 84.6 230.8 362.5 347.7 442.1 761.3 902.5 654.2 156.8 353.7 109.0 0.5
Multifamily residential . 12.5 31.9 31.1 32.6 25.5 25.7 31.7 32.7 20.9 - 5.8 1.3New units . . . . . . . 8.6 10.6 8.3 6.5 6.1 4.9 4.4 4.5 2.4 - 0.2 0.4Existing units . . . . . 3.9 21.3 22.8 26.0 19.4 20.9 27.3 28.2 18.6 - 5.6 0.8
Nonresidential . . . . . . 35.9 99.4 150.0 209.5 194.6 184.4 172.5 190.0 153.1 - 4.4 24.8Farm properties . . . . . 15.0 9.0 8.3 10.0 11.1 20.2 17.6 27.8 17.3 - - 0.7
- Represents zero. 1 Includes other lenders not shown separately.
Source: U.S. Dept. of Housing and Urban Development, monthly and quarterly press releases based on the Survey ofMortgage Lending Activity.
No. 786. Mortgage Debt Outstanding, by Type of Property and Holder: 1980 to 1995
[In billions of dollars . As of Dec. 31. Includes Puerto Rico and Guam. See also Historical Statistics,Colonial Times to 1970, series N 273 and N 276]
TYPE OF PROPERTY AND HOLDER 1980 1985 1987 1988 1989 1990 1991 1992 1993 1994 1995
Mortgage debt, total . . . . . . . . . . . 1,463 2,334 2,985 3,280 3,582 3,804 3,962 4,093 4,269 4,475 4,724Residential nonfarm . . . . . . . . . . . . . . . . . 1,110 1,741 2,237 2,495 2,748 2,966 3,134 3,312 3,498 3,707 3,929One- to four-family homes. . . . . . . . . . . . 969 1,536 1,976 2,217 2,459 2,676 2,850 3,037 3,228 3,432 3,640Savings institutions. . . . . . . . . . . . . . . 487 554 602 672 669 600 538 490 470 477 488Mortgage pools or trusts 1 . . . . . . . . . . 125 407 682 758 887 1,046 1,222 1,389 1,507 1,642 1,754Government National Mortgage Assoc. 92 207 310 331 358 392 416 411 405 441 461Federal Home Loan Mortgage Corp . . 13 100 206 220 266 308 352 402 441 483 515
Commercial banks . . . . . . . . . . . . . . . 160 213 276 334 390 456 484 508 557 612 665Individuals and others 2. . . . . . . . . . . . 117 239 284 316 370 408 431 448 456 461 498Federal and related agencies . . . . . . . . 61 110 120 126 131 153 163 192 229 232 226Federal National Mortgage Assoc . . . 52 92 85 88 91 94 100 124 151 162 168
Life insurance companies . . . . . . . . . . 18 12 13 11 12 13 12 11 9 8 8Five or more units . . . . . . . . . . . . . . . . . 141 205 261 278 288 290 284 274 271 275 289
Commercial . . . . . . . . . . . . . . . . . . . . . . . 255 487 660 702 754 759 748 701 689 685 710Farm . . . . . . . . . . . . . . . . . . . . . . . . . . . 97 106 88 83 80 79 79 81 81 83 84
TYPE OF HOLDER
Savings institutions . . . . . . . . . . . . . . . . . . 603 760 860 925 910 802 705 628 598 596 603Commercial banks . . . . . . . . . . . . . . . . . . 263 429 592 674 767 845 876 895 940 1,004 1,080Life insurance companies. . . . . . . . . . . . . . 131 172 212 233 254 268 265 247 229 215 219Individuals and others 2 . . . . . . . . . . . . . . . 206 367 433 474 535 570 591 603 609 620 662
Mortgage pools or trusts 1 . . . . . . . . . . . . . 146 439 699 783 918 1,081 1,258 1,434 1,563 1,716 1,850Government National Mortgage Assoc. . . . 94 212 318 341 368 404 425 420 414 451 472Federal Home Loan Mortgage Corp . . . . . 17 100 213 226 273 316 359 408 446 486 518Federal National Mortgage Association . . . (X) 55 140 178 228 300 372 445 496 530 583Farmers Home Administration 3 . . . . . . . . 32 48 (Z) (Z) (Z) (Z) (Z) (Z) (Z) (Z) (Z)
Federal and related agencies . . . . . . . . . . . 115 167 189 192 198 239 266 286 329 323 310Federal National Mortgage Association . . . 57 98 92 95 99 105 112 138 167 178 184Farmers Home Administration 3 . . . . . . . . 3 1 43 42 41 41 42 42 41 42 42Federal Land Banks. . . . . . . . . . . . . . . . 38 47 34 32 30 29 29 29 28 29 28Federal Home Loan Mortgage Corp . . . . . 5 14 13 17 22 22 27 34 48 46 41Federal Housing and Veterans Admin . . . . 4 4 5 5 7 7 9 11 11 10 9Government National Mortgage Assoc. . . . 5 1 (Z) (Z) (Z) (Z) (Z) (Z) (Z) (Z) (Z)Federal Deposit Insurance Corp. . . . . . . . (X) (X) (X) (X) (X) (X) (X) (X) 14 8 4Resolution Trust Corporation . . . . . . . . . . (X) (X) (X) (X) (X) 33 46 32 17 10 2
X Not applicable. Z Less than $500 million. 1 Outstanding principal balances of mortgage pools backing securities insuredor guaranteed by the agency indicated. Includes other pools not shown separately. 2 Includes mortgage companies, real estateinvestment trusts, State and local retirement funds, noninsured pension funds, State and local credit agencies, credit unions, andfinance companies. 3 FmHA-guaranteed securities sold to the Federal Financing Bank were reallocated from FmHA mortgagepools to FmHA mortgage holdings in 1986 because of accounting changes by the Farmers Home Administration.
Source: Board of Governors of the Federal Reserve System, Federal Reserve Bulletin, monthly.
Banking, Finance, and Insurance514

No. 787. Characteristics of Conventional First Mortgage Loans for Purchase ofSingle-Family Homes: 1990 to 1995
[In percent, except as indicated . Annual averages. Covers fully amortized conventional mortgage loans used to purchase single-family nonfarm homes. Excludes refinancing loans, nonamortized and balloon loans, loans insured by the Federal Housing Admin-istration, and loans guaranteed by the Veterans Administration. Based on a sample of mortgage lenders, including savings and loansassociations, savings banks, commercial banks, and mortgage companies]
LOAN CHARACTERISTICSNEW HOMES PREVIOUSLY OCCUPIED HOMES
1990 1991 1992 1993 1994 1995 1990 1991 1992 1993 1994 1995
Contract interest rate, 1all loans . . . . . . . . . . . . . . . 9.7 9.0 8.0 7.0 7.3 7.7 9.8 9.1 7.8 6.9 7.3 7.7Fixed-rate loans . . . . . . . . . 10.1 9.3 8.3 7.3 7.9 8.0 10.1 9.4 8.2 7.3 8.0 8.0Adjustable-rate loans 2 . . . . 8.9 8.1 6.6 5.8 6.5 7.2 8.9 8.0 6.3 5.5 6.2 7.0
Initial fees, charges 3 . . . . . . . 1.98 1.72 1.59 1.29 1.29 1.20 1.74 1.54 1.58 1.19 1.07 0.93Effective interest rate, 4all loans . . . . . . . . . . . . . . . 10.1 9.3 8.2 7.2 7.5 7.9 10.1 9.3 8.1 7.1 7.5 7.8Fixed-rate loans . . . . . . . . . 10.4 9.6 8.5 7.5 8.1 8.2 10.4 9.7 8.5 7.5 8.2 8.2Adjustable-rate loans 2 . . . . 9.2 8.4 6.9 5.9 6.6 7.4 9.2 8.2 6.5 5.7 6.4 7.1
Term to maturity (years) . . . . . 27.3 26.8 25.6 26.1 27.5 27.7 27.0 26.5 25.4 25.4 27.1 27.4Purchase price ($1,000) . . . . . 154.1 155.2 158.1 163.7 170.7 175.4 140.3 145.8 144.1 139.6 136.4 137.3Loan to price ratio . . . . . . . . . 74.9 75.0 76.6 78.0 78.7 78.6 74.9 74.4 76.5 77.1 80.1 80.1Percent of number of loanswith adjustable rates. . . . . . . 31 25 17 18 41 37 27 22 21 20 39 31
1 Initial interest rate paid by the borrower as specified in the loan contract. 2 Loans with a contractual provision for periodicadjustments in the contract interest rate. 3 Includes all fees, commissions, discounts and ‘‘points’’ paid by the borrower, or seller,in order to obtain the loan. Excludes those charges for mortgage, credit, life or property insurance; for property transfer; and fortitle search and insurance. 4 Contract interest rate plus fees and charges amortized over a 10-year period.
Source: U.S. Federal Housing Finance Board, Rates & Terms on Conventional Home Mortgages, Annual Summary.
No. 788. Mortgage Delinquency and Foreclosure Rates: 1980 to 1995[In percent, except as indicated . Covers one- to four-family residential nonfarm mortgage loans]
ITEM 1980 1985 1989 1990 1991 1992 1993 1994 1995
Number of mortgage loans outstanding (1,000) 30,033 34,004 39,578 40,638 41,586 42,562 45,336 48,667 50,880Delinquency rates: 1
Total. . . . . . . . . . . . . . . . . . . . . . . . 5.0 5.8 4.8 4.7 5.0 4.6 4.2 4.1 4.1Conventional loans. . . . . . . . . . . . . . . . 3.1 4.0 3.1 3.0 3.3 2.9 2.7 2.6 2.8VA loans. . . . . . . . . . . . . . . . . . . . . . . 5.3 6.6 6.4 6.4 6.8 6.5 6.3 6.3 6.3FHA loans . . . . . . . . . . . . . . . . . . . . . 6.6 7.5 6.7 6.7 7.3 7.1 7.1 7.3 7.3
Foreclosure rates: 2Total. . . . . . . . . . . . . . . . . . . . . . . . 0.5 1.0 1.0 0.9 1.0 1.0 1.0 0.9 0.9
Conventional loans. . . . . . . . . . . . . . . . 0.2 0.7 0.6 0.7 0.8 0.8 0.8 0.7 0.7VA loans. . . . . . . . . . . . . . . . . . . . . . . 0.6 1.1 1.3 1.2 1.3 1.3 1.3 1.3 1.3FHA loans . . . . . . . . . . . . . . . . . . . . . 0.7 1.3 1.4 1.3 1.4 1.4 1.5 1.5 1.4
1 Number of loans delinquent 30 days or more as percentage of mortgage loans serviced in survey. Annual average ofquarterly figures. 2 Percentage of loans in the foreclosure process at yearend, not seasonally adjusted.
Source: Mortgage Bankers Association of America, Washington, DC, National Delinquency Survey, quarterly.
No. 789. Home Equity Lending—Percentage of Homeowners with Credit, Sources ofCredit, and Uses for Funds Borrowed: 1988 and 1993-94
[In percent . A ‘‘traditional home equity loan’’ is a closed-end loan extended for a specific period that generally requires repaymentof interest and principal in equal monthly installments. Such a loan typically has a fixed interest rate. A ‘‘home equity line of credit’’is a revolving account that permits borrowing from time to time, at the homeowner’s discretion, up to the amount of the credit line.It usually has a more flexible repayment schedule and a variable interest rate. Based on the Surveys of Consumers, a samplesurvey (2,527 households in 1993-94) conducted by the Survey Research Center of the University of Michigan]
ITEM
HOME EQUITYLINES OF CREDIT
TRADITIONALHOME
EQUITY LOANS USES FORFUNDS
BORROWED
1993-94 1
1988 1993-94 1988 1993-94
Homeequitylines ofcredit
Traditionalhomeequityloans
Percentage of homeowners Home improvement . . . . . 64 38with home equity credit . . 5.7 8.3 5.4 4.9 Repayment of other debts . 45 68
Education. . . . . . . . . . . . 21 4SOURCE OF HOMEEQUITY CREDIT Real estate. . . . . . . . . . . 12 8
Total . . . . . . . . . . . . . . 100 100 100 100 Auto or truck. . . . . . . . . . 30 3Commercial banks . . . . . . 54 60 33 29 Medical expenses . . . . . . 5 1Savings institutions 2 . . . . . 31 21 27 30 Business expenses . . . . . 28 1Credit unions . . . . . . . . . . 11 13 8 11 Vacation. . . . . . . . . . . . . 6 1Other creditors 3 . . . . . . . . 4 7 32 29 Other 4 . . . . . . . . . . . . . 1 3
1 Percentages sum to more than 100 because respondents were allowed to cite multiple uses for a single loan or drawdownand more than one draw for one line of credit. 2 Includes savings banks and savings and loan associations. 3 Includes financeand loan companies, brokerage firms, mortgage companies, and individuals. 4 Includes purchase of furniture or appliance,purchase of boat or other recreational vehicle, payment of taxes, and personal financial investments.
Source: Board of Governors of the Federal Reserve System, Federal Reserve Bulletin, July 1994.
Mortgage Loans and Delinquencies—Home Equity Lending 515

No. 790. Estimated Home Equity Debt Outstanding, by Type and Source of Credit:1988 to 1994
[In billions of dollars . See headnote, table 789]
YEAR Total
HOME EQUITYLINES OF CREDIT
TRADITIONAL HOMEEQUITY LOANS
Alllenders
Commercialbanks
Othersources
Alllenders
Commercialbanks
Othersources
1988 . . . . . . . . . . . . . . . . . 210-265 75 40 35 135-190 (NA) (NA)1989 . . . . . . . . . . . . . . . . . (NA) 90 51 39 (NA) (NA) (NA)1990 . . . . . . . . . . . . . . . . . 258 105 61 44 153 54 991991 . . . . . . . . . . . . . . . . . 262 114 70 44 148 53 951992 . . . . . . . . . . . . . . . . . 258 114 73 41 144 50 941993 . . . . . . . . . . . . . . . . . 255 110 73 37 145 49 961994 . . . . . . . . . . . . . . . . . (NA) (NA) 76 (NA) (NA) 54 (NA)
NA Not available.
Source: Board of Governors of the Federal Reserve System, Federal Reserve Bulletin, July 1994.
No. 791. Consumer Installment Credit Outstanding and Finance Rates: 1980 to 1995
[In billions of dollars, except percent . Estimated amounts of seasonally adjusted credit outstanding as of end of year;finance rates, annual averages. See also Historical Statistics, Colonial Times to 1970, series X 551-560]
TYPE OF CREDIT 1980 1985 1986 1987 1988 1989 1990 1991 1992 1993 1994 1995
Installment credit outstanding. . . 298.2 517.7 572.0 608.7 663.0 724.4 734.9 728.4 730.8 790.4 902.8 1,024.8Automobile paper . . . . . . . . . . . . . . 112.0 210.2 247.8 266.3 285.5 292.5 283.1 259.6 257.4 280.6 317.2 353.3Revolving 1 . . . . . . . . . . . . . . . . . . 55.1 121.8 135.8 153.1 174.3 198.5 223.5 245.3 258.1 286.6 334.5 395.2Other . . . . . . . . . . . . . . . . . . . . . . 131.1 185.7 188.4 189.3 203.2 233.3 228.3 223.5 215.3 223.2 251.1 276.2
FINANCE RATES (percent)
Commercial banks:New automobiles (48 months) 2 . . . 14.30 12.91 11.33 10.46 10.85 12.07 11.78 11.13 9.28 8.08 8.13 9.57Other consumer goods (24 months). 15.47 15.94 14.83 14.23 14.68 15.44 15.46 15.17 14.04 13.46 13.20 13.94Credit-card plans. . . . . . . . . . . . . 17.31 18.69 18.26 17.93 17.79 18.02 18.17 18.23 17.77 16.81 15.69 16.02
Finance companies:New automobiles. . . . . . . . . . . . . 14.82 11.98 9.44 10.73 12.60 12.62 12.54 12.41 9.93 9.47 9.80 11.19Used automobiles . . . . . . . . . . . . 19.10 17.59 15.95 14.61 15.11 16.18 15.99 15.59 13.80 12.78 13.51 14.47
1 Consists mainly of outstanding balances on credit card accounts, but also includes borrowing under check credit andoverdraft plans, and unsecured personal lines of credit. 2 For 1980, maturities were 36 months for new car loans.
Source: Board of Governors of the Federal Reserve System, Federal Reserve Bulletin, monthly; and Annual Statistical Digest.
No. 792. Usage of General Purpose Credit Cards by Families: 1989 and 1992
[General purpose credit cards include Mastercard, Visa, Optima, and Discover cards. All dollar figures are given in constant 1992dollars based on consumer price index data as published by U.S. Bureau of Labor Statistics. Families include one-person units;for definition of family, see text, section 1. Based on Survey of Consumer Finance; see Appendix III. For definition of median, seeGuide to Tabular Presentation]
AGE OF FAMILY HEAD ANDFAMILY INCOME
Percenthaving ageneralpurposecreditcard
Mediannumber ofcards
Mediannew
chargeson lastmonth’sbills
Percenthaving abalanceafter lastmonth’sbills
Medianbalance 1
PERCENT OF CARDHOLDINGFAMILIES WHO—
Almostalwayspay offthe
balance
Some-times payoff thebalance
Hardlyever payoff thebalance
1989, total . . . . . . . . . . . . . 56.4 2 $200 52.8 $1,100 52.0 21.8 26.11992, total . . . . . . . . . . . . . 63.3 2 200 51.3 1,000 54.5 19.1 26.4
Under 35 years old . . . . . . . . . 57.6 2 200 67.7 900 39.6 25.0 35.435 to 44 years old . . . . . . . . . . 64.2 2 200 61.6 1,500 45.5 22.0 32.545 to 54 years old . . . . . . . . . . 72.5 2 300 53.3 1,900 52.1 19.7 28.255 to 64 years old . . . . . . . . . . 68.0 2 200 40.0 1,000 64.8 16.3 18.965 to 74 years old . . . . . . . . . . 65.0 1 200 32.3 800 74.9 11.0 14.175 years old and over . . . . . . . 52.1 1 100 19.1 800 78.9 10.6 10.5
Less than $10,000. . . . . . . . . . 25.9 1 100 45.5 800 57.4 12.2 30.4$10,000 to $24,999 . . . . . . . . . 52.3 1 100 54.6 900 49.5 21.3 29.1$25,000 to $49,999 . . . . . . . . . 73.1 2 200 61.1 1,200 47.0 21.2 31.7$50,000 to $99,999 . . . . . . . . . 88.5 2 300 46.6 1,500 58.7 18.6 22.8$100,000 and more . . . . . . . . . 91.2 2 500 30.5 3,000 75.2 14.3 10.5
1 Among families having a balance.
Source: Board of Governors of the Federal Reserve System, unpublished data.
Banking, Finance, and Insurance516

No. 793. Credit Cards—Holders, Numbers, Spending, and Debt, 1990 and 1994,and Projections, 2000
TYPE OF CREDIT CARD
CARDHOLDERS(mil.)
NUMBER OF CARDS(mil.)
CREDIT CARDSPENDING (bil. dol.)
CREDIT CARD DEBT(bil. dol.)
1990 1994 2000,proj. 1990 1994 2000,
proj. 1990 1994 2000,proj. 1990 1994 2000,
proj.
Total 1 . . . . . . . . . . . . . . . 113 124 141 1,026 1,131 1,344 466 731 1,443 236.4 366.4 660.9Bank 2 . . . . . . . . . . . . . . . . 79 91 106 217 315 469 243 437 974 154.1 251.3 486.0Oil company. . . . . . . . . . . . . 85 84 82 123 114 105 27 26 31 3.3 3.5 4.1Phone. . . . . . . . . . . . . . . . . 97 106 132 141 161 203 14 17 24 1.7 2.1 3.0Retail store . . . . . . . . . . . . . 96 100 121 469 463 476 75 96 137 51.0 70.2 98.9Travel and entertainment 3 . . . 23 22 26 28 27 32 85 109 205 13.8 17.5 35.3Other 4 . . . . . . . . . . . . . . . . 11 9 10 48 51 60 22 46 71 12.5 21.8 33.7
1 Cardholders may hold more than one type of card. 2 Visa and MasterCard credit cards. Excludes debit cards. 3 IncludesAmerican Express and Diners Club. 4 Includes Air Travel Card, automobile rental, Discover (except for cardholders), andmiscellaneous cards.
Source: HSN Consultants Inc., Oxnard, CA, The Nilson Report, bimonthly. (Copyright used by permission.)
No. 794. Delinquency Rates on Bank Installment Loans, by Type of Loan: 1980 to 1995
[In percent, except as indicated . As of end of year ; seasonally adjusted, except as noted. Number of loans havingan installment past due for 30 days or more as a percentage of total installment loans outstanding]
TYPE OF CREDIT 1980 1985 1987 1988 1989 1990 1991 1992 1993 1994 1995
DELINQUENCY RATES
Closed-end installment loans, total . . . . . . . . . 2.82 2.32 2.47 2.49 2.64 2.57 2.58 2.43 1.77 1.72 2.12Personal loans 1 . . . . . . . . . . . . . . . . . . . . 3.53 3.63 3.66 3.34 3.52 3.37 2.95 3.18 2.30 2.38 2.81Automobile, direct loans 2. . . . . . . . . . . . . . 1.81 1.64 1.59 1.92 2.03 2.22 2.14 2.08 1.58 1.46 1.87Automobile, indirect loans 3 . . . . . . . . . . . . 2.29 2.02 2.20 2.46 2.61 2.59 2.66 2.33 1.65 1.65 2.17Property improvement 4 . . . . . . . . . . . . . . . 1.93 1.91 1.88 2.06 2.25 2.30 2.38 2.18 1.61 1.66 1.77Home equity and second mortgage loans 5 . . (NA) 2.06 2.01 1.86 1.85 1.45 2.06 1.89 1.66 1.38 1.41Mobile home loans . . . . . . . . . . . . . . . . . . 3.14 2.39 2.57 3.12 2.51 3.03 2.86 4.02 3.70 3.68 4.02Recreational vehicle loans . . . . . . . . . . . . . 1.94 1.84 1.99 2.07 2.24 2.63 2.25 2.27 1.26 1.23 1.62Marine financing 5 . . . . . . . . . . . . . . . . . . . (NA) (NA) (NA) (NA) (NA) (NA) (NA) 2.52 1.72 1.51 2.22
Bank card loans. . . . . . . . . . . . . . . . . . . . . . 2.72 2.95 2.33 2.19 2.24 2.86 3.29 2.93 2.49 2.93 3.34Revolving credit loans . . . . . . . . . . . . . . . . . . 2.70 1.96 2.33 2.87 2.92 3.00 2.75 2.63 2.90 2.38 3.14Home equity lines of credit loans (open-end) 5. . (NA) (NA) 0.74 0.68 0.78 0.85 0.88 0.85 0.70 0.63 0.90
REPOSSESSIONS PER 1,000 LOANSOUTSTANDING
Mobile home . . . . . . . . . . . . . . . . . . . . . . . . 1.57 1.21 1.58 1.77 1.63 1.19 1.62 1.30 1.21 1.18 0.86Automobile, direct loans 2 . . . . . . . . . . . . . . . 1.10 1.11 0.86 1.03 1.03 1.75 1.17 0.92 0.83 0.53 0.96Automobile, indirect loans 3 . . . . . . . . . . . . . . 2.75 2.08 2.04 1.86 1.70 1.61 2.07 1.47 0.97 1.17 1.36Marine financing 5 . . . . . . . . . . . . . . . . . . . . (NA) (NA) (NA) (NA) (NA) (NA) (NA) 1.21 1.03 0.82 0.81
NANot available. 1 Beginning 1985, includes home appliance loans. 2 Made directly by bank’s lending function. 3 Madeby automobile dealerships; loans in bank’s portfolio. 4 Beginning 1985, own plan and FHA Title I loans. 5 Not seasonallyadjusted.
Source: American Bankers Association, Washington, DC, Consumer Credit Delinquency Bulletin, quarterly.
Credit Cards—Delinquency Rates—Electronic Funds Transfer 517

No. 796. Money Stock and Liquid Assets: 1980 to 1995
[In billions of dollars . As of December . Seasonally adjusted averages of daily figures. See Historical Statistics, Colonial Times to 1970, series X 410-417 for similar data]
ITEM 1980 1981 1982 1983 1984 1985 1986 1987 1988 1989 1990 1991 1992 1993 1994 1995
M1, total . . . . . . . . . . . . . . . . . . . . . . . . . . . . . 409 437 474 521 552 620 724 750 787 794 826 897 1,024 1,129 1,149 1,125Currency 1. . . . . . . . . . . . . . . . . . . . . . . . . . . . . . . . . 115 123 133 146 156 168 181 197 212 223 247 267 293 322 355 373Travelers checks 2 . . . . . . . . . . . . . . . . . . . . . . . . . . . 4 4 4 5 5 6 6 7 7 7 8 8 8 8 8 9Demand deposits 3 . . . . . . . . . . . . . . . . . . . . . . . . . . . 261 231 234 238 244 267 302 287 287 279 277 290 339 384 382 390Other checkable deposits 4. . . . . . . . . . . . . . . . . . . . . . 28 78 104 132 147 180 236 260 281 285 294 332 384 414 403 353
M2, total . . . . . . . . . . . . . . . . . . . . . . . . . . . . . 1,601 1,756 1,911 2,128 2,312 2,498 2,735 2,834 2,998 3,164 3,282 3,384 3,439 3,494 3,509 3,660M1 . . . . . . . . . . . . . . . . . . . . . . . . . . . . . . . . . . . . . . 409 437 474 521 552 620 724 750 787 794 826 897 1,024 1,129 1,149 1,125Non-M1 components in M2. . . . . . . . . . . . . . . . . . . . . . 1,192 1,319 1,436 1,607 1,760 1,878 2,010 2,085 2,211 2,370 2,456 2,486 2,414 2,365 2,361 2,535Money market funds, retail . . . . . . . . . . . . . . . . . . . . 63 152 185 138 167 177 210 224 246 322 358 374 356 359 388 465Savings deposits (including MMDAs 5) . . . . . . . . . . . . 400 344 400 685 705 815 941 937 926 894 924 1,045 1,187 1,219 1,149 1,135Commercial banks . . . . . . . . . . . . . . . . . . . . . . . . 186 159 190 363 389 457 534 535 542 541 582 665 754 785 752 775Thrift institutions. . . . . . . . . . . . . . . . . . . . . . . . . . 215 185 210 322 315 359 407 403 384 353 342 380 433 434 397 360
Small time deposits 6 . . . . . . . . . . . . . . . . . . . . . . . . 729 823 851 784 889 886 859 923 1,039 1,154 1,175 1,068 871 788 824 936Commercial banks . . . . . . . . . . . . . . . . . . . . . . . . 286 348 380 351 388 386 369 392 452 535 611 603 509 470 505 576Thrift institutions. . . . . . . . . . . . . . . . . . . . . . . . . . 442 475 471 433 501 499 490 530 586 618 563 465 362 318 318 359
M3, total . . . . . . . . . . . . . . . . . . . . . . . . . . . . . 1,992 2,241 2,442 2,685 2,980 3,198 3,486 3,673 3,912 4,065 4,124 4,178 4,187 4,250 4,320 4,573M2 . . . . . . . . . . . . . . . . . . . . . . . . . . . . . . . . . . . . . . 1,601 1,756 1,911 2,128 2,312 2,498 2,735 2,834 2,998 3,164 3,282 3,384 3,439 3,494 3,509 3,660Non-M2 components in M3. . . . . . . . . . . . . . . . . . . . . . 391 485 531 557 667 700 752 839 915 902 842 795 749 756 810 912Large time deposits 7 . . . . . . . . . . . . . . . . . . . . . . . . 260 304 325 316 403 422 420 467 518 541 481 417 354 334 363 417Commercial banks 8 . . . . . . . . . . . . . . . . . . . . . . . 215 250 261 220 256 271 270 304 344 380 360 333 287 272 299 342Thrift institutions. . . . . . . . . . . . . . . . . . . . . . . . . . 45 54 64 97 147 152 150 163 175 161 121 83 67 62 65 75
Repurchase agreements 9. . . . . . . . . . . . . . . . . . . . . 57 65 67 95 105 120 143 173 189 158 139 119 128 158 181 177Eurodollars 9 . . . . . . . . . . . . . . . . . . . . . . . . . . . . . 58 77 90 105 97 94 104 108 117 95 89 79 67 66 82 91Money market funds, institution only . . . . . . . . . . . . . . 16 39 49 41 62 64 84 91 90 107 134 180 200 198 184 226
L, total . . . . . . . . . . . . . . . . . . . . . . . . . . . . . . 2,329 2,603 2,851 3,148 3,522 3,825 4,122 4,329 4,664 4,894 4,976 5,004 5,076 5,165 5,304 5,683M3 . . . . . . . . . . . . . . . . . . . . . . . . . . . . . . . . . . . . . . 1,992 2,241 2,442 2,685 2,980 3,198 3,486 3,673 3,912 4,065 4,124 4,178 4,187 4,250 4,320 4,573Savings bonds . . . . . . . . . . . . . . . . . . . . . . . . . . . . . . 72 68 68 71 74 79 92 101 109 118 126 138 157 172 180 185Short-term Treasury securities 10 . . . . . . . . . . . . . . . . . . 134 149 183 213 262 298 276 249 267 324 334 329 346 343 387 477Bankers acceptances . . . . . . . . . . . . . . . . . . . . . . . . . 32 40 44 45 45 42 37 45 40 41 36 24 21 15 14 12Commercial paper 11 . . . . . . . . . . . . . . . . . . . . . . . . . . 99 105 114 133 161 207 231 261 335 346 355 335 365 386 402 437
1 Currency outside U.S. Treasury, Federal Reserve Banks and the vaults of depository institutions. 2 Outstanding amount of nonbank issuers. 3 At commercial banks and foreign-related institutions.4 Consists of negotiable order of withdrawal (NOW) and automatic transfer service (ATS) accounts at all depository institutions, credit union share draft balances, and demand deposits at thrift institutions. 5 Moneymarket deposit accounts (MMDA). 6 Issued in amounts of less than $100,000. Includes retail repurchase agreements. Excludes individual retirement accounts (IRA’s) and Keogh accounts. 7 Issued in amountsof $100,000 or more. Excludes those booked at international banking facilities. 8 Excludes those held by money market mutual funds, depository institutions, U.S. Government, foreign banks and officialinstitutions. 9 Excludes those held by depository institutions and money market mutual funds. 10 U.S. Treasury bills and coupons with remaining maturities of less than 12 months held by other than depositoryinstitutions, Federal Reserve banks, money market mutual funds, and foreign entities. 11 Excludes commercial paper held by money market mutual funds.
Source: Board of Governors of the Federal Reserve System, Federal Reserve Bulletin, monthly, and Money Stock, Liquid Assets, and Debt Measures, Federal Reserve Statistical Release H.6, weekly.
Banking,
Finance,
andInsurance
518

No. 797. Bank Debits and Deposit Turnover: 1980 to 1995[Debits in trillions of dollars; turnover as ratio of debits to deposits. Annual averages of monthly data]
ITEM 1980 1985 1986 1987 1988 1989 1990 1991 1992 1993 1994 1995
Debits to—Demand deposits, all banks 1 63.1 156.3 188.8 214.9 219.2 256.2 277.6 277.8 313.1 334.8 369.0 397.6Major New York City banks 25.3 70.7 91.6 110.4 115.5 129.7 131.9 137.3 165.4 171.2 191.2 201.2Other banks . . . . . . . . . 37.9 85.6 97.1 104.5 103.7 126.5 145.7 140.4 147.7 163.6 177.9 196.5
Other checkable deposits 2 . 0.2 1.8 2.2 2.2 2.5 2.9 3.4 3.6 3.8 3.5 3.8 4.2Money market deposit accounts (NA) 1.2 1.6 1.9 2.3 2.7 2.9 33.2 33.3 33.5 33.8 34.5Savings deposits . . . . . . . . (NA) 0.4 0.4 0.5 0.5 0.6 0.6 (3) (3) (3) (3) (3)
Deposit turnover:Demand deposits, all banks 1 203 501 557 608 620 734 799 804 826 786 817 874Major New York City banks 816 2,200 2,500 2,670 2,904 3,435 3,831 4,263 4,795 4,198 4,482 4,867Other banks . . . . . . . . . 135 306 322 335 331 406 466 448 429 425 435 475
NA Not available. 1 Represents accounts of individuals, partnerships, and corporations and of States and politicalsubdivisions at insured commercial banks. 2 Accounts authorized for negotiable orders of withdrawal (NOW) and accountsauthorized for automatic transfer to demand deposits (ATS). 3 Beginning 1991, savings deposits included in money marketdeposit accounts.
Source: Board of Governors of the Federal Reserve System, Federal Reserve Bulletin, monthly, and Annual Statistical Digest.
No. 798. Selected Time Deposits and Other Accounts at Insured Commercial Banks—Deposits and Interest Rates: 1990 to 1995
[As of December . Estimates based on data collected from a sample of about 500 banks]
TYPE OF DEPOSITAMOUNT OUTSTANDING (bil. dol.) ANNUAL EFFECTIVE YIELD (percent)
1990 1991 1992 1993 1994 1995 1990 1991 1992 1993 1994 1995
NOW accounts 1. . . . . . . . . . . . 209.9 245.1 287.1 305.2 304.9 252.4 4.89 3.77 2.33 1.86 1.96 1.92Savings deposits . . . . . . . . . . . 570.3 652.0 738.3 767.0 737.1 793.2 5.84 4.30 2.88 2.46 2.92 3.10Interest-bearing time deposits: 27-91 day . . . . . . . . . . . . . . . 50.2 47.1 38.5 29.4 32.3 32.8 6.94 4.18 2.90 2.65 3.79 4.1192-182 day. . . . . . . . . . . . . . 168.0 158.6 127.8 109.0 96.7 96.9 7.19 4.41 3.16 2.91 4.44 4.69183 day-1 year . . . . . . . . . . . 221.0 209.7 163.1 145.4 163.1 187.8 7.33 4.59 3.37 3.13 5.12 5.031-2 1/2 years . . . . . . . . . . . . 150.2 171.7 153.0 139.8 164.4 211.4 7.42 4.95 3.88 3.55 5.74 5.182 1/2 years or more . . . . . . . . 139.4 157.1 169.7 180.5 192.7 203.2 7.53 5.52 4.77 4.28 6.30 5.41
All IRA and Keogh Plan deposits . 131.0 147.3 147.4 144.0 144.1 152.4 (NA) (NA) (NA) (NA) (NA) (NA)
NA Not available. 1 Estimates for all NOW accounts are based on reports of deposits. 2 All interest-bearing time depositsand open account time deposits with balances of less than $100,000, including those held in IRA’s and Keogh Plan deposits.
Source: Board of Governors of the Federal Reserve System, Money Stock, Liquid Assets, and Debt Measures, FederalReserve Statistical Release H.6, Special Supplementary Table, Monthly Survey of Selected Deposits, monthly.
No. 799. Commercial Paper Outstanding, by Type of Company: 1980 to 1995[In billions of dollars . As of December 31 . Seasonally adjusted. Commercial paper is an unsecured promissory note
having a fixed maturity of no more than 270 days]
TYPE OF COMPANY 1980 1985 1987 1988 1989 1990 1991 1992 1993 1994 1995
All issuers . . . . . . . . . . . 124.4 298.8 359.0 458.5 525.8 562.7 528.8 545.6 555.1 595.4 671.6Financial companies 1. . . . . . . . 87.7 213.8 277.1 354.7 394.6 414.7 395.5 398.1 399.3 430.7 482.1Dealer-placed paper 2 . . . . . . 19.9 78.4 102.7 159.8 183.6 214.7 213.0 226.5 218.9 223.0 274.0Directly-placed paper 3 . . . . . 67.8 135.3 174.3 194.9 210.9 200.0 182.5 171.6 180.4 207.7 208.1
Nonfinancial companies 4 . . . . . 36.7 85.0 81.9 103.8 131.3 147.9 133.4 147.6 155.7 164.6 189.5
1 Institutions engaged primarily in activities such as, but not limited to, commercial, savings, and mortgage banking; sales,personal, and mortgage financing; factoring, finance leasing, and other business lending; insurance underwriting; and otherinvestment activities. 2 Includes all financial company paper sold by dealers in the open market. 3 As reported by financialcompanies that place their paper directly with investors. 4 Includes public utilities and firms engaged primarily in such activitiesas communications, construction, manufacturing, mining, wholesale and retail trade, transportation, and services.
Source: Board of Governors of the Federal Reserve System, Federal Reserve Bulletin, monthly.
No. 800. Federal Reserve Bank of New York—Discount Rates: 1980 to 1996[Percent per year . Rates for short-term adjustment credit. For rates applicable to other types of discount window credit,
see source. See also Historical Statistics, Colonial Times to 1970, series X 454-455]
EFFECTIVE DATE Rate
1980: 1 Nov. 17 . . . . 12Dec. 5 . . . . . . 13
1981: 1 May 5 . . . . . 14Nov. 2 . . . . . . 13Dec. 4 . . . . . . 12
1982: July 20 . . . . . 11 1/2Aug. 2 . . . . . . 11Aug. 16 . . . . . 10 1/2Aug. 27 . . . . . 10
EFFECTIVE DATE Rate
Oct. 12 . . . . . 9 1/2Nov. 22 . . . . . 9Dec. 15 . . . . . 8 1/2
1984: April 9 . . . . . . 9Nov. 21 . . . . . 8 1/2Dec. 24 . . . . . 8
1985: May 20 . . . . . 7 1/21986: March 7 . . . . . 7
April 21 . . . . . 6 1/2
EFFECTIVE DATE Rate
July 11. . . . . . 6Aug. 21 . . . . . 5 1/2
1987: Sept. 4 . . . . . 61988: Aug. 9 . . . . . . 6 1/21989: Feb. 24 . . . . . 71990: Dec. 19 . . . . . 6 1/21991: Feb. 1 . . . . . . 6
April 30 . . . . . 5 1/2Sept. 13. . . . . 5
EFFECTIVE DATE Rate
Nov. 6 . . . . . . 4 1/2Dec. 20 . . . . . 3 1/2
1992: July 2 . . . . . . 31994: May 17 . . . . . 3 1/2
Aug. 16 . . . . . 4Nov. 15 . . . . . 4 3/4
1995: Feb. 1 . . . . . . 5 1/41996: Jan. 31 . . . . . 5In effect, Apr. 5, ’96 . 5
1 The discount rates for 1980 and 1981 do not include the surcharge applied to frequent borrowings by large institutions. Thesurcharge reached 3 percent in 1980 and 4 percent in 1981. Surcharge was eliminated in Nov. 1981.
Source: Board of Governors of the Federal Reserve System, Federal Reserve Bulletin, monthly, and Annual Statistical Digest.
Bank Debits—Commercial Paper—Discount Rates 519

No. 801. Money Market Interest Rates and Mortgage Rates: 1980 to 1995
[Percent per year . Annual averages of monthly data, except as indicated. See also Historical Statistics, Colonial Times to 1970, series X 444-453]
TYPE 1980 1981 1982 1983 1984 1985 1986 1987 1988 1989 1990 1991 1992 1993 1994 1995
Federal funds, effective rate . . . . . . . . . . . . . . 13.35 16.39 12.24 9.09 10.23 8.10 6.80 6.66 7.57 9.21 8.10 5.69 3.52 3.02 4.21 5.83Commercial paper, 3-month 1 2 . . . . . . . . . . . . 12.61 15.34 11.90 8.88 10.12 7.95 6.49 6.82 7.66 8.99 8.06 5.87 3.75 3.22 4.66 5.93Commercial paper, 6-month 1 2 . . . . . . . . . . . . 12.24 14.77 11.89 8.90 10.18 8.00 6.39 6.85 7.68 8.80 7.95 5.85 3.80 3.30 4.93 5.93Prime rate charged by banks . . . . . . . . . . . . . 15.26 18.87 14.85 10.79 12.04 9.93 8.33 8.21 9.32 10.87 10.01 8.46 6.25 6.00 7.15 8.83Eurodollar deposits, 3-month . . . . . . . . . . . . . 14.00 16.79 13.12 9.57 10.75 8.27 6.70 7.07 7.85 9.16 8.16 5.86 3.70 3.18 4.63 5.93Finance paper, 3-month 2 3 . . . . . . . . . . . . . . 11.45 14.09 11.24 8.71 9.75 7.77 6.38 6.54 7.38 8.72 7.87 5.71 3.65 3.16 4.53 5.78Finance paper, 6-month 2 3 . . . . . . . . . . . . . . 11.25 13.74 11.20 8.70 9.67 7.74 6.31 6.37 7.14 8.16 7.53 5.60 3.63 3.15 4.56 5.68Bankers acceptances, 3-month 2 4 . . . . . . . . . 12.67 15.34 11.89 8.91 10.17 7.91 6.38 6.75 7.56 8.87 7.93 5.70 3.62 3.13 4.56 5.81Bankers acceptances, 6-month 2 4 . . . . . . . . . 12.20 14.68 11.83 8.92 10.21 7.95 6.28 6.78 7.60 8.67 7.80 5.67 3.67 3.21 4.83 5.80Large negotiable CD’s, 3-month,secondary market . . . . . . . . . . . . . . . . . . . . 13.07 15.91 12.27 9.07 10.37 8.05 6.52 6.86 7.73 9.09 8.15 5.83 3.68 3.17 4.63 5.92Taxable money market funds 5 . . . . . . . . . . . . 12.68 16.82 12.23 8.58 10.04 7.71 6.26 6.12 7.11 8.87 7.82 5.71 3.37 2.70 3.75 5.48Tax-exempt money market funds 5 . . . . . . . . . (NA) (NA) (NA) (NA) (NA) (NA) (NA) (NA) (NA) (NA) (NA) (NA) 2.59 1.97 2.38 3.39
Certificates of deposit (CD’s): 66-month . . . . . . . . . . . . . . . . . . . . . . . . . (NA) (NA) (NA) (NA) 9.99 7.83 6.51 6.47 7.18 8.34 7.35 5.67 3.46 2.84 3.37 4.921-year . . . . . . . . . . . . . . . . . . . . . . . . . . . (NA) (NA) (NA) (NA) 10.37 8.29 6.75 6.77 7.47 8.41 7.42 5.88 3.72 3.12 3.94 5.392 1/2-year . . . . . . . . . . . . . . . . . . . . . . . . (NA) (NA) (NA) 10.06 10.82 9.00 7.13 7.16 7.77 8.33 7.52 6.29 4.47 3.73 4.49 5.695-year . . . . . . . . . . . . . . . . . . . . . . . . . . . (NA) (NA) (NA) (NA) 11.25 9.66 7.60 7.66 8.11 8.30 7.71 6.83 5.62 4.88 5.30 6.00
U.S. Government securities:Secondary market: 73-month Treasury bill . . . . . . . . . . . . . . . 11.39 14.04 10.60 8.62 9.54 7.47 5.97 5.78 6.67 8.11 7.50 5.38 3.43 3.00 4.25 5.496-month Treasury bill . . . . . . . . . . . . . . . 11.32 13.81 11.06 8.74 9.78 7.65 6.02 6.03 6.91 8.03 7.46 5.44 3.54 3.12 4.64 5.561-year Treasury bill . . . . . . . . . . . . . . . . 10.85 13.16 11.07 8.80 9.94 7.81 6.07 6.33 7.13 7.92 7.35 5.52 3.71 3.29 5.02 5.60
Auction average: 83-month Treasury bill . . . . . . . . . . . . . . . 11.51 14.03 10.69 8.63 9.35 7.47 5.98 5.82 6.68 8.12 7.51 5.42 3.45 3.02 4.29 5.516-month Treasury bill . . . . . . . . . . . . . . . 11.37 13.78 11.08 8.75 9.77 7.64 6.03 6.05 6.92 8.04 7.47 5.49 3.57 3.14 4.66 5.591-year Treasury bill . . . . . . . . . . . . . . . . 10.75 13.16 11.10 8.86 9.91 7.76 6.07 6.33 7.17 7.91 7.36 5.54 3.75 3.33 4.98 5.69
Home mortgages:HUD series: 9FHA insured, secondary market 10 . . . . . . 13.44 16.31 15.30 13.11 13.81 12.24 9.91 10.16 10.49 10.24 10.17 9.25 8.46 7.46 8.68 8.18Conventional, new-home 11 12 . . . . . . . . . 13.95 16.52 15.79 13.43 13.80 12.28 10.07 10.17 10.30 10.21 10.08 9.20 8.43 7.37 8.58 8.05Conventional, existing-home 11 . . . . . . . . 13.95 16.55 15.82 13.44 13.81 12.29 10.09 10.17 10.31 10.22 10.08 9.20 8.43 7.37 8.59 8.05
NA Not available. 1 Based on daily offering rates of dealers. 2 Yields are quoted on a bank-discount basis, rather than an investment yield basis (which would give a higher figure). 3 Placed directly;averages of daily offering rates quoted by finance companies. 4 Based on representative closing yields. From Jan. 1, 1981, rates of top-rated banks only. 5 12 month return for period ending December 31. Source:IBC Financial Data, Inc., Ashland, MA, IBC’s Money Market Insight, monthly (copyright). 6 Annual averages. Source: Financial Rates, Inc., North Palm Beach, FL, Bank Rate Monitor, weekly (copyright).7 Averages based on daily closing bid yields in secondary market, bank discount basis. 8 Averages computed on an issue-date basis; bank discount basis. 9 HUD=Housing and Urban Development. 10 Averagesbased on quotations for 1 day each month as compiled by FHA. 11 Primary market. 12 Average contract rates on new commitments.
Source: Except as noted, Board of Governors of the Federal Reserve System, Federal Reserve Bulletin, monthly, and Annual Statistical Digest.
Banking,
Finance,
andInsurance
520

No. 804. Bond and Stock Dividend Yields: 1980 to 1995[Percent per year . Annual averages of daily figures, except as indicated. See also Historical Statistics,
Colonial Times to 1970, series X 474-491]
TYPE 1980 1985 1987 1988 1989 1990 1991 1992 1993 1994 1995
U.S. Treasury, constant maturities: 1 2
3-year . . . . . . . . . . . . . . . . . . . . 11.51 9.64 7.68 8.26 8.55 8.26 6.82 5.30 4.44 6.27 6.255-year . . . . . . . . . . . . . . . . . . . . 11.45 10.12 7.94 8.47 8.50 8.37 7.37 6.19 5.14 6.69 6.387-year . . . . . . . . . . . . . . . . . . . . 11.40 10.50 8.23 8.71 8.52 8.52 7.68 6.63 5.54 6.91 6.5010-year . . . . . . . . . . . . . . . . . . . 11.43 10.62 8.39 8.85 8.49 8.55 7.86 7.01 5.87 7.69 6.5720-year . . . . . . . . . . . . . . . . . . . (NA) (NA) (NA) (NA) (NA) (NA) (NA) (NA) 6.29 7.47 6.9530-year . . . . . . . . . . . . . . . . . . . 11.27 10.79 8.59 8.96 8.45 8.61 8.14 7.67 6.59 7.37 6.88
U.S. Govt., long-term bonds 2 3 . . . . . 10.81 10.75 8.64 8.98 8.58 8.74 8.16 7.52 6.45 7.41 6.93State and local govt. bonds, Aaa 4 . . . 7.86 8.60 7.12 7.36 7.00 6.96 6.56 6.09 5.38 5.78 5.79State and local govt. bonds, Baa 4 . . . 9.02 9.58 8.17 7.84 7.40 7.29 6.99 6.48 5.82 6.18 6.04Municipal (Bond Buyer, 20 bonds) . . . 8.59 9.11 7.63 7.68 7.23 7.27 6.92 6.44 5.60 6.18 5.95Corporate Aaa seasoned 4 . . . . . . . . 11.94 11.37 9.38 9.71 9.26 9.32 8.77 8.14 7.22 7.97 7.59Corporate Baa seasoned 4 . . . . . . . . 13.67 12.72 10.58 10.83 10.18 10.36 9.80 8.98 7.93 8.63 8.20Corporate (Moody’s) 4 5 . . . . . . . . . . 12.75 12.05 9.91 10.18 9.66 9.77 9.23 8.55 7.54 8.26 7.83Industrials (49 bonds) 6 . . . . . . . . 12.35 11.80 9.83 9.91 9.66 9.77 9.25 8.52 7.51 8.21 7.76Public utilities (51 bonds) 7 . . . . . . 13.15 12.29 9.98 10.45 9.66 9.76 9.21 8.57 7.56 8.30 7.90
Stocks (Standard & Poor’s):Common: Composite (500 stocks) . 5.26 4.25 3.08 3.64 3.45 3.61 3.24 2.99 2.78 2.82 2.56
NANot available. 1 Yields on the more actively traded issues adjusted to constant maturities by the U.S. Treasury. 2 Yieldsare based on closing bid prices quoted by at least five dealers. 3 Averages (to maturity or call) for all outstanding bonds neitherdue nor callable in less than 10 years, including several very low yielding ‘‘flower’’ bonds. 4 Source: Moody’s Investors Service,New York, NY. 5 For 1980-88 includes railroad bonds which were discontinued as part of composite in 1989. 6 Covers 40bonds for 1980, 38 bonds for 1985, and 37 bonds for 1987 and 1988. 7 Covers 40 bonds for period 1980-88.
Source: Except as noted, Board of Governors of the Federal Reserve System, Federal Reserve Bulletin, monthly.
No. 805. New Security Issues of Corporations, by Type of Offering and Industry Group:1990 to 1994
[In billions of dollars . Represents gross proceeds of issues maturing in more than one year. Figures are the principal amount orthe number of units multiplied by the offering price. Excludes secondary offerings, employee stock plans, investment companiesother than closed-end, intracorporate transactions, equities sold abroad, and Yankee bonds. Stock data include ownershipsecurities issued by limited partnerships]
TYPE OFOFFERING AND
INDUSTRY GROUP1990 1991 1992 1993 1994
Total . . . . . . . 339.1 465.2 559.8 769.1 583.2Bonds, total . . . . . . 298.9 389.8 471.5 646.6 498.0Public, domestic . . 188.8 286.9 378.1 487.0 365.2Private placement,domestic . . . . . . 87.0 74.9 65.9 121.2 76.1Sold abroad . . . . 23.1 28.0 27.6 38.4 56.8
Manufacturing . . . 51.8 86.6 82.1 88.2 43.4Commercial andmiscellaneous . . 40.7 36.7 43.1 58.6 40.7Transportation . . . 12.8 13.6 10.0 10.8 6.9Public utility . . . . . 17.6 23.9 48.1 56.3 13.3Communication . . 6.7 9.4 15.4 31.9 13.3Real estate andfinancial . . . . . . 169.3 219.6 272.9 400.8 380.4
TYPE OFOFFERING AND
INDUSTRY GROUP1990 1991 1992 1993 1994
Stocks, total . . . . . . 40.2 75.4 88.3 122.5 85.2Preferred . . . . . . 4.0 17.1 21.3 18.9 12.5Common. . . . . . . 19.4 48.2 57.1 82.7 47.8Private place-ment . . . . . . . . 16.7 10.1 9.9 20.9 24.8
Manufacturing . . . 5.6 24.1 22.7 22.3 17.8Commercial andmiscellaneous . . 10.2 19.4 20.2 25.8 15.7Transportation . . . 0.4 2.4 2.6 2.2 2.2Public utility . . . . . 0.4 3.5 6.5 7.1 2.2Communication . . 3.8 0.5 2.4 3.4 0.5Real estate andfinancial . . . . . . 19.7 25.5 33.9 61.0 46.7
Source: Board of Governors of the Federal Reserve System, Federal Reserve Bulletin, monthly, and Annual Statistical Digest.
Banking, Finance, and Insurance522

No. 806. Equities, Corporate Bonds, and Tax-Exempt Securities—Holdings and NetPurchases, by Type of Investor: 1980 to 1994
[In billions of dollars . Holdings as of Dec. 31. Minus sign (-) indicates net sales]
TYPE OFINVESTOR
HOLDINGS NET PURCHASES
1980 1990 1992 1993 1994 1980 1990 1992 1993 1994
EQUITIES 1
Total 2 . . . . . . . . . . . . . . . . . . 1,535 3,530 5,463 6,186 6,049 14.5 -45.6 84.1 120.1 31.6Household sector 3 . . . . . . . . . . . 934 1,717 2,810 3,088 2,913 -4.3 -21.7 43.8 -33.1 -89.0Rest of the world 4 . . . . . . . . . . . 65 222 300 340 341 4.2 -16.0 -5.8 20.5 0.9Life insurance companies . . . . . . . 46 98 122 146 159 0.4 -5.7 2.7 7.8 8.2Other insurance companies. . . . . . 32 80 97 103 105 3.1 -7.0 -0.4 0.8 5.3Private pension funds . . . . . . . . . 223 658 962 1,079 1,047 16.4 -14.4 -2.6 -13.6 -26.7State and local retirement funds. . . 44 296 449 507 520 5.3 12.3 16.7 48.0 30.9Mutual funds . . . . . . . . . . . . . . . 42 233 452 669 738 -1.8 14.4 67.2 128.9 122.7Bank personal trusts . . . . . . . . . . 135 190 217 181 156 -7.2 0.5 -37.0 -55.2 -20.4
CORPORATE & FOREIGNBONDS
Total 2 . . . . . . . . . . . . . . . . . . 508 1,696 2,023 2,277 2,417 36.2 114.7 160.4 252.9 142.4Household sector 3 . . . . . . . . . . . 31 95 107 142 198 -14.5 38.0 -4.8 26.2 58.5Rest of the world 4 . . . . . . . . . . . 37 217 252 273 311 9.2 5.3 18.1 30.0 38.2Commercial banking . . . . . . . . . . 11 89 95 98 104 1.1 4.6 -1.6 3.5 6.0Life insurance companies . . . . . . . 179 567 654 719 766 8.7 55.8 58.9 65.5 46.7Other insurance companies. . . . . . 24 89 98 103 105 - 9.9 0.7 5.3 1.6Private pension funds . . . . . . . . . 78 235 292 309 295 14.0 9.3 16.4 17.4 -14.9State and local retirement funds. . . 92 169 223 238 258 9.2 2.8 27.8 14.8 19.9Mutual funds . . . . . . . . . . . . . . . 8 88 120 176 173 1.3 13.6 19.8 56.1 -2.9
MUNICIPAL SECURITIES 5
Total 2 . . . . . . . . . . . . . . . . . . 365 1,040 1,140 1,218 1,203 23.9 48.7 31.1 78.1 -15.1Household sector 3 . . . . . . . . . . . 76 448 449 433 403 2.4 17.7 -34.8 -15.8 -29.6Commercial banking . . . . . . . . . . 149 117 98 99 98 13.2 -16.4 -5.7 1.7 -1.5Other insurance companies. . . . . . 81 137 134 146 153 7.7 2.2 7.5 11.8 7.3Mutual funds . . . . . . . . . . . . . . . 4 109 173 218 213 0.4 15.6 36.3 44.6 -5.4Money market mutual funds . . . . . 2 84 95 103 111 1.6 14.3 5.0 8.3 7.5Bank personal trusts . . . . . . . . . . 26 81 96 109 120 -1.6 7.7 6.1 12.9 11.3
- Represents or rounds to zero. 1 Excludes mutual fund shares. 2 Includes other types not shown separately. 3 Includesnonprofit organizations. 4 Holdings of U.S. issues by foreign residents. 5 Includes small amounts of taxable securities.
Source: Board of Governors of the Federal Reserve System, Flow of Funds Accounts, March 1995 quarterly diskettes. Dataare also published in the quarterly Z.1 release.
No. 807. United States Purchases and Sales of Foreign Stocks and Bonds, 1980 to 1995,and by Selected Country, 1995
[In billions of dollars . See headnote, table 808. Minus sign (-) indicates net sales by U.S. investors or a net inflowof capital into the United States]
YEAR AND COUNTRYNET PURCHASES TOTAL
TRANSACTIONS 1 PURCHASES SALES
Total Bonds Stocks Total Bonds Stocks Bonds Stocks Bonds Stocks
1980 . . . . . . . . . . . . . . . . . 3.1 1.0 2.1 53.1 35.2 17.9 18.1 10.0 17.1 7.91990 . . . . . . . . . . . . . . . . . 31.2 21.9 9.2 906.7 652.2 254.5 337.1 131.9 315.1 122.61991 . . . . . . . . . . . . . . . . . 46.8 14.8 32.0 948.6 675.5 273.2 345.1 152.6 330.3 120.61992 . . . . . . . . . . . . . . . . . 47.9 15.6 32.3 1,375.1 1,042.8 332.4 529.2 182.3 513.6 150.11993 . . . . . . . . . . . . . . . . . 143.1 80.4 62.7 2,126.0 1,572.3 553.7 895.2 313.9 834.5 246.11994 . . . . . . . . . . . . . . . . . 57.3 9.2 48.1 2,526.2 1,706.0 820.3 924.9 431.1 904.6 384.0
1995, total 2 . . . . . . . . . . 98.1 46.8 51.3 2,573.6 1,832.0 741.6 939.4 396.4 892.6 345.2United Kingdom . . . . . . . . . . 29.0 19.0 10.0 1,135.4 861.1 274.3 440.0 142.1 421.1 132.1Canada . . . . . . . . . . . . . . . 7.8 8.0 -0.2 414.6 370.7 43.9 189.4 21.8 181.3 22.0Japan . . . . . . . . . . . . . . . . 25.1 5.3 19.8 246.8 123.2 123.6 64.3 71.7 59.0 51.9France . . . . . . . . . . . . . . . . 0.5 -1.0 1.4 60.0 38.4 21.6 18.7 11.5 19.7 10.1Hong Kong . . . . . . . . . . . . . 1.6 -0.6 2.2 58.5 19.4 39.1 9.4 20.6 10.0 18.5Germany . . . . . . . . . . . . . . 1.0 0.5 0.5 33.8 12.1 21.6 6.3 11.1 5.8 10.6Mexico . . . . . . . . . . . . . . . . 0.6 0.5 0.2 26.5 11.0 15.5 5.7 7.8 5.3 7.7
1 Total purchases plus total sales. 2 Includes other countries, not shown separately.
Source: U.S. Dept. of Treasury, Treasury Bulletin, quarterly.
Equities and Bonds 523

No. 808. Foreign Purchases and Sales of U.S. Securities, by Type of Security,1980 to 1995, and by Selected Country, 1995
[In billions of dollars . Covers transactions in all types of long-term domestic securities by foreigners as reported by banks, bro-kers, and other entities in the United States (except nonmarketable U.S. Treasury notes, foreign series; and nonmarketable U.S.Treasury bonds and notes, foreign currency series). Data cover new issues of securities, transactions in outstanding issues, andredemptions of securities. Includes transactions executed in the United States for the account of foreigners, and transactions executedabroad for the account of reporting institutions and their domestic customers. Data by country show the country of domicile of theforeign buyers and sellers of the securities; in the case of outstanding issues, this may differ from the country of the original issuer.The term ‘‘foreigner’’ covers all institutions and individuals domiciled outside the United States, including U.S. citizens domiciledabroad, and the foreign branches, subsidiaries and other affiliates abroad of U.S. banks and businesses; the central governments,central banks, and other official institutions of foreign countries; and international and regional organizations. ‘‘Foreigner’’ also includespersons in the United States to the extent that they are known by reporting institutions to be acting on behalf of foreigners. Minussign (-) indicates net sales by foreigners or a net outflow of capital from the United States]
YEAR AND COUNTRY
NET PURCHASES TOTAL TRANSACTIONS 4
Total
Trea-surybondsand
notes 1
U.S.Govt.
corpora-tions 2
bonds
Corpo-rate
bonds 3
Corpo-ratestocks
Total
Trea-surybondsand
notes 1
U.S.Govt.
corpora-tions 2
bonds
Corpo-rate
bonds 3
Corpo-ratestocks
1980 . . . . . . . . . . . . . . 15.8 4.9 2.6 2.9 5.4 198 97 17 9 751985 . . . . . . . . . . . . . . 78.3 29.2 4.3 39.8 4.9 1,256 968 46 84 1591990 . . . . . . . . . . . . . . 25.0 17.9 6.3 9.7 -15.1 4,204 3,620 104 117 3621991 . . . . . . . . . . . . . . 58.1 19.9 10.2 16.9 11.1 4,706 4,016 124 155 4111992 . . . . . . . . . . . . . . 73.2 39.3 18.3 20.8 -5.1 5,282 4,444 204 187 4481993 . . . . . . . . . . . . . . 111.1 23.6 35.4 30.6 21.6 6,314 5,195 263 239 6181994 . . . . . . . . . . . . . . 140.6 78.8 21.7 38.2 1.9 6,562 5,343 297 222 699
1995, total 5 . . . . . . . 230.1 134.0 28.7 56.3 11.2 7,242 5,828 222 277 915United Kingdom . . . . . . . 98.9 34.8 17.1 39.0 8.0 2,729 2,278 59 146 245Japan . . . . . . . . . . . . . 16.4 16.9 1.1 1.2 -2.7 1,001 912 32 13 45Canada . . . . . . . . . . . . 1.3 0.3 1.0 1.6 -1.5 548 435 3 13 96British West Indies . . . . . 19.4 17.4 -0.4 1.3 1.1 333 212 42 11 69Netherlands Antilles . . . . 27.3 23.5 (Z) -0.2 4.0 298 206 3 10 79Bermuda . . . . . . . . . . . -2.4 -6.0 1.1 1.9 0.6 283 171 20 13 78
Z Less than $50 million. 1 Marketable bonds and notes. 2 Includes federally-sponsored agencies. 3 Includestransactions in directly placed issues abroad by U.S. corporations and issues of States and municipalities. 4 Total purchases plustotal sales. 5 Includes other countries, not shown separately.
Source: U.S. Dept. of Treasury, Treasury Bulletin, quarterly.
No. 809. Sales of Stocks and Options on Registered Exchanges: 1980 to 1994[Excludes over-the-counter trading. See also Historical Statistics, Colonial Times to 1970, series X 517-530]
EXCHANGE Unit 1980 1985 1987 1988 1989 1990 1991 1992 1993 1994
Market value of all sales,all exchanges 1 2 . . . . . . . . Bil. dol 522 1,260 2,492 1,702 2,010 1,752 1,903 2,149 2,734 2,966
New York . . . . . . . . . . . . . . . . Bil. dol 398 1,024 1,987 1,380 1,581 1,394 1,534 1,759 2,278 2,483American . . . . . . . . . . . . . . . . Bil. dol 47 38 102 59 80 65 67 69 83 83Chicago 3 . . . . . . . . . . . . . . . . Bil. dol 21 79 122 87 101 74 77 87 107 98CBOE 4 . . . . . . . . . . . . . . . . . Bil. dol 28 38 124 64 88 81 74 63 65 87Pacific . . . . . . . . . . . . . . . . . . Bil. dol 13 40 71 49 64 53 63 65 70 70Philadelphia . . . . . . . . . . . . . . Bil. dol 11 23 48 34 50 41 39 49 55 51
STOCKS 5
Shares sold, all exchanges 2 . . . Million. 15,488 37,046 63,771 52,533 54,239 53,338 58,025 65,463 82,808 90,482New York . . . . . . . . . . . . . . Million. 12,390 30,222 53,038 44,018 44,140 43,829 47,674 53,344 68,732 76,665American . . . . . . . . . . . . . . Million. 1,659 2,115 3,496 2,576 3,248 3,125 3,103 3,631 4,470 4,300Chicago 3 . . . . . . . . . . . . . . Million. 598 2,274 3,329 2,771 2,960 2,511 2,715 3,035 3,792 3,526Pacific . . . . . . . . . . . . . . . . Million. 435 1,352 2,034 1,576 1,791 1,682 2,068 2,087 2,330 2,147
Market value, all exchanges 2 . . Bil. dol 476 1,200 2,284 1,587 1,845 1,612 1,776 2,032 2,610 2,817New York . . . . . . . . . . . . . . Bil. dol 398 1,023 1,983 1,378 1,577 1,390 1,532 1,758 2,276 2,482American . . . . . . . . . . . . . . Bil. dol 35 26 53 31 43 36 40 42 54 56Chicago 3 . . . . . . . . . . . . . . Bil. dol 21 79 122 87 101 74 77 87 107 98Pacific . . . . . . . . . . . . . . . . Bil. dol 11 37 57 41 52 45 63 58 62 59
OPTIONS 6
Contracts traded, all exchanges 2. Million. 97 233 305 196 227 210 199 202 233 281CBOE 4 . . . . . . . . . . . . . . . Million. 53 149 182 112 127 130 122 122 141 184American . . . . . . . . . . . . . . Million. 29 49 71 45 50 41 39 42 48 46
Market value of contracts traded,all exchanges 2 . . . . . . . . . . . Bil. dol 45.8 59.1 118.9 62.6 76.8 79.0 76.1 72.2 75.2 94.5CBOE 4 . . . . . . . . . . . . . . . Bil. dol 27.9 38.4 76.9 39.7 47.3 55.4 50.7 44.5 45.5 67.2American . . . . . . . . . . . . . . Bil. dol 12.5 11.6 25.7 12.4 15.1 12.8 14.0 14.1 14.9 13.2
Options exercised:Number of contracts . . . . . . . Million. 4.9 10.5 17.0 11.4 15.6 12.1 10.8 9.9 11.5 13.0Value . . . . . . . . . . . . . . . . . Bil. dol 20.4 49.2 85.9 51.5 85.2 55.8 49.2 43.9 48.4 53.8
1 Includes market value of stocks, rights, warrants, and options trading beginning 1987. 2 Includes other registeredexchanges, not shown separately. 3 The Chicago Stock Exchange, Inc. was formerly the Midwest Stock Exchange. 4 ChicagoBoard Options Exchange, Inc. 5 Includes voting trust certificates, American Depository Receipts, and certificate of deposit forstocks. 6 Data for 1980 exclude nonequity options.
Source: U.S. Securities and Exchange Commission, SEC Monthly Statistical Review (discontinued Feb. 1989); andunpublished data.
Banking, Finance, and Insurance524

No. 810. Volume of Trading on New York Stock Exchange: 1980 to 1995
[Round lot : A unit of trading or a multiple thereof. On the NYSE the unit of trading is generally 100 shares in stocks. For some inac-tive stocks, the unit of trading is 10 shares. Odd lot : An amount of stock less than the established 100-share unit or 10-share unitof trading]
ITEM Unit 1980 1985 1988 1989 1990 1991 1992 1993 1994 1995
Shares traded . . . . . . . . . Million . 11,562 27,774 41,118 42,022 39,946 45,599 51,826 67,461 74,003 87,873Round lots . . . . . . . . . . . . . . . Million . . 11,352 27,511 40,850 41,699 39,665 45,266 51,376 66,923 73,420 87,218Average daily shares . . . . . . Million . . 44.9 109.2 161.5 165.5 156.8 178.9 202.3 264.5 291.4 346.1High day . . . . . . . . . . . . . . Million . . 84.3 181.0 343.9 416.4 292.4 317.4 389.0 379.5 482.8 652.8Low day. . . . . . . . . . . . . . . Million . . 16.1 62.1 72.1 68.9 56.9 69.6 95.1 89.9 113.8 117.7
Odd lots . . . . . . . . . . . . . . . . Million . . 209 263 268 324 282 333 450 538 583 656
Value of shares traded . . Bil. dol . 382 981 1,366 1,556 1,336 1,534 1,765 2,305 2,477 3,110Round lots . . . . . . . . . . . . . . . Bil. dol. . 375 970 1,356 1,543 1,325 1,520 1,745 2,283 2,454 3,083Odd lots . . . . . . . . . . . . . . . . Bil. dol. . 8 10 10 13 11 113 19 22 22 27
Bond volume 2 . . . . . . . . Mil. dol . 5,190 9,047 7,702 8,836 10,893 12,698 11,629 9,743 7,197 6,979Daily average . . . . . . . Mil. dol . 20.5 35.9 30.4 35.1 43.1 50.2 45.8 38.5 28.6 27.7
1 Excludes odd lot statistics for February which were not available. 2 Par value.
Source: New York Stock Exchange, Inc., New York, NY, Fact Book, annual (copyright).
No. 811. Securities Listed on New York Stock Exchange: 1980 to 1995
[As of December 31 , except cash dividends are for calendar year ]
ITEM Unit 1980 1985 1987 1988 1989 1990 1991 1992 1993 1994 1995
BONDS
Number of issuers . . . . . Number . 1,045 1,010 885 846 794 743 705 636 574 583 564Number of issues . . . . . . Number . 3,057 3,856 3,346 3,106 2,961 2,912 2,727 2,354 2,103 2,141 2,097Face value . . . . . . . . . . Bil. dol . . 602 1,327 1,651 1,610 1,435 1,689 2,219 2,009 2,342 2,526 2,773Market value . . . . . . . . . Bil. dol.. . 508 1,339 1,621 1,561 1,412 1,610 2,227 2,044 2,528 2,367 2,748Average price . . . . . . . . Percent . 84.41 100.90 98.20 96.94 98.42 95.31 100.34 101.77 107.96 93.73 99.09
STOCKS
Companies . . . . . . . . . . Number . 1,570 1,541 1,647 1,681 1,720 1,774 1,885 2,088 2,361 2,570 2,675Number of issues . . . . . . Number . 2,228 2,298 2,244 2,234 2,246 2,284 2,426 2,658 2,904 3,060 3,126Shares listed . . . . . . . . . Billion. . . 33.7 52.4 71.8 76.2 83.0 90.7 99.6 115.8 131.1 142.3 154.7Market value . . . . . . . . . Bil. dol . . 1,243 1,950 2,216 2,457 3,030 2,820 3,713 4,035 4,541 4,448 6,013Average price . . . . . . . . Dollars . . 36.87 37.20 30.87 32.26 36.51 31.08 37.27 34.83 34.65 31.26 38.86Cash dividends oncommon stock . . . . . . . Bil. dol . . 53.1 74.2 84.4 102.2 101.8 103.2 123.4 109.7 120.2 130.0 147.0
Source: New York Stock Exchange, Inc., New York, NY, Fact Book, annual (copyright).
No. 812. NASDAQ—Securities Listed and Volume of Trading: 1980 to 1995
ITEM Unit 1980 1985 1988 1989 1990 1991 1992 1993 1994 1995
Member firms . . . . . . . . . . Number . . . 2,932 6,307 6,432 6,141 5,827 5,386 5,254 5,296 5,426 5,451Branch offices. . . . . . . . . . Number . . . 7,555 15,375 22,714 29,998 24,457 29,158 33,484 44,181 57,105 58,119Companies listed. . . . . . . . Number . . . 2,894 4,136 4,451 4,293 4,132 4,094 4,113 4,611 4,902 5,112Issues . . . . . . . . . . . . . . . Number . . . 3,050 4,784 5,144 4,963 4,706 4,684 4,768 5,393 5,761 5,955Shares traded. . . . . . . . . . Million . . . . 6,692 20,699 31,070 33,530 33,380 41,311 48,455 66,541 74,353 101,158Average daily volume . . . Million . . . . 26.5 82.1 122.8 133.1 131.9 163.3 190.8 263.0 295.1 401.4
Value of shares traded . . . . Bil. dol. . . . 69 234 347 431 452 694 891 1,350 1,449 2,398
Source: National Association of Securities Dealers, Washington, DC, Fact Book, annual.
No. 813. Commodity Futures Trading on U.S. Exchanges—Volume of Trading:1980 to 1994
[In millions. For year ending Sept. 30 ]
COMMODITY 1980 1985 1986 1987 1988 1989 1990 1991 1992 1993 1994
Number of contracts traded . . 82.7 152.6 183.1 213.5 241.8 267.7 272.2 261.4 289.5 325.5 411.1Grain . . . . . . . . . . . . . . . . . . . . 18.3 10.7 10.3 10.9 15.9 15.9 17.0 16.6 17.6 16.0 20.0Oilseeds/products. . . . . . . . . . . . 15.7 14.9 13.8 14.2 22.5 21.1 20.4 19.8 18.6 20.7 21.0Livestock/products . . . . . . . . . . . 11.8 7.9 8.6 8.8 9.6 8.2 8.0 6.9 6.4 5.8 6.1Other agriculturals . . . . . . . . . . . 7.8 5.1 6.7 5.7 9.8 10.7 11.0 9.5 9.4 10.8 12.3Energy products. . . . . . . . . . . . . 1.1 7.0 11.5 20.3 26.3 31.3 35.2 31.8 38.4 42.8 50.5Metals . . . . . . . . . . . . . . . . . . . 14.1 18.4 16.2 19.4 18.9 17.9 17.8 13.9 12.2 15.2 18.2Financial instruments . . . . . . . . . 10.2 72.1 96.9 114.3 117.6 136.7 135.7 134.1 148.2 185.4 252.6Currencies . . . . . . . . . . . . . . . . 3.7 16.4 19.1 19.9 21.2 25.7 27.2 28.8 38.7 28.8 30.4
Source: U.S. Commodity Futures Trading Commission, Annual Report.
N.Y. Stock Exchange—NASDAQ—Commodity Futures Trading 525

No. 814. Securities Industry—Revenues and Expenses: 1980 to 1995
[In millions of dollars ]
TYPEALL SECURITIES FIRMS
MEMBERS OFNY STOCK
EXCHANGE 1
1980 1985 1989 1990 1991 1992 1993 1994 1994 1995,proj.
Revenues, total . . . . . . . . . . 19,829 49,844 76,864 71,356 84,890 90,584 108,843 112,815 71,355 96,303Commissions . . . . . . . . . . . . . . . 6,777 10,955 13,452 12,032 14,210 16,249 19,905 19,896 13,504 15,998Trading/investment gains . . . . . . . 5,091 14,549 16,247 15,746 22,641 21,838 25,427 20,217 13,338 18,902Underwriting profits . . . . . . . . . . . 1,571 4,987 4,537 3,728 6,593 8,300 11,249 6,848 5,856 7,799Margin interest . . . . . . . . . . . . . . 2,151 2,746 3,860 3,179 2,771 2,690 3,235 4,674 4,525 6,239Mutual fund sales . . . . . . . . . . . . 278 2,754 3,038 3,242 4,176 5,950 8,115 6,909 3,192 3,406Other . . . . . . . . . . . . . . . . . . . . 3,960 13,854 35,731 33,428 34,498 35,557 40,913 54,272 30,939 43,960
Expenses, total . . . . . . . . . . 16,668 43,342 74,041 70,566 76,234 81,467 95,805 109,287 70,227 88,899Interest expense . . . . . . . . . . . . . 3,876 11,470 29,822 28,093 27,512 24,576 26,616 40,255 23,731 38,175Compensation . . . . . . . . . . . . . . 7,619 18,112 23,740 22,931 26,916 32,071 39,125 37,604 27,340 30,309Commissions/clearance paid . . . . . 1,055 2,314 3,057 2,959 3,200 3,722 5,338 5,363 2,620 2,728Other . . . . . . . . . . . . . . . . . . . . 4,119 11,446 17,422 16,583 18,605 21,098 24,726 26,065 16,536 17,686
Net income, pretax . . . . . . . 3,160 6,502 2,823 790 8,656 9,117 13,039 3,528 1,128 7,4051 Covers all members of New York Stock Exchange doing public business. Source: Securities Industry Association, New York,
NY, Securities Industry Association Fact Book, annual.
Source: Except as noted, U.S. Securities and Exchange Commission, Annual Report.
No. 815. Assets of Private and Public Pension Funds, by Type of Fund: 1980 to 1994
[In billions of dollars . As of end of year . Except for corporate equities, represents book value. Excludes Social Security trustfunds and U.S. Government pension funds; see tables 581 and 585]
TYPE OF PENSION FUND 1980 1985 1988 1989 1990 1991 1992 1993 1994
Total, all types . . . . . . . . . . . 873 1,883 2,653 3,172 3,234 3,862 4,213 4,644 4,702
Private funds . . . . . . . . . . . . . . . . . . 676 1,485 2,044 2,405 2,413 2,921 3,154 3,492 3,480Insured . . . . . . . . . . . . . . . . . . . . 172 392 622 700 784 865 940 1,042 1,123Noninsured 1 2 . . . . . . . . . . . . . . . 504 1,093 1,422 1,706 1,629 2,056 2,214 2,450 2,356Small time and savings deposits. . 28 74 120 144 134 174 183 186 162Mutual fund shares . . . . . . . . . . 7 11 31 42 45 64 86 137 151Corporate equities . . . . . . . . . . . 223 464 609 735 658 889 962 1,079 1,047Credit market instruments 2 . . . . . 151 378 509 590 607 693 730 771 728U.S. government securities . . . 51 190 250 311 322 363 384 401 378Treasury . . . . . . . . . . . . . . 32 115 164 209 221 254 271 286 276Agency . . . . . . . . . . . . . . . 18 74 86 102 101 109 112 115 103
Corporate and foreign bonds . . 78 155 204 226 235 276 292 309 295
State and local pension funds 2 . . . . . 197 399 609 767 820 941 1,059 1,151 1,223Corporate equities. . . . . . . . . . . . . 44 120 220 300 296 387 449 507 520Credit market instruments 2 . . . . . . 147 257 353 399 434 480 514 543 586U.S. government securities . . . . . 40 124 182 198 225 235 238 251 273Treasury . . . . . . . . . . . . . . . . 21 83 124 125 142 151 155 171 187Agency. . . . . . . . . . . . . . . . . 19 41 58 73 82 84 83 79 86
Corporate and foreign bonds . . . . 92 107 135 167 169 195 223 238 258
1 Covers all pension funds of corporations, nonprofit organizations, unions, and multi-employer groups. Also includes deferredprofit-sharing plans and Federal Employees Retirement System (FERS) Thrift Savings Fund. Excludes health, welfare, and bonusplans. 2 Includes other types of assets not shown separately.
Source: Board of Governors of the Federal Reserve System, Flow of Funds Accounts, March 1995 quarterly diskettes. Dataare also published in the quarterly Z.1 release.
Banking, Finance, and Insurance526

No. 816. Individual Retirement Accounts (IRA) Plans—Value, by Type of Holder:1985 to 1995
[As of December 31 . Estimated]
TYPE OF HOLDERAMOUNT(bil. dol.)
PERCENTDISTRIBUTION
1985 1988 1989 1990 1991 1992 1993 1994 1995 1985 1990 1995
Total . . . . . . . . . . . . . 200 390 455 529 657 746 868 941 1,169 100 100 100Savings institutions . . . . . . . . 56 90 98 95 91 85 76 72 71 28 18 6Commercial banks . . . . . . . . 52 88 99 119 134 137 134 136 145 26 22 12Mutual funds . . . . . . . . . . . . 32 86 112 127 169 211 284 305 411 16 24 35Self directed. . . . . . . . . . . . . 29 68 82 117 181 225 271 318 415 15 22 36Life insurance companies . . . . 17 33 38 42 50 56 70 79 94 9 8 8Credit unions . . . . . . . . . . . . 14 25 26 29 32 32 32 32 33 7 6 3
Source: Investment Company Institute, Washington, DC, Mutual Fund Fact Book, annual (copyright).
No. 817. 401(k) Plan Assets—Summary, 1985 to 1995, and Projections, 2000
YEARTotalassets(bil. dol.)
TYPEOF
ASSET
Percentof
compa-nies
offeringinvest-mentoption,1995
ASSETS, 1995FINANCIALINSTITUTIONMANAGINGASSETS
ASSETS, 1995
Amount(bil. dol.)
Percentdistri-bution
Amount(bil. dol.)
Percentdistri-bution
1985 . . . . . 105 Total . . . . . . . . . . (X) 675 100 All defined contribution1987 . . . . . 190 Guaranteed investment plans 2 . . . . . . . . . . 1,225 1001988 . . . . . 230 account 1 . . . . . . . . 62 150 22 Insurance companies . . . 395 321989 . . . . . 270 Equity . . . . . . . . . . . 91 140 21 Banks . . . . . . . . . . . . . 355 291990 . . . . . 300 Money market . . . . . . 50 40 6 Mutual fund groups . . . . 305 251991 . . . . . 350 Balanced account . . . 48 95 14 Other . . . . . . . . . . . . . 170 141992 . . . . . 4101993 . . . . . 475 Bond fund . . . . . . . . 59 55 8 401(k) plans . . . . . . . 675 1001994 . . . . . 525 Company stock . . . . . 24 155 23 Insurance companies . . . 195 291995 . . . . . 675 Other. . . . . . . . . . . . 18 40 6 Banks . . . . . . . . . . . . . 160 24
Mutual fund groups . . . . 225 332000, proj. . 1,300 Other . . . . . . . . . . . . . 95 14
X Not applicable. 1 Covers bank certificate of deposits, guaranteed investment contracts (GIC’s), GIC alternatives, andinsurance company participating contracts. 2 Includes 401(k) plans.
Source: Access Research, Inc., Windsor, CT, 1995 Marketplace Update, 1995, (copyright).
No. 818. Mutual Funds—Summary: 1980 to 1995[Number of funds, accounts, and assets as of December 31 . A mutual fund is an open-end investment company that continuouslyissues and redeems shares that represent an interest in a pool of financial assets. See also Historical Statistics, Colonial Timesto 1970, series X 536-539]
TYPE OF FUND Unit 1980 1985 1989 1990 1991 1992 1993 1994 1995
Number of funds, total . . . . . . . Number . . 564 1,528 2,917 3,105 3,427 3,850 4,558 5,357 5,761Equity funds . . . . . . . . . . . . . . . . . Number . . 267 579 1,080 1,127 1,217 1,356 1,615 1,944 2,211Income and bond funds 1 . . . . . . . . Number . . 191 492 1,173 1,235 1,389 1,629 2,023 2,450 2,553Money market funds, tax-exempt 2 . . Number . . 10 111 201 235 267 279 292 319 325Money market funds, taxable 3 . . . . Number . . 96 346 463 508 554 586 628 644 672
Shareholder accounts, total . . . . Millions . . 12.1 34.7 58.2 62.6 68.6 80.3 95.5 114.8 131.8Equity funds . . . . . . . . . . . . . . . . . Millions . . 5.8 11.5 21.5 23.0 26.1 33.2 42.1 59.0 70.7Income and bond funds 1 . . . . . . . . Millions . . 1.5 8.3 15.4 16.6 18.9 23.4 29.7 30.5 30.9Money market funds, tax-exempt 2 . . Millions . . (NA) 0.5 1.1 1.4 1.7 1.9 2.0 2.0 2.3Money market funds, taxable 3 . . . . Millions . . 4.8 14.4 20.2 21.6 21.9 21.8 21.6 23.3 27.9
Assets, total . . . . . . . . . . . . . . Bil. dol . . 135 496 982 1,067 1,396 1,646 2,075 2,161 2,820Equity funds . . . . . . . . . . . . . . . . . Bil. dol . . . 44 117 249 246 412 523 749 866 1,269Income and bond funds 1 . . . . . . . . Bil. dol . . . 14 135 305 323 441 577 761 684 798Money market funds, tax-exempt 2 . . Bil. dol . . . 2 36 69 84 90 95 103 111 123Money market funds, taxable 3 . . . . Bil. dol . . . 74 208 359 415 453 451 462 500 630
Sales, total . . . . . . . . . . . . . . . Bil. dol . . 248 954 1,445 1,565 2,037 2,751 3,189 3,077 3,602Equity funds . . . . . . . . . . . . . . . . . Bil. dol . . . 6 30 55 71 99 145 229 271 307Income and bond funds 1 . . . . . . . . Bil. dol . . . 4 84 71 79 138 220 282 203 170Money market funds, tax-exempt 2 . . Bil. dol . . . 5 109 185 197 231 286 342 369 397Money market funds, taxable 3 . . . . Bil. dol . . . 232 730 1,135 1,219 1,570 2,100 2,336 2,234 2,728
Redemptions, total . . . . . . . . . . Bil. dol . . 217 865 1,327 1,471 1,879 2,548 2,905 2,929 3,315Equity funds . . . . . . . . . . . . . . . . . Bil. dol . . . 6 18 38 45 54 62 93 142 172Income and bond funds 1 . . . . . . . . Bil. dol . . . 3 15 53 53 62 103 139 188 141Money market funds, tax-exempt 2 . . Bil. dol . . . 4 99 181 190 227 282 337 370 386Money market funds, taxable 3 . . . . Bil. dol . . . 204 732 1,055 1,183 1,536 2,101 2,337 2,229 2,616
NA Not available. 1 Includes municipal bond funds. 2 Funds invest in municipal securities with relatively shortmaturities. 3 Funds invest in short-term, high-grade securities sold in the money market.
Source: Investment Company Institute, Washington, DC, Mutual Fund Fact Book, annual (copyright).
IRA Plans—401(k) Plan Assets—Mutual Funds 527

No. 819. Mutual Fund Shares—Holdings and Net Purchases, by Type of Investor:1980 to 1994
[In billions of dollars . Holdings as of Dec. 31. Minus sign (-) indicates net sales]
TYPE OFINVESTOR
HOLDINGS NET PURCHASES
1980 1990 1992 1993 1994 1980 1990 1992 1993 1994
Total . . . . . . . . . . . . . . . . . 61.8 602.1 1,042.1 1,429.3 1,463.0 3.5 65.3 211.9 317.0 128.3Households, nonprofitorganizations . . . . . . . . . . . . . . 45.6 451.9 733.9 972.5 968.5 2.1 37.7 146.5 187.0 76.6Nonfinancial corporate business. . . 1.5 8.2 15.6 22.4 20.3 0.3 -1.3 4.7 6.8 -1.3Commercial banking . . . . . . . . . . - 1.9 3.4 3.9 2.0 - -0.3 -0.4 0.5 -1.9Credit unions . . . . . . . . . . . . . . . - 1.4 4.1 4.2 - - 0.2 1.5 0.1 -4.2Life insurance companies . . . . . . . 1.1 30.7 70.7 105.6 128.0 0.1 12.6 18.7 34.8 26.1Private pension funds . . . . . . . . . 7.2 45.4 86.4 137.3 150.5 1.4 6.7 15.2 42.8 17.9Bank personal trusts . . . . . . . . . . 6.4 62.7 128.1 183.5 193.7 -0.3 9.7 25.8 44.9 15.1
- Represents or rounds to zero.
Source: Board of Governors of the Federal Reserve System, Flow of Funds Accounts, March 1995 quarterly diskettes. Dataare also published in the quarterly Z.1 release.
No. 820. Households Owning Mutual Funds, by Age of Head of Household and Income:1989 and 1992
[In percent. Income in thousands of constant 1992 dollars . Constant dollar figures are based on consumer price index datapublished by U.S. Bureau of Labor Statistics. Families include one-person units; for definition of family, see text, section 1. Basedon Survey of Consumer Finance; see source]
AGE AND ANNUAL INCOME
PERCENT OFHOUSEHOLDS
OWNING LONG-TERMMUTUTAL FUNDS 1
PERCENT OF HOUSEHOLDS’ TOTALFINANCIAL ASSETS HELD IN—
Long-termmutual funds 1
Short-term mutual fundsand bank deposits
1989 1992 1989 1992 1989 1992
Total . . . . . . . . . . . . . . . . . . . . . . . . . . . 11.8 15.5 9.8 13.2 36.7 30.7Less than 35 years old . . . . . . . . . . . . . . . . 6.1 8.4 3.6 5.2 37.5 41.335 to 44 years old. . . . . . . . . . . . . . . . . . . . 14.3 18.7 9.6 12.4 33.5 33.645 to 54 years old. . . . . . . . . . . . . . . . . . . . 14.6 18.0 10.8 14.0 33.0 23.055 to 64 years old. . . . . . . . . . . . . . . . . . . . 14.9 22.2 10.9 17.2 41.0 22.165 years old and over . . . . . . . . . . . . . . . . . 12.3 14.6 9.7 11.9 36.8 36.0
Less than $30,000 . . . . . . . . . . . . . . . . . . . 4.9 5.7 4.1 7.7 60.5 51.4$30,000 to $49,999 . . . . . . . . . . . . . . . . . . . 12.5 19.9 8.6 17.0 42.9 35.5$50,000 to $99,999 . . . . . . . . . . . . . . . . . . . 26.2 28.4 11.0 13.1 36.9 30.2$100,000 to $199,999 . . . . . . . . . . . . . . . . . 42.6 41.8 12.2 14.2 33.2 23.0$200,00 or more. . . . . . . . . . . . . . . . . . . . . 51.7 55.5 11.8 14.4 19.2 18.7
1 Excludes all money market mutual funds except those in retirement accounts.
Source: Board of Governors of the Federal Reserve System, Federal Reserve Bulletin, November 1993.
No. 821. Health Insurance—Premium Income and Benefit Payments of InsuranceCompanies: 1980 to 1993
[In billions of dollars . Includes Puerto Rico and other U.S. outlying areas. Represents premium income of and benefits paid byinsurance companies only. Excludes Blue Cross-Blue Shield plans, medical-society sponsored plans, and all other independentplans]
ITEM 1980 1983 1984 1985 1986 1987 1988 1989 1990 1991 1992 1993
Premiums 1 . . . . . . . . . 43.7 63.2 70.4 75.2 75.5 84.1 98.2 108.0 112.9 116.4 125.0 124.7Group policies 2 . . . . . . . . . . 36.8 54.9 60.8 64.4 65.9 74.0 87.6 96.1 100.2 103.0 110.4 110.2Individual and family policies . . 6.9 8.3 9.6 10.8 9.6 10.1 10.6 11.8 12.7 13.3 14.6 14.5
Benefit payments . . . . . 37.0 51.7 56.0 60.0 64.3 72.5 83.0 89.4 92.5 97.6 104.8 103.4Group policies 2 . . . . . . . . . . 33.0 46.9 50.3 53.7 58.9 66.5 76.4 82.2 84.4 88.8 95.2 94.1Individual and family policies . . 4.0 4.8 5.7 6.3 5.4 5.9 6.6 7.2 8.2 8.8 9.6 9.3
Type of coverage:Loss of income . . . . . . . . . 5.3 4.9 5.2 5.6 5.6 6.4 6.4 7.2 7.4 7.5 8.3 8.1Medical expense . . . . . . . . 27.9 41.5 44.1 47.2 50.9 57.4 66.4 72.0 73.8 77.9 82.9 81.4Dental . . . . . . . . . . . . . . . 2.8 4.4 4.9 5.3 5.3 5.9 6.3 6.5 6.4 6.4 7.1 7.0Medicare supplement . . . . . 1.0 1.0 1.8 1.9 2.5 2.8 3.8 3.7 5.0 5.8 6.4 6.9
1 Earned premiums. 2 Insurance company group premiums and benefit payments include administrative serviceagreements and minimum premium plans.
Source: Health Insurance Association of America, Washington, DC, Source Book of Health Insurance Data, annual.
Banking, Finance, and Insurance528

No. 822. Property and Casualty Insurance—Summary: 1987 to 1994
[In billions of dollars . Minus sign (-) indicates loss]
ITEM 1987 1988 1989 1990 1991 1992 1993 1994
Premiums, net written . . . . . . . . . . . . . 193.2 202.0 208.4 217.8 223.0 227.8 241.7 250.7Automobile, private 1 . . . . . . . . . . . . 64.3 69.5 73.6 78.4 82.8 88.4 93.4 96.8Automobile, commercial 1 . . . . . . . . . 16.9 16.9 17.3 17.0 16.6 16.1 16.3 16.7Liability other than auto. . . . . . . . . . . 24.9 23.1 22.7 22.1 20.9 21.1 22.1 23.6Fire and allied lines . . . . . . . . . . . . . 7.7 6.9 7.0 7.1 7.2 7.1 7.9 8.7Homeowners’ multiple peril . . . . . . . . 16.7 17.1 17.7 18.6 19.3 20.5 21.5 22.6Commercial multiple peril . . . . . . . . . 17.2 17.7 17.5 17.7 17.0 16.4 17.3 17.8Workers’ compensation . . . . . . . . . . . 23.4 26.1 28.5 31.0 31.3 29.7 30.3 28.9Marine, inland and ocean . . . . . . . . . 5.5 5.5 5.6 5.7 5.5 5.5 6.1 6.7Accident and health . . . . . . . . . . . . . 3.8 4.7 4.6 5.0 5.1 5.4 6.8 7.2Other lines . . . . . . . . . . . . . . . . . . . 12.8 14.5 14.2 15.2 17.4 17.6 20.0 21.7
Losses and expenses . . . . . . . . . . . . . 196.4 208.6 223.6 234.7 239.3 259.6 250.7 263.4Underwriting gain/loss . . . . . . . . . . . . . -9.6 -11.2 -19.2 -20.9 -19.4 -33.3 -15.1 -19.0Net investment income. . . . . . . . . . . . . 24.0 27.7 31.2 32.9 34.2 33.7 32.6 33.7Operating earnings after taxes. . . . . . . . 11.0 12.9 9.0 9.0 10.4 5.8 19.3 10.9Assets. . . . . . . . . . . . . . . . . . . . . . . . 426.7 476.9 527.0 556.3 601.4 637.3 671.5 704.6Policyholders’ surplus. . . . . . . . . . . . . . 104.0 118.2 134.0 138.4 158.7 163.1 182.3 193.3
1 Includes premiums for automobile liability and physical damage.
Source: Insurance Information Institute, New York, NY, The Fact Book, Property/Casualty Insurance Facts, annual (copyright).
No. 823. Automobile Insurance—Average Expenditures Per Insured Vehicle, by State:1991 to 1993
[In dollars . The average expenditures for automobile insurance in a State are affected by a number of factors, including theunderlying rate structure, the coverages purchased, the deductibles and limits selected, the types of vehicles insured, and thedistribution of driver characteristics]
STATE 1991 1992 1993
U.S. . . . . 597 616 638
AL . . . . . . . 475 498 513AK . . . . . . . 643 685 712AZ . . . . . . . 647 667 700AR . . . . . . . 398 424 445CA . . . . . . . 783 766 803CO . . . . . . . 588 653 698CT . . . . . . . 841 878 925DE . . . . . . . 718 745 738DC . . . . . . . 863 880 879FL . . . . . . . 669 684 698GA . . . . . . . 546 514 536HI. . . . . . . . 874 974 953ID. . . . . . . . 386 402 429IL . . . . . . . . 552 534 572IN. . . . . . . . 474 497 494IA. . . . . . . . 359 379 397
STATE 1991 1992 1993
KS . . . . . . . 368 392 422KY . . . . . . . 435 473 506LA . . . . . . . 679 724 752ME . . . . . . . 484 468 477MD . . . . . . . 689 702 707MA . . . . . . . 814 860 909MI . . . . . . . 606 662 677MN . . . . . . . 530 566 595MS . . . . . . . 482 519 541MO. . . . . . . 469 493 517MT . . . . . . . 370 393 432NE . . . . . . . 346 352 403NV . . . . . . . 640 673 726NH . . . . . . . 646 638 649NJ . . . . . . . 879 957 961NM . . . . . . . 517 543 589NY . . . . . . . 754 799 832NC . . . . . . . 432 448 440
STATE 1991 1992 1993
ND . . . . . . . 329 319 349OH . . . . . . . 494 503 493OK . . . . . . . 422 448 470OR . . . . . . . 529 535 564PA . . . . . . . 610 642 645RI. . . . . . . . 823 837 871SC . . . . . . . 502 534 569SD . . . . . . . 309 333 364TN . . . . . . . 466 478 488TX . . . . . . . 612 646 666UT . . . . . . . 436 463 515VT . . . . . . . 474 484 501VA . . . . . . . 506 503 508WA . . . . . . . 549 588 641WV. . . . . . . 519 557 581WI . . . . . . . 463 492 503WY. . . . . . . 330 366 401
Source: National Association of Insurance Commissioners, Kansas City, MO, State Average Expenditures and Premiums forPersonal Automobile Insurance, annual (copyright).
No. 824. Life Insurance in Force in the United States—Summary: 1980 to 1994
[As of December 31 or calendar year, as applicable. Covers life insurance with life insurance companies only. Represents all lifeinsurance in force on lives of U.S. residents whether issued by U.S. or foreign companies. For definition of household, see text,section 1. See also Historical Statistics, Colonial Times to 1970, series X 879-889]
YEAR
LIFE INSURANCE IN FORCE AVERAGE SIZE POLICY INFORCE (dollars)
AVERAGEAMOUNT($1,000)
Dispos-ableper-sonalincomeper
house-hold
($1,000)
Numberof poli-cies,total(mil.)
Value (bil. dol.)Ordi-nary Group Indus-
trialCred-it 1
Perhouse-hold
Perin-
suredhouse-hold
Total Ordi-nary Group Indus-
trialCred-it 1
1980 . . . . . 402 3,541 1,761 1,579 36 165 11,920 13,410 620 2,110 41.9 51.1 24.21985 . . . . . 386 6,053 3,247 2,562 28 216 22,780 19,720 640 3,100 66.6 82.2 33.91988 . . . . . 391 8,020 4,512 3,232 25 251 31,390 23,410 660 3,570 84.5 105.6 38.81989 . . . . . 394 8,694 4,940 3,470 24 260 34,410 24,510 670 3,600 89.9 112.4 40.81990 . . . . . 389 9,393 5,367 3,754 24 248 37,910 26,630 670 3,500 98.4 124.5 44.11991 . . . . . 375 9,986 5,678 4,058 22 228 41,450 28,760 680 3,580 102.7 130.0 44.91992 . . . . . 366 10,406 5,942 4,241 21 202 42,960 29,930 700 3,610 106.6 136.6 47.11993 . . . . . 363 11,105 6,428 4,456 21 200 45,770 31,430 700 3,850 111.6 143.1 48.61994 . . . . . 371 11,674 6,835 4,609 20 210 48,950 32,690 700 3,530 118.7 152.2 51.7
1 Insures borrower to cover consumer loan in case of death.
Source: American Council of Life Insurance, Washington, DC, Life Insurance Fact Book, biennial.
Property Insurance—Auto Insurance—Life Insurance 529
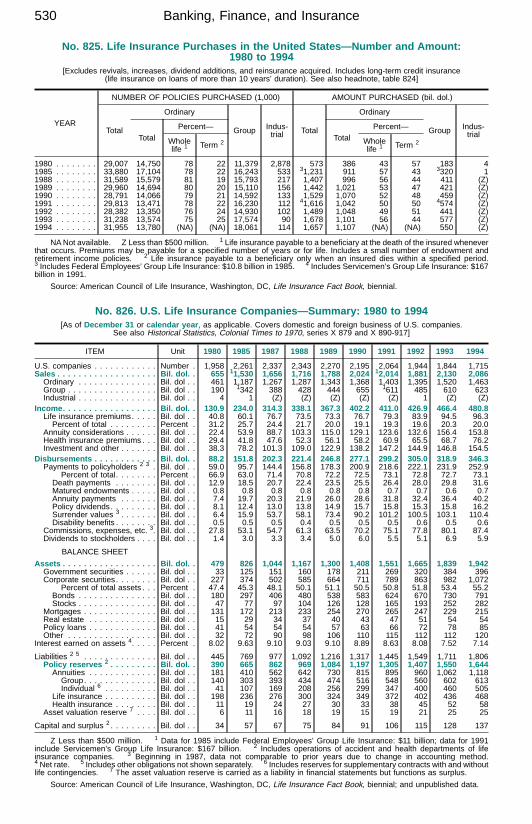
No. 825. Life Insurance Purchases in the United States—Number and Amount:1980 to 1994
[Excludes revivals, increases, dividend additions, and reinsurance acquired. Includes long-term credit insurance(life insurance on loans of more than 10 years’ duration). See also headnote, table 824]
YEAR
NUMBER OF POLICIES PURCHASED (1,000) AMOUNT PURCHASED (bil. dol.)
Total
Ordinary
Group Indus-trial Total
Ordinary
Group Indus-trialTotal
Percent—Total
Percent—
Wholelife 1 Term 2 Whole
life 1 Term 2
1980 . . . . . . . . 29,007 14,750 78 22 11,379 2,878 573 386 43 57 183 41985 . . . . . . . . 33,880 17,104 78 22 16,243 533 31,231 911 57 43 3320 11988 . . . . . . . . 31,589 15,579 81 19 15,793 217 1,407 996 56 44 411 (Z)1989 . . . . . . . . 29,960 14,694 80 20 15,110 156 1,442 1,021 53 47 421 (Z)1990 . . . . . . . . 28,791 14,066 79 21 14,592 133 1,529 1,070 52 48 459 (Z)1991 . . . . . . . . 29,813 13,471 78 22 16,230 112 41,616 1,042 50 50 4574 (Z)1992 . . . . . . . . 28,382 13,350 76 24 14,930 102 1,489 1,048 49 51 441 (Z)1993 . . . . . . . . 31,238 13,574 75 25 17,574 90 1,678 1,101 56 44 577 (Z)1994 . . . . . . . . 31,955 13,780 (NA) (NA) 18,061 114 1,657 1,107 (NA) (NA) 550 (Z)
NANot available. Z Less than $500 million. 1 Life insurance payable to a beneficiary at the death of the insured wheneverthat occurs. Premiums may be payable for a specified number of years or for life. Includes a small number of endowment andretirement income policies. 2 Life insurance payable to a beneficiary only when an insured dies within a specified period.3 Includes Federal Employees’ Group Life Insurance: $10.8 billion in 1985. 4 Includes Servicemen’s Group Life Insurance: $167billion in 1991.
Source: American Council of Life Insurance, Washington, DC, Life Insurance Fact Book, biennial.
No. 826. U.S. Life Insurance Companies—Summary: 1980 to 1994[As of December 31 or calendar year , as applicable. Covers domestic and foreign business of U.S. companies.
See also Historical Statistics, Colonial Times to 1970, series X 879 and X 890-917]
ITEM Unit 1980 1985 1987 1988 1989 1990 1991 1992 1993 1994
U.S. companies . . . . . . . . . . . . Number . 1,958 2,261 2,337 2,343 2,270 2,195 2,064 1,944 1,844 1,715Sales . . . . . . . . . . . . . . . . . . . Bil. dol. . 655 11,530 1,656 1,716 1,788 2,024 12,014 1,881 2,130 2,086Ordinary . . . . . . . . . . . . . . . Bil. dol . . 461 1,187 1,267 1,287 1,343 1,368 1,403 1,395 1,520 1,463Group . . . . . . . . . . . . . . . . . Bil. dol . . 190 1342 388 428 444 655 1611 485 610 623Industrial . . . . . . . . . . . . . . . Bil. dol . . 4 1 (Z) (Z) (Z) (Z) (Z) 1 (Z) (Z)
Income . . . . . . . . . . . . . . . . . . Bil. dol. . 130.9 234.0 314.3 338.1 367.3 402.2 411.0 426.9 466.4 480.8Life insurance premiums. . . . . Bil. dol . . 40.8 60.1 76.7 73.5 73.3 76.7 79.3 83.9 94.5 96.3Percent of total . . . . . . . . . Percent . 31.2 25.7 24.4 21.7 20.0 19.1 19.3 19.6 20.3 20.0
Annuity considerations . . . . . . Bil. dol . . 22.4 53.9 88.7 103.3 115.0 129.1 123.6 132.6 156.4 153.8Health insurance premiums . . . Bil. dol . . 29.4 41.8 47.6 52.3 56.1 58.2 60.9 65.5 68.7 76.2Investment and other . . . . . . . Bil. dol . . 38.3 78.2 101.3 109.0 122.9 138.2 147.2 144.9 146.8 154.5
Disbursements . . . . . . . . . . . . Bil. dol. . 88.2 151.8 202.3 221.4 246.8 277.1 299.2 305.0 318.9 346.3Payments to policyholders 2 3 . Bil. dol . . 59.0 95.7 144.4 156.8 178.3 200.9 218.6 222.1 231.9 252.9
Percent of total. . . . . . . . Percent . 66.9 63.0 71.4 70.8 72.2 72.5 73.1 72.8 72.7 73.1Death payments . . . . . . . . Bil. dol . . 12.9 18.5 20.7 22.4 23.5 25.5 26.4 28.0 29.8 31.6Matured endowments . . . . . Bil. dol . . 0.8 0.8 0.8 0.8 0.8 0.8 0.7 0.7 0.6 0.7Annuity payments . . . . . . . Bil. dol . . 7.4 19.7 20.3 21.9 26.0 28.6 31.8 32.4 36.4 40.2Policy dividends. . . . . . . . . Bil. dol . . 8.1 12.4 13.0 13.8 14.9 15.7 15.8 15.3 15.8 16.2Surrender values 3 . . . . . . . Bil. dol . . 6.4 15.9 53.7 58.1 73.4 90.2 101.2 100.5 103.1 110.4Disability benefits . . . . . . . . Bil. dol . . 0.5 0.5 0.5 0.4 0.5 0.5 0.5 0.6 0.5 0.6
Commissions, expenses, etc. 3. Bil. dol . . 27.8 53.1 54.7 61.3 63.5 70.2 75.1 77.8 80.1 87.4Dividends to stockholders . . . . Bil. dol . . 1.4 3.0 3.3 3.4 5.0 6.0 5.5 5.1 6.9 5.9
BALANCE SHEET
Assets . . . . . . . . . . . . . . . . . . Bil. dol. . 479 826 1,044 1,167 1,300 1,408 1,551 1,665 1,839 1,942Government securities . . . . . . Bil. dol . . 33 125 151 160 178 211 269 320 384 396Corporate securities. . . . . . . . Bil. dol . . 227 374 502 585 664 711 789 863 982 1,072
Percent of total assets . . . Percent . 47.4 45.3 48.1 50.1 51.1 50.5 50.8 51.8 53.4 55.2Bonds . . . . . . . . . . . . . . . Bil. dol . . 180 297 406 480 538 583 624 670 730 791Stocks . . . . . . . . . . . . . . . Bil. dol . . 47 77 97 104 126 128 165 193 252 282
Mortgages . . . . . . . . . . . . . . Bil. dol . . 131 172 213 233 254 270 265 247 229 215Real estate . . . . . . . . . . . . . Bil. dol . . 15 29 34 37 40 43 47 51 54 54Policy loans . . . . . . . . . . . . . Bil. dol . . 41 54 54 54 57 63 66 72 78 85Other . . . . . . . . . . . . . . . . . Bil. dol . . 32 72 90 98 106 110 115 112 112 120
Interest earned on assets 4. . . . . Percent . 8.02 9.63 9.10 9.03 9.10 8.89 8.63 8.08 7.52 7.14
Liabilities 2 5 . . . . . . . . . . . . . . Bil. dol . . 445 769 977 1,092 1,216 1,317 1,445 1,549 1,711 1,806Policy reserves 2 . . . . . . . . . Bil. dol. . 390 665 862 969 1,084 1,197 1,305 1,407 1,550 1,644Annuities . . . . . . . . . . . . . Bil. dol . . 181 410 562 642 730 815 895 960 1,062 1,118Group. . . . . . . . . . . . . . Bil. dol . . 140 303 393 434 474 516 548 560 602 613Individual 6 . . . . . . . . . . Bil. dol . . 41 107 169 208 256 299 347 400 460 505
Life insurance . . . . . . . . . . Bil. dol . . 198 236 276 300 324 349 372 402 436 468Health insurance . . . . . . . . Bil. dol . . 11 19 24 27 30 33 38 45 52 58
Asset valuation reserve 7 . . . . Bil. dol . . 6 11 16 18 19 15 19 21 25 25
Capital and surplus 2 . . . . . . . . . Bil. dol . . 34 57 67 75 84 91 106 115 128 137
Z Less than $500 million. 1 Data for 1985 include Federal Employees’ Group Life Insurance: $11 billion; data for 1991include Servicemen’s Group Life Insurance: $167 billion. 2 Includes operations of accident and health departments of lifeinsurance companies. 3 Beginning in 1987, data not comparable to prior years due to change in accounting method.4 Net rate. 5 Includes other obligations not shown separately. 6 Includes reserves for supplementary contracts with and withoutlife contingencies. 7 The asset valuation reserve is carried as a liability in financial statements but functions as surplus.
Source: American Council of Life Insurance, Washington, DC, Life Insurance Fact Book, biennial; and unpublished data.
Banking, Finance, and Insurance530